1
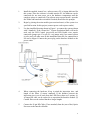
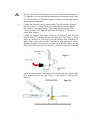
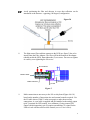
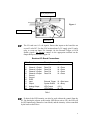
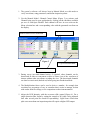
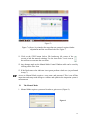
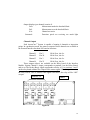
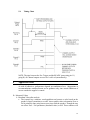
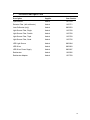
EQUIPMENT Operation Manual Monitoring System Table of Contents 1 Please Observe the Following 1.1 Emphasized Sections 1.2 For Your Safety 1.3 Unpacking and Inspection 1.4 Items Supplied 1.5 Features 1.6 Usage 3 3 3 3 4 4 4 2 Description 4 3 Technical Data 5 4 Installation 5 5 Operation 9 5.1 Manual Mode 5.2 Production Mode 5.3 Menu Functions 5.4 Timing Chart 13 14 16 19 6 Application Hints 19 7 Troubleshooting 22 8 Care and Maintenance 23 9 Accessories and Spare Parts 24 10 Warranty 26 2 1 Please Observe The Following 1.1 Emphasized Sections Warning! Refers to safety regulations and requires safety measures that protect the operator or other persons from injury or danger to life. Caution! Emphasizes what must be done or avoided so that the unit or other property is not damaged. Notice: Gives recommendations for better handling of the unit during operation or adjustment as well as for service activities. 1.2 For Your Safety For safe and successful operation of the unit, read these instructions completely. If the instructions are not observed, the manufacturer can assume no responsibility. Wear proper (UV) eye protection whenever working with the Light Source System and its components. Be aware that exposure to UV light can cause burns and damage to skin. Do not expose the connecting cable to heat, oil, or sharp edges. Make sure the unit stands stable and secure. Use only original equipment replacement parts. Always disconnect the power supply before servicing the unit. Observe general safety regulations for the handling of chemicals such as Loctite® adhesives and sealants. Observe the manufacturer’s instructions as stated in the Material Safety Data Sheet (MSDS). While under warranty, the unit may be repaired only by an authorized Loctite service representative. 1.3 Unpacking and Inspection Carefully unpack the Loctite® AssureCureTM System and examine the items contained in the carton. Inspect the unit for any damage that might have occurred in transit. If such damage has occurred, notify the carrier immediately. Claims for damage must be made by the consignee to the carrier and should be reported to the manufacturer. 3 1.4 Items supplied (1) Optics Processor; item 1470726 (X) Optic Module; item 1471134 (1) Interface Module; item 1470727 (contains 7 items below) (1) I/O Breakout Board (1) Output Relay Board, 5 channel (1) I/O HD db 26 Cable (5 foot, 26 pin) (1) LED Driver (1) LED with lens tube (1) Light source fiber adapter (1) LED Driver Power Supply (1) Coax Cable (for LED control) (X) Emitter Light Guide (X) Detector Fiber with Collimator; item 1470771 (1) AssureCureTM Software Disc (1) USB Cable (1) Power Cable X; number would depend on actual order (number of inspection points) 1.5 Features Scan times to 4 ms Adjustable Light Source Output Auto storage of measurements (production mode) Capable of multiple channel operation 1.6 Usage On all applicable AssureCureTM Henkel products 2 Description The Loctite® AssureCureTM Monitoring System is designed to detect, measure, analyze, record and provide a degree of cure metric relative to the transition of a specially formulated adhesive from a liquid to a solid (cured). The AssureCureTM system is comprised of the following components: A light source (system includes LED and fiber); illuminates the material under inspection to enhance the system’s detection and overall analysis. A detector fiber; is utilized to direct the inspection point’s observation into the optic instrument, this device is fitted with a focusing lens collimator. 4 An optic module; receives the measurement information from the detector fiber, and analyzes the inspection point optically. An optics processor; accepts multiple optic modules and handles all communications with an external PC. An External Interface module; allows signals between customer control system and the AssureCureTM system for proper cycling, inspection, and outcome of inspection. This system can be used as a stand alone manual inspection station or in a production environment inspecting parts at a rate of 400 per minute (4 channel system). Cycle rate is dependant on ambient lighting, light source and detector fiber positioning effects. Cycle rates can vary substantially from one application to the next. The AssureCureTM system can be stackable to permit the operation of up to 8 inspection points. 3 Technical Data Optic Processor Dimensions (W x D x H): Total weight: Connection cable with main plug: Operating voltage: Interface Module Dimensions (W x D x H): 4 approx. 9.2”x 12.4”x 5.2” (approx. 235 x 315 x 133 mm) approx. 5.2 lbs. (2.36Kg) 10 ft (3 m) long 110-240 VAC 50/60Hz Total weight: Operating voltage: approx. 8.7”x 5.75”x 4.4” (approx. 221 x 146 x 111mm) approx. 2.5 lbs. (1.15Kg) 110-240 VAC 50/60 Hz Operating temperature: ambient Installation Before using the instrument for the first time check it carefully for signs of external damage. If any shipping damage is found DO NOT USE THE INSTRUMENT return it to your supplier immediately. Do not apply power to the Optic Processor until the AssureCureTM software is installed into the PC 5 1. Install the supplied AssureCureTM software onto a PC or laptop dedicated for this system. Once the software is loaded onto the PC, the hardware can be connected (do not turn power on to the hardware components until the complete system is connected). The software may not auto install— open the disc folder and launch the executable if needed; then follow the prompts. 2. Begin by placing the main module (processor/enclosure) of the system in a specified location for this project (connect power cord to power outlet). 3. Use the simplified drawing shown in Figure 1 to connect the system (shown with 2 channels). If the AssureCureTM System Production Mode will not be used, only the LED Control (pre-wired) and LED Enable wires require connection (jumper pin 15 to pin 24— use jumper only if no control system is to be used), all other areas in this installation that calls for connections to I/O can be skipped. Connect the power plug on the Interface Module to the power outlet. Figure 1 4. When connecting the hardware, Keep in mind the inspection sites, and length of the fibers (2 meters standard). If the distance between the inspection sites is out of reach from the LED fibers, there are 2 options: (1) A longer HD cable can be ordered in to reposition the Interface module (2) Custom fibers can be ordered that have longer lengths. 5. Connect the 26 pin HD Cable (5 foot standard) from the (rear of the) Optics Processor to the Interface Module. 6 Do Not Turn ON the LED System at this point. The LED emits dangerous UV light that can cause skin damage and damage or permanent injury to the eyes. Wear proper eye protection whenever working with the Light Source System and its components. 6. Connect one Detector Fiber per optic module. The end with the collimator lens (see Figure 1) is directed at the PUT (Part-Under-Test); the opposite end connects to the Optic Module. The spacing between the end of the collimator and the PUT should be about one inch (Figure 2). The fiber is aimed at the adhesive. 7. Connect an Emitter Light Source Fiber one per inspection site— one end pointed at the PUT, the other into the LED light source (see Figure 1). These fibers are optimum at a 90 degree from the detector fiber (regardless of plane). This reduces the amount of (unwanted) light entering the Optics Module. Any angle or orientation is possible except having the detector and light source fibers looking into each other; just bear in mind that resolution Figure 2 will be less than optimum. The distance between the end of the fiber and the PUT should be about one inch (Figure 2). The detector is aimed at the adhesive. Figure 2a 7 Avoid positioning the fiber and detector in ways that reflection can be introduced to the detector— opposing (180 degree) configuration. Figure 2b 8. The light source fiber end that connects to the LED (see figure 3) has to be inserted into the Fiber Adapter. The fiber will hit the bottom of the adapter (should not hit the LED), then tighten the (2) set screws. Do not over tighten or crush by over-tightening the set screws. SET SCREWS INSERT FIBER FIBER ADAPTER LED BODY FILTER Figure 3 9. Make connections as necessary to the I/O or relay board (figure 4 & 10) based on the number of inspection sites and external controls required. Use the I/O table shown (Table 1 in the next page) to make the necessary connections. A coax cable is supplied and pre-installed to the analog output (pin17) terminal for LED control. As a minimum, if using remote LED control (default operation), pin 24 requires an enabling (5v) signal for the LED to work with the software slide control (section 5.2 LED Control). 8 Relay Output Board Figure 4 I/O Breakout Board LED Driver The I/O card uses 0-5 volt signals. Ensure that inputs to the board do not exceed 5 volts DC. Use the (I/O) breakout board’s 5V supply (pin 15) and a relay to create an Input. For example, for the External Trigger or LED Enable signals. For outputs, connect to the appropriate terminal on the Output Relays as shown in Figure 10. Breakout I/O Board Connections PIN Function 2 20 3 21 1 8 15 6 11 17 24 Channel 1 Output Channel 2 Output Channel 3 Output Channel 4 Output Ground Ground 5VDC Input Output Analog Output Input Description State Pass-Fail Pass-Fail Pass-Fail Pass-Fail Hi = Pass Hi = Pass Hi = Pass Hi = Pass External Trigger System Status LED Control LED Enable Hi = Start scan Hi = Busy 0-5 V Hi = On Table 1 If desired, the LED intensity can also be used without the control from the PC. By placing the selector switch on the LED Driver unit to CW, the LED will be ON continuously (Manual or Auto Mode) and the intensity is then controlled by the knob on the Driver. 9 Keep in mind that in Manual Mode the LED stays on continuously. 10. 11. 12. Connect the USB cable from the rear of the Optics Processor to the system PC (not shown in Figure 1). Turn power on to the Optics Processor unit, using the rear power switch. 11a. The computer will attempt to load driver(s) for the Optic Module(s). 11b. If your system has more than one Module, it will need to load a driver for each. In some cases the Optical Processor may have to be turned off and turned on so that the computer can detect new hardware more than once. 11c. If an optic module is not recognized or activated (in a multiple instrument system), close out the AssureCure software program. Go to the Device Manager on your computer. Find the USB devices and delete the spectrometer that is already loaded. Unplug the USB cable and plug it again; follow the mapping wizard so that the optic modules load properly (one at a time). Launch the AssureCureTM software from the PC. The optic modules should be recognized as the software is loading and then activated. If the Optic Modules are off, the USB cable is not connected, or the optic Module is not functioning, the program will end. The LED emits dangerous UV light that can cause skin damage and damage or permanent injury to the eyes. Wear proper eye protection whenever working with the Light Source System and its components. 13. 14. 15. 5 Remove the External Interface Module’s top cover. On the LED Driver, switch the selector switch to MOD (if not already selected). Turn the knob on the LED driver to ON. The AssureCureTM System is ready for operation. Operation Access to Manual Mode requires a user name and password. The default username is svr, password is 123. To edit or add to the table, go into the AssureCureTM program folder, then to the ‘login’folder, and edit the text file found there. The Manual Mode is an off-line inspection and setup mode designed to validate and optimize the inspection system’s measurement and processing. 10 1. The system’s software will always boot in Manual Mode; use this mode to verify waveforms, setup parameters, and define inspection points. 2. Use the Manual Mode’s Channel Control Menu (Figure 5) to activate each Channel being used in your application by clicking on the checkbox available per row of each Optic Module. Each channel will have its own color on the Menu selection box and a corresponding color with the generated waveform on the display. Channel names can be customized Dark Save Status Upper and Lower limits Figure 5 To go to Production Mode To save values in table 3. During set-up (on multi-channel units), if required, other channels can be deactivated in order to concentrate or have a better view of the waveform of interest without other waveforms crowding the view. The deactivated channels can later be reactivated (checked on) before going into Production Mode. 4. The Multiplication factor can be used to derive a number, for example that correlates to a percentage of cure; or a number that is easier to manage, be that with results from file storage, or for comparison to other instrumentation. 5. Adjust the LED Intensity with the on-screen slide control (Figure 6). For a single detection fiber, begin by setting the control to 20% (this can be adjusted later after several parts are tested for repeatability). Light Source Fibers that split out to more than one inspection point will require a higher LED output. 11 Try to keep the LED control level low to prolong the life of the LED device. Substrate color will affect the level of intensity required. Lighter shades will require less output power from the LED; whereas darker shades will require higher intensities. A Radiometer (Loctite 1265282 and adapter 1527709) may be obtained to make measurements of the LED output intensity and use these values for future reference or other quality checks. Figure 6 6. Adjust the position (and distance) of the detector and light source fiber based on waveform obtained per inspection site. Keep in mind, that the location and position of these fibers can be very different from one inspection site to the next. To view the effectiveness of the position of the fibers, click on the Start button (top left corner of screen) to see the waveform display. To zoom in on the waveform click on the Auto-scale Y axis in the main tool bar. To return to full scale window click on the graphic reset icon. 7. Perform a “Dark”save (make sure the system is stopped and not scanning) by pressing the black square button next to the Start button (top left corner on the screen). The status of the Dark save changes to a purple color. Click the Start button to run a few scans and then press the Stop button. The Dark offset will be stored and the status circle changes to Green (color) on the Channel Control Menu. The Dark save is used to account for the ambient light at the inspection site and remove from the analysis. 8. Once all inspection sites detector and light source fibers have been optimized in lighting and with position, the Pass/Fail Threshold values (for both lower and upper limits) can be entered— press the disc Icon to save these parameters. The Threshold values will pass all (scanned) parts that are within this reference number, and reject all parts that are outside the values. The value of interest is the lower number; the upper threshold will typically not be greater than 1 from the value of the lower number. When the Save Parameters disc icon is pressed, the system also makes reference of the peak counts of any active channel. If the amplitude of a sample (scanned) part’s waveform drops by more than 50% from the reference peak value 12 initially obtained, the part (scanned) will be rejected (shown in black color in the Manual Mode Channel Control Menu). This feature is used to detect over-cured parts. To de-activate this function go to the drop-down Menu, Setup-Options and click off on the >50% intensity option. The waveform in Figure 7 is an illustration of a typical waveform that should be displayed (Y axis counts should be about 8,000 as a guide (only) for setup). When detector and LED light source are properly pointed at the bond line, the waveform should like very similar to the reference in Figure 7. If your waveform has a very steep (sharp) look, like a spear head, or is a flat (near a straight line) or approaching a straight line — continue adjusting your fiber’s position (both detector and light source), scan (integration) time, and the LED intensity (if necessary). Figure 7 9. Perform manual scans by clicking on the START button on the top left corner on the screen. The manual scan will provide continuous scanning on all active channels and provide a live perspective of the values and waveforms. 10. Optimize lower and upper threshold values (pass/fail) from observation performed in previous step. The threshold values will be used to accept all parts that are within the values— all others will be rejected. In most cases, the values between lower and upper do not exceed 1. 13 Status Indicator Colors on Pass/Fail column: Green Pass (ratio, and counts tests) Red Fail Lower Threshold value Purple Fail Upper Threshold value Black Fail Intensity below 50% of original value Figure 7a Figure 7a (above) is typical of over-cured part Figure 7b Figure 7b (above) is not located on correct (adhesive) target 14 Figure 7c Figure 7c (above) is pointed at the target but not centered; requires further adjustment until the waveform looks like Figure 7. 11. Click on the STOP button (below File header-top left corner of the screen) to halt the manual scanning. Use the Auto-Scale Y axis icon on the tool bar to zoom into the waveform. 12. Any changes made on the Manual Mode Control Window table can be saved by clicking on the Disc Icon. 13. If the Dark status color indicator is not green perform a dark save (as performed in step 7). Access to Manual Mode requires a user name and password. This is an off-line inspection and setup mode design to validate and optimize the inspection system’s measurement. 5.1 The Manual Mode 1. Manual Mode requires a password in order to gain access (Figure 8). Figure 8 15 2. This mode of operation is for validation and monitoring and for setup and operation of the system before going into a production cycle. 3. Dark Save; this procedure should be done at least once a day before the start of a production shift, when lighting changes around an inspection site, or whenever the integration time is changed. This procedure accounts (and subtracts) for the ambient light that is present when the Light Source is turned off. Whenever Integration time is changed, a Dark save should be performed to account for the time offset. Red indicates that no dark spectrum has saved, or that the integration time for one or more channels has been changed (which may have an effect on the offset level). If the indicator is red, it is recommended to save a new dark spectrum by clicking the black “Save Dark”button in the main toolbar. When clicking the “Save Dark”button, the LED analog output will be turned off. During this period, the indicator’ s color becomes purple. After a few scans have passed, a new dark spectrum is saved for all channels and the analog output is set back to the user specified value. After a dark spectrum has been saved, the color of the indicator will be green, indicating that a dark spectrum has been saved at the current integration time setting. The saved dark spectrum will be subtracted from the measured spectrum. 4. The Light Source is used to enhance the operation and detection of the Optic Module as an inspection system. The light source LED is continuously ‘ON’in Manual Mode. It is comprised of: a. An LED Driver which provides power to the LED itself. b. LED and light source fiber coupler c. Light source fiber 5. The I/O Card is used for communication to external control devices and is located inside the External Interface Module. A terminal strip is available to connect controls for triggering, enabling and status of channel output. Solid sate relays are available for each Channel Output and for the Busy/Ready output signal. See Figure 10. 6. Integration Time is the time allocated to perform a scan (for measurement). The longer the integration time, the more accurate or detailed a measurement can be. However, the higher the Integration time, the longer the cycle time. When having difficulty getting a good measurement, try increasing the Integration 16 time (perhaps doubling it). In all situations; keep from surpassing 800 ms Long integration times, as this may cause saturation or heating problems with the detector instrument. 7. Averaging, as the name implies, is used with multiple sampling for improved consistency with measurements. It is used in conjunction with Integration time. If an Integration time is 12 ms, and an Average of 2 is entered, the system will perform 2 scans of 12 ms each and average the results; this will impact total cycle time, but will help stabilize readings. 8. When all inspection sites have been setup and parameters saved, the system can then go into Production Mode by clicking on the button of the Channel Control Menu screen. 5.2 Production Mode The Production Mode is a machine mode used primarily to tag or identify parts that have Passed or Failed inspection; typically in an automated line. This operation is automatic and operates in conjunction with the user’s control system. The display on the screen is only for a visual check of the operation. There are no usable buttons that can be operated in this mode except for one— and that is the button to return to Manual Mode. The Production mode will display the active channels (in a row format) along with the measured value, and status of pass/fail for each cycle. Figure 9 17 If the “FAIL”status is displayed in capitals against a red background, like in the figure above, this indicates that the measured ratio value is lower than the lower threshold. If the “fail”status is displayed in lowercase characters against a black background, this indicates that the measured ratio value is within thresholds, but the intensity of the signal dropped more than 50%. If the “FAIL”status is displayed in capitals against a purple background, this indicates that the measured ratio value is higher than the upper threshold. Besides Pass/Fail, there are two more statuses that may occur: The “N.A. “will be displayed for a channel that has been set to Not Activated in manual mode The “Saturated”status will be shown if the relevant pixels that are needed for calculating the ratio will be saturated (too much light hitting the detector) External Trigger This is a digital input (PIN 6) the AssureCureTM system responds to, and immediately begins a measurement cycle once a signal is received. The trigger is detected on a transition from 0v past 0.8v; (5v is recommended) hence even one microseconds pulse will trigger a start (50 µseconds or greater is recommended). There is no maximum length on the trigger signal; but the level must drop below 0.8v else, another trigger will not be recognized. LED Control The end user should provide the AssureCureTM I/O LED Control (pin 24) with an enable (Hi) 5 volt signal— this allows the light source to turn on. This signal should go Low (0 volt) whenever the machine cycling stops (or is idle for setup, repairs, etc). By making the signal low, the LED output will be turned off preventing any parts from sitting under the LED light and ‘over-curing’— this is only applicable in Production Mode. This signaling can be easily done by using the I/O breakout board Pin 15 (5 volts) and passing it through a relay to signal pin 24. File Storage The Production Mode also automatically saves inspection data to a text file. The name of the text file will be YYYYMMDD.dat. This file will be saved in a subfolder of the Henkel AssureCureTM software. If the application is started at C:\AssureCure, a folder is created in C:\AssureCure\data\ Data can be copied from this text file (and pasted elsewhere) or imported into an Excel spreadsheet in order to work with individual cells. 18 Output displays (per channel) consist of: Pass: Measurement under the threshold limit Fail: Measurement over the threshold limit N.A: Channel not active Saturated: Detection pixels are receiving too much light Channel Output Each AssureCureTM System is capable of running 4 channels or inspection points. In a production mode, the status or output of these channels are available at the External Interface breakout I/O board at locations: Channel 1 Pin 2 Hi for Pass, else Lo Channel 2 Pin 20 Hi for Pass, else Lo Channel 3 Pin 3 Hi for Pass, else Lo Channel 4 Pin 21 Hi for Pass, else Lo These outputs (above) are available on the Relay board of the Interface Module. System Channel 1 output, corresponds to terminal 1 on the Relay Board, and so on. The Ready (Busy) signal corresponds to Relay #5. Use positions 1 and 3 on the relay board terminal for a Open/Close contact signal. When a signal is active, the relay will be ‘ON’or closed; if the signal is not active, the relay will be “OFF’ or open. Channels 1-4 READY Figure 10 19 After a measurement cycle, each channel will output a signal indicating if the scanned part either passed or failed based on the threshold value. The output state of each channel is available as soon as Pin 11 drops to a Lo (0 volt) level. The user’s control system should read each channel’s status allowing processing time for the PLC to take these readings, before sending another Trigger signal to start a new cycle. Refer to the timing chart in section 5.4. Note: Keep in mind; all output channels are momentarily RESET to a low level almost immediately after a Trigger and just before the READY (busy) signal goes High. This is to ensure that output signals are not stuck in any one state. System Ready Monitor the Digital Output pin 11; use this output as a signal when to read the outputs of the channels (Relay Board #5). This output will be Hi when the system is processing data. Once data processing is complete, it will go Lo, and thus Channel output status is available. The status of the channels will remain fixed until the system begins processing data again (after a new Trigger signal is received from the user’s PLC). The key here is Do Not Trigger the AssureCureTM System (for a new cycle scan) until the control PLC has had time to read the Channel’s Output. Processing time can vary due to longer integration time selected at setup. A ‘new’trigger signal does not clear the output state of the channels, however, this action does trigger the system to begin analysis of new parts (Pin 11 goes high), and as soon as the analysis is complete in any of the channels, the new output states will begin to change. When pin 11 drops low, this signifies that analysis for all channels is complete. 5.3 Menu Functions The screen buttons are available in Manual Mode during setup and waveform/measurement optimizing. There are no user buttons available in Production Mode. Start/Stop button The Start/Stop button can be used to display data in real-time. 20 Cursor button After clicking the cursor button, a vertical line is displayed in the graph that is used as a reference indicator to get a more accurate wavelength reading for instance. If the mouse cursor is placed near this line, the shape of the mouse cursor changes from an arrow to a ‘drag’shape. If this shape is displayed, the left mouse button can be used to drag (keep left mouse button down) the line with the mouse towards a new position. Moving this line shows the corresponding values of wavelength and amplitude in the main screen. As an alternative for dragging the line, the small step and big step arrow buttons may be used, or the left and right arrow keys on the keyboard. The step size for the arrow buttons can be changed by holding down the CTRL-key while clicking at a (single or double) arrow button. Autoscale Y-axis button By clicking this button, the graph will be rescaled on-line. A maximum signal will be shown at about 75% of the vertical scale. The same result can be achieved with the option View-Autoscale Y-axis Change Graph Scale button By clicking this button, a dialog will be shown in which the range can be changed for both X- and Y-axis. This range can be saved as well and restored any time by clicking the Go to Preset Scale button (see below). The menu option with the same functionality is ViewChange Graph Scale. Goto Preset Scale button By clicking this button, the scale for X- and Y-axis will be set to a range that has been set previously before. The same result can be achieved with the menu option View-Go to Preset Scale Graphic Reset button By clicking this button, the X- and Y-axis will be reset to their default values. The same result can be achieved with the option View-Graphic Reset 21 Auto Configure Integration time button After this button is clicked, the software starts searching for an optimal integration time. Depending on the maximum counts in the last scan, the integration time will be increased/decreased automatically until a scope signal of about 90% of the full scale is measured. During the search routine, the changes in integration time can be followed in the integration time edit box in the edit bar. A dialog box will display the new integration time if the search is ready. Save experiment button By clicking the Save Experiment button an experiment is saved. The same result can be achieved with the option File-Save Experiment. Print button By clicking the Print button a graph that is displayed on the monitor will be printed. The same result can be achieved with the option File-Print. 22 5.4 Timing Chart NOTE: The time between the Ext. Trigger and the READY (processing pin 11) going Hi, all Channel outputs are reset to 0 volt level (momentarily). 6 Application Hints As with all adhesives, performance depends on conditions of use. Suggestions or recommendations contained herein are for guidance only, since actual conditions of use are outside the supplier’s control. Measured Values Resultant Value after analysis The AssureCureTM examines wavelength data and extracts a value based on the product’s liquid’s transition to a solid. An acceptable value to determine Pass or fail is primarily done using known cure times with the product. Though the user can select Pass –Fail parameters (threshold value) at will. These numbers will 23 vary from one application to the next. But, the values can be validated by (inhouse) testing and establishing the corresponding ratio number to a percentage of curing of the product for a particular application. Intensity counts can be observed on the Y-axis of the screen’s graph. Typical values for intensity counts are around 8,000. The counts can be lower, higher or even much higher than that value given here (application dependant)— the measured ratio value however, will be relatively the same. Parts that are over-cured will be detected by a black color status indicator with lower case letters (in production mode)— if the setup was performed properly. This feature can be disabled by going to the Setup-options menu and clicking on the >50% intensity. A multiplier (that is available in the Manual Mode Control Window) can be used to make this value a whole number, or other number representative of a value the user favors. Be aware that if the LED light source is off and the ambient light is low in the room, the system will attempt to make analysis when triggered, and these values could fluctuate wildly. This is due to amplification of noise-since the LED if off. An error such as this will be evident with many consecutive failed parts. The room should be lit and the LED light source should be on to prevent this condition. Optimizing Measurements Fibers Take care that fibers are not bent or forced beyond their natural (minimum) bend radius. The end of the fiber should be about 1”or less from the part being observed. The light source and detector fibers are at optimum when at 90 degrees from each other. The position of the fibers is critical for proper measurements with the system. Integration Time Try to optimize this parameter; its rate determines most of the cycle time. Begin at about 2 ms, and double the time on each trial until a satisfactory waveform and measured value are obtained. Naturally, the detector fiber and light source should first be optimized for position— this will reduce the integration time required. Try to avoid exceeding 800 ms integration times— this may cause measurement problems. If longer integration times are found to be required; the optic module may have to be adjusted. 24 Average Increase the number of averages if the measurement results are not providing good results. Averaging will increase cycle time by Integration time (ms) X number of averages = milliseconds. Smoothing This smoothes the contour of the waveform of a scan to remove noise (visible in Manual Mode). However smoothing will cause resolution loss. Dark Save This operation analyzes the ambient light at the detection point (with the detector fiber), and removes this effect from calculations obtained when the light source is ON. The LED light source should be OFF when performing a Dark save. When lighting conditions change, Integration time is changed or background changes occur, no matter how slight, a Dark save should be performed. Shrouds Some environments may have too much (ambient) white light that interferes with obtaining good, clean measurements from the AssureCureTM System. In some cases shrouding the inspection point from light will be a good solution. This can be accomplished using a curtain, a box or any device that will minimize stray white light from the inspection area. Light Source Intensity The higher the intensity of the light source, the higher the counts of the reading. However, too much light can also saturate the instrument’s pixels and cause measurement problems. Too much light output also can contribute to the LED’s power degradation. Set the system so that enough LED output is doing the job without over-use. In Manual Mode, the effect of the LED’s output can be quickly ascertained by scanning and looking at the waveform and inspection values while adjusting the on-screen slide LED control. Bear in mind that LED output can contribute to product curing so keep power output only as needed. If using multiple inspection sites and a single light source— in some instances one site may have proper light intensity, and another too low. Rather than to increase power output, use positioning of the detector and light source fiber to optimize the measurement. If one site has too much power, move the light source fiber further away from the site, rather than to reduce the LED Driver power which may affect another station. On screen Intensity counts can be observed on the Y-axis of the screen’s graph. Typical values for intensity counts are around 5,000; but not a rule— use Figure 7 as a visual indicator for the desired waveform. So long as readings are consistent, there is no need to further increase LED output intensity. 25 LED light degradation becomes a concern only when the output light is too low and is not providing the typical waveform that is expected. Otherwise, LED output degradation has little to no effect on daily monitoring of parts. This is because the AssureCureTM System is based on a ratio of wavelengths and not on a particular line or spot of intensity in the light spectrum. Hence, any degradation would occur across the entire spectrum with practically no effect on the ratio values obtained. Production Run Before running production, ensure that threshold values were chosen optimally. Start at about a 20% value above the average number obtained during runs in Manual Mode. This will reduce the number of false rejects due to small variations related to production. Once some production history is established and stored data is examined, the threshold values can be changed to a suitable level. Manual Mode The LED Light Source is normally ‘on’continuously— keep this in mind, especially if your intensity is set somewhat high, as it may begin curing the parts under observation. The LED can (temporarily or permanently) be made to vary the output or be turned off altogether by moving the selector switch on the LED Driver to CW (see figure 4) and then using the adjustable knob. Pressing the Start button on the screen will perform continuous scans of any and all instruments that are active. During initial setup, if a waveform is not observed on the screen of an inspection site, slowly move the detector fiber so that it is aimed at the center of where the adhesive was applied. The light source should also be aimed at this same spot at about a 90 degree angle from the detector fiber— this is so the detector picks up as little of the light source emissions as possible. Spare Parts Anticipate worse case scenario. Have backup parts on hand to prevent production lose due to failed or damaged equipment. Have an Optic Module, a detector fiber, a light source fiber and an LED light source as a minimum. 26 7 Troubleshooting Problem LED Will not turn ON. No waveform detected on part Possible Cause Not enabled Action Check I/O card Pin 24 for 5V. See table for LED control. No power to driver. Check power supply connection to the LED Driver. Driver is in wrong mode. Check LED Driver select switch is on MOD, Use proper adhesive. No adhesive or improper adhesive on part Alignment of fibers Use Manual Mode to visually check for proper waveform while adjusting the position of both the detector and light source fibers. LED is not ON or low intensity Make sure the LED is on and has at least 25 mw of output power (per channel). Detector fiber or collimator lens damaged or blocked Check the detector fiber and lens for serviceability. Use a spare to test. I/O card Pin 6 must have a signal in order to start a measurement cycle— see 5.2 Check measured values in Manual mode several times; then select an appropriate Threshold value for Pass-Fail criteria. Not measuring parts in production mode External trigger is not being received Rejecting parts in Production Mode Threshold value is too low Incorrect timing External control systems need to look at available signals at the I/O card at the correct interval— refer to the timing chart on page. Parts are not indexing to proper position Machine part position should be verified. Channel displays “Saturated” Too much light entering measurement instrument Optic Module not recognized on startup No power to optics processor Integration time is set too high or light source illumination is entering instrument. Turn power switch to on position. Check cable from PC to USB connector in the rear of the optic processor. Not connected via USB 27 FOR ANY REPAIRS OR ADJUSTMENTS –OTHER THAN THOSE DETAILED IN THIS MANUAL –PLEASE CONTACT 1-800-LOCTITE (5628483). 8 Care and Maintenance The AssureCureTM System requires little maintenance once setup is complete. The LED Light Source output intensity can be measured initially (using a radiometer) and there after once every 2 weeks. The LED output may degrade about 5% to 10% the 1st 1,000 hours of use (at full output); but will remain relatively unchanged for the next several thousand hours. Slight (intensity) output changes will not affect system measurements because the measurements are based on a ratio between wavelengths and not on a specific wavelength on the spectrum. Do not twist, step on, bend, or pull on fiber cables as permanent damage will result. Light source fibers will degrade with time; however they can be expected to be useful to 2-3 years (unless physically damaged). Once a month use a soft napkin or cloth wipe and pass through the outlet of the fiber to remove any dust or particles that have collected on the end piece. Optic Module (instrument) Calibration The Optic Module instrument have fixed slit and optical components and are by design a solid state device. The optical and electronic design of this instrument is optimized for deployment in industrial and field environments, so the instrument is designed for stability over time. The need for periodic wavelength calibrations which is typical for monochromator based instrument, which have moving/rotating parts, is generally minimized or eliminated for a fiber optic instrument type the AssureCureTM system utilizes. The specific application for which the AssureCureTM System was developed has particularly low demands for wavelength accuracy. Fluorescence emissions have inherently wide spectral bandwidths, so pinpointing wavelength accuracy down below +/- 0.1-0.2 nm (FWHM) is not necessary (which is where calibration would play into). Other than in the case of a very extraordinary instrument failure would wavelength accuracy vary more than +/- 0.01 for a given instrument configuration during the course of year. Hence, calibration of the instrument is not required; but available for anyone required or wishing to have the service performed. 28 9 Accessories and Spare Parts Description Supplier Item Number Optic Module Henkel 1471134 Detector Fiber (with collimator) Henkel 1470771 Lens Collimator (only) Henkel 8902503 Light Source Fiber, Single Henkel 1470728 Light Source Fiber, Double Henkel 1470728 Light Source Fiber, Triple Henkel 1470729 Light Source Fiber, Quad Henkel 1470730 LED Light Source Henkel 8902494 LED Driver Henkel 8902493 LED Driver Power Supply Henkel 8902497 Radiometer Henkel 1265282 Radiometer Adapter Henkel 1527709 29 10 Warranty Henkel expressly warrants that all products referred to in this Instruction Manual for ( Henkel Degree of Cure Monitoring System) (hereafter called “Products”) shall be free from defects in materials and workmanship. Liability for Henkel shall be limited, as its option, to replacing those Products which are shown to be defective in either materials or workmanship or to credit the purchaser the amount of the purchase price thereof (plus freight and insurance charges paid therefor by the user). The purchaser’s sole and exclusive remedy for breach of warranty shall be such replacement or credit. A claim of defect in materials or workmanship in any Products shall be allowed only when it is submitted in writing within one month after discovery of the defect or after the time the defect should reasonably have been discovered and in any event, within (12) months after the delivery of the Products to the purchaser. This warranty does not apply to perishable items, such as (fibers, LEDs, fuses, etc.). No such claim shall be allowed in respect of products which have been neglected or improperly stored, transported, handled, installed, connected, operated, used or maintained. In the event of unauthorized modification of the Products including, where products, parts or attachments for use in connection with the Products are available from Henkel, the use of products, parts or attachments which are not manufactured by Henkel, no claim shall be allowed. No Products shall be returned to Henkel for any reason without prior written approval from Henkel. Products shall be returned freight prepaid, in accordance with instructions from Henkel. NO WARRANTY IS EXTENDED TO ANY EQUIPMENT WHICH HAS BEEN ALTERED, MISUSED, NEGLECTED, OR DAMAGED BY ACCIDENT. EXCEPT FOR THE EXPRESS WARRANTY CONTAINED IN THIS SECTION, HENKEL MAKES NO WARRANTY OF ANY KIND WHATSOEVER, EXPRESS OR IMPLIED, WITH RESPECT TO THE PRODUCTS. ALL WARRANTIES OF MERCHANTABILITY, FITNESS FOR A PARTICULAR PURPOSE, AND OTHER WARRANTIES OF WHATEVER KIND (INCLUDING AGAINST PATENT OR TRADEMARK INFRINGEMENT) ARE HEREBY DISCLAIMED BY HENKEL AND WAIVED BY THE PURCHASER. THIS SECTION SETS FORTH EXCLUSIVELY ALL OF LIABILITY FOR HENKEL TO THE PURCHASER IN CONTRACT, IN TORT OR OTHERWISE IN THE EVENT OF DEFECTIVE PRODUCTS. WITHOUT LIMITATION OF THE FOREGOING, TO THE FULLEST EXTENT POSSIBLE UNDER APPLICABLE LAWS, HENKEL EXPRESSLY DISCLAIMS ANY LIABILITY WHATSOEVER FOR ANY DAMAGES INCURRED DIRECTLY OR INDIRECTLY IN CONNECTION WITH THE SALE OR USE OF, OR OTHERWISE IN CONNECTION WITH, THE PRODUCTS, INCLUDING, WITHOUT LIMITATION, LOSS OF PROFITS AND SPECIAL, INDIRECT OR CONSEQUENTIAL DAMAGES, WHETHER CAUSED BY NEGLIGENCE FROM HENKEL OR OTHERWISE. 30 Henkel Corporation One Henkel Way Rocky Hill, CT 06067-3910 Henkel Canada Corporation 2225 Meadowpine Boulevard Mississauga, Ontario L5N 7P2 Henkel Corporation Automotive / Metals HQ 32100 Stephenson Hwy. Madison Heights, MI 48071 Henkel Ltda. Rua Karl Huller, 136 –Jd. Canhema 09941-410 Diadema/SP, Brazil Henkel Capital, S.A. de C.V. Calzada de la Viga s/n Fracc. Los Laureles Loc. Tulpetlac, C.P. 55090 Ecatepac de Morelos, Edo. de México www.loctite.com ® and ™ designate trademarks of Henkel Corporation or its affiliates. ® = registered in the U.S. and elsewhere. © Henkel Corporation, 2009. All rights reserved. Data in this operation manual is subject to change without notice. Manual P/N:8902514 , Rev B, Date: 07/08/2011 31