1
IBM Tealeaf cxOverstat
Version 9 Release 0.2
June 18, 2015
cxOverstat User Manual
Note
Before using this information and the product it supports, read the information in “Notices” on page 71.
This edition applies to version 9, release 0, modification 0 of IBM Tealeaf cxOverstat and to all subsequent releases
and modifications until otherwise indicated in new editions.
© Copyright IBM Corporation 1999, 2015.
US Government Users Restricted Rights – Use, duplication or disclosure restricted by GSA ADP Schedule Contract
with IBM Corp.
Contents
cxOverstat User Manual . . . . . . . . v
Chapter 1. Overview . . . . . . . . . 1
What's new in cxOverstat .
Features and benefits . .
How cxOverstat works with
How cxOverstat works . .
Overview of dimensions .
Default dimensions . .
. .
. .
other
. .
. .
. .
. . . . . .
. . . . . .
Tealeaf products
. . . . . .
. . . . . .
. . . . . .
.
.
.
.
.
.
1
2
2
3
4
4
Chapter 2. Installing and deploying
cxOverstat . . . . . . . . . . . . . 7
Prerequisites . . . . . . . . .
Deploying cxOverstat . . . . . .
JavaScript deployment . . . . . .
Include pages. . . . . . . .
Include location on the page. . .
Gathered data . . . . . . . .
Defining cxOverstat as the Tealeaf start
.
.
.
.
.
.
. .
. .
. .
page
.
.
.
.
.
.
.
.
.
.
.
.
.
.
. 7
. 8
. 9
. 10
. 10
. 11
. 11
Chapter 3. Using cxOverstat overlays
13
Overview: cxOverstat overlays . . . . . . . .
Using the Form Analytics overlay . . . . . . .
Viewing the Form Analytics overlay . . . . .
Modifying the Form Analytics overlay view . .
Dwell Time report . . . . . . . . . . .
Repeats report . . . . . . . . . . . .
Conversion rates. . . . . . . . . . . .
Using the Link Analytics overlay . . . . . . .
Viewing the Link Analytics overlay . . . . .
Viewing click-rate metrics . . . . . . . .
Using the Comparison Analytics overlay . . . .
Viewing the Comparison Analytics overlay . . .
Using the Heat Map overlay. . . . . . . . .
Using Heat Maps . . . . . . . . . . .
Using the Attention Map overlay . . . . . . .
Viewing the Attention Map overlay . . . . .
Viewing Attention Map reports . . . . . . .
Using the Accessibility overlay . . . . . . . .
Viewing Accessibility metrics . . . . . . .
Using the Contrast Analytics overlay . . . . . .
Viewing the Contrast Analytics overlay . . . .
Modifying the Contrast Analytics overlay display
Viewing Contrast Analytics metrics . . . . .
13
14
15
15
18
20
22
22
23
23
25
25
30
31
35
35
36
37
37
37
38
38
38
Chapter 4. cxOverstat interface . . . . 41
cxOverstat toolbars . . . . . . . . . . .
Changing the date range . . . . . . . .
Applying metrics to a cxOverstat report . . .
Changing metrics thresholds. . . . . . .
Customizing Link Analytics elements. . . .
Filtering dimension values within an overlay .
Segmenting dimension values within an overlay
Using Sub-select to define a region of focus .
© Copyright IBM Corp. 1999, 2015
.
.
.
.
.
.
41
42
42
42
44
44
45
. 47
Exporting data from cxOverstat . . .
Using drill-down links. . . . . . .
Dimension filters and segmentation overview
Zoom toolbar and the Page Navigator . .
Changing the Zoom factor . . . . .
Using the Page Navigator . . . . .
.
.
.
.
.
.
Chapter 5. Eventing for cxOverstat
cxOverstat usability data . . . . . . .
Usability Eventing . . . . . . . .
cxOverstat objects must be enabled . .
Goal Based Dimensions . . . . . .
Data storage . . . . . . . . . .
cxOverstat step attributes . . . . . . .
cxOverstat events . . . . . . . . .
Primary Reporting Events . . . . .
Building block events . . . . . . .
cxOverstat dimensions. . . . . . . .
cxOverstat report groups . . . . . . .
cxOverstat report group templates . . . .
Tracking other usability events . . . . .
Goal Based Dimensions . . . . . . .
Overview . . . . . . . . . . .
Goal Based Dimension events . . . .
Goal Based Dimensions and report groups
.
.
.
.
.
.
.
.
.
.
.
.
. . 51
.
.
.
.
.
.
.
.
.
.
.
.
.
.
.
.
.
.
.
.
.
.
.
.
.
.
.
.
.
.
.
.
.
.
.
.
.
.
.
.
.
.
.
.
.
.
.
.
.
.
.
Chapter 6. Using cxOverstat Snapshot
Installing the cxOverstat Snapshot Capture
extension . . . . . . . . . . . .
Taking Snapshots . . . . . . . . .
Customizing your keyboard shortcut . .
Taking a Snapshot . . . . . . . .
Working with snapshots . . . . . . .
Renaming a snapshot . . . . . . .
Adding tags to a snapshot . . . . .
Deleting snapshots . . . . . . . .
Viewing overlays on a snapshot . . .
Working with stacks . . . . . . . .
Previewing stacks . . . . . . . .
Viewing snapshots in a stack . . . .
Adding snapshots to a stack . . . . .
Removing snapshots from a stack . . .
Deleting stacks . . . . . . . . .
Moving snapshots in a stack. . . . .
Working with tags . . . . . . . . .
Creating tags . . . . . . . . . .
Renaming tags . . . . . . . . .
Removing tags . . . . . . . . .
Deleting tags . . . . . . . . . .
Adding tags to snapshots. . . . . . .
Adding tags to stacks . . . . . . . .
47
48
48
49
49
50
.
.
.
.
.
.
.
.
.
.
.
.
.
.
.
.
.
.
.
.
.
.
.
.
.
.
.
.
.
.
.
.
.
.
.
.
.
.
.
.
.
.
.
.
.
.
51
52
52
52
52
53
54
54
55
56
56
57
58
58
58
60
60
61
.
.
.
.
.
.
.
.
.
.
.
.
.
.
.
.
.
.
.
.
.
.
.
61
61
61
61
62
62
62
62
63
63
63
63
63
63
63
64
64
64
64
64
64
64
65
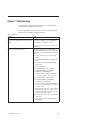
Chapter 7. Troubleshooting . . . . . . 67
Logging
.
.
.
.
.
.
.
.
.
.
.
.
.
.
. 68
iii
Chapter 8. IBM Tealeaf documentation
and help . . . . . . . . . . . . . . 69
Notices . . . . . . . . . . . . . . 71
Trademarks .
iv
.
.
.
.
cxOverstat User Manual
.
.
.
.
.
.
.
.
. 72
Privacy Policy Considerations .
.
.
.
.
.
.
. 73
cxOverstat User Manual
IBM Tealeaf cxOverstat enables the review of the aggregated behaviors of all
visitors to your web application. Through your web browser, you can review heat
maps, compare how different segments of customers are interacting with your
website, identify top clicks, and form data for visitors to your web application over
a configured set of dates, enabling insightful analysis of what is occurring on each
page of your site.
The IBM Tealeaf cxOverstat User Manual provides information about how to
install, configure, and use the IBM Tealeaf cxOverstat product.
© Copyright IBM Corp. 1999, 2015
v
vi
cxOverstat User Manual
Chapter 1. Overview
With IBM Tealeaf cxOverstat, you can visualize the behaviors of your visitors on
each page of your web application. Directly from Browser-Based Replay or
Snapshot, you can select a page and display multiple features as overlays directly
over the selected page. The highly visual reports allow for rapid and intuitive
insights into visitor behavior. Interactive drilldowns for each report can be used to
quickly explore the data by using the familiar tools of the Tealeaf system.
By identifying the locations on a page of greatest interest, you can begin to
quantify and explore how and why negative outcomes are occurring on specific
pages. For example, if Step 3 of a business process illustrates that 50% of customers
are abandoning the process, then the web development team can focus its attention
on improving the usability of the Step 3 page. In this manner, you and your
enterprise can make basic, significant improvements to your web application to
provide a richer and easier customer experience.
In addition to monitoring the current activities on a web application, IBM Tealeaf
cxOverstat can be used as an important development tool for performing
data-driven measurements of the impact of new features and other changes to the
web application.
IBM TealeafcxOverstat answers the following basic question: What is challenging
about this page?
Note: IBM Tealeaf cxOverstat is a separately licensable component of the IBM
Tealeaf CX platform. For more information about IBM Tealeaf cxOverstat, please
contact your IBM Tealeaf representative.
What's new in cxOverstat
An overview of new features in cxOverstat 9.0.2.
User Interface Redesign
In order to maintain a consistent look and feel across IBM Commerce products,
Tealeaf initiated a redesign of cxOverstat. Product structure remains the same,
while certain elements received a facelift. Areas that underwent changes include
the login page, dashboard, search, session list and top navigation menu.
Enhanced Overlay Render Fidelity
cxOverstat now stores images and CSS style sheets at the time of capture. Thus,
when your snapshot is rendered, it looks exactly like the website did when you
captured the snapshot, even if it contains images and CSS style sheets that are no
longer displayed on the website. You can also capture additional page attributes
such as doc type and browser dimensions to improve render fidelity and support
responsive web design.
cxOverstat Mobile
You can now access data for customers using native mobile technology through
cxOverstat Heat Maps, Comparison Analytics, Link Analytics, Form Analytics and
© Copyright IBM Corp. 1999, 2015
1
Color Contrast Analytics overlays. Tealeaf will record data on taps from mobile
users, so you can get a better idea of how customers are using your native mobile
applications. Taps identify areas where customers touched their screen, regardless
of whether the element was responsive.
cxOverstat Snapshot
With cxOverstat Snapshot you can capture page states from live web pages and
save them to the Snapshot Gallery. Saving captured page states to the Snapshot
Gallery simplifies access to cxOverstat data for selected web pages. cxOverstat
Snapshot captures the current state of a cxOverstat-enabled web page, including all
of the data that is typically displayed in cxOverstat overlays.
Features and benefits
An overview of IBM Tealeaf cxOverstat features and benefits and how IBM Tealeaf
directly impacts certain factors.
IBM Tealeaf cxOverstat provides the following features:
v Visualize usage patterns across the entire web application
v Gain awareness of exactly how a visitor uses a specific page
v Evaluate each process to monitor visitor success rate in completing it
v Identify the parts of a page that are most frequently used and that are largely
unused
v Predict how visitors will use the web application in the future
v Apply that predictive insight to improve the overall customer experience
Toward the above features, IBM Tealeaf cxOverstat provides the following benefits:
v Methods for improving form conversion rates through Form Analytics
v Optimization of landing pages that are based on Tealeaf replay through Link
Analytics
v Enhancement of object placement on the page through Heat Maps
v Compare captured dimensions and dimension values for a page through
Comparison Analytics
v Identify the areas of a web page that are most consistently displayed in the
visitor's browser window through Attention Maps
How cxOverstat works with other Tealeaf products
How IBM Tealeaf cxOverstat interacts with IBM Tealeaf RealiTea Viewer, cxReveal,
mobile sessions, and active sessions.
RTV
The IBM Tealeaf CX RealiTea Viewer is a stand-alone application that is separately
installed for Windows desktops. See "RealiTea Viewer (RTV) User Manual" in the
IBM Tealeaf RealiTea Viewer User Manual.
Note: IBM Tealeaf cxOverstat features are not available through the IBM Tealeaf
CX RealiTea Viewer.
2
cxOverstat User Manual
cxReveal
Note: IBM Tealeaf cxReveal users cannot access the IBM Tealeaf cxOverstat
overlays through Browser-Based Replay. To use IBM Tealeaf cxOverstat, you must
have an IBM Tealeaf cxImpact user account, which is configured to enable access to
Browser-Based Replay. See "CX User Administration" in the IBM Tealeaf cxImpact
Administration Manual.
Mobile Sessions
For mobile sessions, IBM Tealeaf cxOverstat has the following limitations:
v IBM Tealeaf cxOverstat does not support the capture of mobile sessions that are
initiated from mobile native applications.
v When IBM Tealeaf cxOverstat overlays are displayed, the mobile skin that is
shown in replay is disabled. Replay of mobile gestures is also disabled.
All other IBM Tealeaf cxOverstat features are available for mobile-based sessions.
Active Sessions
Since IBM Tealeaf cxOverstat events are not published until the end of each
session, IBM Tealeaf cxOverstat overlays do not contain any data from active
sessions.
Web Browser Settings
To track cxOverstat related data, visitors to your web application must have
JavaScript enabled in their web browser.
How cxOverstat works
IBM Tealeaf cxOverstat captures visitor interactions with web pages and turns this
information into accessible data. It requires the deployment of a lightweight
JavaScript to every page of your web application where you want to capture
visitor behavior.
Through the IBM Tealeaf CX UI Capture SDK JavaScript, visitor actions, such as
mouse movements and mouse clicks, are captured as user interface events through
the browser. These events are bundled and forwarded to Tealeaf, where they are
captured, processed, and analyzed for use in visualization and reporting data.
Note: IBM Tealeaf cxOverstat captures 100% of the available usability data from
sessions that are captured by Tealeaf. There is no data sampling.
Overlays:
Tealeaf users can access IBM Tealeaf cxOverstat directly through Browser Based
Replay (BBR) and the Snapshot Gallery, both of which are available through the
Tealeaf Portal. From the Overlays menu, Tealeaf users can apply any of the IBM
Tealeaf cxOverstat displays to the current page. The overlays include updated
statistical information, which is based on the most recent compilation of user
behavior statistics that are submitted to Tealeaf for the current page.
Events:
Chapter 1. Overview
3
Usability events need dimensional data to function properly. As IBM Tealeaf
cxOverstat anonymously collects information for reporting purposes, events are
used to specify certain conditions, such as period of time, to record information.
IBM Tealeaf cxOverstat provides a list of primary reporting events that are used to
report data, and with each event comes a set of pre-configured dimensions.
Dimensions:
A dimension is a tracked element of contextual data, such as which browser a
customer is using, that is recorded when an event occurs. It is necessary to use
dimensions to capture data, and Tealeaf provides a set of pre-configured
dimensions that are used to store client data.
Except for the IBM Tealeaf CX UI Capture SDK JavaScript, no other installation is
required.
v See "UI Capture j2 Guide" in the IBM Tealeaf UI Capture for j2 Guide.
Overview of dimensions
In Tealeaf, a dimension is a tracked element of contextual data, which is recorded
when an instance of an event occurs. For example, when an event records an
application error, you might want to record as contextual information the type of
browser from which it was sourced. Browser type information is stored in a
dimension.
v For more information about dimensions, see "TLTopic - Dimensions" in the IBM
Tealeaf Topics.
Since IBM Tealeaf cxOverstat data is captured by using Tealeaf events, you can
apply the dimension filters that are associated with the set of IBM Tealeaf
cxOverstat events. These events are used to track usability data that is forwarded
to Tealeaf for capture. For some of these events, dimensions are already associated
with them. These dimensions are available through the IBM Tealeaf cxOverstat
overlays.
v You can apply up to eight dimensions to an overlay.
v For more information about the IBM Tealeaf cxOverstat events and dimensions,
see "Eventing for cxOverstat" in the IBM Tealeaf Event Manager Manual.
You might be interested in associating more dimensions with the IBM Tealeaf
cxOverstat events so that you can filter your overlays by other contextual
information.
v For more information about creating dimensions, see "TEM Dimensions Tab" in
the IBM Tealeaf Event Manager Manual.
Default dimensions
By default, the following dimensions are applied as a dimension filter for
drill-down reports and searches:
Note: These dimension filters are not visible in the display.
1. Step - ScreenView
2. Step - ScreenView URL
v If the ScreenView URL is not provided in the current page, the value is taken
from the preceding valid value.
3. Any dimensions that power the selected overlay.
4
cxOverstat User Manual
v See "Eventing for cxOverstat" in the IBM Tealeaf Event Manager Manual.
Chapter 1. Overview
5
6
cxOverstat User Manual
Chapter 2. Installing and deploying cxOverstat
Certain steps must be taken when installing IBM Tealeaf cxOverstat on a new or
existing system.
If you are installing IBM Tealeaf cxOverstat on a new system, IBM Tealeaf
cxOverstat functionality in the Tealeaf® Portal is automatically enabled through
your license key.
Note: The IBM Tealeaf cxOverstat JavaScript must be installed and deployed
through your web server. See Recommended deployment.
Note: If you are licensing IBM Tealeaf cxOverstat for an existing Tealeaf system,
you must run the Tealeaf Upgrader, apply your license, and then choose to install
IBM Tealeaf cxOverstat, which enables access to the event objects required for
correct operation. See "Upgrading Tealeaf Software on a Server" in the IBM Tealeaf
CX Upgrade Manual.
Prerequisites
To use IBM Tealeaf cxOverstat, you must have access to browser-based replay, an
HTML5 supported browser, an installed UI Capture j2 JavaScript solution, and
sufficient time to allow the collection of statistically significant usability data. Most
high-volume sites have sufficient site visitors to gather meaningful data for
analysis within a few minutes. Low-volume sites might have to wait a few days to
obtain meaningful insights.
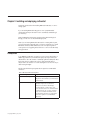
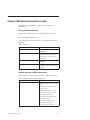
The following table lists the prerequisites that are required to use IBM Tealeaf
cxOverstat.
Table 1. IBM Tealeaf cxOverstat Prerequisites
cxOverstat Prerequisite
Description
IBM Tealeaf CX and cxImpact
IBM Tealeaf CX and cxImpact must be installed and
configured. For more information, see IBM Tealeaf CX
Installation Manual.
Access to Browser Based Replay
Each user of IBM Tealeaf cxOverstat must have an
IBM Tealeaf cxImpact user account that has
permission to access Browser Based Replay.
Browser-based Replay is used to replay visitor
sessions and can be used to view cxOverstat related
information through a set of overlays. cxOverstat
overlays are not available in CX RealiTea Viewer.
Note: IBM Tealeaf cxOverstat is not supported for
users that have permission to use IBM Tealeaf
cxReveal only.
© Copyright IBM Corp. 1999, 2015
7
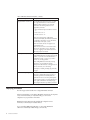
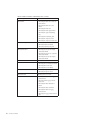
Table 1. IBM Tealeaf cxOverstat Prerequisites (continued)
cxOverstat Prerequisite
Description
Supported HTML5 web browser
To view IBM Tealeaf cxOverstat overlays, you must
use a supported web browser. A browser that has
HTML5 enabled is required to view cxOverstat
related data. The following web browsers are
supported by cxOverstat:
v Microsoft Internet Explorer web browser versions 9
- 11
v Firefox versions 31 - 36
v Chrome versions 31 - 41
Note: The reporting features of IBM Tealeaf
cxOverstat are limited by the HTML5-based data that
is captured by UI Capture j2. For more information,
see IBM Tealeaf CX UI Capture j2 Guide.
Note: The Tealeaf Portal does not support access
from mobile browsers.
Note: This list of browsers is more restrictive than
the browsers supported for access to the Tealeaf
Portal. See "Logging in to the Tealeaf Portal" in the
IBM Tealeaf cxImpact User Manual.
CX UI Capture SDK JavaScript
Before you can use IBM Tealeaf cxOverstat, you must
install the IBM Tealeaf CX UI Capture SDK JavaScript
solution on your web server and add references to
include the JavaScript on every page you want to
monitor on your web application.
Note: Adding IBM Tealeaf cxOverstat JavaScript
references to your web application requires
developer-level skills and access to the application on
the web server that you are monitoring.
See Chapter 2, “Installing and deploying cxOverstat,”
on page 7.
Allow time to elapse to gather data Before you use IBM Tealeaf cxOverstat data, you
must allow a sufficient time period to elapse for a
statistically significant set of usability data to be
gathered from visitor sessions. This period depends
on the volume of traffic on your web application. It is
best to gather a minimum of 1000 clicks per page
before using the data that is provided by cxOverstat.
Deploying cxOverstat
The following procedure describes how to deploy IBM Tealeaf cxOverstat.
Tealeaf recommends that you first deploy IBM Tealeaf cxOverstat in a development
or test environment. When you verify functionality, you can move the
configuration to your production environment.
IBM Tealeaf CX and cxImpact must be installed and configured. For more
information, see IBM Tealeaf CX Installation Manual.
If you are installing IBM Tealeaf cxOverstat on a new system, IBM Tealeaf
cxOverstat is automatically enabled through your license key.
8
cxOverstat User Manual
Complete the following steps to deploy cxOverstat to your IBM Tealeaf
environment.
1. Log on to the IBM Tealeaf Report Server.
2. Run <Tealeaf>\Enablers\cxOverstat\setup.exe to start the cxOverstat
installer. Replace <Tealeaf> with the folder name for your IBM Tealeaf
installation.
3. Select the language that you want to use for the installation screens and click
OK.
4. From the Welcome screen, click Next to continue to the License screen.
5. In the License screen, review the license terms and click I accept the terms;
then, click Next to continue.
6. From the Installation screen, click Install to start the installation.
7. From the Installation Complete screen, click Finish.
8. If the IBM Tealeaf CX UI Capture SDK JavaScript solution is not already
deployed to your web server, do so now.
9. Add an IBM Tealeaf cxOverstat JavaScript reference to each web page that you
want to capture cxOverstat data. Adding IBM Tealeaf cxOverstat JavaScript
references to your web application requires access to the application on the
web server that you are monitoring. For more information on developing IBM
Tealeaf cxOverstat JavaScript reference, see “JavaScript deployment.”
10. Log in to the Tealeaf Portal and click Configure > Event Manager.
11. From Event Manager, edit the Step - ScreenView URL dimension. Make sure
that Values to Record is set to Whitelist Only; then, create a whitelist for the
dimension. Whitelist Only is the default setting for the Values to Record
option. A whitelist helps to control the amount of cxOverstat data that is
recorded. For more information about creating a whitelist, see the IBM Tealeaf
CX Event Manager Manual.
12. Select the events and dimensions that are related to cxOverstat that you want
to track.
For more information on creating and configuring events, see the IBM Tealeaf
Event Manager Manual.
After the installation procedure is complete, a sufficient time period must elapse
for a statistically significant set of usability data to be gathered from visitor
sessions. This period depends on the volume of traffic on your web application. It
is recommended to gather a minimum of 1000 clicks per page before you use the
data that is provided by cxOverstat.
JavaScript deployment
Tealeaf UI Capture for j2 is used to capture the cxOverstat-related user interaction
with a web page.
Each web page that is captured must contain JavaScript, which captures the user
interaction with the web page and sends the data to the Tealeaf capture server.
Depending on the size and volume of your web application, you can choose to
enable the tracking of all pages on your web application or a selection of pages.
For example, important pages such as landing pages, check-out pages, and the
pages of other key business processes are good candidates for tracking. IBM
Tealeaf cxOverstat can be used with HTTP and HTTPS pages.
Chapter 2. Installing and deploying cxOverstat
9
Note: Do not install the IBM Tealeaf cxOverstat JavaScript on any page that uses
an older version of the UI Capture SDK that does not explicitly support IBM
Tealeaf cxOverstat. For supported versions, IBM Tealeaf cxOverstat SDK and IBM
Tealeaf CX UI Capture for AJAX SDK can coexist on the same page. See "Client
Framework Versions" in the IBM Tealeaf Client Framework Data Integration Guide.
Pages are tracked by adding the IBM Tealeaf CX UI Capture j2 solution. Place
references to the JavaScript as high as possible on each web page that requires
usability tracking. The lowest location on the page where the JavaScript references
can be inserted is just after the opening <BODY> tag. This location is useful if you
are not tracking all of the pages of your web application.
Note: IBM Tealeaf cxOverstat requires the IBM Tealeaf CX UI Capture SDK
solution. See "UI Capture j2 Guide" in the IBM Tealeaf UI Capture for j2 Guide.
v IBM Tealeaf cxOverstat is not compatible with the older version of IBM Tealeaf
CX UI Capture for AJAX.
For more information about deployment and verification instructions, see "UI
Capture j2 Guide" in the IBM Tealeaf UI Capture for j2 Guide.
Include pages
Depending on the size and volume of your web application, you can choose to
enable the tracking of all pages on your web application or a selection of pages.
For example, important pages such as landing pages, check-out pages, and the
pages of other key business processes are good candidates for tracking.
IBM Tealeaf cxOverstat can be used with HTTP and HTTPS pages.
Note: Do not install the IBM Tealeaf cxOverstat JavaScript on any page that uses
an older version of the UI Capture SDK that does not explicitly support IBM
Tealeaf cxOverstat. For supported versions, IBM Tealeaf cxOverstat SDK and IBM
Tealeaf CX UI Capture for AJAX SDK can coexist on the same page. See "Client
Framework Versions" in the IBM Tealeaf Client Framework Data Integration Guide.
Include location on the page
Pages are tracked by adding the IBM Tealeaf CX UI Capture SDK solution.
Place references to the JavaScript as high as possible on each web page that
requires usability tracking.
v The lowest location on the page where the JavaScript references can be inserted
is just after the opening <BODY> tag. This location is useful if you are not tracking
all of the pages of your web application.
Note: IBM Tealeaf cxOverstat requires the IBM Tealeaf CX UI Capture SDK
solution. See "UI Capture j2 Guide" in the IBM Tealeaf UI Capture for j2 Guide.
v IBM Tealeaf cxOverstat is not compatible with the older version of IBM Tealeaf
CX UI Capture for AJAX.
10
cxOverstat User Manual
Gathered data
Most high-volume sites have sufficient site visitors to gather meaningful data for
analysis within a few minutes. Low-volume sites might have to wait a few days to
obtain meaningful insights.
Data Retention
cxOverstat data retention is customizable, allowing customers to minimize data
storage size by choosing how long their data will be stored. By default, hourly
data is retained for 3 days, while daily data is retained for 90 days.
To change the default data retention time period in the Tealeaf Portal, go to Tealeaf
> Portal Management > CX Settings > Data Retention. Click on the value you want
to change. Enter the new value in the form near the bottom of the page, and click
Save.
cxOverstat daily aggregation defaults to daily through previous day. This ensures
that cxOverstat daily data is always available as of yesterday, and a request for
information will use a daily table for all date duration other than the current day.
Note: For current cxOverstat customers who upgrade to 9.0.2, the next time the
daily aggregation runs, it will start to back-populate the cxOverstat daily data table
and the customer could see increased processing on their SQL servers. The
recommendation for large customers is to process this over the weekend.
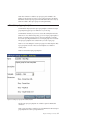
Defining cxOverstat as the Tealeaf start page
Users can define the start page that appears when they log in to the Tealeaf Portal.
To
1.
2.
3.
4.
define the start page:
Log in to the Tealeaf Portal.
Click CX User Administration in the left navigation.
Select Users.
Choose a user profile to work with. A gray box appears in the bottom half of
the page.
5. Click the dropdown next to Start Page and select cxOverstat Gallery to enable
Tealeaf to automatically open the Snapshot Gallery when you log in to Tealeaf.
6. Click Save.
Chapter 2. Installing and deploying cxOverstat
11
12
cxOverstat User Manual
Chapter 3. Using cxOverstat overlays
cxOverstat overlays help you visualize customer interactions with your web pages
that are enabled with cxOverstat.
With IBM Tealeaf cxOverstat, you can visualize the behaviors of your visitors on
each page of your web application. From Browser-Based Replay or the Snapshot
Gallery, you can select a page and display multiple features as overlays directly
over the replayed page. The highly visual reports allow for rapid and intuitive
insights into visitor behavior and gives you the ability to customize a report by
filtering the reported data.
Overview: cxOverstat overlays
You can display a cxOverstat overlay while you are viewing a session in Browser
Based Replay (BBR) or while you are viewing snapshots in the Snapshot Gallery.
To open a cxOverstat overlay:
1. Open a session in BBR or a snapshot in the Gallery.
2. From the Overlays menu, select the overlay that you want to see.
When an overlay is displayed, you can use the provided interface to customize the
report. For more information, see Chapter 4, “cxOverstat interface,” on page 41.
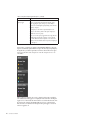
The following table describes the overlays that are available through cxOverstat.
Table 2. cxOverstat Overlays
cxOverstat Overlay
Description
Form Analytics
The Form Analytics overlay evaluates the
effectiveness of a form in capturing entered
information and how well visitors are able to
complete it. In addition to information about data
entry, the Form Analytics overlay can monitor dwell
time on individual fields. If the form was not
completed, this might be an indicator of customer
struggle and drop-off rates.
For more information, see “Using the Form Analytics
overlay” on page 14.
Link Analytics
The Link Analytics overlay indicates the most
frequently clicked links and hovered links on a page.
Link Analytics overlays show the relative popularity
of links, which informs web developers of any need
to change the layout of a specific page or the overall
navigation for the web application.
For more information, see “Using the Link Analytics
overlay” on page 22.
© Copyright IBM Corp. 1999, 2015
13
Table 2. cxOverstat Overlays (continued)
cxOverstat Overlay
Description
Comparison Analytics
With the Comparison Analytics overlay, you can
visually identify customer interaction with a web
page and create custom reports by filtering captured
metrics and segmenting dimension data within the
overlay. You can create a single report that displays
the patterns of two metrics or create a more detailed
report that compares how different groups of users
are interacting with the web page. From here, you
can identify any usability issues that might have an
impact on a specific user segment.
For more information, see “Using the Comparison
Analytics overlay” on page 25.
Heat Map
The Heat Map overlay identifies the regions of a page
where visitors click or hover, regardless of whether
there is anything to click or not. Heat Maps provide a
useful method of identifying usability flaws; for
example, if visitors are clicking a large logo at the top
of the page, there might be expectations of a link
back to the site's home page.
For more information, see “Using the Heat Map
overlay” on page 30.
Attention Map
The Attention Map displays color bands within the
browser window to identify the areas that are most
consistently shown to visitors of the page. These
color bands can be used to evaluate the objects on the
page that are most frequently placed in front of the
visitor, and the ones that are not receiving much
attention.
For more information, see “Using the Attention Map
overlay” on page 35.
Accessibility Analytics
The Accessibility Analytics overlay evaluates the type
of website issues that might affect users with visual,
auditory and physical impairment. Accessibility
Analytics uses pins to show where issues exist on a
cxOverstat-enabled web page.
Contrast Analytics
The Contrast Analytics overlay evaluates difficulties
users might encounter when viewing items on a
website due to color contrast. Contrast Analytics uses
pins to show where color contrast issues exist on a
cxOverstat-enabled web page.
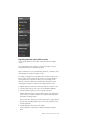
Using the Form Analytics overlay
The Form Analytics overlay helps to evaluate the effectiveness of a form that
enables visitors to enter data.
Based on the data-driven metrics on dwell time for specific fields, you can use the
Form Analytics overlay to evaluate if visitors are confused by individual fields and
if they are quitting a process because of the form. Only form fields that are visible
on the page are displayed.
14
cxOverstat User Manual
Note: The data that a customer enters in a form field is not captured by IBM
Tealeaf cxOverstat.
Data might be collected as part of other client-side capture solutions that might
have been deployed with your web application.
Viewing the Form Analytics overlay
You can view the Form Analytics overlay to analyze data, as well as the Form
Funnel report.
To open the Form Analytics overlay:
1. Open a session in BBR or a snapshot in the Gallery.
2. Click Overlays.
3. Select Form Analytics.
The default Form Analytics report displays the Form Funnel report.
v To reposition the report in the overlay, click and drag the bar at the bottom of
the report to move it from one side of the screen to the other.
v In the top toolbar, you can apply dimensional filters to the displayed overlay.
See Chapter 4, “cxOverstat interface,” on page 41.
v Next to the dimension filter, click the Calendar button to change the range of
dates that are displayed in the overlay data. See Chapter 4, “cxOverstat
interface,” on page 41.
The Form Analytics overlay contains three reports:
v “Modifying the Form Analytics overlay view”
v “Dwell Time report” on page 18
v “Repeats report” on page 20
Modifying the Form Analytics overlay view
The Form Funnel report shows the percentage of visitors who accessed each field
based on the number of visitors who started filling out the form. The number of
visitors who started filling out the form is defined as the count of entries in the
first form field that is not disabled.
For example, if 500 people view a page and 100 of the visitors enter a value in the
first enabled field in a form, then the value 100 is the denominator for calculations.
If only 60 of those 100 visitors were able to complete the form, the drop off value
is 40%, and the completion value is 60%.
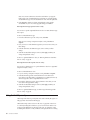
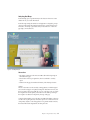
The following graphic is an example of a Form Funnel report:
Chapter 3. Using cxOverstat overlays
15
The report displays the completion percentage of each field. You can hover your
mouse over the field to view the exact number of users that continued to the next
field and the number of users that abandoned the form before they went to the
next field. The field with the highest drop-off rate is displayed in bold and red
colored text.
Note: The delta for each field is the drop-off rate for the field and represents the
number of users that continued from the previous field but left the page without
going to the next field.
Note: If the pattern of a Form Funnel report appears erratic and does not funnel
from top to bottom, it is likely that users are skipping form fields on the page. If
you remove skipped form fields from the report, the pattern of the report funnels
from top to bottom.
The report also displays the total completion and drop-off rates for the entire form.
This information can help optimize a form to improve the conversion rate. For
16
cxOverstat User Manual
example, if some fields are rarely getting completed and your drop-off rate is too
high, you might infer that the fields should be redesigned, made optional, or
removed from the form.
To see the object on the page to which an item in the report corresponds, move the
mouse over the name in the left column. The object on the page is highlighted in
the replay window.
For more information on the rates that are displayed at the bottom of the form, see
“Conversion rates” on page 22.
You can also exclude, include, or reorder a field in the report:
v To exclude the selected field from the report, click the - icon. The data on the
field is replaced by the Excluded string.
v To include an excluded field again, click the + icon.
v To reorder a field that is displayed in the report, use your mouse to drag the left
margin of the field to the new location in the report. The completion and
drop-off rates will automatically adjust after the field is moved.
You can also view completed and abandoned sessions for a selected field in the
Form Funnel report.
To
1.
2.
3.
view a session from the Form Funnel report:
Move your cursor over a form field in the Form Funnel report.
Click the session view icon to the right of the field name.
After you click the session view icon, select View Completed Sessions or View
Abandoned Sessions. Depending on the information that was submitted to the
form, only one session type might be available for a specific form field. For
information about the requirements for each type of session, see “Viewing form
completion” on page 18 and “Viewing form analytics reports.”
From the Session List, you can analyze or replay the sessions.
Viewing form analytics reports
The Form Funnel report shows the percentage of visitors who abandoned or
completed sessions for a selected field.
Viewing form abandonment:
For a selected field, you can generate a set of sessions that meet the following
criteria for the specified date range.
1. The first active form field is present (Whitelist first form field Target ID
dimension value).
2. The selected form field is not present (Blacklist selected form field Target ID
dimension value).
Note: Dimension filters can be applied to the Form Analytics overlay.
Viewing form completion:
For a selected field, you can generate a set of sessions that meet the following
criteria for the specified date range.
1. The first active form field is present (Whitelist first form field Target ID
dimension value).
Chapter 3. Using cxOverstat overlays
17
2. The selected form field is present (Whitelist selected form field Target ID
dimension value).
Generated reports are displayed as a set of sessions in the Portal.
Viewing form completion
The Form Funnel report shows the percentage of visitors who completed sessions
for a selected field.
For a selected field, you can generate a set of sessions that meet the following
criteria for the specified date range:
1. The first active form field is present (Whitelist first form field Target ID
dimension value).
2. The selected form field is present (Whitelist selected form field Target ID
dimension value).
Note: Dimension filters can be applied to the Form Analytics overlay.
Generated reports are displayed as a set of sessions in the Portal.
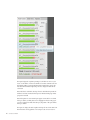
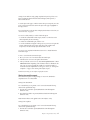
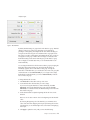
Dwell Time report
The Dwell Time report displays the average dwell time in seconds for each field in
the form. The field with the highest dwell time is displayed in red and bold text.
18
cxOverstat User Manual
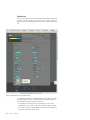
Figure 1. Dwell Time
Note: Unique identifiers are provided for each selectable object on the page. See
"Building web Applications with Tealeaf in Mind" in the IBM Tealeaf CX Installation
Manual.
The names of each field in the form are displayed with a bar graph and the
average amount of time, in seconds, that the field is focused on. The example
Dwell Time report shows that the billing:postcode field has an average dwell
time of 14 seconds.
Note: If this field is the default-selected field when the web page loads, the dwell
time for that field might not be significant. Visitors might be reading the page
while the cursor is in this field. If this field is not selected by default, it can
indicate that the field is hard for visitors to resolve. For example, there might be
some confusion around the instructions, or the field might be asking for
information that the visitor was not instructed in an earlier step to provide.
Chapter 3. Using cxOverstat overlays
19
To see the object to which an item corresponds, move the mouse over the name of
the field in the report. You can also exclude a field by placing the mouse cursor
over the field; then, click the - icon next to the field. When the field is excluded,
the data for the field is displayed as Excluded. To include the field back into the
report, click the + icon.
You can also reorder the report by dragging the left margin of a field up or down
in the list.
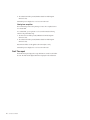
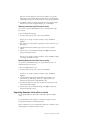
Repeats report
IBM Tealeaf cxOverstat can track the number of times a user clicks in each field
more than once. A counter is used for each field to track how many extra times a
user placed the cursor in the field.
For example, if a user clicked in a field 3 times, the counter records two repeats.
The Repeats report displays each field on the web page and how many times after
the initial click that each field was clicked again. A high number of repeated clicks
can indicate a problem with the field or the instructions for the field. The field
with the highest number of clicks is displayed in red and bold text.
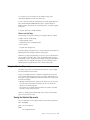
In the following example, the Repeats report displays the average repeated
click-rate for each form field that is captured on the page.
20
cxOverstat User Manual
Figure 2. Repeats
The names of each field are defined in the HTML object for the field.
Note: Provide unique identifiers for each selectable object on the page. See
"Building web Applications with Tealeaf in Mind" in the IBM Tealeaf CX Installation
Manual.
The names of each field in the form are displayed with a bar graph and the
number of extra times that the user placed the cursor in the field.
To see the object to which an item corresponds, move the mouse over the name of
the field in the report. You can also exclude a field by placing the mouse cursor
over the field; then, click the - icon next to the field. When the field is excluded,
the data for the field is displayed as Excluded. To include the field back into the
report, click the + icon.
You can also reorder the report by dragging the left margin of a field up or down
in the list.
Chapter 3. Using cxOverstat overlays
21
Conversion rates
Conversion rate is the percentage of all unique visitors who take a wanted action
upon visiting your site. Most companies typically think of conversion rate in the
context of making a purchase or transaction, but the wanted action can also be
submitting a sales lead, viewing a key page of the site, downloading a white
paper, or some other measurable action.
The following conversion rates are reported at the bottom of each Form Analytics
report:
Term
Description
Completion
This metric indicates the percentage of visitors who completed the form
that is compared to the number of visitors who started the form.
Deltas This metric indicates the percentage of visitors who completed a previous
field but abandoned the form before they entered a value for the current
field.
Drop Off
This metric indicates the percentage of visitors who dropped off the form
before they completed it when compared to the number of visitors who
started the form.
Averaged across X counts
This metric is the focus-count value of the first active form field and is
used as the denominator for the completion percentage calculations. For
each form field, the focus count is divided by X, which returns the
completion percentage.
Using the Link Analytics overlay
The Link Analytics overlay displays numeric information about the links that
visitors interact with on the current page.
This overlay is useful in assessing the order and positioning of links on the page to
ensure that visitors are being properly cued to select the objects of greatest utility.
You can also export the data to the report builder for further analysis.
Note: For a selected page, the Link Analytics overlay contains no data until at
least one selectable area on the page is clicked.
When the Link Analytics overlay is displayed, you can customize the report by:
v Applying a new range of dates for the report (see “Changing the date range” on
page 42)
v Toggling which metrics are displayed (see “Applying metrics to a cxOverstat
report” on page 42)
v Customize the frequency type and the number of elements that are displayed for
each metric. For example, you can configure the report to display the most
occurrences, the least occurrences, and also specify the maximum number of
elements that are displayed in the report (see “Customizing Link Analytics
elements” on page 44).
v Filtering the data by dimension types and dimension values (see “Filtering
dimension values within an overlay” on page 44)
22
cxOverstat User Manual
Viewing the Link Analytics overlay
Link Analytics is available in BBR or the Snapshot Gallery when you view a page
that was configured to capture cxOverstat data.
To access Link Analytics:
1. Open a session in BBR or a snapshot in the Gallery.
2. Select a page where IBM Tealeaf cxOverstat data is collected.
3. Click Overlays.
4. Select Link Analytics.
The Link Analytics overlay enhances the heat map overlay with quantitative data
that indicates the percentage of clicks for each pinned object on the page as
compared to the total number of clicks per page.
Viewing click-rate metrics
When you hover the mouse over the pushpin, the object for that pushpin is
highlighted. If you click the pushpin, the analytics for the object are displayed.
The following analytics are recorded for the object:
Table 3. Pushpin object data summary
Analytic
Description
Click-rate
Click-rate captures the number of times that the object was clicked
compared to the total number of clicks for the web page. The
percentage that is displayed is calculated by dividing the number of
clicks that are recorded for the object by the total number of clicks for
the page. The object data also displays how many times the object was
clicked.
Hover-rate
Hover-rate captures how many times an object was hovered on for
more than 1 second. A hover is when the mouse pointer is placed on
top of an object. The object does not need to be clicked to capture this
data. The object data also displays how many times the object was
hovered on.
The hover-rate percentage is calculated by dividing the total number of
hovers that are recorded for the object by the total number of hovers
for all objects on the page.
Note: The default time value to register a hover is one second. You can
change this value in the CX UI Capture SDK. See the IBM Tealeaf CX UI
Capture Quick Start Guide for more information.
Hover-to-click
Hover-to-click captures the number of times that an object was hovered
on for more than 1 second and then the object was clicked.
The hover-to-click percentage is calculated by dividing the total number
of hover-to-click actions that are recorded for the object by the total
number of hover-to-clicks for all objects on the page.
Note: The default time value to register a hover is one second. You can
change this value in the CX UI Capture SDK. See the IBM Tealeaf CX UI
Capture Quick Start Guide for more information.
Chapter 3. Using cxOverstat overlays
23
Table 3. Pushpin object data summary (continued)
Analytic
Description
Avg hover time
Average hover time captures the average amount of time that an object
is hovered on without being clicked. The unit of time is measured in
seconds. The object data also displays how many times the object was
hovered on.
Note: The default time value to register a hover is one second. You can
change this value in the CX UI Capture SDK. See the IBM Tealeaf CX UI
Capture Quick Start Guide for more information.
Avg
hover-to-click
Average hover-to-click captures the average amount of time that an
object is hovered on before it is clicked. The unit of time is measured in
seconds. The object data also displays how many times the object was
hovered on and then clicked.
While you are viewing the object data, you can place your mouse in the right
margin of a statistic to display the report icon. Clicking the report icon opens the
Report Builder where you can create a report. For more information about the
Report Builder, see the IBM Tealeaf Reporting Guide.
Modifying the Link Analytics overlay display
In the Link Analytics overlay, a pushpin is shown next to objects that are clicked or
hovered by a statistically significant percentage of visitors. The default metric that
is displayed in the Link Analytics overlay is the click-rate metric. This section
describes how the click-rate metric is displayed in the report. If other metrics are
applied to the overlay, they function similarly.
v Pushpins are numbered to indicate the popularity ranking of the percentage of
visitors who clicked the object. For example, by default, the number 1 pushpin is
the most popular object clicked on the page.
v Highlighted pushpins represent the five most popular objects on the web page.
v Located next to the pushpin is the click-rate percentage, which is the percentage
of users who clicked the object.
v By default, the top 20 elements are displayed.
v When screen objects appear in the same location, pushpins are cascaded to
prevent one pushpin from covering another. The overlay draws a line between
the pushpin and the location of the web page where the clicks occurred.
Note: If you drag a pushpin on top of another pushpin, the pushpin that you
just moved hides the pushpin below it. You can click and drag any push pin to
a new location on the screen. An indicator line ties the pushpin to the object
v In the top toolbar, you can apply dimensional filters to the displayed overlay.
See Chapter 4, “cxOverstat interface,” on page 41.
v In the top toolbar, you can change the range of dates that are displayed in the
overlay data. See Chapter 4, “cxOverstat interface,” on page 41.
When the Link Analytics overlay is displayed, you can customize the report by:
v Applying a new range of dates for the report (see “Changing the date range” on
page 42)
v Toggling which metrics are displayed (see “Applying metrics to a cxOverstat
report” on page 42)
v Customize the frequency type and the number of elements that are displayed for
each metric (see “Customizing Link Analytics elements” on page 44)
24
cxOverstat User Manual
v Filtering the data by dimension types and dimension values (see “Filtering
dimension values within an overlay” on page 44)
Using the Comparison Analytics overlay
You can compare metrics or dimensions side-by-side, as well as segment data, by
using the Comparison Analytics overlay.
When you replay a cxOverstat-enabled web page, you can use Comparison
Analytics to customize a report that can help you to visually identify customer
interaction with the web page.
You can use this information to help identify the user focus on a page. This
information can be used to discover design flaws with a web page. The report can
be exported to a PDF file or to a Microsoft Excel file that can then be imported into
a presentation or into another reporting tool.
The following metrics are recorded into dimensions that are related to cxOverstat
and are visually represented through the overlay:
Table 4. cxOverstat metrics
Metric
Description
Clicks
Displays all of the clicks for a page.
Hovers
Captures each hover point on a page. A hover is when the mouse
pointer is placed on top of an object for more than 1 second. The object
does not need to be clicked to capture this data.
Note: The default time value to register a hover is one second. You can
change this value in the CX UI Capture SDK. See the IBM Tealeaf CX UI
Capture Quick Start Guide for more information.
Hover-to-click
Hover-to-click captures each time that an object was hovered on for
more than 1 second and then the object was clicked.
Note: The default time value to register a hover is one second. You can
change this value in the CX UI Capture SDK. See the IBM Tealeaf CX UI
Capture Quick Start Guide for more information.
Avg hover time
Average hover time captures the average amount of time that an object
is hovered on without being clicked. The unit of time is measured in
seconds. The object data also displays how many times the object was
hovered on.
Note: The default time value to register a hover is one second. You can
change this value in the CX UI Capture SDK. See the IBM Tealeaf CX UI
Capture Quick Start Guide for more information.
Avg
hover-to-click
time
Average hover-to-click captures the average amount of time that an
object is hovered on before it is clicked. The unit of time is measured in
seconds. The object data also displays how many times the object was
hovered on and then clicked.
Viewing the Comparison Analytics overlay
The Comparison Analytics user interface gives you the ability to customize a
report that can be used to isolate user interactions with a web page.
To access Comparison Analytics:
1. Open a session in BBR or a snapshot in the Gallery.
2. Select a page where IBM Tealeaf cxOverstat data is collected.
3. Click Overlays.
Chapter 3. Using cxOverstat overlays
25
4. Select Comparison Analytics.
When the Comparison Analytics overlay is displayed, you can customize the
report by:
v Applying a new range of dates for the report (see “Changing the date range” on
page 42)
v Toggling which metrics are displayed (see “Applying metrics to a cxOverstat
report” on page 42)
v Applying thresholds to the available metrics (see “Changing metrics thresholds”
on page 42)
v Segmenting the data by dimension types and dimension values (see
“Segmenting dimension values within an overlay” on page 29)
v Filtering the data by dimension types and dimension values (see “Filtering
dimension values within an overlay” on page 44)
Modifying the Comparison Analytics overlay display
You can use a legend to adjust how the metrics are displayed when you view a
Comparison Analytics overlay.
The Comparison Analytics overlay provides a legend to help you identify the
metrics that are represented in a report. You can use the legend to conduct the
following tasks:
v Identify which metrics are displayed in the report
v Make a metric visible or invisible in the report
v Filter the report by opacity
The following image shows an example of the legend:
In this example, clicks, hovers, hover-to-clicks, average hover time, and average
hover-to-click time are enabled for the report. For information on how to apply a
metric to a cxOverstat report, see “Applying metrics to a cxOverstat report” on
page 42.
There are four major parts of the Comparison Analytics legend:
26
cxOverstat User Manual
Table 5. Comparison Analytics legend description.
Function
Description
Title bar
Use the title bar to drag the legend to another location on the
screen. To move the legend to another location on the screen:
1. Place your mouse over the title bar.
2. Press and hold the primary mouse button; then, use your
mouse to drag the window to a new location on the screen.
3. Release the primary mouse button after the legend is
relocated to its new position on the screen.
Legend
Identifies each metric that is applied to the report and its
associated symbol. The following symbols are used to identify
the available metrics:
v
Clicks: Circle
v
Hovers: Square
v
Hover-to-clicks: Diamond
v
Average hover time: Pentagon
v
Average hover-to-click time: Triangle
You can hide an individual metric from the report by clicking
the metric that you want to hide. When a metric is hidden in
the report, the legend is updated by:
v Removing color from the symbol next to the metric
v The text for the metric is colored dark gray
Click the metric again to make it visible in the report.
Legend toggle
Hides or displays all of the metrics that are listed in the
legend. This feature can be used to hide all of the
metric-related symbols and make the page easier to view.
Click the legend toggle to switch between displaying all of the
selected metrics in the report or hiding all of the selected
metrics from the report.
Chapter 3. Using cxOverstat overlays
27
Table 5. Comparison Analytics legend description. (continued)
Function
Description
Opacity toggle
Displays only the metrics that match the selected opacity
levels. Toggling the opacity level gives you the ability to
generate a more meaningful report by hiding values with low
frequency or impact.
The frequency of each metric is represented by the color
opacity of each metric's symbol in the report. Frequency is
divided into 5 levels of opacity:
When you view the opacity toggle from left to right, the first
clickable selection represents a frequency of 100% through
80%. Each additional selection represents a 20% decrease in
frequency. The last clickable selection represents a frequency of
20% through 1%.
If new metrics or segments are applied to the Comparison Analytics overlay, the
legend is automatically updated with the changes. The following example displays
the legend after you add the segmentation for Firefox and Chrome browser-types
to the report and remove the average hover time and average hover-to-click
time metrics.
When segments are applied to the overlay, a legend toggle becomes available for
each enabled metric. The toggle icon is displayed next to each metric. Clicking the
toggle icon for a metric hides the elements that are associated with the metric from
the report. In this example, the Legend toggle next to Hovers is clicked which
hides all of the hover elements from the report. The legend toggle is colored red
when it is toggled to off.
28
cxOverstat User Manual
Segmenting dimension values within an overlay
You can segment dimension values within a cxOverstat Comparison Analytics
overlay.
You can add dimension-value segments to a Comparison Analytics overlay to
isolate particular dimension values within the report.
Note: A combination of up to 12 selected metrics, dimensions, or dimension values
can be displayed in a Comparison Analytics overlay.
For example, you might want to see the click and hover metrics for each browser
that was used to view the web page. In this scenario, you can apply dimension
value segments to the overlay. You can select up to six browser types for the
dimension values. This combination of selected metrics and dimension values
would equal the maximum of 12 items that can be displayed in the overlay.
To segment a dimension value within a cxOverstat Comparison Analytics overlay:
1. From the toolbar at the top of the overlay screen, click Filter or Segment.
2. Select the dimension type that you want to segment in the report.
Only the dimensions that are associated with the events that are capturing data
for the overlay are available for selection. See "Eventing for cxOverstat" in the
IBM Tealeaf Event Manager Manual.
Note: You can enter a dimension type in the search field. As you type, the field
provides a list of matching dimension types. You can select a dimension name
from the updated list.
3. Select the dimension values that you want to filter.
The list of dimensions values that are available for the dimension type are
listed.
Chapter 3. Using cxOverstat overlays
29
Note: You can enter a dimension value in the search field. As you type, the
field provides a list of matching dimension values that are associated with the
selected dimension type. You can select dimension values from the updated list.
4. Click Segment to submit your changes and update the overlay with the
selected filters. If you do not want to apply the changes, click Cancel.
Removing dimension-type segments from an overlay:
You can remove a specific segmented dimension-value or an entire dimension type
from a report.
To remove a filtered dimension type:
1. From the toolbar at the top of the overlay screen, click Filter.
Note: If you are viewing a Comparison Analytics overlay, click Filter or
Segment.
2. Place your mouse over the dimension type that you want to remove from your
filter settings.
3. Click the red X next to the dimension type to remove it from your filter
settings.
4. When all unwanted filter settings are removed, click Apply to submit your
changes and update the overlay.
To remove a segmented dimension value, see “Removing dimension-value filters
from an overlay” on page 45.
Removing dimension-value segments from an overlay:
You can remove a dimension type or a specific dimension value from a segmented
Comparison Analytics overlay.
To remove a filtered dimension value:
1. If you are viewing a Comparison Analytics overlay, click Filter or Segment.
2. Click the dimension type that contains the dimension value that is to be
removed from your filter settings. A segmentation icon is displayed next to any
dimension type that contains a segmented dimension value.
3. From the list of dimension values, clear any dimension values that you want
removed from the segmentation settings.
4. When all unwanted filter settings are removed, click Apply to submit your
changes and update the overlay.
To remove a segmented dimension type, see “Removing a dimension-type filter
from an overlay” on page 45.
Using the Heat Map overlay
cxOverstat provides heat map overlays that can be used to identify the regions of a
web page where visitors interact with the page.
cxOverstat heat maps can be used to view the areas of a page that visitors hover
on or click. By tracking this user behavior, you can see where users tend to focus
on the page and identify flaws in the design of the page. For example, if visitors
are clicking items that have no links, it indicates some expectation that is not being
30
cxOverstat User Manual
met by the site. Similarly, visitors that fail to click the appropriate links provide an
indication that the link is not properly designed or positioned on the page.
Using Heat Maps
cxOverstat provides heat map overlays that can be used to identify the regions of a
web page where visitors interact with the page.
To view the Heat Map overlay:
1. Open a session in BBR or a snapshot in the Gallery.
2. Select a page where IBM Tealeaf cxOverstat data is collected.
3. Click Overlays.
4. Select Heat Map.
The "heat" associated with each spot on the map indicates the frequency of clicks
that are made in that area relative to the rest of the page. An area that is clicked
can be anything; it does not have to be an active link. A click can be registered by
any HTML-based object that is rendered by the DOM.
Click spots are associated with individual objects on the screen, which helps
pinpointing the following elements:
v You can see exactly where people selected the object. For example, if a link is a
long sentence, you can see whether they clicked at the beginning, middle, or end
of the sentence.
v If the object moves because of scrolling the page or resizing of the browser, the
heat spots are repositioned with the object.
v In the top toolbar, you can apply dimensional filters to the displayed overlay.
See Chapter 4, “cxOverstat interface,” on page 41.
– You can also focus on specific areas of the page and then generate a report on
the data. See “Selection area” on page 34.
v In the top bar, you can also change the range of dates that are displayed in the
overlay data. See Chapter 4, “cxOverstat interface,” on page 41.
Heat Map legend overview
The following metrics are recorded into dimensions that are related to cxOverstat
and are visually represented through the overlay:
Table 6. cxOverstat metrics
Metric
Description
Clicks
A click heat map provides a visual display of the areas where visitors
clicked the page, whether there is any link to click or not.
Hovers
Captures each hover point on a page. A hover is when the mouse
pointer is placed on top of an object for more than 1 second. The object
does not need to be clicked to capture data.
Note: The default time value to register a hover is 1 second. You can
change this value in the CX UI Capture SDK. See the IBM Tealeaf CX UI
Capture j2 Guide for more information.
Hover-to-click
Hover-to-click captures each time that an object was hovered on for
more than 1 second and then the object was clicked.
Note: The default time value to register a hover is 1 second. You can
change this value in the CX UI Capture SDK. See the IBM Tealeaf CX UI
Capture j2 Guide for more information.
Chapter 3. Using cxOverstat overlays
31
Table 6. cxOverstat metrics (continued)
Metric
Description
Avg hover time
Average hover time captures the average amount of time that an object
is hovered on without being clicked. The unit of time is measured in
seconds. The object data also displays how many times the object was
hovered on.
Note: The default time value to register a hover is 1 second. You can
change this value in the CX UI Capture SDK. See the IBM Tealeaf CX UI
Capture j2 Guide for more information.
Avg
hover-to-click
time
Average hover-to-click captures the average amount of time that an
object is hovered on before it is clicked. The unit of time is measured in
seconds. The object data also displays how many times the object was
hovered on and then clicked.
Intensity
The relative frequency of clicks is indicated by a gradient color, from gray,
indicating a low number of clicks, to red indicating a high number of clicks.
Below is the color gradient spectrum:
Figure 3. Heat map color gradient
In the table below, you can see the color coding for heat map spots.
v The percentages below indicate the percent of visitors during the time period
who viewed a page.
Note: The intensity is relative to the page. Intensities between pages are not
relative. For example, a red area on Page A does not mean that the area received
the same number of clicks as a red area on Page B.
Color
Percentage clicked
Gray
0 - 2.5%
Blue
2.5 - 12.5%
Teal
12.5 - 30%
Green 30 - 50%
Yellow
50 - 70%
Orange
70 - 90%
Red
90 - 100%
If there is no color in an area, it means that no visitors or a small percentage of
visitors clicked there.
32
cxOverstat User Manual
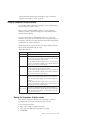
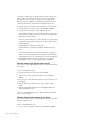
Analyzing Heat Maps
In the Heat Map, spots of greater intensity are the locations where more visitors
clicked. How do you use this information?
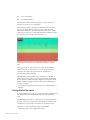
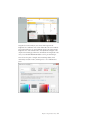
In the following example, the tealeaf.com web application is designed to prompt
visitors to make inquiries about Tealeaf products and to contact Tealeaf for more
information. A heat map is generated to analyze visitor behaviors on the home
page (http://www.tealeaf.com).
Figure 4. Heat Map Example
Observations
v The primary content area is the Discover CEM toolbar and the large image in
the middle of the page.
v Most clicks are in the top navigation bar, which is considered a secondary
option.
v Further down the page, the number and intensity of the heat maps decrease.
Analysis:
The above observations can be caused by scanning patterns, in which the typical
user scans the web page in an F-pattern, starting from the banner. However, since
the top navigation ("Discovery CEM") bar is so low on the page, users can confuse
the navigation bar with the primary content below it. The relative positioning of
the navigation can detract from the primary message of the page.
A simple solution might be to move the Discover CEM toolbar higher on the page,
even above the top navigation bar, where these options are overlooked. Since one
of the primary objectives of the web application is to generate interest from users,
the Contact link must be integrated into the main panel area.
Chapter 3. Using cxOverstat overlays
33
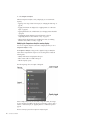
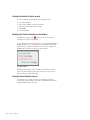
Selection area
You can use the Selection tools to drill into usability data. When the Selection tools
are used to surround a specific area of color, you can open a menu of options for
drilling down into the underlying data and the sessions of visitors who clicked the
area.
Figure 5. Heat Map Selection Tools and Selection Area
To use the rectangle selection tool, click Sub-Select from the toolbar. The selection
tool is displayed in the overlay. Located next to the tool is listed the number of
heat map data points that are within the selection area.
v To change the size of the selection tool, click and drag one or more of the
perimeter dots to a new location on the screen. The selection shape is changed.
v To move the selection tool, click the middle of the selection area and drag it to a
new location. The selection shape is moved.
34
cxOverstat User Manual
As you change or move the selection area, the number of data points is
automatically updated based on the new selection area.
To view a report that contains the selected data points and the applied dimension
filters, click View report from this data. The report is opened in the Report
Builder, with the events, dimensions, and date range of the overlay that is applied
in the report.
To close the selection area, click Close selector.
When to run Heat Maps
For best results, you can generate heat maps around specific intervals of interest.
Examples of when to run Heat Maps:
v
v
v
v
During high traffic periods
With feature rollouts or marketing initiatives
Over a weekend
At specific times during the day
By analyzing during a targeted period, you can gain insight into visitor behavior at
different time intervals and target content for specific groups.
Note: Before you begin using Heat Maps, it is necessary to allow sufficient time to
elapse to gather a reasonable volume of data. The minimum number of points to
be statistically accurate is 10,000 clicks. For frequently visited pages, this minimum
is quickly met. For less frequently visited pages, you must verify that you have
sufficient points by using the Selection Tool to count the current points.
Using the Attention Map overlay
An attention map provides visual information about the areas of your web page
that are framed in the browser window.
Using a color-banding mechanism, an attention map identifies the areas that are
most consistently displayed in the visitor's browser window. Typically, this area is
the top part of a page, and IBM Tealeaf cxOverstat marks these areas with a green
horizontal color banding.
v IBM Tealeaf cxOverstat monitors attention in the vertical access only; all points
across the same horizontal band are marked in the same color. Horizontal
attention is not currently supported.
v Areas that are less consistently displayed in the browser window are marked
with yellow, orange, and red color tones.
Note: For a selected page, the Attention Map overlay contains no data until the
page is seen by at least one visitor.
Viewing the Attention Map overlay
The color scheme that is used to display attention uses the following mechanism:
Color
Description
green
Area of most attention.
yellow
Area of frequent attention.
Chapter 3. Using cxOverstat overlays
35
red
Area of some attention.
blue
Area of limited attention.
Note: Attention intensities are relative to the page. You cannot compare color
gradations across pages of your web application.
In the following example, the vertical bar is scrolled partially down the entire
page. The color clearly shifts from yellow to red across a single line, which
indicates where the bottom of the screen is displayed for most visitors. This line,
which is known as the "fold," is a sharp delineator between content that is likely to
be viewed and processed by visitors and content that is not.
IBM Tealeaf cxOverstat monitors the areas that are framed by your visitors and
transmits that coordinate information to IBM Tealeaf cxOverstat on a periodic
basis.
Each page is divided into 10-pixel increments. For each segment, IBM Tealeaf
cxOverstat tracks the amount of time that it is viewed. This total time is then
compared to the average for the page. Based on the computed result, a
color-appropriate banding is displayed.
When IBM Tealeaf cxOverstat attention data is transmitted to an IBM Tealeaf
cxOverstat user's browser, all data is averaged and normalized to the destination
browser's dimensions. Attention data that is displayed on one browser looks like
attention data that is displayed on another one being used at a different screen
resolution, for example.
v Any data that exists beyond the end of the page as it is rendered in BBR is not
displayed.
Viewing Attention Map reports
By using the Attention Map overlay, you can open a report that contains the events
and optional dimensions that track Attention Map data for the specified date
range.
Click View Report in the toolbar to open the report in the Tealeaf Report Builder.
The report contains all of the Tealeaf events that track attention information with
any dimensions you specify in the overlay that is also specified in the report.
Note: When you open an Attention Map report in Report Builder:
v The date range of the overlay is applied to the report.
36
cxOverstat User Manual
v The report can be modified and saved as needed in the Tealeaf Report Builder.
See "Tealeaf Report Builder" in the IBM Tealeaf Reporting Guide.
Using the Accessibility overlay
The Accessibility overlay evaluates the type of website issues that might affect
users with visual, auditory or physical impairment.
The Accessibility overlay uses pins to identify page elements that violate WCAG
2.0 standards, categorizes these issues by severity, and provides additional
information on the disabilities impacted. It specifically targets issues that might
arise for people with disabilities such as vision impairment, who use screen
readers and other tools to access web pages.
v In the top toolbar, you can change the severity that is displayed on the overlay.
Viewing Accessibility metrics
Accessibility issues appear as pins:
signifying a violation,
signifying a
signifying that it is recommended to review the issue.
potential violation and
Click the pin to expand, and view the issue in greater detail. The legend can be
viewed in the Severity box, which shows each issue rating next to it's
corresponding icon. The violation, potential violation, or recommendation that
appears most often will be at the top of the queue. You can choose which issues
will display on top of the snapshot as icons, by selecting the check box next to the
issue in the Severity dropdown menu.
To access the help section, select the pin that you are working with and click Show
Details. This brings you to an external page that contains additional information
about the issue you selected.
Relocating Pushpins
Depending on the number or location of pushpins, it can be difficult to analyze
data. You can click and drag any push pin to a new location on the screen. An
indicator line ties the pushpin to the object.
Using the Contrast Analytics overlay
The Contrast Analytics overlay evaluates difficulties users might encounter when
they view items on a website due to a lack of contrast between the foreground text
and the background color. Contrast Analytics uses pins to signify violations of
WCAG2.0 standards on cxOverstat-enabled web pages, and determines where the
contrast issue is located.
Chapter 3. Using cxOverstat overlays
37
Viewing the Contrast Analytics overlay
You can view and analyze data using the Contrast Analytics overlay.
To access Contrast Analytics:
1.
2.
3.
4.
Open a session in BBR or a snapshot in the Gallery.
Select a page where cxOverstat data is collected.
Click Overlays.
Select Color Contrast.
Modifying the Contrast Analytics overlay display
Accessibility issues appear as pins
signifying a violation. Click the pin to
expand, and view the issue in greater detail.
To access the help section, select the pin that you are working with and click Show
Details. This brings you to an external page that contains additional information
about the issue you selected. To analyze the color contrast issues in depth, click
Analyze Colors. This takes you to the Color Contrast Analyser.
Relocating Pushpins
Depending on the number or location of pushpins, it can be difficult to analyze
data. You can click and drag any push pin to a new location on the screen. An
indicator line ties the pushpin to the object.
Viewing Contrast Analytics metrics
A contrast ratio of 4.5 or greater is necessary to avoid being pinpointed as a
violation by the Contrast Analytics overlay. The overlay indicates where there are
potential problems with the contrast ratio.
38
cxOverstat User Manual
Using the Color Contrast Analyser, users can test which foreground and
background color combinations work on their website. Move the cursor within the
Color Contrast Analyser tool to preview different options for the foreground and
background colors on the selected violation. Your adjustments will appear on the
snapshot of the selected page, and the Pass/Fail indicator will change based on the
colors you test. Click the Reset Preview button to remove previewed changes.
Users also have the option of using the Autocorrect Changes button, which
automatically corrects the violation, and changes it to a color combination that
passes.
Chapter 3. Using cxOverstat overlays
39
40
cxOverstat User Manual
Chapter 4. cxOverstat interface
Usability analytics from your website such as heat map, click map, link analytics,
form field analytics and comparison analytics can be accessed as overlays through
Browser Based Replay and Snapshot.
Through Browser Based Replay and Snapshot, you can access features that are
helpful in analyzing usability of any monitored page. Detailed usability analytics
such as heat map, click map, link analytics, form field analytics, and comparison
analytics features are available as overlays. They collect usability information that
is gathered from your web application and store it for seamless retrieval in
Snapshot and BBR.
Note: IBM Tealeaf cxOverstat is a separately licensable component from IBM
Tealeaf CX. please contact your IBM Tealeaf representative.
Before you use cxOverstat, review the prerequisites and limitations for cxOverstat.
For more information, see “Prerequisites” on page 7 and “How cxOverstat works
with other Tealeaf products” on page 2.
When you load a session in BBR and then select an IBM Tealeaf cxOverstat
overlay, BBR displays an overlay on top of the current page. This overlay contains
usability information that is gathered from all visitor sessions that are captured by
Tealeaf over a number of days before the current date.
cxOverstat toolbars
The cxOverstat overlays provide toolbars that can be used to modify the
information that is displayed in the overlay.
The main toolbar at the top of the cxOverstat overlay screen adapts to the type of
overlay that you are viewing. Depending on which overlay you are viewing, some
or all of the following actions are available:
v Change the date range for a report
v
v
v
v
v
For more information, see “Changing the date range” on page 42.
Change the metrics that are displayed
For more information, see “Applying metrics to a cxOverstat report” on page 42.
Filter and Segment data in the overlay
For more information, see “Dimension filters and segmentation overview” on
page 48.
Change the threshold for the selected metrics
For more information, see “Changing metrics thresholds” on page 42.
Subselect a region of focus on a page
For more information, see “Using Sub-select to define a region of focus” on page
47.
Export the data from the overlay
For more information, see “Exporting data from cxOverstat” on page 47.
In addition to the toolbar, the cxOverstat overlay gives you the ability to:
© Copyright IBM Corp. 1999, 2015
41
v Zoom in on a page
For more information, see “Zoom toolbar and the Page Navigator” on page 49.
v Drill down into reports with Report Builder
For more information, see “Using drill-down links” on page 48.
Changing the date range
You can change the date range that is applied to a cxOverstat report.
By default, each overlay displays usability data from the date when the session
occurred and the preceding two weeks. You can specify a new date range for the
report by clicking the current range of dates that is displayed in the toolbar at the
top of the screen.
Figure 6. Date range selector
To change the date range:
1. Click the current range of dates in the toolbar.
2. Select a new date range. You can select a new range from the Quick Select
field or specify a date range by clicking the Start Date and End Date fields.
You can enter dates into the Start Date and End Date fields or select dates
from a calendar.
3. Click Apply to update the report with the new date range.
Applying metrics to a cxOverstat report
When you view Link Analytics, Comparison Analytics, and Heat Maps overlays,
you can select which metrics are displayed in the report.
When you view the Link Analytics or Comparison Analytics overlays, you can
select any combination of clicks, hovers, hover-to-clicks, average hover time, or
average hover-to-click time. When you view the Heat Maps overlay, you can apply
only one metric at a time.
To
1.
2.
3.
specify which metrics are displayed in the report:
Click Metrics in the toolbar at the top of the screen.
Select each metric that you want to display in the report.
Click Apply to apply your selections to the report.
Changing metrics thresholds
When you view a Heat Map or Comparison Analytics report, you can change the
threshold for the metrics that are displayed in the report.
Changing the thresholds of the metrics that are displayed in a report can make the
report easier to read and interpret. For example, increasing the lowest threshold
setting eliminates some of the lower values from the report. You can specify a
threshold for each enabled metric that is displayed in the report. For more
information about enabling or disabling which metrics are displayed in the report,
see “Applying metrics to a cxOverstat report.”
The following image displays the default Threshold menu. The image displays all
of the available cxOverstat metrics that can be enabled in the Comparison
42
cxOverstat User Manual
Analytics report.
Figure 7. Threshold menu
By default, threshold settings are grouped and can be edited as a group. Threshold
settings for clicks, hovers, and hover-to-click metrics are grouped and use
percentages as the beginning and ending threshold values. Threshold settings for
average-hover-time and average-hover-to-click-time metrics are grouped and use
time values (in seconds) as the beginning and ending threshold values. A lock icon
is displayed next each group of metrics. The icon displays a locked status when
the threshold settings for the metrics within the group can be edited as a group.
The icon displays an unlocked status when you can edit the threshold for each
metric individually.
You can change the threshold for all of the metrics within a group by changing the
threshold of the first metric in that group. The new threshold settings are
immediately applied to the rest of the metrics in that group. To change the
threshold of an individual metric, you can click the lock icon next to the group that
contains the metric or select Edit Individually. If you no longer want to change
the thresholds for individual metric, you can clear Edit Individually or click the
lock icon next to the group.
To change the threshold of a metric:
1. Click Threshold from the toolbar at the top of the screen.
2. Locate the threshold for the metric that you want to change.
If you want to change the threshold of a metric individually, select Edit
Individually. To change the threshold for the group, make sure that Edit
Individually is not selected and locate the threshold settings for the first metric
that is listed in the group.
3. Use the threshold slider to adjust the beginning and the end values for the
threshold.
Note: You can also enter a numeric value for the beginning and end threshold
values.
By increasing the beginning value of the threshold, you can eliminate lower
values of the metric from displaying in the report. By decreasing the end value
of the threshold, you can eliminate higher values of the metric from displaying
in the report.
4. Click Apply to update the overlay with your new threshold settings.
Chapter 4. cxOverstat interface
43
Customizing Link Analytics elements
When you view a Link Analytics report, you can customize the frequency of the
metrics that are displayed in the report.
Changing the frequency of the metrics that are displayed in a report can help you
identify how users interact with a web page. You can adjust each metric to display
the most occurrences, the least occurrences, and also specify the maximum number
of elements that are displayed in the report.
By default, metric settings are grouped and can be edited as a group. The settings
for clicks, hovers, and hover-to-click metrics are grouped and the settings for
average hover time and average hover-to-click time metrics belong to a second
group. A lock icon is displayed next each group of metrics. The icon displays a
locked status when the settings for the metrics within the group can be edited as a
group. The icon displays an unlocked status when you can edit the settings for
each metric individually.
To customize the elements that are displayed in the Link Analytics report:
1. Click Customize from the toolbar at the top of the screen.
2. Locate the metric that you want to change.
If you want to edit the settings for this metric individually, select Edit
Individually. To change the threshold for the group, make sure that Edit
Individually is not selected and locate the threshold settings for the first metric
that is listed in the group.
3. Click the Top/Bottom toggle to configure the type of occurrences that you want
displayed in the report. If you want to display the most frequent occurrences of
the metric, select Top. If you want to display the least frequent occurrences of
the metric, select Bottom.
4. Enter the number of elements for the metric that you want to display in the
report. The default setting is to display 20 elements on the screen for each
listed metric.
5. Click Apply to update the overlay with your new settings.
Filtering dimension values within an overlay
You can filter dimension values within a cxOverstat overlay. You can apply
dimension filters to the data that is displayed in a cxOverstat overlay.
To filter a dimension value within a cxOverstat overlay:
1. From the toolbar at the top of the overlay screen, click Filter. If you are
viewing a Comparison Analytics overlay, click Filter or Segment.
2. Select the dimension type that you want to filter.
Only the dimensions that are associated with the events that are capturing data
for the overlay are available for selection. See "Eventing for cxOverstat" in the
IBM Tealeaf Event Manager Manual.
Note: You can enter a dimension type in the search field. As you type, the field
provides a list of matching dimension types. You can select a dimension name
from the updated list.
3. Select the dimension values that you want to filter.
The list of dimensions values that are available for the dimension type are
listed.
44
cxOverstat User Manual
Note: You can enter a dimension value in the search field. As you type, the
field provides a list of matching dimension values that are associated with the
selected dimension type. You can select dimension values from the updated list.
4. Click Apply to submit your changes and update the overlay with the selected
filters. If you do not want to apply the changes, you can click Cancel.
Removing a dimension-type filter from an overlay
You can remove a specific filtered dimension-value or an entire dimension type
from a report.
To remove a filtered dimension type:
1. From the toolbar at the top of the overlay screen, click Filter.
Note: If you are viewing a Comparison Analytics overlay, click Filter or
Segment.
2. Place your mouse over the dimension type that you want to remove from your
filter settings.
3. Click the red X next to the dimension type to remove it from your filter
settings.
4. After you remove any unwanted filter settings, click Apply to submit your
changes and update the overlay.
Note: If you are viewing a Comparison Analytics overlay, click Filter to submit
your changes and update the overlay.
Removing dimension-value filters from an overlay
You can remove a filtered dimension type or a specific dimension-value or an
entire dimension type from a report.
To remove a filtered dimension value:
1. From the toolbar at the top of the overlay screen, click Filter.
Note: If you are viewing a Comparison Analytics overlay, click Filter or
Segment.
2. Click the dimension type that contains the dimension value that is to be
removed from your filter settings. A filter icon is displayed next to any
dimension type that contains a filtered dimension value.
3. From the list of dimension values, clear any dimension values that you want
removed from the filter settings.
4. After you remove any unwanted filter settings, click Apply to submit your
changes and update the overlay.
Segmenting dimension values within an overlay
You can segment dimension values within a cxOverstat Comparison Analytics
overlay.
You can add dimension-value segments to a Comparison Analytics overlay to
isolate particular dimension values within the report.
Note: A combination of up to 12 selected metrics, dimensions, or dimension values
can be displayed in a Comparison Analytics overlay.
Chapter 4. cxOverstat interface
45
For example, you might want to see the click and hover metrics for each browser
that was used to view the web page. In this scenario, you can apply dimension
value segments to the overlay. You can select up to six browser types for the
dimension values. This combination of selected metrics and dimension values
would equal the maximum of 12 items that can be displayed in the overlay.
To segment a dimension value within a cxOverstat Comparison Analytics overlay:
1. From the toolbar at the top of the overlay screen, click Filter or Segment.
2. Select the dimension type that you want to segment in the report.
Only the dimensions that are associated with the events that are capturing data
for the overlay are available for selection. See "Eventing for cxOverstat" in the
IBM Tealeaf Event Manager Manual.
Note: You can enter a dimension type in the search field. As you type, the field
provides a list of matching dimension types. You can select a dimension name
from the updated list.
3. Select the dimension values that you want to filter.
The list of dimensions values that are available for the dimension type are
listed.
Note: You can enter a dimension value in the search field. As you type, the
field provides a list of matching dimension values that are associated with the
selected dimension type. You can select dimension values from the updated list.
4. Click Segment to submit your changes and update the overlay with the
selected filters. If you do not want to apply the changes, click Cancel.
Removing dimension-type segments from an overlay
You can remove a specific segmented dimension-value or an entire dimension type
from a report.
To remove a filtered dimension type:
1. From the toolbar at the top of the overlay screen, click Filter.
Note: If you are viewing a Comparison Analytics overlay, click Filter or
Segment.
2. Place your mouse over the dimension type that you want to remove from your
filter settings.
3. Click the red X next to the dimension type to remove it from your filter
settings.
4. When all unwanted filter settings are removed, click Apply to submit your
changes and update the overlay.
To remove a segmented dimension value, see “Removing dimension-value filters
from an overlay” on page 45.
Removing dimension-value segments from an overlay
You can remove a dimension type or a specific dimension value from a segmented
Comparison Analytics overlay.
To remove a filtered dimension value:
1. If you are viewing a Comparison Analytics overlay, click Filter or Segment.
46
cxOverstat User Manual
2. Click the dimension type that contains the dimension value that is to be
removed from your filter settings. A segmentation icon is displayed next to any
dimension type that contains a segmented dimension value.
3. From the list of dimension values, clear any dimension values that you want
removed from the segmentation settings.
4. When all unwanted filter settings are removed, click Apply to submit your
changes and update the overlay.
To remove a segmented dimension type, see “Removing a dimension-type filter
from an overlay” on page 45.
Using Sub-select to define a region of focus
You can use Sub-select in Heat Map or Comparison Analytics reports to define a
region of focus in a web page and display the cxOverstat-related events that
occurred within that region.
You can click Sub-select from the toolbar at the top of the screen to bring focus to
a specific region of the web page that you are viewing. A window is drawn on the
screen to identify the focus region. The window can be resized and moved to
change your focus. To resize the window, use your mouse to drag a side or corner
of the window to expand or decrease the size of the window. To move the window
to a new location on the page, place your mouse inside the window, then drag the
region to a new location on the page.
In addition to the focus region, a menu is displayed that shows all of the metrics
and segments that are enabled in the report. Each metric and segment is
represented by the same icons that are used in the metrics legend (see “Modifying
the Comparison Analytics overlay display” on page 26). The icon for each metric is
listed with the number of times that the metric occurs within the selected region.
You can hover over a metric or segment in the menu; then, click the Report icon (
) that appears to further analyze the metric or segment in the IBM Tealeaf
Report Builder.
) that is at the upper-right corner
To close the window, click the Close button (
of the menu that displays the metrics for the selected region.
Exporting data from cxOverstat
When you are using BBR to view a visitor session, you can export cxOverstat
usability data into a PDF or XML file for use with another application or database.
When you are viewing a cxOverstat-enabled web page from a visitor session in
BBR, you can export the cxOverstat usability data to a PDF, or to an XML file for
Microsoft Excel. You can then import the data from the exported file into an
application or database to generate reports, populate another database, or to share
the data with another business unit.
To export cxOverstat data:
1. From the Tealeaf Portal, view a session in BBR. For more information, see the
IBM Tealeaf cxReveal User Manual.
2. Click a page in the session that is configured to capture cxOverstat data. If the
page is enabled to use cxOverstat, the page is rendered in BBR and the
Overlays selection in the top bar is activated.
Chapter 4. cxOverstat interface
47
3. Click Overlays and select the cxOverstat overlay that you want to view.
4. Click Export Data; then select the data type that you want the exported data to
be formatted. Your browser prompts you to open the file or to save the file.
Depending on which selections you choose, you can then view the data or
import the data into another application or database.
Using drill-down links
Depending on the current overlay, drill-down links are provided to open a session
list that contains all applicable sessions or a pre-configured report in the Report
Builder. These drill-down links are filtered by the IBM Tealeaf cxOverstat event
data and any applicable dimension filters, over the configured date range.
v For more information about the IBM Tealeaf cxOverstat overlays, see “Overview:
cxOverstat overlays” on page 13.
v See "Tealeaf Report Builder" in the IBM Tealeaf Reporting Guide.
v For more information about session lists, see "Searching Session Data" in the
IBM Tealeaf cxImpact User Manual.
v For more information about the IBM Tealeaf cxOverstat events, see "Eventing for
cxOverstat" in the IBM Tealeaf Event Manager Manual.
Note: When you drill down to a Report Builder, the display report is segmented
by any applicable dimensions. Segmenting does not display any included values in
the dimension. If you want to see the values of a dimension, click and drag the
dimension from the Segment to the x-axis.
Note: After you drill down into an IBM Tealeaf cxOverstat report, none of the IBM
Tealeaf cxOverstat dimensions are available for selection in the Dimension Selector.
These dimensions are used in the basic definition of the report and are therefore
already selected.
v For more information about these dimensions, see "Eventing for cxOverstat" in
the IBM Tealeaf Event Manager Manual.
v For more information about selecting dimensions in the Report Builder, see
"Tealeaf Report Builder" in the IBM Tealeaf Reporting Guide.
Note: If you are provided direct links to BBR sessions or do not have a browser
window open to the Portal web application for another reason, you might have to
disable the software to block pop-up ad windows in your web browser to perform
drill-downs in the Portal application. For more information, see your web
browser's documentation.
Dimension filters and segmentation overview
Dimension filters and segmentation can be used to customize the data that is
displayed in a report.
Dimension filtering
You can filter dimensions from any cxOverstat overlay to remove an unwanted
data set from the report. Filtering dimensions from a report can make the report
easier to understand and analyze.
Dimension segmentation
You can segment dimensions in a cxOverstat Comparison Analytics overlay to
identify specific data segments within a report. Segmenting the dimensions in a
48
cxOverstat User Manual
report can provide more detail within a report to help you better analyze the
customer interactions with a web page.
Zoom toolbar and the Page Navigator
For closer examination of the IBM Tealeaf cxOverstat overlay data, you can use the
Zoom toolbar to change the zoom level. As needed, you can reposition the
viewport over the session page to enable review of zoomed portions of the
currently displayed page. Using these tools in combination, you can examine in
detail any area of a IBM Tealeaf cxOverstat overlay for detailed analysis of
usability activities.
The following icons are used to control the zoom and page navigation tools.
Table 7. Zoom and Page Navigator tools
Icon
Description
Zoom icon
Click the zoom icon to display the zoom slider.
Zoom slider
Use the zoom slider to progressively increase or decrease the
size of the image that is displayed. You can also click the +
and - icons to increase or decrease the zoom ratio. By default,
the zoom ratio is set to 100 percent.
Page Navigator icon
Use the Page Navigator to scroll the displayed image to the
active view port.
Changing the Zoom factor
You can zoom in and out using the Zoom toolbar.
To open the Zoom toolbar, click the zoom (
Zoom toolbar is displayed.
) icon in the toolbar. The
Figure 8. Zoom Toolbar
Chapter 4. cxOverstat interface
49
At the top of the Zoom toolbar, the current zoom factor is displayed. A factor of
100% indicates that there is no zoom in or zoom out applied to the page.
v To zoom in, click the Plus (+) icon.
v To zoom out, click Minus (-) icon.
v You can also use the slider bar to change the zoom factor to a specific value.
v To reset the Zoom factor to 100%, click the Reset (
the zoom toolbar.
) icon at the bottom of
Using the Page Navigator
As needed, you can use the Page Navigator at the bottom of the screen to
reposition the viewport over the page. After you zoom in on a section of the page,
you can use the Page Navigator to change the focus area of the page that is
displayed in BBR.
v To toggle display of the Page Navigator, click the Page Navigator (
) icon.
Figure 9. Page Navigator
v To reposition the viewport of the BBR display, click and drag the red rectangle
inside the Page Navigator. The BBR display is automatically updated.
v To hide the Page Navigator, click the icon inside of it.
50
cxOverstat User Manual
Chapter 5. Eventing for cxOverstat
IBM Tealeaf cxOverstat enables the capture of usability information from the
visitor's web experience, as detected in the client and transmitted to Tealeaf. This
information is anonymously collected for reporting purposes. Events can be used
to specify specific conditions, such as a period of time, to record information.
Note: IBM Tealeaf cxOverstat is a separately licensable product of the IBM Tealeaf
CX platform. For more information, contact your representative.
When the IBM Tealeaf cxOverstat JavaScripts are deployed on pages or
ScreenViews of your web application, usability data such as X-Y location, relative
location, and focal point are captured and transmitted to Tealeaf. A provided set of
events is designed to capture the usability data.
v You can optionally associate other events with usability dimensions by using the
report group templates that are provided by Tealeaf.
In this section, you learn more about the usability data that is captured for IBM
Tealeaf cxOverstat, the data objects that are provided by Tealeaf to record them,
and other eventing possibilities for usability data.
v The maximum length for selected values of text for attributes and events is 256
characters.
cxOverstat usability data
IBM Tealeaf cxOverstat data is submitted from the IBM Tealeaf CX UI Capture
SDK solution, when it was enabled for IBM Tealeaf cxOverstat.
IBM Tealeaf cxOverstat data comes in the following forms:
Type
Description
Comparison Analytics
With the Comparison Analytics overlay, you can view selected metrics for
a web page and apply specific segments and filters to create customized
reports.
v For more information about this feature, see "Comparison Analytics
Overlay" in the IBM Tealeaf cxOverstat User Manual.
Heat mapping
Identifies regions on a page or ScreenView where visitors click, regardless
of whether an object was selected.
v For more information about this feature, see "Using Heat Maps" in the
IBM Tealeaf cxOverstat User Manual.
Attention mapping
Identifies the regions on a page or ScreenView that are most frequently
displayed within the visitor's browser window.
v For more information about this feature, see "Using Attention Maps" in
the IBM Tealeaf cxOverstat User Manual.
Form
Identifies visitor activities on forms on a page or ScreenView.
v For more information about this feature, see "Using Form Analytics" in
the IBM Tealeaf cxOverstat User Manual.
© Copyright IBM Corp. 1999, 2015
51
Link
Identifies links that are most frequently selected by visitors to a page or
ScreenView.
v For more information about this feature, see "Using Link Analytics" in
the IBM Tealeaf cxOverstat User Manual.
Usability Eventing
To support the tracking and recording of usability activities on your web
application, IBM Tealeaf provides a set of event objects to process usability data
that is submitted in JSON format from the client framework.
For more information about the schema, see "Tealeaf JSON Object Schema
Reference" in the IBM Tealeaf Client Framework Data Integration Guide.
v For more information about the properties that pertain to IBM Tealeaf
cxOverstat, see "Tealeaf JSON Properties" in the IBM Tealeaf Client Framework
Data Integration Guide.
cxOverstat objects must be enabled
In addition to providing the standard reporting and search capabilities, IBM
Tealeaf cxOverstat events are also used by the usability application itself. For
example, when the Tealeaf user chooses to display the Form Analytics overlay in
Browser Based Replay, the usability components in BBR query the Reporting
database for the event data that pertains to form analysis for the current page or
ScreenView.
Note: For correct capture and display of usability data in the IBM Tealeaf
cxOverstat overlays in Browser Based Replay, all hit attributes, events, and
dimensions must be enabled through the Event Manager. By default, these objects
are installed and enabled. Disabling can disable usability functions and data.
Goal Based Dimensions
By default, Tealeaf publishes event data as soon as the Canister detects and
processes it. IBM Tealeaf cxOverstat events, however, are configured to publish
their event data at the end of the session. The event values that were detected at
the time the event fired are recorded, but the recording does not occur until the
session is completed by the user, or session timeout. This method for event
publishing enables the support of the capturing of the dimension values associated
with the event from their last occurrence in the session.
For example, suppose you use a dimension to capture whether a purchase was
made. Since that information is not known until the end of the session, you can
delay the publishing of IBM Tealeaf cxOverstat events and their related dimensions
until the end of the session so the definitive answer (Yes or No) is captured in the
dimension value.
Note: All IBM Tealeaf cxOverstat events are configured to have their data
published at the end of the session. This setting cannot be modified for these
events.
See "Goal Based Dimensions" in the IBM Tealeaf Event Manager Manual.
Data storage
After the IBM Tealeaf cxOverstat step attributes and events are triggered, they are
recorded in the standard locations for Tealeaf.
52
cxOverstat User Manual
Session
When the Event Engine detects an event, it records the event as data in the request
of the hit on which the event occurred, along with any related dimensional data.
IBM Tealeaf cxOverstat events are recorded in this manner.
Below is an example recording of the event + dimension combination in a request:
v These elements of data are written to the bottom of the request for each event
that is triggered on the hit.
[TLFID_359]
Searchable=True
TLFID=359
TLFactValue=200
TLDimHash1=C6F8B06175B0630687EB80DF913A30CE
TLDimHash2=B0437419D4F0575FABDB726AAE61039C
TLDimHash3=3CFBA54F6873DFD55B0B09D32910B20E
TLDimHash4=0BDB5F014A7574C3B6DCCAD319321FED
TLDimHash5=7954797EAEBD4BD8B816EA63AF1CE05A
TLDimHash6=7954797EAEBD4BD8B816EA63AF1CE05A
TLDimHash7=7954797EAEBD4BD8B816EA63AF1CE05A
TLDimHash8=7954797EAEBD4BD8B816EA63AF1CE05A
TLDim1=/store/defaultpage
TLDim2=www.straussandplesser.com
TLDim3=store
TLDim4=206.169.17.19
TLDim5=TLT$NULL
TLDim6=TLT$NULL
TLDim7=TLT$NULL
TLDim8=TLT$NULL
For the listed event + dimension combination ([TLFID_359]), the event value
(TLFactValue) is recorded for the Searchable event.
v Beneath the event value, each possible dimension value is listed in both hashed
(TLDimHash) and standard (TLDim) form.
v Hashed dimension values are stored to support searching for dimension values
that are longer than 32 characters. See "Searching Session Data" in the IBM
Tealeaf cxImpact User Manual.
v For more information about request view in BBR, see "CX Browser Based
Replay" in the IBM Tealeaf cxImpact User Manual.
v For more information about the data that is stored for events and dimensions in
the request, see the [TLFID_] section in "RealiTea Viewer - Request View" in the
IBM Tealeaf RealiTea Viewer User Manual.
Database
Usability data is stored as event counts of the predefined usability events. This
data is stored in the Reporting database as normal event data. When a page or
ScreenView for stored usability data is displayed in BBR, the application queries
the Reporting database for the correct event counts to display in the selected
overlay
cxOverstat step attributes
To facilitate the tracking of usability data that is submitted from UI Capture,
Tealeaf provides a set of step attributes to track this information.
v When IBM Tealeaf cxOverstat is licensed and enabled, these attributes are
automatically enabled, and Tealeaf is tracking usability data.
Chapter 5. Eventing for cxOverstat
53
Note: If you are licensing IBM Tealeaf cxOverstat for an existing Tealeaf
installation, you must use the Tealeaf Upgrader to install the IBM Tealeaf
cxOverstat event objects. See "cxOverstat Installation and Configuration" in the
IBM Tealeaf cxOverstat User Manual.
v A step attribute is a hit attribute that is configured to track values that are stored
in JSON data that is submitted from a client framework. See "Step-Based
Eventing" in the IBM Tealeaf Event Manager Manual.
v In the Events tab, these step attributes are contained in the System Step
Attributes.
v For more information about the step attributes pertaining to IBM Tealeaf
cxOverstat, see "Tealeaf JSON Properties" in the IBM Tealeaf Client Framework
Data Integration Guide.
– For more information about all event objects that are provided by Tealeaf, see
"Tealeaf Standard Event Object Reference" in the IBM Tealeaf Event Manager
Manual.
cxOverstat events
Usability events require dimensional data in order for them to properly function.
The following events are provided by Tealeaf for IBM Tealeaf cxOverstat, and
associated with each of these events is a set of pre-configured dimensions.
v In the Events tab, these events are contained in the System Step Events.
v Building block events are not displayed in the Portal at all.
v By default, the non-building block events for IBM Tealeaf cxOverstat are
configured to be displayed in the Portal for search and reporting purposes.
However, they are configured to not be displayed in session lists in the Portal,
which includes QuickView and the Page List. While you can modify the event
definitions to display them in these views, they are likely to be displayed in
every session and thus clutter the display. See "TEM Events Tab" in the IBM
Tealeaf Event Manager Manual.
Note: Except to add or remove dimensions that you created, do not edit these
System Step Events. Do not edit the event definitions or remove any of dimensions
that are listed for each event.
Primary Reporting Events
Usability attention map view time, usability click, and usability form field visit are
the primary events that are used for the reporting of IBM Tealeaf cxOverstat data.
Table 8. Primary Reporting Events
Event Name Description
Default Dimensions
Step Attention View Time (Y) Event for
Usability
Usability data
Attention
Map Y View
Time
v ScreenView URL
Step Usability
Click
v Step - ScreenView URL
Click event for Usability data. This
event is used for comparison
analytics, heat maps, and link
analytics data.
v Step - ScreenView
v Step - Usability Focal Slice Y
v Step - Usability View Port Height
v Step - ScreenView
v Step - Target ID
v Step - Target Relative XY
54
cxOverstat User Manual
Table 8. Primary Reporting Events (continued)
Event Name Description
Default Dimensions
Step Usability
Form Field
Visit
v Step - ScreenView URL
Field Visits + Dwell time for Event
for Usability data
v Step - ScreenView
v Step - Target ID
By using viaTealeaf, you can access a set of reports that are configured for the
usability data that is submitted to Tealeaf.
Building block events
A "building block" event is available in the Short Term Canister while the session is
being captured. The event expires when the session is closed and moved to the
Long Term Canister. Building block events cannot be used in search or reporting.
See "TEM Events Tab" in the IBM Tealeaf Event Manager Manual.
The following table describes the building block events that are defined. These
events are unlikely to need modification.
Table 9. Building Block Events
Event Name Description
Default Dimensions
Step ScreenView
(BB)
(Building Block) Latest ScreenView
from ScreenView LOAD message
None
Step ScreenView
URL (BB)
(Building Block) Latest URL from
ScreenView LOAD message
None
Step Usability
Attention
Map
Viewport
Height
Normalized Viewport height (min of
Viewport or Page height)
Note: This event can be reviewed
and modified in JavaScript only.
None
(Building Block) Focal Slice BB event
Step for Usability data
Usability
Focal Slice Y Note: This event can be reviewed
and modified in JavaScript only.
(BB)
None
(Building Block) Combines Target ID
and ID Type into a single string
Note: This event can be reviewed
and modified in JavaScript only.
None
Step Usability
Target ID +
Type (BB)
v For more information about the events that pertain to IBM Tealeaf cxOverstat,
see "Tealeaf JSON Properties" in the IBM Tealeaf Client Framework Data Integration
Guide.
– For more information about all event objects that are provided by Tealeaf, see
"Tealeaf Standard Event Object Reference" in the IBM Tealeaf Event Manager
Manual.
Chapter 5. Eventing for cxOverstat
55
cxOverstat dimensions
To capture IBM Tealeaf cxOverstat data for reporting purposes, Tealeaf provides a
set of dimensions, which are used to store client usability data.
To locate these dimensions, enter Step in the filter text box in the Dimensions tab.
Table 10. cxOverstat Dimensions
Dimension
Name
Description
Source Event
Step ScreenView
Records the latest Screenview for
each Screenview LOAD message
Step - ScreenView [BB]
Step ScreenView
URL
Records the latest URL for each
Screenview LOAD message
Step - ScreenView URL [BB]
Step - Target ID of object that is acted on
ID
Step - Usability Target ID + type [BB]
Step - Target Records the relative position of the
Step - Target Relative XY
Relative XY action that is based on the object that
is acted on
Step - Usability Focal Slice Y [BB]
Records the Y focal slice.
Step Usability
v Dimension includes a predefined
Focal Slice Y
whitelist of values for bucketing of
slices for reporting.
Step Usability
View Port
Height
Viewport height of the browser
window that explores usability
overlays
Step - Usability Attention Map Y
View Time
v Dimension includes a predefined
whitelist of values for bucketing of
slices for reporting.
For more information about the dimensions that pertain to IBM Tealeaf cxOverstat,
see "Tealeaf JSON Properties" in the IBM Tealeaf Client Framework Data Integration
Guide.
For more information about all event objects that are provided by Tealeaf, see
"Tealeaf Standard Event Object Reference" in the IBM Tealeaf Event Manager Manual.
cxOverstat report groups
IBM Tealeaf cxOverstat provides a set of report groups that contain the provided
IBM Tealeaf cxOverstat dimensions. These report groups are predefined to contain
only the dimensions that are required for IBM Tealeaf cxOverstat.
The following list displays the dimensions:
v Usability - Attention Map
v Usability - Click
v Usability - Form Analytics
IBM Tealeaf recommends creating separate report groups for use with the IBM
Tealeaf cxOverstat system dimensions and then add dimensions as needed. These
custom report groups can be added, modified, and removed as needed.
56
cxOverstat User Manual
Note: After a dimension is added to any report group and committed to the
database, it cannot be removed. Since you are not allowed to remove the default
IBM Tealeaf cxOverstat report groups from the IBM Tealeaf cxOverstat events, any
dimensions added to these report groups are retained permanently.
cxOverstat report group templates
For IBM Tealeaf cxImpact, the base report group template is Standard. This report
group template supports up to four dimensions of your choosing.
For IBM Tealeaf cxOverstat, if you want to associate the usability data with other
dimensions for cross-dimensional reporting, you can use report group templates as
the basis for creating new report groups. A report group template is a template
that contains pre-configured dimensions for a new report group when it is created.
The report group template can be selected when you create a report group.
Note: You can create multiple of custom report groups from these templates. Only
report groups that are based on these associated templates are available for
usability events.
Note: You cannot make report group templates.
Figure 10. Creating report groups with a Usability template
The following report group templates are available to capture for IBM Tealeaf
cxOverstat:
Note: A report group that is created from one of the IBM Tealeaf cxOverstat report
group templates can contain up to eight dimensions.
Chapter 5. Eventing for cxOverstat
57
Note: After you select a report group template, choosing a new report group
template automatically removes all dimensions from the report group and starts
with the included dimensions of the newly selected report group template.
Table 11. cxOverstat Report Group Templates
Name
Description
Usability - Click
Events operating on comparison analytics, heat map, or link
analytics data require these contextual dimensions
Usability Attention Map
Events operating on attention map data require these contextual
dimensions
Usability - Form
Analytics
Events operating on form analytics data require these contextual
dimensions
See "TEM Dimensions Tab" in the IBM Tealeaf Event Manager Manual.
Tracking other usability events
The IBM Tealeaf CX UI Capture SDK solution provides more usability data that is
not natively captured by Tealeaf. Specifically, you can create custom step messages
to submit data of interest to you pertaining to the client activities of your web
application.
See "Step-Based Eventing" in the IBM Tealeaf Event Manager Manual.
Goal Based Dimensions
By default, Tealeaf events and event-related objects, such as dimensions, are
recorded as soon as they occur. This immediate responsiveness ensures that event
activity and contextual data are captured as a snapshot of the current state of the
session or application.
Goal Based Dimensions enable reporting to be segmented based on factors that
occur after the actual event occurrence. For example, you might want to track the
count of users who trigger a search on your web application and who failed to
complete a purchase transaction. Since it is not possible to evaluate this failure
event until all the hits of the session are processed, you must delay the tabulation
of the other event, which tracks search + failed to complete, until the end of the
session. In this manner, you can define current events to measure the effectiveness
of business goals in the session.
Overview
With Goal Based Dimensions, events fire when they occur, yet the data is not
published until the end of the session so that all required data to properly evaluate
the event is tabulated. Events that are configured to be evaluated at the end of the
session are not published until that time. At the end of the session, the last known
value for each dimension is back-populated to the event occurrences earlier in the
session.
For example, the event that identifies when a user goes to the shopping cart occurs
on hit 6, yet there are references to dimensional data populated by this event
earlier in the session, on hits 2 and 4.
You can configure the event to properly capture the event on hit 6 and then to
apply the dimensional values backward in the session.
58
cxOverstat User Manual
For example, the Went to Cart event fires on hit 6 and the Shopping Cart report
group that fires on hits 2 and 4 include a YES value for the Went to Cart
dimension. The populating event is not yet fired at the time of the recording of the
report group on the earlier hits.
Note: Since the data is not populated until the end of the session, Goal Based
Dimensions and events are not searchable and reportable until after the end of the
session, if they are configured to be searchable and reportable in the event
definition.
Differences from end of session events
A GBD event can fire multiple times in a session. An event that is configured to
fire on the End of Session trigger occurs only one time at the end of the session. As
a result, the End of Session event contains none of the context of the hit on which
the GBD event occurred.
Event publishing
The firing of an event and its publication are different:
v Firing: When an event is evaluated to be true, it is deemed to "fire." In the
Canister, when an event fires, a marker for the event is stored on the hit of the
event where it was evaluated.
v Publishing: An event is considered to be published when the Canister makes the
event and its recorded data available to other Tealeaf services, such as search
indexing and the Data Collector.
By default, the Canister publishes an event and its related dimensional data as
soon as possible after it fires. With Goal Based Dimensions, the event and its data
are not available until the end of the session, even though the event fires normally,
as specified.
GBD affects events and dimensions in the following ways:
v Events: Events that use Goal Based Dimensions still evaluate and fire normally.
The results of the event evaluation are not written to the database or search
indexes until the end of the session.
– GBD events can be used as building blocks for other events between firing
and the end of the session. They behave normally, except that Goal Based
Dimensions must not be referenced.
v Dimensions: Goal Based Dimensions are not evaluated at all until the end of
session. Until the end of the session, these dimensions are NULL values.
Note: Do not reference the value of a Goal Based Dimension in another event.
The values are always NULL.
– Even for other End of Session events, it is not possible to guarantee that the
dimension values are populated at the time that the other event is evaluated.
It is still possible to record nulls for the dimensions that are associated with
other End of Session events.
v Alerts: Since alerts do not use dimensions, alerts that are triggered on GBD
events are generated at the time that the event fired, instead of at the time of
event publication.
v Session Attributes: User-defined session attributes that reference GBD events are
updated at the time that the event fires, instead of at the time of event
publication.
Chapter 5. Eventing for cxOverstat
59
When an event is published, the search index is populated with the event value
and the related dimension values. If the dimension is configured for delayed
publishing and the event is published immediately, then the search index is
populated with the correct event value, yet all Goal Based dimensions are recorded
with NULL values. By forcing the event and the dimension to be published at the
end of the session, the correct values for both event and dimension are recorded
for indexing.
Note: The purpose of Goal Based Dimension events is to support the evaluation of
dimensions later. As a result, all events that use Goal Based Dimensions must be
published at the end of session, and thus IBM® Tealeaf cxOverstat does not contain
any data about active sessions.
Note: For this release, the only events that are configured for Goal Based
Dimensions are IBM Tealeaf cxOverstat events. No other events can be configured
as GBD events. See "Eventing for cxOverstat" in the IBM Tealeaf Event Manager
Manual.
Enabling Goal Based Dimensions
For each Processing Server, Goal Based Dimensions are enabled by default. When
enabled, a Processing Server detects GBD settings on events and dimensions and
publishes the data accordingly.
v Goal Based Dimensions are enabled through the raw configuration of each
Canister. See "Configuring the CX Canister" in the IBM Tealeaf CX Configuration
Manual.
All IBM Tealeaf cxOverstat events are automatically configured for delayed
publishing.
v See “Goal Based Dimension events.”
On individual dimensions that are part of IBM Tealeaf cxOverstat report groups,
you can configure them to be evaluated and published at the end of the session.
v See “Goal Based Dimensions and report groups.”
Goal Based Dimension events
Note: Since IBM Tealeaf cxOverstat events are configured to be published at the
end of a session, IBM Tealeaf cxOverstat does not contain any data about active
sessions.
Note: For this release, the only events that are configured for Goal Based
Dimensions are IBM Tealeaf cxOverstat events. No other events can be configured
as GBD events. See "Eventing for cxOverstat" in the IBM Tealeaf Event Manager
Manual.
Goal Based Dimensions and report groups
By default, dimensions are evaluated immediately when the event occurs.
Optionally, you can configure individual dimensions to be evaluated at the end of
the session.
Goal Based Dimensions can be used only in IBM Tealeaf cxOverstat report groups.
You can mix delayed and non-delayed dimensions in the same IBM Tealeaf
cxOverstat report group. These report groups can be associated only with IBM
Tealeaf cxOverstat events.
60
cxOverstat User Manual
Chapter 6. Using cxOverstat Snapshot
With cxOverstat Snapshot you can capture page states from live web pages and
save them to the Snapshot Gallery. Saving captured page states to the Snapshot
Gallery simplifies access to cxOverstat data for selected web pages.
cxOverstat Snapshot captures the current state of a cxOverstat-enabled web page,
including all of the data that is typically displayed in cxOverstat overlays.
You can group snapshots into stacks, which is similar to organizing them in
folders. Stacks are collections of snapshots. They allow easy access to overlays for
specific pages and your most commonly used data. You can add tags to snapshots
and stacks to make it easier to search for these items later on.
Installing the cxOverstat Snapshot Capture extension
You must install the Firefox extension to take snapshots.
You must have Firefox installed on your machine.
You will be prompted to install the extension when you log in to cxOverstat
Snapshot using Firefox.
1. Log in to the Tealeaf Portal in your Firefox browser.
2. Go to Analyze in the top navigation bar and select Snapshots from the
dropdown menu.
3. Follow the prompts to install the Firefox extension. Once installed, the
extension appears in your browser's toolbar with the following icons:
and
.
Taking Snapshots
You can take snapshots by using the keyboard shortcut or the extension. With the
keyboard shortcut, you can use mouse actions to trigger certain events -like click
or hover elements- while simultaneously capturing a snapshot of the screen. Using
the extension, you can capture the state of a web page by clicking one button.
Customizing your keyboard shortcut
You have the option of using a keyboard shortcut to take snapshots. The shortcut
is a series of keystrokes that can be customized to your preferences.
To customize your keyboard shortcut:
1. In the right sidebar, click the dropdown arrow next to Settings.
2. From here, you can enter the shortcut of your choice in the form field.
Taking a Snapshot
You can take snapshots of specific web pages that you want to analyze.
© Copyright IBM Corp. 1999, 2015
61
Note: Before you capture your snapshot, it is recommended to either clear the
browser cache before a page load, or disable browser caching entirely, in order to
avoid gaps in the snapshot. To disable caching in Firefox, set your browser to "Do
not remember history."
1. Go to the web page for which you want to take snapshots.
2. Click the Firefox extension.
3. If you are not already logged in, a pop-up window is displayed, prompting
you to log in to the Tealeaf Portal.
4. Press your keyboard shortcut to take a snapshot. This creates a snapshot and
saves it to the Gallery.
5. After you take a snapshot, a menu is displayed, where you can enter
information about your Snapshot. Enter the name, add any tags, and move the
Snapshot to the appropriate stack.
You can access your saved snapshots through the cxOverstat Snapshot Gallery.
Working with snapshots
With the cxOverstat Snapshot Gallery you can view your collection of snapshots,
edit snapshot properties, view snapshot overlays, delete snapshots, and organize
snapshots into stacks.
Renaming a snapshot
You can rename a snapshot in order to improve organization and make it easier to
locate snapshots.
1. Right-click the current name as displayed in the Gallery. A form is displayed,
highlighting the current name of the snapshot.
2. Enter a new name for the selected snapshot.
Adding tags to a snapshot
You can add tags to snapshots in order to improve organization and make it easier
to locate snapshots.
1. Select Preview for the stack you want to work with.
.
2. Hover over the selected snapshot. Click the tag icon
3. After you click the tag icon, the box expands. Add tags to the snapshot by
clicking the blue button labeled Click to add tag and type in the tag of your
choice.
For more information on tags, see “Working with tags.”
Deleting snapshots
You can delete snapshots that are no longer useful. However, you can only delete
snapshots that you created.
1. Hover over the snapshot you want to delete.
2. A bar is displayed, containing a trash can icon
delete the snapshot.
62
cxOverstat User Manual
. Click the trash can icon to
Viewing overlays on a snapshot
You can view overlays on a snapshot in order to analyze data.
1. Choose a snapshot that you want to work with.
2. Choose an overlay to display by using the Select Overlay button in the top left
of the viewer.
For more information on overlays, see “Chapter 3. cxOverstat overlays.”
Working with stacks
You can use stacks to organize snapshots. Group snapshots into stacks that are
based on your own unique criteria.
Previewing stacks
When previewing stacks you can view snapshots that are contained within each
stack, and remove unwanted snapshots from the stack.
1. In the Gallery, hover over the stack you would like to preview.
2. A bar is displayed over the thumbnail you selected. Click Preview to expand.
Viewing snapshots in a stack
You can view snapshots in a stack. From here you can select overlays and view
analytics for each snapshot.
1. In the Gallery, hover over the stack you would like to view.
2. A bar is displayed over the thumbnail you are viewing. Click Preview to
expand.
3. Click the snapshot that you want to view.
Adding snapshots to a stack
You can move snapshots from the Snapshot Gallery and add them to stacks.
1. In the Snapshot Gallery, hover over the stack you want to work with. Click the
plus icon. You are directed to Snapshot Selection Mode.
2. In Snapshot Selection Mode, click the snapshots you want to add to the stack.
The selected snapshots are highlighted blue when selected.
3. Click the Add to Stack button at the bottom of the screen.
Removing snapshots from a stack
You can remove unwanted snapshots from a stack.
1. In the Gallery, hover over the stack you want to remove.
2. A menu is displayed over the thumbnail. Click the X to remove the snapshot
from the stack.
Deleting stacks
You can delete an entire stack, and all snapshots contained within the stack.
1. In the Gallery, hover over the stack you want to delete.
2. A menu is displayed over the thumbnail. Click the trash can icon
the stack.
to delete
Chapter 6. Using cxOverstat Snapshot
63
Moving snapshots in a stack
You can move snapshots within a stack using the drag and drop function.
1. Navigate to the stack you want to work with within the Tealeaf Portal.
2. With your cursor, click on the snapshot you want to move and drag it to a new
location within the stack.
3. Release the snapshot in it's new location.
Working with tags
You can use tags to organize snapshots and locate information more easily when
analyzing data.
Creating tags
You can create and add tags to snapshots and stacks in order to improve
organization.
1. In the left panel of the Gallery, right click with your mouse. A dropdown menu
is displayed. Choose Create new tag.
2. On the top of the left panel in the Gallery, click Create.
Renaming tags
You can rename tags if necessary.
1. In the left sidebar in the Gallery, right-click the tag that you want to rename.
2. A dropdown menu is displayed. Select Rename.
Removing tags
You can remove unnecessary tags from snapshots and stacks. When using this
method of removal, tags will not be permanently deleted, but simply removed
from the selected element.
1. In the Gallery, hover over the stack you want to work with. When you click the
, the page expands.
tag icon
2. Choose which tag you want to remove from this stack by hovering over the tag
and clicking the red X.
Deleting tags
You can permanently delete tags that are no longer necessary.
1. In the left sidebar in the Gallery, right-click the tag that you want to delete.
2. A dropdown menu is displayed. Select Delete.
Adding tags to snapshots
Adding tags to a snapshot can help improve organization and make it easier to
locate specific snapshots when analyzing data.
1. In the right sidebar, hover over the thumbnail of your selected snapshot. A
is displayed.
menu that contains a tag icon
2. When you click the tag icon, the sidebar expands, revealing any tags that are
already applied to this image, and the Click to add tag button.
64
cxOverstat User Manual
3. Clicking the Click to add tag button reveals a drop down menu that contains
recently used tags. When you begin typing, the recently used tags menu
disappears, and is replaced by automatic tag suggestions that are based on the
first letters of the word you enter.
Apply All: Clicking Apply All in the recently used tags drop down menu adds all
recently used tags to the selected snapshot.
Remove: To remove a tag from a snapshot, hover over the selected tag. A red X is
displayed. Click the red X to remove the tag from the selected snapshot.
Repeat: To apply a tag to future snapshots, hover over the selected tag. A repeat
is displayed. Click the repeat symbol to repeat the tag for future
symbol
snapshots. Click the Repeat button once more to stop repeating the tag.
Adding tags to stacks
Adding tags to stacks can help improve organization and make it easier to locate
specific information when analyzing data.
1. In the Gallery, hover over the stack you want to work with. A menu that
is displayed.
contains a tag icon
2. When you click the tag icon, the page expands. Click the blue tag icon labeled
Click to add tag.
Auto Suggest: As you add more tags, Tealeaf automatically suggests potential tags
for you based on tags that are already in the database.
Chapter 6. Using cxOverstat Snapshot
65
66
cxOverstat User Manual
Chapter 7. Troubleshooting
Use the following troubleshooting table to find solutions to common problems
with installation and configuration of cxOverstat.
The following table lists corrective actions to some of the common problems that
might occur after you install and configure cxOverstat.
Table 12. cxOverstat
Symptom
Action
The Overlays menu option in BBR cannot be selected
when you view a page that has the cxOverstat UI SDK
enabled.
Make sure that the browser you are using to replay the
session supports HTML5. For a list of prerequisites to
use cxOverstat, see “Prerequisites” on page 7.
If you are viewing a mobile session, you must have CX
Mobile license.
cxOverstat is capturing data from bots.
You can filter traffic from bots by editing the Step Usability Event Filter [BB] event. For more information
on editing an event, see the IBM Tealeaf Event Manager
Manual.
1. From the Tealeaf Portal, go to the Tealeaf Event
Manager.
2. Click Tealeaf Standard Events in the Filter Events
menu.
3. Double-click Step - Usability Event Filter [BB] to
edit the event.
4. Go to the Conditions tab.
5. Click Add Condition to add a hit attribute.
6. From the Hit Attributes, click System Hit
Attributes, then select Traffic Type.
7. Edit the hit attribute by setting the Traffic Type to
First Value Not Equal BOT; then, select A≠a.
8. Click Add Condition to add a hit attribute.
9. From the Hit Attributes, click System Hit
Attributes, then select Traffic Type.
10. Edit the hit attribute by setting the Traffic Type to
First Value Not Equal MOBILE_BOT. Also, make sure
that A≠a is selected.
11. Make sure that the Set the Step - Usability URL Dim
Check [BB] event to Does not include TLT$ event
condition is listed. If this event condition is missing,
then you need to add the condition.
12. Make sure that the event is active by selecting the
Active option.
13. Save your changes by clicking Save Draft, then
Save Changes.
© Copyright IBM Corp. 1999, 2015
67
Table 12. cxOverstat (continued)
Symptom
Action
The row count for the Step - Target ID dimension is
growing at a fast rate when compared to other
dimensions in the database group.
Monitor the growth rate by logging in to the Tealeaf
Portal, then click Tealeaf, Database Table size, and select
Dimension for the Data Group. If the growth rate does
not stabilize, examine the target IDs to begin the
troubleshooting process. If new element IDs are
constantly generated on a web page, Step - Target ID
captures each new ID.
Overlays for web pages that have dynamic URLs are not
loading in BBR.
The Step - ScreenView URL dimension uses the original
URL for the captured web page in place of using
TLT_URL, which can prevent BBR from locating and
displaying web pages that use dynamic URLs.
Logging:
IBM Tealeaf cxOverstat log messages are written into the Portal log file. The file is
in the following location on the Portal Server:
<Tealeaf_install_directory>\Logs\TLPortal_YYYYMMDD.log
where YYYYMMDD is a date stamp.
Logging
IBM Tealeaf cxOverstat log messages are written into the Portal log file. The file is
in the following location on the Portal Server:
<Tealeaf_install_directory>\Logs\TLPortal_YYYYMMDD.log
where YYYYMMDD is a date stamp.
68
cxOverstat User Manual
Chapter 8. IBM Tealeaf documentation and help
IBM Tealeaf provides documentation and help for users, developers, and
administrators.
Viewing product documentation
All IBM Tealeaf product documentation is available at the following website:
https://tealeaf.support.ibmcloud.com/
Use the information in the following table to view the product documentation for
IBM Tealeaf:
Table 13. Getting help
To view...
Do this...
Product documentation
On the IBM Tealeaf portal, go to ? > Product
Documentation.
IBM Tealeaf Knowledge Center
On the IBM Tealeaf portal, go to ? > Product
Documentation and select IBM Tealeaf
Customer Experience in the ExperienceOne
Knowledge Center.
Help for a page on the IBM Tealeaf Portal
On the IBM Tealeaf portal, go to ? > Help
for This Page.
Help for IBM Tealeaf CX PCA
On the IBM Tealeaf CX PCA web interface,
select Guide to access the IBM Tealeaf CX
PCA Manual.
Available documents for IBM Tealeaf products
The following table is a list of available documents for all IBM Tealeaf products:
Table 14. Available documentation for IBM Tealeaf products.
IBM Tealeaf products
Available documents
IBM Tealeaf CX
v IBM Tealeaf Customer Experience Overview
Guide
v IBM Tealeaf CX Client Framework Data
Integration Guide
v IBM Tealeaf CX Configuration Manual
v IBM Tealeaf CX Cookie Injector Manual
v IBM Tealeaf CX Databases Guide
v IBM Tealeaf CX Event Manager Manual
v IBM Tealeaf CX Glossary
v IBM Tealeaf CX Installation Manual
v IBM Tealeaf CX PCA Manual
v IBM Tealeaf CX PCA Release Notes
© Copyright IBM Corp. 1999, 2015
69
Table 14. Available documentation for IBM Tealeaf products (continued).
IBM Tealeaf products
Available documents
IBM Tealeaf CX
v IBM Tealeaf CX RealiTea Viewer Client Side
Capture Manual
v IBM Tealeaf CX RealiTea Viewer User
Manual
v IBM Tealeaf CX Release Notes
v IBM Tealeaf CX Release Upgrade Manual
v IBM Tealeaf CX Support Troubleshooting
FAQ
v IBM Tealeaf CX Troubleshooting Guide
v IBM Tealeaf CX UI Capture j2 Guide
v IBM Tealeaf CX UI Capture j2 Release Notes
IBM Tealeaf cxImpact
v IBM Tealeaf cxImpact Administration Manual
v IBM Tealeaf cxImpact User Manual
v IBM Tealeaf cxImpact Reporting Guide
IBM Tealeaf cxConnect
v IBM Tealeaf cxConnect for Data Analysis
Administration Manual
v IBM Tealeaf cxConnect for Voice of Customer
Administration Manual
v IBM Tealeaf cxConnect for Web Analytics
Administration Manual
IBM Tealeaf cxOverstat
IBM Tealeaf cxOverstat User Manual
IBM Tealeaf cxReveal
v IBM Tealeaf cxReveal Administration Manual
v IBM Tealeaf cxReveal API Guide
v IBM Tealeaf cxReveal User Manual
IBM Tealeaf cxVerify
v IBM Tealeaf cxVerify Installation Guide
v IBM Tealeaf cxVerify User's Guide
IBM Tealeaf cxView
IBM Tealeaf cxView User's Guide
IBM Tealeaf CX Mobile
v IBM Tealeaf CX Mobile Android Logging
Framework Guide
v IBM Tealeaf Android Logging Framework
Release Notes
v IBM Tealeaf CX Mobile Administration
Manual
v IBM Tealeaf CX Mobile User Manual
v IBM Tealeaf CX Mobile iOS Logging
Framework Guide
v IBM Tealeaf iOS Logging Framework Release
Notes
70
cxOverstat User Manual
Notices
This information was developed for products and services offered in the U.S.A.
IBM may not offer the products, services, or features discussed in this document in
other countries. Consult your local IBM representative for information on the
products and services currently available in your area. Any reference to an IBM
product, program, or service is not intended to state or imply that only that IBM
product, program, or service may be used. Any functionally equivalent product,
program, or service that does not infringe any IBM intellectual property right may
be used instead. However, it is the user's responsibility to evaluate and verify the
operation of any non-IBM product, program, or service.
IBM may have patents or pending patent applications covering subject matter
described in this document. The furnishing of this document does not grant you
any license to these patents. You can send license inquiries, in writing, to:
IBM Director of Licensing IBM Corporation North Castle Drive Armonk, NY
10504-1785 U.S.A.
For license inquiries regarding double-byte (DBCS) information, contact the IBM
Intellectual Property Department in your country or send inquiries, in writing, to:
Intellectual Property Licensing Legal and Intellectual Property Law IBM Japan, Ltd.
19-21, Nihonbashi-Hakozakicho, Chuo-ku Tokyo 103-8510, Japan
The following paragraph does not apply to the United Kingdom or any other
country where such provisions are inconsistent with local law: INTERNATIONAL
BUSINESS MACHINES CORPORATION PROVIDES THIS PUBLICATION "AS IS"
WITHOUT WARRANTY OF ANY KIND, EITHER EXPRESS OR IMPLIED,
INCLUDING, BUT NOT LIMITED TO, THE IMPLIED WARRANTIES OF
NON-INFRINGEMENT, MERCHANTABILITY OR FITNESS FOR A PARTICULAR
PURPOSE. Some states do not allow disclaimer of express or implied warranties in
certain transactions, therefore, this statement may not apply to you.
This information could include technical inaccuracies or typographical errors.
Changes are periodically made to the information herein; these changes will be
incorporated in new editions of the publication. IBM may make improvements
and/or changes in the product(s) and/or the program(s) described in this
publication at any time without notice.
Any references in this information to non-IBM Web sites are provided for
convenience only and do not in any manner serve as an endorsement of those Web
sites. The materials at those Web sites are not part of the materials for this IBM
product and use of those Web sites is at your own risk.
IBM may use or distribute any of the information you supply in any way it
believes appropriate without incurring any obligation to you.
Licensees of this program who wish to have information about it for the purpose
of enabling: (i) the exchange of information between independently created
programs and other programs (including this one) and (ii) the mutual use of the
information which has been exchanged, should contact:
© Copyright IBM Corp. 1999, 2015
71
IBM Bay Area Lab 1001 E Hillsdale Boulevard Foster City, California 94404 U.S.A.
Such information may be available, subject to appropriate terms and conditions,
including in some cases, payment of a fee.
The licensed program described in this document and all licensed material
available for it are provided by IBM under terms of the IBM Customer Agreement,
IBM International Program License Agreement or any equivalent agreement
between us.
Any performance data contained herein was determined in a controlled
environment. Therefore, the results obtained in other operating environments may
vary significantly. Some measurements may have been made on development-level
systems and there is no guarantee that these measurements will be the same on
generally available systems. Furthermore, some measurements may have been
estimated through extrapolation. Actual results may vary. Users of this document
should verify the applicable data for their specific environment.
Information concerning non-IBM products was obtained from the suppliers of
those products, their published announcements or other publicly available sources.
IBM has not tested those products and cannot confirm the accuracy of
performance, compatibility or any other claims related to non-IBM products.
Questions on the capabilities of non-IBM products should be addressed to the
suppliers of those products.
All statements regarding IBM's future direction or intent are subject to change or
withdrawal without notice, and represent goals and objectives only.
This information contains examples of data and reports used in daily business
operations. To illustrate them as completely as possible, the examples include the
names of individuals, companies, brands, and products. All of these names are
fictitious and any similarity to the names and addresses used by an actual business
enterprise is entirely coincidental.
COPYRIGHT LICENSE:
This information contains sample application programs in source language, which
illustrate programming techniques on various operating platforms. You may copy,
modify, and distribute these sample programs in any form without payment to
IBM, for the purposes of developing, using, marketing or distributing application
programs conforming to the application programming interface for the operating
platform for which the sample programs are written. These examples have not
been thoroughly tested under all conditions. IBM, therefore, cannot guarantee or
imply reliability, serviceability, or function of these programs. The sample
programs are provided "AS IS", without warranty of any kind. IBM shall not be
liable for any damages arising out of your use of the sample programs.
Trademarks
IBM, the IBM logo, and ibm.com® are trademarks or registered trademarks of
International Business Machines Corp., registered in many jurisdictions worldwide.
Other product and service names might be trademarks of IBM or other companies.
A current list of IBM trademarks is available on the Web at “Copyright and
trademark information” at www.ibm.com/legal/copytrade.shtml.
72
cxOverstat User Manual
Privacy Policy Considerations
IBM Software products, including software as a service solutions, ("Software
Offerings") may use cookies or other technologies to collect product usage
information, to help improve the end user experience, to tailor interactions with
the end user or for other purposes. A cookie is a piece of data that a web site can
send to your browser, which may then be stored on your computer as a tag that
identifies your computer. In many cases, no personal information is collected by
these cookies. If a Software Offering you are using enables you to collect personal
information through cookies and similar technologies, we inform you about the
specifics below.
Depending upon the configurations deployed, this Software Offering may use
session and persistent cookies that collect each user's user name, and other
personal information for purposes of session management, enhanced user usability,
or other usage tracking or functional purposes. These cookies can be disabled, but
disabling them will also eliminate the functionality they enable.
Various jurisdictions regulate the collection of personal information through
cookies and similar technologies. If the configurations deployed for this Software
Offering provide you as customer the ability to collect personal information from
end users via cookies and other technologies, you should seek your own legal
advice about any laws applicable to such data collection, including any
requirements for providing notice and consent where appropriate.
IBM requires that Clients (1) provide a clear and conspicuous link to Customer's
website terms of use (e.g. privacy policy) which includes a link to IBM's and
Client's data collection and use practices, (2) notify that cookies and clear gifs/web
beacons are being placed on the visitor's computer by IBM on the Client's behalf
along with an explanation of the purpose of such technology, and (3) to the extent
required by law, obtain consent from website visitors prior to the placement of
cookies and clear gifs/web beacons placed by Client or IBM on Client's behalf on
website visitor's devices
For more information about the use of various technologies, including cookies, for
these purposes, See IBM's Online Privacy Statement at: http://www.ibm.com/
privacy/details/us/en section entitled "Cookies, Web Beacons and Other
Technologies."
Notices
73
74
cxOverstat User Manual
Printed in USA