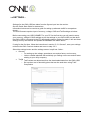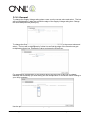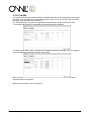
1
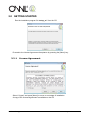
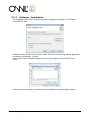
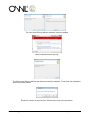
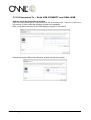
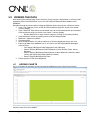
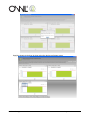
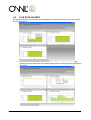
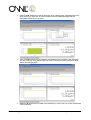
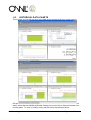
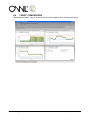
OWL+USB SOFTWARE USER GUIDE © 2 Save Energy Ltd 17/06/2010 Page 1 of 24 Table Of Contents 1.0 INTRODUCTION.......................................................................................................3 2.0 GETTING STARTED ................................................................................................4 2.2.1 2.2.2 3.0 LICENSE AGREEMENT.............................................................................................. 4 SOFTWARE INSTALLATION ..................................................................................... 5 USING YOUR OWL+USB.........................................................................................8 3.1 PRODUCT REGISTRATION ............................................................................................... 8 3.2 SETTINGS .......................................................................................................................... 9 3.2.1 GENERAL ................................................................................................................. 10 3.2.2 TARIFFS ................................................................................................................... 11 3.2.3 CONNECTED TO ...................................................................................................... 12 4.0 4.1 4.2 4.3 4.4 5.0 5.1 5.2 5.3 5.4 6.0 VIEWING THE DATA..............................................................................................14 ADDING CHARTS............................................................................................................. 14 LIVE DATA CHARTS ........................................................................................................ 16 HISTORICAL DATA CHARTS........................................................................................... 18 TARIFF COMPARISON .................................................................................................... 19 EXPORTING DATA ................................................................................................20 HOW TO CONVERT EXPORTED RAW DATA? ............................................................... 21 EXPORTING LIVE CHART DATA ..................................................................................... 21 EXPORTING HISTORICAL CHART DATA ....................................................................... 22 HOW DO I USE THE CONVERTED DATA? ..................................................................... 23 CHART PRINTING..................................................................................................24 © 2 Save Energy Ltd 17/06/2011 Page 2 of 24 1.0 INTRODUCTION Welcome to the OWL+USB Wireless Electricity Monitor that enables data recorded by the monitor to be downloaded and displayed numerically / graphically using the OWL USB Software. Export the data from the database as a .csv file for use in applications such as Excel to manipulate the data or display in other chart formats. Alternatively access the data in the SQLite database using suitable SQLite tools. How much data can be stored on my OWL+USB? Data is stored for last 720 days as a daily value of electricity used, cost of electricity used based on Tariff rates entered for that day, and amount of CO2 emissions based on conversion factor for that day. This data is accessible through the History function of the Monitor Data is also stored every minute for the last 30 days and this is accessed using the automatic download function of the software application supplied with the Monitor. How much data can I download to my PC from my OWL+USB? The last 30 days worth of minute by minute data can be downloaded from your OWL+USB. How do I download the data to my PC? After installing the software application, having followed the guidelines in the user manual, simply connect the mini-USB port of the monitor to the PC, and the last 30 days data (or number days data stored if less than 30 days) will automatically download to the database on the pc. How often do I need to download the data to my PC? Data should be downloaded every 30days since last data download or sooner. If 30days is exceeded since last download, then the data for the days between the last 30days and last download of data will be overwritten in the monitor, hence there will be no data saved for those days in the database. Where can the database be found on my PC? The database file and all exported data files can be found in Windows XP “C:\Documents and Settings\All Users\Application Data\2SE” Windows 7 “C:\ProgramData\2SE” © 2 Save Energy Ltd 17/06/2011 Page 3 of 24 2.0 GETTING STARTED Run the installation program file “setup_en” from the CD Proceed to the License Agreement Acceptance by pressing the [Next>] key. 2.2.1 License Agreement Select “I Agree” and press [Next>] to move to next stage of installation A copy of the License Agreement is available on the CD © 2 Save Energy Ltd 17/06/2011 Page 4 of 24 2.2.2 Software Installation The installation of the OWL Home Energy Monitor program will default to “C:\Program Files\2SE\The Owl\”. A different folder location can be used to install The OWL Home Energy Monitor application by selecting the [Browse…] button. Check to see which disk has enough room to load the program using the [Disk Cost…] button Confirm that you are ready to proceed with the installation by selecting [Next>] button. © 2 Save Energy Ltd 17/06/2011 Page 5 of 24 The Owl Home Energy Monitor software is being installed. Select Install this driver anyway. The OWL Home Energy Monitor has been successfully installed. To exit from the installation select the [Close] button. Electronic version of the manual is offered at the end of the procedure. © 2 Save Energy Ltd 17/06/2011 Page 6 of 24 3.0 CONNECTING THE MONITOR Do not start The_Owl software yet. Next connect your OWL Monitor to the PC using the micro USB cable supplied. Notification that the device drivers are being installed will show. When installation is complete you will receive a successfully installed message © 2 Save Energy Ltd 17/06/2011 Page 7 of 24 4.0 USING YOUR OWL+USB Go to START > Menu > All Programs > The Owl > The Owl and select. 3.1 PRODUCT REGISTRATION Product registration is required to validate your product guarantee and to inform you via e-mail of any software updates that will be accessible as a download from the website. You can choose to skip registration but will be requested each time you open the program to register the product. * Un-check the box if you do not wish to be added to our Newsletter mailing list where you will receive information about new product releases and promotions. © 2 Save Energy Ltd 17/06/2011 Page 8 of 24 3.2 SETTINGS – Settings for the OWL+USB are taken from the figures input into the monitor. See the Quick Start Guide for instructions. Information below can be used as a guide for setting up alternate tariffs for comparison charts. The USB Connect requires input of currency, voltage, GHG and Tariff settings as below. Before connecting your USB CONNECT to your PC for the first time you will need to setup your currency, voltage & GHG settings as per the settings in your OWL+USB, so that when the OWL+USB is connected to the PC downloading data or getting live data, it will use these settings for any calculations and update the database with these values. If using for the first time, follow the instructions in section “3.2.1 General”, save your settings minimise the OWL Connect window and move to step 3.2.3 Select the settings button and the settings screen is split into 3 tabs: General o For setting up the voltage, greenhouse conversion factor, and currency. o Links to related websites that could help you finding out the conversion factor relating to your utility company. Tariffs o Tariff values are determined from the downloaded data from the OWL+USB o Set up other cost of electricity plans that can be used when using Tariff Comparison © 2 Save Energy Ltd 17/06/2011 Page 9 of 24 3.2.1 General To change the Supply Voltage rating place cursor over the current value and select. The box will be highlighted by a blue line around the edge of the Supply Voltage rating box. Change the value and press the [Enter] key. To change the Greenhouse gas multiplication factor place cursor over the current value and select. The box will be highlighted by a blue line around the edge of the Greenhouse gas multiplication factor box. Change the value and press the [Enter] key. For greenhouse multiplication or conversion factors use the links to take you to related websites that could help you with finding out the multiplication or conversion factor relating to your utility company. Use the pull down menu to select currency setting. © 2 Save Energy Ltd 17/06/2011 Page 10 of 24 3.2.2 Tariffs A nominal tariff has been preset within the software but this can be changed or removed as required. Cost per kWh are in sub-units ie pence / cents, so for a Cost per kWh of £2-845 the value to be entered would be 284-50 For Tariff plans that only have a single band then start time should be left set at 0:00. To introduce tariff plans for comparison purposes select the [Add] key. To edit the tariff name, rates, and start times applied to weekly, weekday only, or weekend only rate, select the tariff name [Enter name here]. Enter a name for the new tariff. All six possible tariff rates/start times will be checked. Uncheck those not required Repeat as required for other Tariff plans. © 2 Save Energy Ltd 17/06/2011 Page 11 of 24 3.2.3 Connected To – Both USB CONNECT and OWL+USB Add the unit to the Connected to window. Up to five OWL+USBs can be connected to the PC at the same time. There is no limit set on the number of OWL+USBs the software will add to the database. Note it may take a little time for the USB display to appear in the window. Drag and drop the USB from the Sensors window into the device table. © 2 Save Energy Ltd 17/06/2011 Page 12 of 24 Insert a name to identify the USB. The tariff values will be determined from the OWL+USB data. Try not to use punctuation in the device name as this can cause problems with the database on some PCs. Save settings by selecting <Save> button or select <Cancel> button to leave settings window without saving any of these changes. © 2 Save Energy Ltd 17/06/2011 Page 13 of 24 5.0 VIEWING THE DATA After leaving the settings page for the first time, there may be a slight delay in a history chart appearing for the first transmitter in your list until sufficient data has been added to the database. Navigate through the chart options using the different option through the <Options> button. View “Live” Data as a cost, as kW & CO2 emissions using line charts / bar charts / numeric display. View “Historical” Data as an accumulated cost, as accumulated kWh & accumulated CO2 emissions using line charts / bar charts / numeric display. o Review data down to a per minute usage by clicking on the data point/bar View data point values by passing cursor over the data point/bar Maximum / Minimum markers Compare tariffs Open multiple charts (10) with a maximum of 4 being displayed at any one time Export raw data from database into a .csv file for use with spreadsheet packages such as Excel. o Live display Exports Data Displayed (Last 2 Minutes) o Historic Display Exports Data Displayed (Years, Months, Days, Hours, Minutes) o Historic Display Exports Data between 2 dates based on chart time base (ie Day will export Daily Data between 2 dates) o Historic Display Exports All Data Simple printout of the chart displayed 4.1 ADDING CHARTS Up to 10 charts can be open at one time and are added using the <New Chart> button. If 4 charts are already being display on the screen, one of these will need to be minimised to allow the next chart to be added. © 2 Save Energy Ltd 17/06/2011 Page 14 of 24 Applying charts to devices is done using the device pull down menu © 2 Save Energy Ltd 17/06/2011 Page 15 of 24 4.2 LIVE DATA CHARTS See the electricity as it is being consumed displayed in chart form showing it as cost, power and CO2 emissions. Energy Chart Shows the electricity in use in kW, calculated from the voltage setting you have used within the settings page and the electrical current reported by the sensor. © 2 Save Energy Ltd 17/06/2011 Page 16 of 24 Cost Chart Shows the cost of electricity as it is being used, calculated from the tariff setting you have set up for the sensor within the settings page and the calculated electricity in use (kW). GHG Chart Shows the calculated CO2 emissions for generating the electricity you are currently using based upon the GHG Conversion Factor you have used within the settings page. Numeric Shows the live data of the electricity in use in kW, as a cost, and shows CO2 emissions. © 2 Save Energy Ltd 17/06/2011 Page 17 of 24 4.3 HISTORICAL DATA CHARTS This will take you into the top level of the data shown as data used on a yearly timeline. Drill down into the data by placing the cursor over the data bar you want to look at in more detail, select that the data bar by double clicking your mouse key to then see the data on a monthly basis. To view on a daily, hourly and per minute repeat steps above. © 2 Save Energy Ltd 17/06/2011 Page 18 of 24 4.4 TARIFF COMPARISON Comparing tariff plans using Live data or Historical data against other entered tariff plans. © 2 Save Energy Ltd 17/06/2011 Page 19 of 24 6.0 EXPORTING DATA Exported data is saved to a default folder "C:\Documents and Settings\All Users.WINDOWS\Application Data\2SE" and the filename is generated from device name and date/time saved. A shortcut to this folder can be found Start>Programs>OWL USB Connect 2. After exporting a file the OWL USB Connect 2 user interface will be minimised and the OWL Data folder opened on the screen. The exported data is downloaded in columns under the following headings:Sensor Time GHG Factor Tariff Cost Amps_Raw_Data Amps_Raw_Data_Min Amps_Raw_Data_Max kW_Raw_Data kW_Raw_Data_Min kW_Raw_Data_Max Cost_Raw_Data Cost _Raw_Data_Min Cost_Raw_Data_Max GHG_Raw_Data GHG_Raw_Data_Min GHG_Raw_Data_Max Sensor identification associated with exported data. Timestamp of when data was recorded. GHG Factor applied to recorded data Tariff Rate applied to recorded data. Raw data value relating to Amps measured by the sensor during that time period. Minimum raw data value relating to Amps measured by the sensor during that time period (ie Minimum value during that Day, Hour, Minute) Maximum raw data value of Amps measured by the sensor during that time base (ie Minimum value during that Day, Hour, Minute) Raw data value of kW calculated using Amps_Raw_Data and the voltage applied in the settings window when data was recorded. Minimum raw data value of kW calculated using Amps_Raw_Data_Min and the voltage applied in the settings window when data was recorded. Maximum raw data value of kW calculated using Amps_Raw_Data_Max and the voltage applied in the settings window when data was recorded. Raw data value of cost of electricity using applied tariff during the period between this and previous time stamp. Minimum raw data value of cost of electricity using applied tariff during the period between this and previous time stamp. Maximum raw data value of cost of electricity using applied tariff during the period between this and previous time stamp. Raw data value of calculated weight of Carbon Dioxide emissions using applied conversion factor during the period between this and previous time stamp. Raw data value of calculated weight of Carbon Dioxide emissions using applied conversion factor during the period between this and previous time stamp. Raw data value of calculated weight of Carbon Dioxide emissions using applied conversion factor during the period between this and previous time stamp. © 2 Save Energy Ltd 17/06/2011 Page 20 of 24 5.1 HOW TO CONVERT EXPORTED RAW DATA? Take the raw data and using the calculations below, convert the Current, Energy, Cost & GHG data columns. o Current (Amps) Amps Value x 60 ie: 0.05 x 60 = 3 Amps o Energy (kW) kW value ÷ 1,000 ie: 4.4 ÷ 1,000 = 0.0044kW (or 4.4W) o Cost (pence or cents) Cost value ÷ 100,000 ie: 520000 ÷ 100,000, = 5.2pence o GHG (kg) GHG value ÷ 100,000 ie: 7100 ÷ 100,000 = 0.071kg (or 71g) 5.2 EXPORTING LIVE CHART DATA Using the export function when viewing live data will download the current data as shown in the 2 minute live usage chart. Device Time OWL CM113 OWL CM113 OWL CM113 OWL CM113 OWL CM113 OWL CM113 OWL CM113 OWL CM113 OWL CM113 OWL CM113 OWL CM113 OWL CM113 OWL CM113 OWL CM113 OWL CM113 OWL CM113 OWL CM113 OWL CM113 OWL CM113 OWL CM113 08:48:04 08:47:58 08:47:52 08:47:46 08:47:40 08:47:34 08:47:28 08:47:22 08:47:16 08:47:10 08:47:04 08:46:58 08:46:52 08:46:46 08:46:40 08:46:34 08:46:28 08:46:22 08:46:16 08:46:10 GHG_Facto Amps_Raw Amps_Raw Amps_Raw kW_Raw_D kW_Raw_D kW_Raw_D Cost_Raw_ Cost_Raw_ Cost_Raw_ GHG_Raw_ GHG_Raw_ r Tariff_Cost _Data _Data_Min _Data_Max ata ata_Min ata_Max Data Data_Min Data_Max Data Data_Min 0.43 0.43 0.43 0.43 0.43 0.43 0.43 0.43 0.43 0.43 0.43 0.43 0.43 0.43 0.43 0.43 0.43 0.43 0.43 0.43 12.19 12.19 12.19 12.19 12.19 12.19 12.19 12.19 12.19 12.19 12.19 12.19 12.19 12.19 12.19 12.19 12.19 12.19 12.19 12.19 3.1 2.9 2.9 2.9 2.9 2.9 2.9 2.9 2.9 2.9 2.9 3.2 3.2 3.2 3.2 3.2 2.9 2.9 2.9 3.2 2.8 2.8 2.8 2.8 2.8 2.8 2.8 2.8 2.8 2.8 2.8 2.8 2.8 2.8 2.8 2.8 2.8 2.8 2.8 2.8 28 28 28 28 28 28 28 28 28 28 28 28 28 28 28 28 28 28 28 28 713 667 667 667 667 667 667 667 667 667 667 736 736 736 736 736 667 667 667 736 644 644 644 644 644 644 644 644 644 644 644 644 644 644 644 644 644 644 644 644 6440 6440 6440 6440 6440 6440 6440 6440 6440 6440 6440 6440 6440 6440 6440 6440 6440 6440 6440 6440 869147 813073 813073 813073 813073 813073 813073 813073 813073 813073 813073 897184 897184 897184 897184 897184 813073 813073 813073 897184 785036 785036 785036 785036 785036 785036 785036 785036 785036 785036 785036 785036 785036 785036 785036 785036 785036 785036 785036 785036 7850360 7850360 7850360 7850360 7850360 7850360 7850360 7850360 7850360 7850360 7850360 7850360 7850360 7850360 7850360 7850360 7850360 7850360 7850360 7850360 30659 28681 28681 28681 28681 28681 28681 28681 28681 28681 28681 31648 31648 31648 31648 31648 28681 28681 28681 31648 27692 27692 27692 27692 27692 27692 27692 27692 27692 27692 27692 27692 27692 27692 27692 27692 27692 27692 27692 27692 Converted data shown below:Device Time OWL CM113 OWL CM113 OWL CM113 OWL CM113 OWL CM113 OWL CM113 OWL CM113 OWL CM113 OWL CM113 OWL CM113 OWL CM113 OWL CM113 OWL CM113 OWL CM113 OWL CM113 OWL CM113 OWL CM113 OWL CM113 OWL CM113 OWL CM113 08:48:04 08:47:58 08:47:52 08:47:46 08:47:40 08:47:34 08:47:28 08:47:22 08:47:16 08:47:10 08:47:04 08:46:58 08:46:52 08:46:46 08:46:40 08:46:34 08:46:28 08:46:22 08:46:16 08:46:10 Amps_Con Amps_Con kW_Conv_ kW_Conv_ Cost_Conv Cost_Conv GHG_Conv GHG_Facto Amps_Con v_Data_Min v_Data_Ma kW_Conv_ Data_Min Data_Max Cost_Conv _Data_Min _Data_Max GHG_Conv _Data_Min r Tariff_Cost v_Data (A) (A) x (A) Data (kW) (kW) (kW) _Data (p/c) (p/c) (p/c) _Data (kg) (kg) 0.43 0.43 0.43 0.43 0.43 0.43 0.43 0.43 0.43 0.43 0.43 0.43 0.43 0.43 0.43 0.43 0.43 0.43 0.43 0.43 12.19 12.19 12.19 12.19 12.19 12.19 12.19 12.19 12.19 12.19 12.19 12.19 12.19 12.19 12.19 12.19 12.19 12.19 12.19 12.19 3.1 2.9 2.9 2.9 2.9 2.9 2.9 2.9 2.9 2.9 2.9 3.2 3.2 3.2 3.2 3.2 2.9 2.9 2.9 3.2 © 2 Save Energy Ltd 17/06/2011 2.8 2.8 2.8 2.8 2.8 2.8 2.8 2.8 2.8 2.8 2.8 2.8 2.8 2.8 2.8 2.8 2.8 2.8 2.8 2.8 28 28 28 28 28 28 28 28 28 28 28 28 28 28 28 28 28 28 28 28 0.00713 0.00667 0.00667 0.00667 0.00667 0.00667 0.00667 0.00667 0.00667 0.00667 0.00667 0.00736 0.00736 0.00736 0.00736 0.00736 0.00667 0.00667 0.00667 0.00736 0.00644 0.00644 0.00644 0.00644 0.00644 0.00644 0.00644 0.00644 0.00644 0.00644 0.00644 0.00644 0.00644 0.00644 0.00644 0.00644 0.00644 0.00644 0.00644 0.00644 0.0644 0.0644 0.0644 0.0644 0.0644 0.0644 0.0644 0.0644 0.0644 0.0644 0.0644 0.0644 0.0644 0.0644 0.0644 0.0644 0.0644 0.0644 0.0644 0.0644 8.69147 8.13073 8.13073 8.13073 8.13073 8.13073 8.13073 8.13073 8.13073 8.13073 8.13073 8.97184 8.97184 8.97184 8.97184 8.97184 8.13073 8.13073 8.13073 8.97184 7.85036 7.85036 7.85036 7.85036 7.85036 7.85036 7.85036 7.85036 7.85036 7.85036 7.85036 7.85036 7.85036 7.85036 7.85036 7.85036 7.85036 7.85036 7.85036 7.85036 78.5036 78.5036 78.5036 78.5036 78.5036 78.5036 78.5036 78.5036 78.5036 78.5036 78.5036 78.5036 78.5036 78.5036 78.5036 78.5036 78.5036 78.5036 78.5036 78.5036 0.30659 0.28681 0.28681 0.28681 0.28681 0.28681 0.28681 0.28681 0.28681 0.28681 0.28681 0.31648 0.31648 0.31648 0.31648 0.31648 0.28681 0.28681 0.28681 0.31648 Page 21 of 24 0.27692 0.27692 0.27692 0.27692 0.27692 0.27692 0.27692 0.27692 0.27692 0.27692 0.27692 0.27692 0.27692 0.27692 0.27692 0.27692 0.27692 0.27692 0.27692 0.27692 5.3 EXPORTING HISTORICAL CHART DATA Using the export function when viewing collected data will download the data depending upon option selected: Data from current chart being displayed. o Viewing one hours data when exported will give that hours data on a per minute basis o Viewing one days data when exported will give that days data on a per minute basis o Viewing one month’s data when exported will give that months data on a per minute basis o Viewing one year’s data when exported will give that years data on a per minute basis o Viewing all data when exported will give all data on a per minute basis Data collected between 2 dates for sensor in current chart. o When exporting between 2 dates when one hours chart is being viewed only that hours data for the between those dates are exported on a per minute basis o When exporting between 2 dates when viewing all other charts all data between those dates is exported on a per minute basis. All data collected for sensor. o Exports all data for that sensor on a per minute basis. © 2 Save Energy Ltd 17/06/2011 Page 22 of 24 5.4 Device OWL CM119 OWL CM119 OWL CM119 OWL CM119 OWL CM119 OWL CM119 OWL CM119 OWL CM119 OWL CM119 OWL CM119 OWL CM119 OWL CM119 OWL CM119 OWL CM119 OWL CM119 OWL CM119 OWL CM119 OWL CM119 OWL CM119 OWL CM119 OWL CM119 OWL CM119 OWL CM119 OWL CM119 OWL CM119 OWL CM119 OWL CM119 OWL CM119 OWL CM119 OWL CM119 OWL CM119 OWL CM119 OWL CM119 OWL CM119 OWL CM119 OWL CM119 OWL CM119 OWL CM119 OWL CM119 OWL CM119 OWL CM119 OWL CM119 OWL CM119 OWL CM119 OWL CM119 OWL CM119 OWL CM119 OWL CM119 OWL CM119 OWL CM119 OWL CM119 OWL CM119 OWL CM119 OWL CM119 OWL CM119 OWL CM119 OWL CM119 OWL CM119 OWL CM119 OWL CM119 OWL CM119 OWL CM119 OWL CM119 OWL CM119 OWL CM119 OWL CM119 OWL CM119 OWL CM119 HOW DO I USE THE CONVERTED DATA? Time Amps_Con Amps_Con kW_Conv_ kW_Conv_ Cost_Conv Cost_Conv GHG_Conv GHG_Facto Amps_Con v_Data_Min v_Data_Ma kW_Conv_ Data_Min Data_Max Cost_Conv _Data_Min _Data_Max GHG_Conv _Data_Min r Tariff_Cost v_Data (A) (A) x (A) Data (kW) (kW) (kW) _Data (p/c) (p/c) (p/c) _Data (kg) (kg) 01/03/2010 00:00 0.43 8.73 0.0124 0.0117 01/03/2010 00:01 0.43 8.73 0.0117 0.0117 01/03/2010 00:02 0.43 8.73 0.0121 0.0117 01/03/2010 00:03 0.43 8.73 0.0125 0.0117 Min/Max Data is the minimum 01/03/2010 00:04 0.43 8.73 0.0120 0.0117 and maximum usage during the 0.0128 01/03/2010 00:05 0.43 8.73 0.0128 datapoint 01/03/2010 00:06 0.43 8.73 0.0128 0.0128 01/03/2010 00:07 0.43 8.73 0.0182 0.0128 01/03/2010 00:08 0.43 8.73 0.0222 0.0210 01/03/2010 00:09 0.43 8.73 0.0233 0.0233 01/03/2010 00:10 0.43 8.73 0.0233 0.0233 01/03/2010 00:11 0.43 8.73 0.0229 0.0222 01/03/2010 00:12 0.43 8.73 0.0222 0.0222 01/03/2010 00:13 0.43 8.73 0.0217 0.0210 01/03/2010 00:14 0.43 8.73 0.0210 0.0210 01/03/2010 00:15 0.43 8.73 0.0210 0.0210 01/03/2010 00:16 0.43 8.73 0.0210 0.0210 The kW data is broken down 01/03/2010 00:17 0.43 8.73 0.0210 0.0210into 01/03/2010 00:18 0.43 8.73 0.0210 0.0210 kWh used in a 1 minute period, 01/03/2010 00:19 0.43 8.73 0.0210 0.0210 so to get the kWh's used in one 01/03/2010 00:20 0.43 8.73 0.0210 0.0210 01/03/2010 00:21 0.43 hour the8.73 sum of0.0210 1hours data 0.0210 01/03/2010 00:22 0.43 8.73 0.0210 0.0210 needs to be taken 01/03/2010 00:23 0.43 8.73 0.0207 0.0198 01/03/2010 00:24 0.43 8.73 0.0203 0.0198 01/03/2010 00:25 0.43 8.73 0.0210 0.0210 0.246kWh 01/03/2010 00:26 0.43 8.73 0.0210 0.0210 01/03/2010 00:27 0.43 8.73 0.0210 0.0210 01/03/2010 00:28 0.43 8.73 0.0184 0.0128 01/03/2010 00:29 0.43 8.73 0.0128 0.0128 01/03/2010 00:30 0.43 8.73 0.0128 0.0128 01/03/2010 00:31 0.43 8.73 0.0124 0.0117 01/03/2010 00:32 0.43 8.73 0.0117 0.0117 01/03/2010 00:33 0.43 8.73 0.0121 0.0117 01/03/2010 00:34 0.43 8.73 0.0124 0.0117 01/03/2010 00:35 0.43 8.73 0.0135 0.0128 01/03/2010 00:36 0.43 8.73 0.0131 0.0128 01/03/2010 00:37 0.43 8.73 0.0128 0.0128 01/03/2010 00:38 0.43 8.73 0.0131 0.0128 01/03/2010 00:39 0.43 8.73 0.0128 0.0128 01/03/2010 00:40 0.43 8.73 0.0125 0.0117 01/03/2010 00:41 0.43 8.73 0.0121 0.0117 01/03/2010 00:42 0.43 8.73 0.0124 0.0117 01/03/2010 00:43 0.43 8.73 0.0117 0.0117 01/03/2010 00:44 0.43 8.73 0.0119 0.0117 01/03/2010 00:45 0.43 8.73 0.0121 0.0117 01/03/2010 00:46 0.43 8.73 0.0128 0.0128 01/03/2010 00:47 0.43 8.73 0.0128 0.0128 01/03/2010 00:48 0.43 8.73 0.0128 0.0128 01/03/2010 00:49 0.43 8.73 0.0128 0.0128 01/03/2010 00:50 0.43 8.73 0.0124 0.0117 01/03/2010 00:51 0.43 8.73 0.0117 0.0117 01/03/2010 00:52 0.43 8.73 0.0196 0.0140 01/03/2010 00:53 0.43 8.73 0.0224 0.0210 01/03/2010 00:54 0.43 8.73 0.0233 0.0233 01/03/2010 00:55 0.43 8.73 0.0233 0.0233 01/03/2010 00:56 0.43 8.73 0.0233 0.0233 01/03/2010 00:57 0.43 8.73 0.0233 0.0233 01/03/2010 00:58 0.43 8.73 0.0233 0.0233 01/03/2010 00:59 0.43 8.73 0.0233 0.0233 01/03/2010 01:00 0.43 8.73 0.0231 0.0222 01/03/2010 01:01 0.43 8.73 0.0222 0.0222 01/03/2010 01:02 0.43 8.73 0.0217 0.0210 01/03/2010 01:03 0.43 8.73 0.0210 0.0210 01/03/2010 01:04 0.43 8.73 0.0210 0.0210 01/03/2010 01:05 0.43 8.73 0.0210 0.0210 01/03/2010 01:06 0.43 8.73 0.0210 0.0210 01/03/2010 01:07 0.43 8.73 0.0210 0.0210 © 2 Save Energy Ltd 17/06/2011 0.0128 0.0117 0.0128 0.0128 0.0128 0.0128 0.0128 0.0210 0.0233 0.0233 0.0233 0.0233 0.0222 0.0222 0.0210 0.0210 0.0210 0.0210 0.0210 0.0210 0.0210 0.0210 0.0210 0.0210 0.0210 0.0210 0.0210 0.0210 0.0210 0.0128 0.0128 0.0128 0.0117 0.0128 0.0128 0.0140 0.0152 0.0128 0.0152 0.0128 0.0128 0.0128 0.0128 0.0117 0.0140 0.0128 0.0128 0.0128 0.0128 0.0128 0.0128 0.0117 0.0210 0.0233 0.0233 0.0233 0.0233 0.0233 0.0233 0.0233 0.0257 0.0222 0.0222 0.0210 0.0210 0.0210 0.0210 0.0210 0.0028 0.0027 0.0028 0.0029 0.0028 0.0030 0.0030 0.0042 0.0051 0.0054 0.0054 0.0053 0.0051 0.0050 0.0048 0.0048 0.0048 0.0048 0.0048 0.0048 0.0048 0.0048 0.0048 0.0047 0.0047 0.0048 0.0048 0.0048 0.0042 0.0030 0.0030 0.0028 0.0027 0.0028 0.0028 0.0031 0.0030 0.0030 0.0030 0.0030 0.0029 0.0028 0.0028 0.0027 0.0027 0.0028 0.0030 0.0030 0.0030 0.0030 0.0028 0.0027 0.0045 0.0052 0.0054 0.0054 0.0054 0.0054 0.0054 0.0054 0.0053 0.0051 0.0050 0.0048 0.0048 0.0048 0.0048 0.0048 0.0003 0.0003 0.0003 0.0003 0.0003 0.0003 0.0003 0.0003 0.0005 0.0005 0.0005 0.0005 0.0005 0.0005 0.0005 0.0005 0.0005 0.0005 0.0005 0.0005 0.0005 0.0005 0.0005 0.0005 0.0005 0.0005 0.0005 0.0005 0.0003 0.0003 0.0003 0.0003 0.0003 0.0003 0.0003 0.0003 0.0003 0.0003 0.0003 0.0003 0.0003 0.0003 0.0003 0.0003 0.0003 0.0003 0.0003 0.0003 0.0003 0.0003 0.0003 0.0003 0.0003 0.0005 0.0005 0.0005 0.0005 0.0005 0.0005 0.0005 0.0005 0.0005 0.0005 0.0005 0.0005 0.0005 0.0005 0.0005 0.0003 0.0003 0.0003 0.0003 0.0003 0.0003 0.0003 0.0005 0.0005 0.0005 0.0005 0.0005 0.0005 0.0005 0.0005 0.0005 0.0005 0.0005 0.0005 0.0005 0.0005 0.0005 0.0005 0.0005 0.0005 0.0005 0.0005 0.0005 0.0005 0.0003 0.0003 0.0003 0.0003 0.0003 0.0003 0.0003 0.0003 0.0003 0.0003 0.0003 0.0003 0.0003 0.0003 0.0003 0.0003 0.0003 0.0003 0.0003 0.0003 0.0003 0.0003 0.0003 0.0005 0.0005 0.0005 0.0005 0.0005 0.0005 0.0005 0.0005 0.0006 0.0005 0.0005 0.0005 0.0005 0.0005 0.0005 0.0005 0.0248 0.0234 0.0244 0.0251 0.0241 0.0258 0.0258 0.0365 0.0445 0.0469 0.0469 0.0459 0.0445 0.0436 0.0422 0.0422 0.0422 0.0422 0.0422 0.0422 0.0422 0.0422 0.0422 0.0415 0.0408 0.0422 0.0422 0.0422 0.0370 0.0258 0.0258 0.0248 0.0234 0.0244 0.0248 0.0272 0.0262 0.0258 0.0262 0.0258 0.0251 0.0244 0.0248 0.0234 0.0239 0.0244 0.0258 0.0258 0.0258 0.0258 0.0248 0.0234 0.0394 0.0450 0.0469 0.0469 0.0469 0.0469 0.0469 0.0469 0.0464 0.0445 0.0436 0.0422 0.0422 0.0422 0.0422 0.0422 0.0234 0.0258 0.0012 0.0012 0.0234 0.0234 0.0012 0.0012 0.0234 0.0258 0.0012 0.0012 0.0234 0.0258 0.0012 0.0012 0.0234 0.0258 0.0012 0.0012 0.0258 0.0258 0.0013 0.0013 0.0258 0.0258 0.0013 0.0013 0.0258 0.0422 0.0018 0.0013 0.0422 0.0469 0.0022 0.0021 0.0469 0.0469 0.0023 0.0023 0.0469 0.0469 0.0023 0.0023 0.0445 0.0022 To get0.0469 the cost 0.0023 used in one 0.0445 0.0445 0.0022 0.0022 hour the sum of0.0021 1hours data 0.0422 0.0445 0.0021 needs0.0422 to be taken 0.0422 0.0021 0.0021 0.0422 0.0422 0.0021 0.0021 0.0422 0.0422 0.0021 0.0021 2.147 pence / cents 0.0422 0.0422 0.0021 0.0021 0.0422 0.0422 0.0021 0.0021 0.0422 0.0422 0.0021 0.0021 0.0422 0.0422 0.0021 0.0021 0.0422 0.0422 0.0021 0.0021 0.0422 0.0422 0.0021 0.0021 0.0398 0.0422 0.0020 0.0020 0.0398 0.0422 0.0020 0.0020 0.0422 0.0422 0.0021 0.0021 0.0422 0.0422 0.0021 0.0021 0.0422 0.0422 0.0021 0.0021 0.0258 0.0422 0.0018 0.0013 0.0258 0.0258 0.0013 0.0013 0.0258 0.0258 0.0013 0.0013 0.0234 0.0258 0.0012 0.0012 0.0234 0.0234 0.0012 0.0012 0.0234 0.0258 0.0012 0.0012 0.0234 0.0258 0.0012 0.0012 0.0258 0.0281 0.0013 0.0013 0.0258 0.0305 0.0013 0.0013 0.0258 0.0258 0.0013 0.0013 0.0258 0.0305 0.0013 0.0013 0.0258 0.0258 0.0013 0.0013 0.0234 0.0258 0.0012 0.0012 0.0234 0.0258 0.0012 0.0012 0.0234 0.0258 0.0012 0.0012 0.0234 0.0234 0.0012 0.0012 0.0234 0.0281 0.0012 0.0012 0.0234 0.0258 0.0012 0.0012 0.0258 0.0258 0.0013 0.0013 0.0258 0.0258 0.0013 0.0013 0.0258 0.0258 0.0013 0.0013 0.0258 0.0258 0.0013 0.0013 0.0234 0.0258 0.0012 0.0012 0.0234 0.0234 0.0012 0.0012 0.0281 0.0422 0.0019 0.0014 0.0422 0.0469 0.0022 0.0021 0.0469 0.0469 0.0023 0.0023 0.0469 0.0469 0.0023 0.0023 0.0469 0.0469 0.0023 0.0023 0.0469 0.0469 0.0023 0.0023 0.0469 0.0469 0.0023 0.0023 0.0469 0.0469 0.0023 0.0023 0.0445 0.0515 0.0023 0.0022 0.0445 0.0445 0.0022 0.0022 0.0422 0.0445 0.0021 0.0021 0.0422 0.0422 0.0021 0.0021 0.0422 0.0422 0.0021 0.0021 0.0422 0.0422 0.0021 0.0021 0.0422 0.0422 0.0021 0.0021 0.0422 0.0422 0.0021 0.0021 Page 23 of 24 7.0 CHART PRINTING A simple version of the charts can be printed by selecting the Print option in the Export/Print menu. © 2 Save Energy Ltd 17/06/2011 Page 24 of 24