1
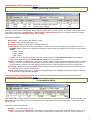
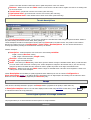
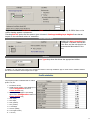
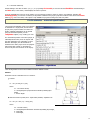
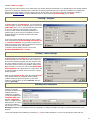
simply and fast profile creation
user manual
© gr z e gor z wis ow s k i
cr ea te d: 14-03-17
1
About this manual
The contents of this book coincides with the contents of the Profiler help file. Presented in this guide, book form, is for some users a
more user-friendly and easier to print.
About
Version: 2.61
Created: 20.02.2014 r.
Copyright by: Grzegorz Wisowski
Upgrades: www.profiler.wizart.cad.pl
E-mail: [email protected]
Order Profiler
The program has been used in waste water treatment devices offered by SOTRALENTZ - www.sotralentz.com
Due to the large number of applications available that support DXF format vector may be differences in the files are not read by the
program Profiler generated. Any differences are due to divergent interpretations of the contents of DXF files.
Purpose of the program
The Profiler is designed for developers of different pipeline networks. It offers help on data entry profile of each node, automatically
setting certain values, up to generate a profile, scheme and cross-section drawing. The drawing is saved as an accepted by most CAD
applications (eg. IntelliCAD, A9CAD, etc.). Due to a number of built-in functions and objects related to the biological sewage treatment
plants, the program particularly well suited when creating sewer profiles.
NOTE: to take full advantage of the program requires a minimum knowledge of network design.
Features
Profiler is intended for designers of various network's types, connecting terminals, etc. It helps with entering particular profile node
data, automatically determining certain values, until a profile drawing is generated. The drawing is saved in the format accepted by most
CAD's applications. On account of numbers of built-in ready objects related to biological sewage treatment plants, this program is
particularly useful for sewage networks profiles. Profiler automatically creates profiles of networks. It was developed for creating
sewage network profiles, however it can be successfully used for other network types. Profiler:
automatically determines characteristic profile values,
allows for easy and intuitive creation and modification of profiles,
facilitates inserting crossings and sleeve protecting tubes,
generates profile and object statistics,
includes objects (e.g.: manholes, cascade sumps, dampers, septic tanks),
generates drawings in the vector format DXF (possibility of further processing in CAD type applications),
is flexible - has many configuration options.
Project saving
Saving project after pressing
button
button located on the toolbar of the main window. You can load a saved project by pressing a
. By pressing the arrow on the right side of the button you can quickly open the four most recently opened or saved
projects.
Main rules
2
Table navigation:
[Cursors] - move to next cell;
[Home] - activates the first cell in the current node*;
[End] - activates the last cell in the current node;
[Ctrl]+[Home] - activates the first cell in the table;
[Ctrl]+[End] - activates the last cell in the table;
Data edition:
[F2] - go to cell edit;
[Insert] - inserts a new node (line) above the currently selected;
[Delete] - Deletes the currently selected node;
[Cursor Down] - If the currently selected node is the last one, adds a new end table;
[Shift]+[Cursor Down] - copies the contents of the selected cell to a cell that is below;
[Shift]+[Cursor Up] - copies the contents of the selected cell to a cell that is above;
[Shift]+[Alt]+[Cursor Down] - copies the current node data to the next node;
[Shift]+[Alt]+[Cursor Up] - copies the current node data to node of the previous;
[Ctrl]+[C] - copies the selected cell to the clipboard;
[Ctrl]+[V] - pastes the clipboard into the selected cell;
[Ctrl]+[Shift]+[C] - copies data from the selected node to the clipboard;
[Ctrl]+[Shift]+[V] - pastes the clipboard into the selected node;
[Enter] - confirm the data and closes the edit mode cell;
[Ctrl]+[selection range with the left mouse button] - selection and the ability to copy (eg a spreadsheet) in the area of
data;
[clicking on the column title] - selects the entire column;
[double-clicking in the cell] - adjusts the column width so as to be visible the longest text found in;
*) node (row) is currently selected - node (row), which is active (highlighted) a table cell.
Scheme - creating rules
The Profiler automatically creates a drawing of a network. If the project consists of multiple profiles, then the nodes with the same title
are connected (the program is not case sensitive). To get the correct combination must observe the following rules:
main profile (eg, network) should be included in the draft before the shorter profiles (eg, terminals) that will be connected to
him,
node, which will joined profile to a network node should be extreme (ie, first or last).
The angle at which it is to be connected to the network's profile in Column Angle in the Data table. Changing the sign on the minus
"-" You can get connected to other networks. You can automatically truncate too long sections of the diagram. The length over which
sections are spliced is defined in the Configuration window on the Other tab.
Profiles and nodes searching
In multi-profile projects, it can be difficult to move efficiently between profiles and nodes. In order to facilitate the ability to
quickly find introduced or node profile. To go into the Search you press the key combination Ctrl and F , or
choose from the menu Profile > Search.
Searching
To find the profile or node must be in the Search type search the name or part of it. When you enter a list of items found dynamically
updates. Double-clicking on the selected item or pressing the Go to... closes the search window and moves the cursor to the selected
profile or node.
Search works only within the currently open project/file and recognizes the size of the input letters (is case sensitive) (ie "Profile" and
"profile" are two different names).
Insertig data to the Data-table
3
In the Data-table one should enter details about nodes and sections of the considered profile. In the following table a characterization
of individual data was compared:
Column title
Sample
Unit
Description
m AOD
in order to implement ordinates of the ground level different for
left and right side of the node type e.g. : "212,11/210,50". Options
the one it is possible to use at drawing e.g. the dodge, of terrace.
211,30
m AOD
Using record like mentioned above for ordinate pipe bottom it is
possible to get the cascade well (when the ordinate of the intake
into the well is larger than of take-off) or pump station implementing the ordinate from left smaller than from right.
Depth
1,25
m
Length
5,50
m
Gradient
2
%
Material
PCV
-
Diameter
110
mm
Chainage
5,50
m
value determined automatically. (Except for the first node where
you can insert any value)
-
inserts at a point in the outline of the foundation of the building.
To determine the cavity of the foundation of the building and/or
floor level should be given their value in the Comment column after
the "@" sign, e.g. "building @2/210,20" where the first value is
the cavity bottom of the footing (in relation to ground level)
expressed in [m] and the second ordinate the floor level expressed
in [m AOD].
water-meter set
-
inserts to the profile fitting symbols consisting of a water-meter set.
They are located behind the outline of the wall (inside the
building). By entering the appropriate value after the "@" sign (as
an object building ) can change the location of elements of
the outline of the building, and thus the same set.
septic tanks
-
inserts to the profile chosen septic tank type. The program
automatically is putting the appropriate length of the septic tank.
SL-RR
-
inserts drainage distribution chamber. Automatically they are
appointed, to the section, of which a distribution well is a
beginning, length (Value taken from the tab Sewage treatment
plant > Drainage) and gradient = 1%.
SL-RBOU
-
inserts drainage ending chamber together with the sampling device
(if the checkbox Piezometer on the tab Sewage treatment
plant > Drainage is checked)
SL-RCOLV
-
inserts vertical sand filter collecting chamber
manhole /
water-meter
sump
-
inserts manhole (or cascade sump or pump station). Is possible to
specify the diameter and/or sump bottom ordinate. To do it in the
Comment column, enter e.g.: "manhole @1,2/210,35" where
value after "@" sign is the diameter expressed in meters, while the
value after "/" sign is the sump bottom ordinate expressed in
meters AOD. If some of values mentioned above won't be specify
the program will assume the diameter: 0.2 m and the ordinate of
the bottom of the sump equal of the ordinate of the bottom of the
most low pipe attached to the given sump.
separators
-
inserts chosen grease separator type
Ground level
Invert level
212,50
building
Object
enter the fall pipe preceded by a minus sign "-" (e.g. -2) we get
the opposite drop pipe, eg pumping cord.
choice between: PCV, PE, PP (how to add other material)
record e.g.: "110/160" will be interpreted by the program as "pipe
in the pipe" (applying e.g.: thermal insulation of the pipe, sleeve
protective tube) .
4
pipe
-
inserts a circle. If in the Comment column will be value of the
diameter expressed in millimetres, preceded by the "@" sign (e.g.:
"@60 mm") then a diameter of a circle is achieving the value
mentioned above in other case a diameter of a circle is equaling
the value quoted in Diameter column. You can specify the pipe
axis ordinate by writing it in [m AOD] after "@/" sign (e.g.:
"@60/210,00 ")
gasbox
-
inserts a gasbox
trench/slope
-
trench depth can be determined by typing ordinate value in
Ground level column after "/" sign e.g.: 210.00/209.50, where the
vakue 209.50 is trench bottom ordinate. Typing in Ground level
column the second ordinate larger than the first one
(np.:210.00/211.20) is it possible to get the cross-section e.g.: of
floodbank.
The trench width shall be giving its value, expressed in meters, in
the Comment column followed by "@" sign e.g.: "@3.5/2,5 m.",
where first value is width measured at the highest point of the
trench, while the second: the trench bottom value. When a trench
with vertical walls, simply enter only one value after the "@" sign.
dumper
-
insert dumper symbol
-
inserts ground hydrant symbol. In the Comment column is it
possible to specify hydrant diameter expresssed in [mm], preceded
"@" sign. To obtain the above-ground hydrant on the branch
should be specify number "1" after "@/" sign, e.g. record:
"@100/1" means above-ground hydrant on the branch with
diameter 100 mm.
If for the hydrant a defined diameter won't stay the program will
assume the diameter of 80 mm.
underground
hydrant
-
inserts underground hydrant symbol. In the Comment column is it
possible to specify hydrant diameter expresssed in [mm], preceded
"@" sign. To obtain the under-ground hydrant on the branch
should be specify number "1" after "@/" sign, e.g. record:
"@100/1" means under-ground hydrant on the branch with
diameter 100 mm.
If for the hydrant a defined diameter won't stay the program will
assume the diameter of 80 mm.
biofilters
-
inserts chosen biofilter type.
-
clears the contents of the cell
ground hydrant
Comment
any text value
-
placed below the profile at a given node typed text
Node
any text value
-
placed above the table name of the node
Line
210,50
m AOD
45
°
inserts the value of the angle of refraction, together with the
symbol of the direction. The introduction of a negative value will
change the direction of collapse.
m
value used to determine the volume of excavation and the creation
of cross-sectional drawing. The use of recording such as: "1.20 /
0.80" allows you to get a sloping trench walls (the first value
defines the "top" width of the trench and the second width
measured at the bottom).
Angle
Trench width
0,50
allows you to put on an additional line in profile, e.g. ground water
level, the proposed land line, etc. Recording format analogous in
"Ground level" column. (how to specify line name)
Profile parameters
5
By default, automatically calculated values in the Data table are: invert level, depth
and, regardless of the settings, the distance (with the exception of the initial value of
distance). Value to be entered manually is pipe slope.
You can change this settings on the Data tab, checking as Value entered
manually:
Invert level - the program automatically determines the values of depth and
gradient,
Depth - automatically are calculated invert level and gradient,
Gradient - automatically are calculated invert level and depth,
All - automatically is calculated only distance (chainage).
The Invert level column Data table may indicate one of the following values of pipe:
bottom,
axis,
top.
Preference should be given the option group Invert level. The choice also affects the way of connecting pipe on the profile, for
example, if the node is a reduction in diameter is selecting top - tube tops are aligned.
Checkbox pipe parallel to terrain line means that after the introduction of Depth in the first node and making the new
Ground levels program automatically determines the characteristic size of the next sections so that the pipe line runs parallel to the
ground.
By default, the compare level is determined automatically by the program. Sometimes, however, there is a need to give another of its
value, then you should select Compare Level and enter the field the appropriate value.
Moving/exchanging data between columns
To move data to other colmun or or exchange it between columns in
Data table, click left mouse button on source column and next click right
mouse button then choose Move data to column... item. Moving
and exchanging is possible only to column with similar unit kind eg. [m].
In open window is able to choose that after operation execute source data
will be:
left unchanged (they will be only copied to target column),
deleted, it's means values will left with zero,
exchanged with data from target column.
Target column will choosen from list of them (with the same units, without
source column).
Described above operations may concerns only marked node (not whole
column), if Only current node option will be checked.
Available objects
How to navigate the drop-down list Objects using the keyboard.
When you move (the cursor from the keyboard) to the column "Object", press press [Enter] , and then using the keys [cursor up]
and [cursor down] to select an item such as: "other..." and press [Enter] . On the drop-down list should appear in new objects
such as "building". After moving on it again press [Enter] . This drop will disappear and the object will be added to the Datatable.
The following is a tree with available in the current version of objects:
6
septic tanks
sewage treatment plants
grease separators
filters
liquid gas tanks
sumps: standard, water-meter
fittings ...
dumper
ground hydrant
underground hydrant
other ...
building
pipe
gasbox
trench/slope
water-meter set
empty (to remove from the Datatable already inserted object)
In addition, the list is heading "..". It allows you to return to the previous set of objects.
Object parameters
In the Object parameters window user can set some
parameters for choosen object's kind. There are different
parameters for each of kinds.
Profiler has got included some of predefinied objects. Files with
them are KRO extensions and are placed in "objects" directory. User
can create own object's defintions (tanks and sumps) based on
already exists. To do it insert an object to profile. Next go to its
edition by clicking F3 key on keyboard.
7
Object's definitions - tanks
For objects in the shape of the tank ie septic tanks, sewage treatment
plants, grease separators, filters and tanks used for storage of liquid gas
can be determined:
Volume [m3],
Width/diameter [m] - if the tank is "projected" circle then the
length should enter 0 (zero),
Length - L [m], - if value isn't set tank's width will be its
diameter, that means will be rounded in top view,
Height - H [m],
Inlet's bottom height - H1 [m],
Outlet's bottom height - H2 [m],
Inlet/outlet diameter - s [mm],
Cover 1/2: width/diameter [m] - if cover shape is circle, then
length value must be zero,
Cover 1/2: length - d1/d2 [m],
Cover 1: dist. from left l1 [m],
Cover 1/2: manhole height - Hk [m],
Cover 1/2: Extension shaft height - Hn [m] - if value is set
to 0 (zero) then application choose one extension shaft,
Cover 1/2: Extension shaft max. count [pcs] - maximal, accepted by producer, extension shaft quantity. If value isn't set
by user then Profiler will choose appropriate quantity to reach ground level,
Cover 2: distance from left side - l2 [m],
The radius of rounding upper corners - r1/r2 [m] - notation "x/y" is also accepted, where "x" means radius of the left
one, and "y" - the rigth corner,
The radius of rounding bottom corners - r3 [m],
With filter - checking this option determine to draw filter before tank's outlet
Base: width/diameter [m] - if value isn't set Profiler assumes value equal to tank's width
Base: length - F [m] - if value isn't set Profiler assumes value equal to its diamter
Base: heigth - b [m] - base is drawing if its height is above zero.
Pillar 1: distance from left - f1 [m]
Pillar 1: length - e1 [m]
Pillar 2: distance from right - f2 [m]
Pillar 2: length - e2 [m]
Pillars: heigth - h [m]
Object's definitions - sumps
User can modify the following sump's parameters:
Height - H [m],
If value is set then sump will has got a specified height regardless projected AOD
level. In other words: sump's cover may lay above or under projected ground
level. Default value is 0,00 (zero) - then height is automatically adjusted so that
the sump's top was at the projected ground level.
Height from bottom to inlet bottom - Ho [m],
Constans height, that user can set from sump's bottom to the bottom of the
lowest inlet/outlet. This parameter can be used eg for sediment sump, pump
stations etc. Default value is 0,00 (zero) - it's means sump's bottom is equated
to inlet/outlet bottom.
8
Height above projected AOD level - Ht [m],
Constans height, that user can set from sump's top to the projected groun/AOD
level. This parameter can be used eg for sumps protruding above the ground.
Default value is 0,00 (zero) - it's means sump's top is equated to projected
ground level.
Bottom ordinate [m AOD],
Setting ordinate of sump bottom allow to pin its bottom to entered ordinate.
Then ordinate of bottom inlets/outlets haven't got influence on sump's bottom
position. Default value is 0,00 (zero) - it's means sump's bottom ordinate is
automtically adjusted to inlets/outlets level.
Inner diameter - D [m],
Value of the inner diameter of sump. If value is 0,00 then diameter is set to 0,2
m.
Cover diamter - d [m],
Diameter of cover of sump. It's may have got a diameter other than the sump. Default value is 0,00 (zero) - it's means sump's
cover's diameter is equal to sump's diameter.
Distance from side of sump - L [m],
Distance from cover's left side to sump's left side. Default value is 0,00 (zero) - it's means cover's left edge is adjusted sump's
left edge.
Manhole height - Hk [m],
Height of sump's components where their diameter is equal to sump's diameter. Default value is 0,00 (zero) - it's means count
of components is none.
Cone height - Hs [m],
Height of cone adapter between component with sump diameter and component with cover diameter Default value is 0,00 (zero)
- it's means adapter is flat.
Extension shaft height - Hn [m],
Height of the component (with constans height) that allow to extend sump to ground level. Default value is 0,00 (zero) - it's
means application choose one extension shaft.
Extension shaft max. count [pcs] - maximal extension shaft quantity. If value isn't set by user then Profiler will choose
appropriate quantity to reach ground level (if sump cover is below ground level). If sump producer doesn't provide extension
shafts then choose none option or type -1.
Wall thickness [mm],
Thickness of the sump wall. Thickness is drawing in the cross-section drawing and in the profile drawing if thickness is greater
than 50 mm. Default value is 0,00 (zero) - .
Sump kind,
Kind of sump can be choosen from the list, appeared after going to edit mode. User can select from:
standard - default,
watermeter - drawing with equipment,
distributing - for drainage,
closing drainage pipes,
aerating vertical filter
Align cover to ground level,
If option is checked then sump drawing is begin from its cover, that is placed on ground level. If option is unchecked then
begining draw is sump bottom, that is equated to inlet's bottom level.
Without bottom,
Checking Without bottom option causes drawing sump without bottom, eg: infiltration sump.
Additionally in sump parameters window are showing parameters automatically calculated (read only):
9
[auto] Inlets - list of inlets/outlets of sump, also from other profiles in current project.
[auto] Height [m] - sump height
Crossings editor
Crossings editor used to enter the crossings occurring in the profile. Crossings should be introduced after entering data in the Data
table in the main window. The precision of the numbers placed in the window can be set in Configuration > Data Table >
Decimal places. The user can filter the amount of crossings presented by selecting the nodes between which they are situated.
Editor columns description:
Medium - name of the cable/pipe causing a collision (eg water, gas, phone, etc.).
Diamter - diameter of pipe causing a collision given in millimeters. If the pipe has e.g. sleeve protecting tube or insulation
diameter column needs to be filled as follows: "crossing_diameter/protecting_tube_diameter", where: crossing_diameter diameter of the collision, protecting_tube_diameter - diameter casing pipe of a collision. Protecting pipe is also taken when
generating the drawing.
Pipe bottom ord. - bottom ordinate of pipe causing a collision given in m AOD
Desripiton - Description of the collision, which will be shown in the drawing. The description can be used variables. Thanks
to them, most of all collisions may have the same desription. User has access to the following variables:
@m - medium name
@d - crossing diameter
@o - sleeve protecting tube diameter
@r - crossing pipe bottom ordinate
@h - crossing distance from the proposed pipeline
@z - crossing pipe bottom depth
@t - ground level at the collision place
@p - ordinate the proposed pipeline in the collision (axis, bottom or top depending on the state Invert level on the
Data tab)
@pd - ordinate the bottom proposed pipeline in the collision
@po - ordinate the axis proposed pipeline in the collision
A sample entry in the first collision in the screenshot above "@m fi @d mm @r" while creating a drawing will be replaced by
text "woda fi 40 mm 211.80" and as such placed on it.
Node - node name (from Data table), which will be given the distance to collision. When you edit this value you must select
a node from a list of existing ones. Crossing is assigned to the selected node, ie, the user can freely change its position in the
table each time without the need to update the position of the collision.
Distance - distance from node from Node column to axis crossing pipe. This value can be negative if it refers to an existing
node for the collision.
H - projected pipeline outline distance from the outline pipe/cable causing a collision, expressed in meters.
This value can not be modified by the user. It is continuously updated by the program. Values preceded by "+" means that a
collision is over, the proposed line, while the sign "-" - under it. Marked in red are designed collisions passing through the
pipeline, then column value is "0". If, however, one tube line (projected or conflicting) "shall" in the pipe casing of the second
(or an aspect only shielded pipes), the text cells turn red, and the value in it is different from zero.
Depth - collision depth expressed in meters above sea-level. If user knows collision depth and does not know the ordinate
may in this column, enter the value. Then the column Pipe bottom ord. will be updated automatically. Entering data in this
column is only necessary when there has been supplemented by a column Pipe bottom ord..
Columns: Medium and Description have the ability to quickly supplement names defined by the user in a window
10
Configuration > Most-used values. (more »).
Sleeve protecting tubes editor
Sleeve protecting tubes editor is used to enter: the sleeve protecting tubes, pipe insulation, etc. occurring in the profile. Sleeve
protecting tubes should be introduced after entering data in the Data table in the main window. The precision of the numbers placed
in the window can be set in Configuration > Data Table > Decimal places. The user can filter the amount of crossings
presented by selecting the nodes between which they are situated.
Editor columns description:
Diameter - sleeve protecting tube diameter in [mm]
Length - sleeve protecting tube length in [m]
Material - material from which made is sleeve protecting tube.
Description - description of the sleeve protecting tube, which will be shown in the drawing. The description can be used
variables. Thanks to them, most of all sleeve protecting tubes may have the same desription. User has access to the following
variables:
@m - material
@d - diameter
@l - length
A sample entry in the first sleeve protecting tube in the screenshot above "r.o. @m fi @d mm, L=@l m" while creating a
drawing will be replaced by text "r.o. PCV fi 250 mm, L=3 m" and as such placed on it.
Node - node name (from Data table), which will be given the distance to begin of sleeve protecting tube. When you edit this
value you must select a node from a list of existing ones. Sleeve protecting tube is assigned to the selected node, ie, the user
can freely change its position in the table each time without the need to update the position of the sleeve protecting tube.
Distance - distance from node from Node column to begin of sleeve protecting tube. This value can be negative if it refers
to an existing node for the sleeve protecting tube.
Kind - sleeve protecting tube type e.g.: insulation, sleeve protecting tube etc., depending on the chosen type, you can assign
the proper position while generating calculation.
Columns: Material, Description and Kind have the ability to quickly supplement names defined by the user in a window
Configuration > Most-used values. (more »).
Cross sections editor
Cross-sections editor is used to define cross sections of the proposed network. Sections should be introduced after entering data in the
Data table in the main window. The user can restrict the amount of presented cross sections by selecting the nodes between which
they are situated.
A description of each column of editor:
Name - cross section name (e.g. A-A).
Node - node name (from Data table), which will be given the distance to cross section. When you edit this value you must
select a node from a list of existing ones. Cross sections is assigned to the selected node, ie, the user can freely change its
11
position in the table each time without the need to update the position of the cross section.
Distance - distance from node from Node column to cross section. This value can be negative if it refers to an existing node
for the cross section.
Terrain level - ground level in chosen cross section (value read only).
Pipe bottom level - pipe bottom level in chosen cross section (value read only).
Trench bottom level - trench bottom level in chosen cross section (value read only).
Terrain descriptions
In the Terrain descriptions window, you can enter a description of the land under which the pipeline passes the draft. Thanks to
the profile drawing can be noted such as roads, lawns, paving etc.
Terrain descriptions should be introduced after entering data in the Data table in the main window. The precision of the numbers
placed in the window can be set in Configuration > Data Table > Decimal places. The user can filter the amount of
crossings presented by selecting the nodes between which they are situated.
Columns description:
Description - terrain description. User has access to the following variables:
@s - shortcut (Shortcut column)
@l - length of described terrain (Length column)
Shortcut - shorten terrain description
Length - length of described terrain
Node - node name (from Data table), which will be given the distance to begin of described terrain. When you edit this value
you must select a node from a list of existing ones. Terrain description is assigned to the selected node, ie, the user can freely
change its position in the table each time without the need to update the position of the begin of described terrain.
Distance - distance from node from Node column to begin of described terrain. This value can be negative if it refers to an
existing node for the terrain description.
Column Description have the ability to quickly supplement names defined by the user in a window Configuration >
Most-used values. (more »). By defining the list of descriptions such as "highroad|HR" and selecting it at the same time will be
filled in the column Description ("highroad") and Shortcut ("HR").
Sumps
There are list of all sumps included in project in the Sumps window (regardless of the profile, in which there are).
In Description template edit box user can define displayed items format using variables. Double click (or click
on selected item allows edit sump parameters.
Sump's list
Enter
key)
Technological systems of sewage treatment
The program allows you to choose between the three systems of sewage treatment:
drainage
12
If you checked the box Piezometer and in the Data table will be inserted ending sump SL-RBOU then on the
profile drawing appears a piezometer.
Checking End bar option and the amount given in boxes in Drainage bedding layer heights frame has an
impact on the calculated volume of excavation.
sand vertical filter
Checking the Auto correction box
to maintain a constant total surface
of the filter and the red signal is not
recommended dimensions of the
filter.
biofilter
From Type drop-down list choose the appropriate biofilter.
In addition, you can specify the length of the underground section of the "high ventilation" pipe. It will be used to calculate statistics:
the volume of excavation and the length PVC110 pipe.
Profile statistics
The program provides a statistical data of created
profile. They are:
1. Excavation volume,
2. Sidefill volume (height of the sidefill layer is
set in Configuration window on
Cross-section tab),
3. Bedding volume (height of the bedding
layer is set in Configuration window on
Cross-section tab),
4. Max. depth,
5. Min. depth,
6. Max. gradient,
7. Min. gradient,
8. Total length,
9. Section quantity,
10. The longest section,
11. Turf area,
13
12. Trench side walls area,
Double-clicking in the value of items: 4, 5, 6, 7, 10 (or pressing Go to node) to close the window Statistics and transferring to
the Data table, to the section, which displays the value in question.
From the selectable list on the top of the window you can select the profile for which you want to view statistics. Selecting all
marked profile, you can view a summary of the profiles contained in the project (only those marked on the sheets in the Data
table by [+] next to the name). This option is only available for projects involving more than one profile.
Profile statistics - materials specification
The program automatically creates a specification
of materials for a single profile, and the whole
project (if the project contains more than one
profile). Materials specification can be printed
using the included templates (see the
Templates chapter) or by creating your own.
If in the different profiles of the same project, in
identically named nodes, there are objects with
the same parameters (eg, manholess of equal
diameter and height) is in the statement of
material for the entire project is not the program
will increase their number (to be taken into
account only the first occurrence of the object).
Statistics - algorithms
There are algorithms used in some formulas in Profiler's statistic module.
Volume:
Excavation volume is calculate as sum of volumes:
sections:
V1 = H x (S1+S2)/2 x L [m3]
where:
V1 - one section volume,
H - averaged depth of pipe bottom increased by bedding layer
height,
L - section length.
tanks that exists in profile, like a: septic tanks, biofilters, separators etc.:
V2 = H x (S + Rx2) x (L + Rx2) [m3]
where:
V2 - one tank volume,
H - averaged depth tank bottom increased by bedding layer height,
S - tank width,
L - tank length,
14
R - width of additional hollow (menu: Tools > Configuration > Cross-section).
sumps:
V3 = H x (D + Gx2 + Rx2) [m3]
where:
V3 - one sump volume,
H - averaged depth sump bottom increased by bedding layer height,
D - sump diameter,
G - sump wall thickness (menu: Tools > Configuration > Cross-section),
R - width of additional hollow (menu: Tools > Configuration > Crosssection).
Sample
The following example uses the selected capabilities of the Profiler. To start it, press the button
located on the toolbar. Then
select the file "sample_1.kre". The table on the Data tab will show the following data:
Ground
Invert level
level
Depth
Length Gradient Material Diameter Chainage Object
Comment Node
[m
AOD]
[m AOD]
[m]
[m]
[%]
[-]
[mm]
[m]
[-]
[-]
[-]
212,21
211,85
0,36
10,00
2
PCV
110
0,00
building
building
w1
212,10
211,65
0,45
2,50
2
PCV
110
10,00
crossing
crossing
@210,70
m AOD
w2
212,05
211,60
0,45
1,90
1,58
PCV
110
12,50
EPURBLOC
2000
212,05
211,57
0,48
5,00
2
PCV
110
14,40
212,00
211,47/210,85 0,53/1,15 5,00
2,0
PCV
110
19,40
manhole
cascading
w5
manhole
211,25
210,75
0,50
1
PCV
110
24,40
SL-RR
SL-RR
sump
w6
211,20
210,59
0,61
2,0
PCV
110
40,40
SL-RBOU
SL-RBOU
sump
w7
16,00
w3
w4
This profile consists of seven nodes. Data in columns: ground level, invert level, depth, object, node and comment refer to the current
node and other data to the segment between the current and the next node. When you click the Preview tab, in the Profiler directory
will create file "rysunek.dxf" which, when loaded into the CAD application can modify and print. Profile generated from the sample data
looks like the figure below.
15
NOTE: File "rysunek.dxf" is overwritten every time: you click a Preview tab, after select Print and after select Statistics. If the
profile is not saved under a different name will be irretrievably lost when creating a new profile.
Configuration - User
On the User tab you can set data describing the company - the
program user. These data can be used in projects created using the
variables in: Infotable and Documents templates.
Configuration - User - Workers
On the Workers tab, enter the following
personal data of employees when they are
developing technical specifications for the
company:
Name
Appointment
Right number
Speciality
Inserted persons can then select the window Project parameters on the Designers tab.
Configuration - Drawing
In the Configuration window on the
Drawing tab is possible to set for drawings
(profile, schema, cross-section):
16
scale, independent for X and Y axis,
name,
number.
Name and number of the drawing may be used as
variables in associated documents and in the
Infotable (eg by using the variable
@_drawing_name, you can use one metric for
all types of drawings).
If you choose to Fit profile drawing to page width the Profiler automatically adjusts the scale of the horizontal ("X") so that
the generated profile drawing fit the currently selected paper format (eg A4 format). Additionally, the user can impose a minimum
stroke in the selection of scale by entering the value in the text box Scale interval. For example: when you are given a jump equal
to "50" is a program that will analyze the following scale, starting at 1:1, increasing further to 50 (1:50, 1:100, 1:150, etc.) until it finds
such at which the total drawing will fit on the currently selected (in the print settings) page size. This option works only for the profile
drawing.
Use the drop-down list Unit, you can choose the smallest unit of generated figure. Default unit is [mm].
By clicking Default Infotable, you can choose a Infotable template that will be used by default in newly created projects.
For the changes have been saved even after you close the program, press the button Save.
Configuration > Drawing > Layers
On the Layers tab can manage layers, which can be
attributed to the elements: (lines and fonts) of generated
drawing.
For each layer, you can specify its name, color, line type and
line thickness.
Line thickness can be freely determined only by a continuous
line. For others, the line thickness can only take the value 1.
Shortcuts:
-----------------[Insert] - adding new layer,
[Delete] - deleting selected layer (layer "0" can't be deleted),
[Cursor down] on last item - adding new layer on the end of table,
[Enter] on Color column (or double click on Color column) - opens Select color window.
Configuration > Drawing > Table
The user can modify the contents of the table
inserted under the profile drawing. List of data
that can be placed in the table. The table contains
the following columns:
No. - item number determines the order of
the data. The order can be changed by
clicking (on a column No.) and dragging
the line in another location,
Checkbox row - only the selected rows in
this column are placed in the table below
the profile,
Description - The title line that appears at
the beginning of the table. The pipe
Invert level, you can use a variable
@r, which at the time of generating the
drawing will be replaced by the word
"axis", "bottom" or "top" - depending on the profile settings,
Unit - A unit in which values are presented in a row,
Precision - The precision with which it is presented by a number (number of decimal places),
17
Node - check box to select where data from node prompt concern, and do not relate to the section between the nodes. From
the appropriate selection depends, among others direction of the text in the row (vertical or horizontal),
Expression - Expression can only change in rows added by the user. A formula can consist of variables and values. For example,
using the expression "@_td_ground_level+1" will result in the elevation of land value from Data table increased by 1. After
adding a line based on this formula, you can get a line parallel to the line of site.
Height - is determined as a percentage of the default row height of the table.
To change the order to enter data in the table below the profile, click on the column No. row to be moved and hold down the mouse
button, drag and drop a line to a new location in the table.
By checking the box Chainage to get under the table line with those distances.
Selection List Chainage allows you to specify the unit, which will be given full value of the distance. Choosing Automatic causes
selection the largest unit for given profile,
eg, when the total length is 321.50 m profile unit in which distances will be given hectometres.
If the data group in the table Put into table when non empty will be awarded an option "Line 1" and "Line 2" and/or
"Angle" and/or "Terrain description" then will be placed into table under the profile data from the column "Line 1", "Line 2"
and "Angle" and "Terrain description" (regardless of the settings in the appropriate positions in the table above), if the above data has
been entered.
Checking option Gradient - Inverted will be placed on the table, the inverse slope (eg 50 for a slope 2%). The entry of this type
is used in some countries. The text in a text box Gradient - Prefix will be placed before the value of the slope.
For the changes made are saved when you quit, press the button Save.
Configuration > Drawing > Fonts
On the Fonts tab, you can specify the
parameters of the fonts that are used in the
generated drawing.
The requested typeface, choose from the
dropdown list Name. It can be found on only
those fonts installed on the system of which lend
themselves to scaling. Moreover Profiler
automatically added to the list of all files (not all
fonts need to be) from the directory "Fonts"
default CAD application. The names of these fonts
are gray. If the font of this type are found, their
use is stoned. If the program does not
automatically find these fonts can be identified manually by pressing Directory, the font directory application used to edit the
generated profile.
Regardless for comments, the texts contained in the table below the profile and the imprint of the project can change the fonts, the
following parameters:
height
color; Chosen from Colors window, created by double clicking the left mouse button. There are 255 standard
colors. Their subsequent numbers correspond to the numbers assigned to corresponding colors used in most CAD
applications.
distance from vertical line (Space column).
width percentage (Width column). Described as a percentage (100% means that the width is not modified
by changing the value - is changed character width).
layer, to which the text will be assigned on the drawing (Layer column).
By default, the table under the profile names are placed on the right vertical line (passing through the node). Option Ordinate
descriptions in profile drawing on the left allows you to put names to the left of the vertical line.
Configuration > Drawing > Lines
On the Lines tab, you can set the color and the
layer of the following lines formed in the picture:
terrain,
18
pipe,
trench bottom,
additional - first,
additional - second,
creating the profile table,
creating the Infotable,
at which the comments are.
By removing the check from the box Draw next
to the line can block its generation. Line the
bottom of the trench is generated only when the amount of bedding on the Cross-section tab is greater than zero.
If Single pipe line option is checked on the generated drawing pipe will draw by one line.
In addition to the default line, you can add your own line. To do this you must first add a new item in Table with the formula, which
will be determined by the ordinates of the new line. Then set the cursor to the last row of the table with the lines and press the key
[cursor down] on your keyboard.
For the changes made are saved when you quit, press the button Save.
Configuration > Drawing > Parameters
Checking Draw ordinate next to... chamber bottom, with ordinate specified by user option, will
put on profile, next to the bottom of the sump, the marker with ordinate value. This option applies only to those sumps
for which the user has defined the ordinate in the Commentary field in the Data table.
Similarly, selecting this option on the crossing causes the ordinate of the crossing on the created profile will next to the location
of the crossing.
Selecting Show in crossing place: distance from profile's begining and/or Show in crossing place: pipe
ordinate options causes typing distance and/or ordinate of the proposed pipeline to the table under the profile, in crossing's
location.
Selecting Write distance where protecting tube begining option place of the beginning of the protecting pipe will
enter the distance in the table below the profile.
To force the inclusion on the first Profile string "Datum ground level..." in the level of the select Horizontal AOD in first
profile.
Selecting Mark sump inlets... puts on sumps inlets ordinates (from other profiles/tabs located in the same project). This
option affects only the sumps added as object "sump", available since version 2.50. Does not apply to wells added as an object
"manhole". Inlets are marked only for projects containing more than one profile.
Edit box Distance between profiles [mm] is used to determine the interval between each picture profiles (if the project
contains more than one profile). The distance should be expressed in millimeters of print.
On the network schema drawing program can automatically cut sections. Will be shortened sections longer than that given in the
field: Trim sections longer than ... [m].
Option Protecting tube description line join point allows you to specify the location from which will be derived
vertical profile description in the drawing. The choices are: a beginning, middle and end of the casing pipe.
Configuration > "Data" table
Increasing the value of the Font height can include
introduced to improve the readability of the Data table.
From the selection list Decimal places, you can choose the
size rounding of the values displayed in the Data table.
Unchecking Color Data table can get pastel "background"
automatically calculated fields in a Data table.
In drop-down list Gradient unit you can select the unit in
which gradient in Data table will be introduced.
By default, pipe depth in the Data table is calculated to the
bottom or base (depending on the selected options Invert
19
level on Data tab). Unchecking Always calculate
depth to pipe bottom calculation of the depth is always
at the bottom of the pipe.
If you select Always Show bottom pipe ordinate in the table displays data in the Invert level column, bottom
ordinate - without regard to choice of options Invert level.
Group Ground level interpolation, when... forces the automatic determination of ground level at a node if:
missing - ordinate field area in the Data table is empty,
node name include "*" - node name contains the "*" character (the character is not placed in the generated
drawing). Node for interpolation can be selected using the keyboard shortcut [Ctrl + I] .
A necessary condition for the automatic implementation of the interpolation is the existence of the Ground level in any node
before and behind interpolated node.
Configuration > Autofilling
In order to speed up profiles data entry, the
program allows you to select values that will be
automatically inserted into the table. These values
can be modified in the window Configuration
on Autofilling tab. Values, which may be
supplemented are:
slope;
diameter;
material;
node name.
Node prefix can be created
automatically (by the name of the
object in a given node) or on the
basis of the prefix specified by the
user (allowable number of
characters in the prefix is 3).
Checking the box Incrementation will automatically add numbers of nodes.
trench width
In addition to standard options, the width can be calculated by adding the current value of the diameter specified
in the Add to diameter:. To get the trench with slope walls, choose to Trench wall slope 1: and
specify the size of the slope.
Checking like previous node causes the insertion to the next, the new node value given in the previous node.
Unchecked box next to the value would not make it into the data entry.
For the changes made are saved when you quit, press the button Save.
Configuration > Most-used values
In order to speed up data entry to the Data table, to Crossing
editor and to Sleeve protecting tubes editor program allows
the user to define values that will appear on the lists of hints.
These values can be modified in the window Configuration >
Most-used values. You have the following data list:
Material - appears on lists in Data table and in
the Sleeve protecting tubes editor;
Comment - used in Data table in Comment column;
Medium - used in Crossing editor;
Description - crossings - used in Crossing editor;
Description - sleeve protecting tubes - used in Sleeve protecting tubes editor;
Node description - schema - used on schema drawing to describe the nodes;
Section description - schema - used on schema drawing to describe the sections;
Pipe type - sleeve protecting tubes - used in Sleeve protecting tubes editor;
Calculation type - calculation - used in Calculation configuration;
20
Terrain descrition - terrain descriptions - used in Terrain descriptions window;
The selection of an appropriate list of data is done via drop-down List.
In the case of most lists is the preferred use of the available variables. This allows you to use the same description for many cases. To
make permanent the new value to your data, add it and press Save.
Configuration > Cross-section
Change the value Sidefill height and Bedding
height affect the determination of approximate volume
of excavation, sidefil and bedding in the Statistics
window. In addition, these parameters are taken into
account when generating the cross-sectional drawings.
Text box Pipe description is used to describe the
pipe placed on the cross-section. It is advisable to use
the description of the following variables:
@m - pipe material,
@d - pipe diamter [mm],
@o - sleeve protecting tube diameter [mm],
@r - pipe ordinate [m AOD],
@z - pipe bottom depth [m]
For example, write "@m@d @z m" will be converted automatically in the drawing for the description of "PCV160 1.60 m".
Wall thickness of the manhole should be provided in the text box Sump wall thickness. It will be used when generating the
manhole cross-section well.
Configuration > Data safety
To improve the security of data, stored in a project file,
you can select Create file backup. Selection makes
when you open the file, create a copy of it. A copy is
saved in the same directory as the opened file. Name
the backup file is created with the name of the file to
open and an additional extension .BAK.
Backup file is created if it does not exist or an existing copy of the file being opened is older than 1 day.
Additionally, you can activate auto-save the currently open file. To do this you should enter the time in minutes, after which the
program is to save the data to a file. If the current project has not yet been saved and no file name given to the program saves it to file
"document.~kr", located in the folder with the Profiler.
Time equal to zero minutes turn off auto-save feature.
Configuration > Other
Unchecked checkbox positive
gradient value - Pipe up means
that if the pipe slope is given as positive
value, the program will calculate the next
node ordinate the pipe bottom lower than
the current node. The opposite
interpretation may be obtained by
checking the above checkbox.
Deselecting Crossing ordinate next
to crossing causes the crossing
ordinate on created profile, in addition to
the vertical line, will be also next to the
location of the crossing.
Selecting Show pipe ordinate in crossing place option typing ordinates of the proposed pipeline to the table under
21
the profile, in place of crossing.
If the Sewage Treatment Plant tab is not used can be hidden by unchecking the Show sewage treatment tab
option.
To force the inclusion on the first Profile string "Datum ground level..." in the level of the select Horizontal AOD in first
profile.
Edit box Distance between profiles [mm] is used to determine the interval between each picture profiles (if the project
contains more than one profile). The distance should be expressed in millimeters of print.
On the network schema drawing program can automatically cut sections. Will be shortened sections longer than that given in the
field: Trim sections longer than ... [M].
In the edit box File name pattern can be defined with the help of variables template, according to which the program will
offer a file name when trying to write newly created project.
Drop-down list Jezyk/Language, you can choose the language in which all text will be presented in the program.
Infotable editor
Infotable editor is located in the main window on the Infotable tab. With it you can create a table, which will include basic data such
as describing the development, designer, etc. It can be virtually any shape and include additional data.
Infotable editor features
Inserting text boxes in the editor:
Text box - Insert a text box.
Title list - Placed in the editor drop-down list the titles of the drawings. If you type the title that is not listed, then it
will be stored permanently after going to the Preview tab.
to change Location
Navigation: Use the arrows buttons
or Size
of box in the editor
where the cursor is currently positioned. After pressing x10 button is increased ten-fold jump during the operation using the arrow
keys.
Aby przeciągnąć myszką pole w metryce naleŜy wcisnąć na klawiaturze przycisk [Ctrl].
Deleting text boxes: Pressing
Delete text box button will delete the text box in which the cursor is currently positioned.
If there is no need to put the Infotable in the drawing, press the
button.
Working with templates
Formed metric can be saved as a template by pressing the
button. The saved template can be used in new projects after
pressing
button and selecting from a list file with the
appropriate template. You can create unlimited number of templates.
You can enter anywhere in the template variables listed in
Templates chapter.
The picture shows a sample Infotable template. It draws on all
available types of items, and some variables.
Print preview
22
To view the generated profile, click on the Preview tab. The following describes functions of the buttons on the tab:
- zoom in, (also key [+] on numeric keyboard)
- zoom out, (also key [-] on numeric keyboard)
- original size,
- previous view.
Pressing
Pressing
Pressing
Pressing
Hide crossings will hide all crossings and their descriptions on profile drawing.
Hide protecting tubes will hide all sleeve protecting tubes and their descriptions on profile drawing.
Hide cross-sections will hide all cross-sections and their descriptions on profile drawing.
Hide pagination will hide pagination conturs on drawing. (Warning: Conturs are not printing).
Additionaly after Panel activation (by pressing F4 key) following options are available
to adapt the scheme drawing:
Determining the initial angle of the scheme.
X Offset - Horizontal offset from the position imposed automatically by the
program.
Y Offset - Vertical offset from the position imposed automatically by the
program.
Node description - pattern of node descriptions.
Section description - pattern of section descriptions.
In the node and section descriptions should be used variables (located in the Data table).
By clicking Open preview in new window can move the preview to the new window. This allows you to "live" observe the
impact of changes on the created drawing. This option can significantly improve the ease of working with computers designed for
simultaneous display on two monitors. Not recommended for use in a separate preview window for older computers.
Hints:
double clicking the left mouse button anywhere in the preview is the place to move to the center of the preview
circle with the mouse any viewing area, with the left button, causes its enlargement,
moving the mouse while pressing the right button to move the generated drawing
mouse wheel rotation, depending on its direction, causing zooming in or out of the picture.
drawing can be moved using the cursor keys,
hold [Ctrl] key while pressing the cursor keys result in faster movement.
Printing
If the automatically generated profile does not require further
modifications in the CAD application you can print it by
clicking the button with the printer or by choosing in menu
Project > Print ....
In the window that appears on the tab Scale need to decide
on the scale of the print giving the ratio of output to the
amount of millimeters adopted drawing entities. Optimal
choice can be made automatically by selecting Select
automatically.
If the printed image has to fit on one page, select Fit to
page. Then the program selects the same scale so that the
drawing is best suited to your page. In the shaded area Fit
to page you can center the drawing on the printed page by
23
selecting Center on page.
On the right side of the window you can select pages to be printed. Each grid corresponds to one printed page for the currently selected
paper size. By clicking on individual boxes or mark them for printing. Will be printed only in yellow boxes marked. The program shall
appoint the necessary number of sheets of paper (squares) for the profile. The user may try to change the number of pages by
changing the margin settings or choose a different paper size by pressing the Printer Setup (next to Print).
Printing - margins
In Print window on the Margins tab, you can change the
range of printing on paper, for example, typing in the text box
Left [mm] value of "11.0" get unprinted area with a width
of 11.0 mm, starting from the left edge of the paper.
If the user enters a value less than that provided for a
particular type of printer from the manufacturer, then the
program will impose a minimum allowable value of the
modified margin.
If the output profile will take more than one piece of paper
worth uncheck the box Print drawing boundaries as
> crosses in corners. This reprinting of small crosses
marks in the corners of the drawing, which may be useful for
gluing the individual pieces of the profile.
To obtain a printout drawing a border, choose Print
drawing boundaries as > frame.
Printing - other settings
In Print window on the Other tab, you can choose how to
create a print between vector and raster. Raster method is a
bit slower and should be selected only when the print using
the vector method is incorrect (e.g. out of the text or lines).
If the raster method is chosen it is possible to obtain a print
black and white. To do this you need to select Black and
white printout. This option allows for a clearer print. This
is evident especially in printers with low resolution or poorly
printing grayscale.
When you select Print to file option after pressing Print
in the Profiler directory is created file with the drawing
(without sending the print to the printer.) In the vector
method to create the print, the file is print.emf, while the
raster file print.bmp.
Working with templates
Content of generated
documents is drawn from a
template placed in a
subdirectory "templates".
To edit the template press
Template edit button
placed in Templates
window. Template file has
WZR extension. Its content
can also be modified in
any text editor (e.g.: Notepad).
Warning! Modification of the template involves the appearance of change generated in the future, documents that are based on the
template.
Lesser-used templates can be hidden by pressing the +/- button. Hidden templates, you can see by pressing the button with the
24
image of the trash. Restoring the hidden template is held by analogy as hidding.
With the program among others templates are being delivered: specification of Datatable, materials specification, profile statistics.
You can create your own document template that uses customer data (e.g. request to the office, technical description, imprint to the
envelope, any protocols, etc.). To do this, create a file of any name and WZR extension (eg test.wzr) and open it in a text editor (e.g.
Notepad). Template must include a heading and actual content of the document. When you create a new template must be placed in a
"templates" subdirectory.
Template header sample:
<HEADER>
<TITLE>Profile statistics</TITLE>
<FONT_SIZE>12</FONT_SIZE>
<FONT_NAME>Tahoma</FONT_NAME>
<TYPE>htm<TYPE>
</HEADER>
Where:
-------------TITLE: The title of the template, which appears in the drop-down list of templates
FONT_SIZE: The font size for a given template
FONT_NAME: Font name for the template
TYPE: Document type (htm - allows for free text formatting, placement of tables, but it is difficult or editable txt - have fewer
opportunities generated document formatting, but readily undergo editing).
To put the data in the created document, you must use the variables. They can be put anywhere in the document. Discharged below
the variable names and data assigned to them:
Lines that begin with "/ /" are not included in the resulting document;
====== User data ======
@_company_name - company name
@_company_place - place/street
@_company_zip_code - zip code
@_company_post - post office
@_company_phone - phone number
@_company_fax - fax
@_company_mail - e-mail
@_company_www - www
@_company_user1 - user data
@_company_user2 - user data
@_company_user3 - user data
====== Project data ======
@_investor - investor
@_investor_place - address: city / street
@_investor_zip_code - address: postal code
@_investor_post - address: post office
@_object - object
@_investment - investment
@_investment_place -city / street
@_investment_zip_code - postal code
@_investment_post - post office
@_investment_commune - community
@_investment_allotment_no - allotment number
@_project_type - trade
@_project_oder_no - order number
@_project_date - date
@_user1 - user data
@_user2 - user data
@_user3 - user data
====== Calculation data ======
@_k_investor - investor
@_k_investor_place - address: city / street
@_k_investor_zip_code - address: postal code
25
@_k_investor_post - address: post office
@_k_object - object
@_k_investment - investment
@_k_investment_place - city / street
@_k_investment_zip_code - postal code
@_k_investment_post - post office
@_k_investment_commune - community
@_k_investment_allotment_no - allotment number
@_k_project_type - trade
@_k_project_oder_no - order number
@_k_project_date - date
@_k_user1 - user data
@_k_user2 - user data
@_k_user3 - user data
Adding at the end of the variable ' (apostrophe) character its value is retrieved from the data contained in the calculation. Conversely, if
you select Save calculation parameters with KRE file as the value of the variable will be inserted into the similar, the data
retrieved from the project.
====== People taking part in the creation of documentation (max. 9) ======
@_designer_name_1 .. @_designer_name_9 - names
@_designer_offic1 .. @_designer_offic9 - job titles
@_designer_right1 .. @_designer_right9 - right number
@_designer_speci1 .. @_designer_speci9 - specialty
====== Current profile statistics ======
@_stat_volume_excavation - volume of excavation
@_stat_volume_sidefill - volume of sidefill
@_stat_volume_bedding - volume of bedding
@_stat_area - turf area
@_stat_walls_area - side walls area
@_stat_depth_max - max. depth
@_stat_depth_min - min. depth
@_stat_slope_min - max. slope
@_stat_slope_min - min. slope
@_stat_stat_length - profile length
@_stat_sections_quantity - number of sections in the profile
@_stat_section_max - length of the longest section in the profile
====== Total profiles statistics ======
@_stat_avolume_excavation - volume of excavation
@_stat_avolume_sidefill - volume of sidefill
@_stat_avolume_bedding - volume of bedding
@_stat_aarea - turf area
@_stat_awalls_area - side walls area
@_stat_adepth_max - max. depth
@_stat_adepth_min - min. depth
@_stat_aslope_max - max. slope
@_stat_aslope_min - min. slope
@_stat_alength - profile length
@_stat_asections_quantity - number of sections in the profile
@_stat_asection_max - length of the longest section in the profile
@_stat_joins_amount - joins amount to existing pipelines
@_stat_wall_quantity - amount of break through the wall of the pipeline route
@_stat_tank_excavation_volume - volume of excavation for the septic tanks occurring in the profile
@_stat_yield_surplus_disposal_quantity - quantity of exports of surplus excavated material
@_stat_pumpstation_quantity - number of pumping stations in the profile
@_pumpstation_exists - if the profile is pumping a variable returns the value 1 (otherwise 0)
====== Excavation cross-section ======
@_trench_bedding_height - bedding layer height
@_trench_sidefill_height - sidefill layer height
====== Water treatment plant ======
@_o_biofilter - type of biofilter
26
@_o_filter_width - vertical sandfilter width
@_o_filter_length - vertical sandfilter length
@_o_filter_area - vertical sandfilter area
@_o_drain_trench_quantity - drainage trench quantity
@_o_drain_trench_length - drainage trench length
@_o_drain_field_quantity - drainage fields quantity
@_o_drain_length - drainage total length
@_o_gravel_volume- amount of gravel below drainage [m3]
@_o_sand_volume - amount of sand below drainage [m3]
@_o_geotextile_length - geotextile length
@_o_septic_tanks_volume - septic tanks volume
@_o_septic_tank - septic tank type
@_o_separator - separator type
@_o_vent_length - underground vetilation length
@_o_pumpstation_distance - electric wire to pumping station length
====== Material specfication for current profile ======
<_MAT> - beginning of the line with the following variables
@_tm_name - material name
@_tm_quantity - quantity
@_tm_unit - unit
@_tm_node - node name (only for manholes)
====== Material specfication for all profiles ======
<_AMAT> - beginning of the line with the following variables
@_tm_aname - material name
@_tm_aquantity - quantity
@_tm_aunit - unit
@_tm_anode - node name (only for manholes)
====== Data table ======
<_DAN> - beginning of the line with the following variables
@_td_ground_level - ground level
@_td_max_ground_level - max. ground level in node
@_td_pipe_level - invert level (bottom or axis) depending on the settings
@_td_pipe_level_mode - depending on the settings replaced with the word "bottom" or "axis"
@_td_bottom_level - manhole bottom ordinate in given node
@_td_bottom_levels - ordinates all the pipes reaching the node are separated by a _ character
@_td_depth - pipe depth
@_td_length - section length
@_td_gradient_unit - slope unit
@_td_gradient - slope
@_td_material - material
@_td_diameter - diameter
@_td_diameter_m - diameter expressed in [m]
@_td_chainage - chainage
@_td_object - object
@_td_comment - comment
@_td_node - node
@_td_line1, @_td_line2 - additional lines
@_td_angle - refraction angle in the node
@_td_width - trench width
====== Crossings ======
<_KOL> - beginning of the line with the following variables
@_tk_medium - medium name
@_tk_diameter - crossing diameter
@_tk_pipe_bottom_level - crossing bottom ordinate
@_tk_comment - crossing description
@_tk_node - chosen node
@_tk_node_distance - distance from the crossing of the chosen node
@_tk_h - vertical distance from the pipe to crossing
@_tk_depth - crossing depth
====== Sleeve protecting tubes ======
27
<_OSL> - beginning of the line with the following variables
@_to_diameter - sleeve protecting tube diameter
@_to_material - sleeve protecting tube material
@_to_length - length
@_to_comment - description
@_to_node - chosen node
@_to_node_distance - distance from the sleeve protecting tube beginning of the chosen node
====== Other ======
@_t_lp - sequence number in the tables
@_data - current date
@_compare_level - compare level
@_profile_name - profile name
@_crosssection_name - cross-section name
@_drawing_name - name of the generated figure (profile or cross section)
@_drawing_number - generated figure number
@_scale_x - horizontal scale drawing (X)
@_scale_y - vertical scale drawing (Y)
====== Calculations ======
@_ko_calc_kind - calculation type chosen in "Calculation parameters" window
<_CALCULATION> - beginning of the line with the following variables
<_ELEMENT> - beginning of the line with the following variables
<_POSITION> - beginning of the line with the following variables
<_MATERIAL> - beginning of the line with the following variables
Summaries:
@_ko_[opcja]w_netto - net worth with mark-ups
@_ko_[opcja]w_vat - value of the vat tax
@_ko_[opcja]w_brutto - gr value with mark-ups
@_ko_[opcja]w_nettor - net worth of the labor (without mark-ups)
@_ko_[opcja]w_nettom - net worth of the materials (without mark-ups)
@_ko_[opcja]w_nettos - net worth of the equipment (without mark-ups)
@_ko_[opcja]w_skpr - value of the indirect costs of labor
@_ko_[opcja]w_skzm - value of the indirect costs of materials
@_ko_[opcja]w_skps - value of the indirect costs of equipment
@_ko_[opcja]w_skp - value of the indirect costs
@_ko_[opcja]w_szkpr - value of profits from the indirect costs of labor
@_ko_[opcja]w_szkzm - value of profits from the indirect costs of materials
@_ko_[opcja]w_szkps - value of profits from the indirect costs of equipment
@_ko_[opcja]w_szr - value of profits from the labor
@_ko_[opcja]w_szm - value of profits from the materials
@_ko_[opcja]w_szs - value of profits from the equipment
@_ko_[opcja]w_sz - value of profits
@_ko_[opcja]w_net_narzr - net worth of the labor (with mark-ups)
@_ko_[opcja]w_net_narzm - net worth of the materials (with mark-ups)
@_ko_[opcja]w_net_narzs - net worth of the equipment (with mark-ups)
@_ko_[opcja]w_brutto_narzr - gr worth of the labor (with mark-ups)
@_ko_[opcja]w_brutto_narzm - gr worth of the materials (with mark-ups)
@_ko_[opcja]w_brutto_narzs - gr worth of the equipment (with mark-ups)
[option] can take values:
calc_ - values refer to the calculation
element_ - values refer to the calculation elements
position_ - values refer to the calculation positions
e.g.: variable @_element_w_netto will be converted into calculation element worth netto with mark-ups
Mark-ups:
@_[opcja]n_vat - VAT rate
28
@_[opcja]n_kpr - value of the indirect costs of labor [%]
@_[opcja]n_kzm - value of the indirect costs of materials [%]
@_[opcja]n_kps - value of the indirect costs of equipment [%]
@_[opcja]n_zr - value of profits from the labor [%]
@_[opcja]n_zm - value of profits from the materials [%]
@_[opcja]n_zs - value of profits from the equipment [%]
@_[opcja]n_zkpr - value of profits from the indirect costs of labor [%]
@_[opcja]n_zkzm - value of profits from the indirect costs of materials [%]
@_[opcja]n_zkps - value of profits from the indirect costs of equipment [%]
[option] can take values:
calc_ - values refer to the calculation
element_ - values refer to the calculation elements
@_ko_catalogs - KNR list used in calculation
@_ko_element_table_no - element number
@_ko_element_table_description - elementu name
@_ko_calc_no - calculation number
@_ko_calc_no_all - absolute calculation number
@_ko_calc_n_jobrate - calculation job rate
@_ko_calc_kind - calculation type
@_ko_element_no - element number (numbering starts from the beginning of each calculation)
@_ko_element_no_all - absolute element number (numbered from the beginning of a calculation)
@_ko_element_description - element name
@_ko_element_quantity - multiplicity of the element
@_ko_position_description - name of the calculation position
@_ko_position_catalog_name - KNR name
@_ko_position_catalog - KNR name and number
@_ko_position_specification_link - Refer to the chapter in the technical specifications, which are described in works included in the item
@_ko_position_quantity - The number of calculation units of an item
@_ko_position_unit - position unit as number (e.g. 20)
@_ko_position_unit3 - position unit as three digit number with leading zeros (e.g. 020)
@_ko_position_unit_txt - position unit expressed as text (e.g. pc)
@_ko_position_par1 - additional parameter of calculation position
@_ko_position_w_netto_1 - the net unit value of position
@_ko_position_no - position number (numbering starts from the beginning of each element)
@_ko_position_no_all - absolute position number (numbered from the beginning of a calculation)
RMS specification:
@_rms_material_no_[opcja] - sequence number of component
@_rms_material_number_[opcja] - component index
@_rms_material_description_[opcja] - name
@_rms_material_unit_[opcja] - unit
@_rms_material_quantity_[opcja] - quantity
@_rms_material_netto_[opcja] - net price (without mark-ups)
@_rms_material_w_netto_[opcja] - net worth (without mark-ups)
[option] can take values:
r - for labor specification,
m - for material specification,
s - for equipment specification,
FAQ
1. Is it possible to determine the diameter of the manhole?
Yes, you can specify the diameter in the Comment column in the Data table. It should precede the "@" and the state,
expressed in meters, for example: "Manhole @1.2 m".
2. Is there a possibility to add descriptions of nodes?
Yes, descriptions of points (nodes) can be placed in the Comment column in the Data table.
3. Is there a possibility of operating slopes between the nodes?
Yes, you should on the Data tab select Gradient as Value typing manulaly.
29
4. Is there an option generated drawing of profiles with frames?
Yes, it should be in the window Print > Margins select Print drawing borders as > frame. The current version
also allows for printing of crosses in the corners of the drawing, which may be useful for gluing the individual pieces of the
profile.
30