1
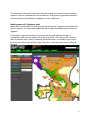
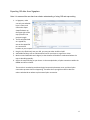
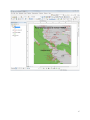
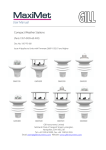
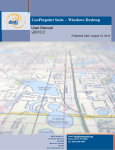
SIGAPTARU – Sistem Jaringan Penataan Ruang Spatial Plan Monitoring System www.sigaptaru.or.id Encouraging community participation in spatial planning for sustainable development in Indonesia 1 Contents Part 1 - Introduction ................................................................................................................. 3 Geospatial information on Sigaptaru...................................................................................... 5 Collecting data in the field....................................................................................................... 6 Part 2 - Using Open Data Kit ................................................................................................... 7 Using ODK Aggregate and preparing data ............................................................................11 Uploading to Sigaptaru ..........................................................................................................18 Downloading and uploading pictures to Sigaptaru: ................................................................20 Part 3 - Background on collaborative mapping in Indonesia ...............................................25 Making Sigaptaru a success .....................................................................................................26 Part 4 - Using Sigaptaru .........................................................................................................28 4.1. Registration .......................................................................................................................28 4.2. Front Page ......................................................................................................................30 4.3. Map Search.....................................................................................................................31 4.4. Making a New Project .....................................................................................................34 4.5. Project Page and Variations ................................................................................................35 4.6. Discussions .....................................................................................................................38 4.7. Advanced Search ............................................................................................................40 Part 5 - Using GIS data in Sigaptaru ......................................................................................41 5.1. Importing Shapefiles ......................................................................................................41 Part 6 - Reviewing projects in Sigaptaru ...............................................................................43 6.1. Managing Reviewer Profiles...........................................................................................43 6.2. Reviewing Projects ........................................................................................................43 Part 7 - Collecting data that helps to tell a story ..................................................................44 Collecting data that helps increase the effectiveness of spatial planning ....................................44 Making maps with Sigaptaru data ..........................................................................................45 Exporting GIS data from Sigaptaru ........................................................................................46 Adding data from local knowledge ........................................................................................48 Conclusion and discussion....................................................................................................52 2 Figure 1 Sigaptaru began as a way to integrate the RIMBA corridor into spatial planning in three priority districts in Sumatra,l it is now being expanded to Heart of Borneo and Meruake, Papua Part 1 - Introduction The economy of Indonesia is currently transitioning into prosperous future based on the abundant natural resources on its lands and in its seas. The potential for economic growth for individuals, families, districts, provinces, and the nation is unbound. This unbridled potential brings the need for natural capital to be saved and equitable land rights to be exercised more broadly, which can be assisted with a more complete map of Indonesia’s communities. Traditional communities are at times underrepresented in the current economic paradigm, and will need to find creative ways to demonstrate their way of life so that it is not defined by economic interests that come from outside of the community, or even from a multinational corporation. 3 Collaborative mapping is a an action taken by a loose-knit group of citizens who create a map of their community’s infrastructure and natural resources to benefit spatial awareness by the whole community. Daily activities, like transportation, commerce, disaster relief, natural resource management, spatial planning and permitting can benefit from a shared vision of the community’s spatial configuration. It also serves to highlight local resources and assets that should be realized in the official spatial plan. Sigaptaru (Spatial Plan Monitoring Figure 2 Sigaptaru - Spatial Plan Monitoring System System) is an online geospatial platform (Fig 1), built to serve as a communication forum open for all parties to encourage sustainable land use in Indonesia. One ongoing mission of Sigaptaru is to engage the Sustainable Regional and Rural Development Forum (SREDD-FI) to generate knowledge of the spatial characteristics of their communities, districts, and province. Sigaptaru serves the SREDD-FI user community with discussion forums, news and information dissemination, and enables collaborative mapping of agricultural land use, as well as the monitoring of district level spatial planning. The district level spatial plan (Rencana Tata Ruang Wilayah Kabupaten – RTRW) is completed every five to 10 years and is drawn at the 1:50,000 scale. Site-level data collected by the Sigaptaru community will make the district level spatial planning more effective. This document will provide a background on why Sigaptaru is a critical component to spatial planning in Indonesia, and how to use the various functions of the website. Including site operation, as well as data collection, and developing actionable maps based on data derived from the site. 4 Geospatial information on Sigaptaru Sigaptaru allows the user to visualize several types of geospatial information. The base layers include: - administrative boundaries - critical species habitat ranges, - EU Renewable Energy Directive areas - WWF-Indonesia Vision for Spatial Planning, - district level spatial plans in Sumatra, Kalimantan, and Papua. The base layers are not editable and build the spatial foundation for the rest of the website. Thee maps demonstrate that the Indonesian landscape is layered with complexity, and that there are always competing interests for the dominant activity of a landscape. The editable layers on Sigaptaru are those which offer stakeholders the possibility to contribute to spatial planning and give input to land use decisions . These are: 1. Palm Oil Concessions – Palm Oil Concessions are granted by the national BAPPEDA office. The boundaries of the original proposed locations are often different from the actual location. These should be identified so that the appropriate land use may occur, as encroachment on community land or conservation land has been attributed to large multi-national companies. Small holder plantations can also be recorded with this feature. 2. Palm Oil Mills – Mills are an important microeconomic link to the profitability of oil palm plantations in the vicinity. Having a greater understanding of the locations of these mills will help research better understand the economics, likelihood, and location of further expansion. 3. Ports – Ports are part of the supply chain of crude oil palm. Understanding which ports are used to ship oil palm to international markets can help researchers understand the macroeconomics of the oil palm market. 4. Roads – Roads are often built by oil palm and logging companies who need better access to their land holdings. Monitoring the development of new roads will demonstrate the logistics of current and expanding operations. 5. Logging – Logging is always a precursor to oil palm expansion on previously forested land and so monitoring new logging locations will help predict where new expansion will occur. 6. Mining – Mining is an activity with the potential to create many environmental problems, such as a degradation in clean water and air. Monitoring new mining 5 sites will help the government enforce mining concessions and understand the distribution of mining operations better. 7. Protected Areas – Protected areas are the primary strategy for conservation. The locations of protected areas are important so that their locations can be compared with the other editable layers, exclude them from other land uses like plantations and see where unofficial deforestation within their boundaries is occurring. 8. Ground Truth – there are a variety of other land use observations that may be made, and so ground truth is a “catch all” layer that can be used to record activities that may not fit into the other editable layer categories. Community resources such as non-timber forest products, traditional hunting lands, sources of water for communities, and other resources originating from the natural environment can be mapped here. Land cover classification performed with satellite imagery and needs accuracy assessment points to validate the final classification may also benefit from the ground truth data. Collecting data in the field There are a variety of ways to collect data in the field and then upload to Sigaptaru. The purpose of Sigaptaru is to create a community of interested participants in the spatial plan and to generate awareness of the prescribed land use activities in the user’s local area. There are three ways currently to add data to Sigaptaru. 1. The first is to collect data with a mobile device. Open data kit (next section) provides easy to use set of tools to collect data and photographs with a geographic coordinates included. 2. Field papers (Part 7) is another way to collect data in the field. An atlas of maps are printed out prior to data collection with georeferenced graticules. Field papers also works well for adding data from local knowledge. The printed page may be brought to a local gathering, and traditional land uses may be mapped by hand, then the paper may be brought back to the computer desktop to be entered into Sigaptaru. 3. The third way to add data to Sigaptaru is to have local knowledge (Part 8) go directly in to the system. If a user knows the details of a land use activity, either from personal experience, or from another map, the data may be manually entered into the system. 6 Part 2 - Using Open Data Kit Open data kit (ODK) allows for data collection with an android mobile phone or tablet even without a connection to a cellular service provider. There is a little bit of a learning curve, but once you understand how it functions, it is a very easy way to gather data. For an introduction, further documentation, tutorials, and more, check out http://opendatakit.org/ ODK is comprised of three major elements, the mobile device, the form which organizes the data, and the online table that aggregates all the data. Once the data is aggragated it can be exported as a Comma Separated Values (CSV) table, and then converted to an ESRI Shapefile which can be used to upload to Sigaptaru. In the next few sections, we’ll run through getting set up, provide an example for how to gather data in the field and then upload it to Sigaptaru. Part 1 – Using ODK Collect with your mobile device Note: Mobile service is not needed for ODK, however a WiFi internet connection is needed to get started with installing ODK and getting it set up for use in the field. Once you are in the field you may collect data without service. Then, when you return to a place with a WiFi connection, the data can be uploaded to the online database which helps aggregate everyone’s data. 1. On your android smartphone or tablet - connect to a WiFi internet connection - , search for ‘ODK collect’, download and install ODK Collect from the Play Store. The download is free, but you need to create or use your existing google account to upload it. 2. Open your new application -> ODK Collect 7 3. Click on the three small squares on the upper righthand corner and go to General Settings 4. Press on the “URL” and enter “sigaptarudata.appspot.com”, this sets ODK to Sigaptaru’s online database. 5. Go to the main menu, select “Get Blank Form” and select all of the optional blank forms, and press “Get Selected”. Now you are ready to go the field! You will not need an internet connection until you are finished collecting data. 6. Go back to main menu and select “Fill Blank Form” then select “Ground Truth” 7. Get your smartphone or tablet connected to GPS. You don´t need an internet connection for it, but it sometimes takes a while to find a GPS signal. 8. Work your way through the screens, filling out key information, starting with recording your GPS location, adding descriptive information, then taking a photograph. 8 1. 2. 3. 4. 5. 6. 9. You will continue to collect data this way throughout your data collection session. Each time saving your form with a different or sequential name (e.g Cek Lapangan 1, Cek Lapangan 2, etc) 10.When you return to a WiFi internet connection, you may upload your data to ODK Aggregate, which is a place where the data is aggragated so that you may download it and process it in a GIS. To do this, go to the main menu on ODK and select “Send Finalized Form” Next, select all of the data and select “Send Selected” This sends all the data on your mobile device to ODK Aggregate where we’ll continue to process our data. 11. Before you go out and collect data again, you may consider deleting the data you have on your device. To do this, from the main menu, select “Delete Saved Form” 9 Make sure you are in the “Saved Forms” section, and then toggle all of the data and press “Delete Selected” 12. In case of an error message: Sometimes ODK Aggregate becomes overloaded with new data. In these cases an error message may display. If you review the previous steps, and ensure you are connected to sigaptarudata.appspot.com and are still unable to upload data, please email [email protected], and [email protected] 10 Using ODK Aggregate and preparing data ODK Aggregate is based on your desktop computer and is a convenient way to push forms to your mobile device, and sending them back from your mobile device to the cloud. It is deployed as a customized online application. In our case, it was set up to work for Sigaptaru. On you desktop computer go to https://sigaptarudata.appspot.com 1. In the upper righthand corner of the screen select “Log In” There have been some problems with signing in with Google accounts, so just select “Anonymous Access” 2. Once you are in the site, make sure you are in the Submissions tab, at Filter Submissions. The in the “Form” dropdown box, select “Cek Lapangan” 11 This provides a set of records from the data gathered with your mobile device in the previous step. 3. The next step is to export a CSV file that we’ll use to upload to a GIS. Select the “Export” button in the upper right. Make sure the “Type” is CSV file and then press “Export” again. This will open up a new page with exported files. 4. Next download the CSV file and open it up in Microsoft Excel. 5. You’ll see on the Excel spreadsheet that all the fields collected are there, along with three GPS location fields (longitude, latitude, altitude, accuracy) , the description and land use field, as well as a link to the photograph (try and copy and paste the link into a web browser to display the picture online). The field names will need to be changed to work well with your GIS software (either ArcGIS or QGIS). Delete the first field “meta:instanceID,” the last two GPSLocation fields for altitude and accuracy, as well as the 12 “Foto” field. We don’t need them right now and they may make it more difficult to upload the spatial data into Sigaptaru. 6. Now, rename first GPSLocation fields to “lat” and the second to “long” (for latitude and longitude). Then save the file to somewhere convenient on your computer. Maintain it as a CSV file. 7. Next, we review how to make the data an ESRI Shapefile used to upload to Sigaptaru in either QGIS or ArcGIS. It is assumed here that you have either QGIS or ArcGIS installed on your computer. QGIS is an open source GIS program with plenty of online documentation. The qgis.org website is the best place to start: http://www.qgis.org/id/site/index.html Please skip the instruction for the software you do not have. If you have ArcGIS, it is assumed it is already installed and ready to be used. a. In QGIS, open it up and choose the “text-delimited” add data tab 13 b. Next choose “comma” as the special character that separates values, and then leave the next window completely as it is shown in default, which automatically chooses WGS 84 as the Coordinate Reference System. Press “OK” c. Now the data will show in the Table of Contents of QGIS, next right click the layer, and choose “save as” It will be helpful to make a new folder for the GIS data, so create a new folder somewhere convenient on your computer, and name the data what ever you wish. 14 d. Set the Format as “ESRI Shapefile, and then select OK e. Now, go to your directory where you saved the data in a new folder. Right click on the folder, go to Send to, and select Compressed (zipped) folder. Once this is complete you are ready to upload to Sigaptaru! 15 In ArcGIS i. If you have ArcGIS it is very easy to create new data too. Open up a session of ArcMap, go to the File menu and select Add Data Add XY Data… ii. Navigate to the location of the CSV table, make sure to switch the x field to Lat and the y field to Long because by default it will load them backwards. iii. Then click on the Edit button below and choose the GCS_WGS_1984 coordinate system, and click OK. There will be a warning window 16 iv. that says “There will be no “Object ID field…….” Don’t worry about this and click “OK” Next, right click on the CSV layer, and go to Data Export Data… and select an empty folder to place your data (you may wish to create a new folder somewhere convenient) v. vi. Now, go to your directory where you saved the data in a new folder. Right click on the folder, go to Send to, and select Compressed (zipped) folder. Once this is complete you are ready to upload to Sigaptaru! 17 Uploading to Sigaptaru Congratulations! You are almost done with uploading data to Sigaptaru. 1. Go to www.sigaptaru.or.id, log in if you are not already, and navigate to the IMPORT tab 2. In the drop down menu for what kind of data it is, select “Ground Truth,” than in the “Choose file” button, navigate to the zipped folder you created the previous step 3. Selet the “Import Shapefile” button on the bottom of the page. 4. This will bring up the Bulk Import fields menu where we match the type of data we have with the type that Sigaptaru expects. Leave the lat and long 18 dropdowns empty, but choose Land use for the “land_use” dropdown, and choose “Description” for description. Then select the Match Data button. Make sure and leave “geo” as Geometrical Data. This matches the internal GIS files with the geographic location. Type in a name for the project, such as Ground truth for Jambi, or something short and descriptive. 19 5. The screen will return to the Bulk Import page, and say “Successfully created x Ground Truth projects. Next go the HOME tab to your profile and you should see your new projects! Congratulations you are a Sigaptaru data contributor! Downloading and uploading pictures to Sigaptaru: To download pictures, there is an easy to use online tool, called GeoODK, which automatically downloads images collected by ODK. You may then upload the pictures to Sigaptaru. 1. Go to http://jonnordling.org/mobile-data-conversion-kit 2. Download and install the Mobile Data Conversion Kit for your computer 3. Start the GeoConverter program 20 4. Go through all of the steps to process the CSV in GeoConverter a. Add the CSV file b. Highlight the CSV file in the GeoConserter window 21 c. In the second step, set the format of the data by setting the latitude and longitude, the image (photograph) field, and then select the button “Set Filelds” d. Only select, Download images. (Unfortunately, the create Shape File option creates shapefiles that are incompatible with Sigaptaru, so it is best to make Shapefiles as outlined in the previous steps in QGIS or ArcGIS.) Also, select an output directory for the photographs Then, choose “Run 22 5. Navigate to your output directory. The images will be placed into a folder there. 6. Now, you may manually add the photos to Sigaptaru, following the steps outlined in Part 4 - Using Sigaptaru. The steps in short (also shown in images below) are to access each data point you have just uploaded through your Sigaptaru Home Page, or through accessing each point on the map. On the data point page, choose “Edit”, and scroll down to ”Images,” then navigate to your image directory and upload the photo. It’s a little time consuming! But we hope to update this feature soon. 23 24 Part 3 - Background on collaborative mapping in Indonesia There are many examples of previous collaborative mapping efforts in Indonesia. Perhaps the most successful recent example is Open Street Map Indonesia 1, where recent efforts through the Indonesia Humanitarian Open Street Map project have catalyzed hundreds of new collaborators throughout Indonesia. The project understood that to be successful the map would need to complete a “Training of Trainers” program which helps generate increased interest in the collaborative mapping. This effort has undoubtedly increased the ability of first responders to mobilize to areas impacted by natural disasters. Beyond natural disasters, the imperative for collaborative mapping also extends to the protection of indigenous rights, natural resources, and environmental sustainability. The exponential increase in natural resource extraction from mining, agriculture, and industrial activities has displaced many local people throughout Indonesia. The Indonesia Community Mapping Network 2 responded in the early 1990s and established participatory Figure 3 Community mapping in Indonesia. Taken from http://press.anu.edu.au//apem/borneo/mobile_devices/ch05s03.html approaches to mapping traditional land uses in many parts of Indonesia 3,4. At this time the focus of collaborative mapping was to use nondigital means, like paper maps, and 3-dimensional paper-maiche models, to communicate spatial information. The online collaborative mapping platform offered by Sigaptaru, or Indonesia Open Street Map may miss some of the local knowledge that can be derived from a stakeholder community mapping event, where elders are able to offer their historic view of the local community. This type of collaborative mapping needs to continue, but it also needs to be recorded digitally so the geospatial information can be disseminated with more ease. 1 http://hot.openstreetmap.org/projects/indonesia-0 http://www.rightsandresources.org/documents/files/doc_4802.pdf 3 http://press.anu.edu.au//apem/borneo/mobile_devices/ch05s03.html 4 http://borneoproject.org/photo-gallery/borneo-projects-mapping 2 25 There is an opportunity now for community mapping to play a central role in the delineation of Indonesian infrastructure and natural resources, as natural resource managers, spatial planners, disaster response agencies, and countless other institutions continue to have a need for more spatial information. Community mapping can be a difficult activity to sustain as financial resources are not always available, and depending on volunteer contributions can Online and local communities must sustain themselves through frequent meetings, individuals who commit to managing group resources, and financial backing. Making Sigaptaru a success Shkabatur5 (2014) identifies six elements to effective, sustained, and results-oriented community mapping efforts. These are: (1) supporting information infrastructure, (2) need for information, (3) civil society capacity, (4) government cooperation, (5) incentives to cooperate; and (6) data quality. Supporting information infrastructure (1), is the intended function of Sigaptaru,. There are three main functions of Sigaptaru, as an information provider, a discussion forum, and a collaborative mapping platform. It was designed to support the transfer of text and geospatial information. The civil society capacity Figure 4 Enabling factors for successful community mapping (3), government (taken from Shkabatur (2014)) cooperation (4), and incentive to participate (5) are moderated within SRRED-FI. The participation of all 5 http://wbi.worldbank.org/wbi/Data/wbi/wbicms/files/drupal-acquia/wbi/mapping_final(1).pdf 26 stakeholders ensures that the resulting map and the management of spatial planning is shared and that all members of the local community benefit from the shared vision for development. The incentive for an individual to participate in Sigaptaru depends on several factors. A few examples of why an individual would participate are that there is a personal interest in mapping an area, social favor granted by peers for mapping work completed, and a belief in mapping ones area confers more land use rights are all common reasons why participation may occur. There are certainly many more reasons which may in their explanation provide a potential action to encourage participation. This might be remuneration, or payment for services, or as part of a daily workflow of an individual at governmental and non-governmental organizations, since creating a better map leads to more effective organizations. The enabling factors, need for information (2) and data quality (6), speak to the nature of geographic information and how humans instinctively use maps to communicate important information. The information that is being shown on Sigaptaru is for palm oil production, mining, and forestry, and the economic networks that encompass those activities, as well as the district level spatial plan. Finally, the degree of accuracy to which users of Sigaptaru use the website to monitor will help make a site with credible and reliable information. 27 Part 4 - Using Sigaptaru 4.1. Registration To access the Sigaptaru website, visit www.sigaptaru.or.id (Figure 1, point 1). If you don’t have an account, click “Create New Account” (Figure 1, point 2) which will bring you to the registration page. If you want to share information without logging in, you can do so by clicking “Share” and then following the directions on the sharing page anonymously (Figure 1, point 3). Figure 1. Registration Page 28 On the registration form, fill all mandatory fields marked with a red asterisk—the others are optional (Figure 2). Figure 2. Accepting the Terms and Conditions pen n---------------------------Spasidibolehkan,;13nda bao:a tidak boleh,kect.ali titi k,. tand a m nusdan garis bawah. Alamat ema i : * I AlamaterrnyanJ: benar da n aktif. Semua email dari :situs i ni akan diki ri m kealamat yan'Mlda masukka n.Alamat ini tidak akan d1tampil kan pada publi k dan hanya d iJ:u nakan :se ba:;ai komunikasiantara sia.zs nidengan anda misalny a jikaanda lupa sandidanin,:in dildrimkansandibaru, atau untuk menB"ima notifika:si IMatemaillainnya. Kata kund:• Konfirmasisandi:• Masukkan wndi dikedu;; isianyangdisedi.Jkan. Miss-al:tempatu ntuk bisnis. tempat kejadian. ata.. titik berlcumpul United States 29 4.2. Front Page When you log in after creating a new account, the website will automatically bring you to the Map menu. You can go back to the user front page by choosing the Homepage menu. On the left corner of the front page (point 1), you will see your name and your picture. You can change your profile by clicking “Edit Profile” (point 2) located under the user name (Click “User Profile” to complete the data, click “Account” to change the password, choose the language, and modify the user avatar). When you are done, click “Save” to update your profile. Figure 3. Front Page Under “Edit Profile”, there is a column with the title “Projects I’m Following” (Point 3) which consists of a list of projects that you follow. Under that column, you will find “SRRED-FI Links” (Point 4) which consists of a list of links that can help you obtain information or data which are not yet available in Sigaptaru. 30 The middle section of the page (Point 5) consists of “Recent Activities” on the site. This section filters projects and discussions, which are added or edited based on the project category you choose in your profile. You can change this anytime by editing your profile. Next to “Recent Activities”, you will find Site Alert (Point 6) which displays updates from the website administrator with regards to changes on the website and other important information. At the very top of the page, you will find a navigation menu (Point 7). You can access user profiles and read help pages, a description of Sigaptaru, latest news on Sigaptaru, and terms for using this website. To start searching for information on the maps, click the tab “Map” (Point 8). 4.3. Map Search On the Sigaptaru Map page, you can search for categories related to the land cover in Indonesia. The first version of Sigaptaru focuses on three priority districts in the RIMBA area. 31 Figure 4. Map Page a. To have a specific category displayed on the map, select it from the list of categories in the left column (Figure 4, Point 1) b. By default, only information that has been “approved” will appear on the map. If you want to see map information that has not been approved, don’t check the “Approve” box (Figure 4, Point 2b) c. To display the chosen category, click “Map Search” and the category will appear on the map (Figure 5, Point 3) d. To change your search, select another category in the left hand column (Figure 4, Point 1), then follow the same steps as in c (above). 32 Figure 5. Map Page e. To refine the search results, type in a word such as a company name in the search box at the top of the category menu (Figure 5, Point 4). Only projects with those keywords will appear on the maps. f. To enlarge the map, use the zoom bar on the left side of the map (Figure 5, Point 5). Click the “plus” sign to enlarge the map and the “minus” sign to zoom out the map. g. To move the map, click on the map and drag it in the direction you want, or use the tools at the top of the zoom bar (Figure 5, Point 6). h. Click on the “Text” tab to see the result for your search in list form. The text display allows the users to see the categories list from the search results (Figure 6, Point 1). Scroll down the list to see the projects (Figure 6, Point 2), then select “variation” (Figure 6, Point 3) to create additional information for these. For further information, click on “Discussions” (Figure 6, Point 4). 33 Figure 6. Map Page 4.4. Making a New Project There are two ways to make a new project in Sigaptaru. First, you can draw a project directly on the map. Second, you can make a new map by importing a shapefile to Sigaptaru. On the menu bar, choose “Map” and click “Draw” (Figure 4, Point 3) and follow the steps below: 1. To choose the type of project you want to add, click on the dropdown menu on the left side of the map and select a category (Figure 7, Point 1). Two boxes will appear underneath. 2. To draw your project, follow the directions in the “Data Location” box to draw a point line or polygon directly on the map (see Sigaptaru tips for more detailed information). 3. After finalizing a project or adding coordinates, complete the project details column with all the information you have (Figure 7, Point 2). Tip: D r a w i n g o n t h e map Drawing on Google Maps is easy, but requires some training. Before you start, zoom in to the area that you want to draw on. To add a point, click once on the map and a marker will appear. You can move that pointer by clicking and dragging it. To draw a line, click once to start the line, then click once more each place you wish for the line to bend. When you are finished drawing the line double click on the end point. To draw a polygon, click on a point and then click on more to create a shape. Figure 7. New Project 34 You can also add links, post images, and upload documents (Figure 7, Point 3). When you are done, click “Save” and you will automatically be brought to the new project profile page. project that has been made containing a list of relevant information such as documents, links, and figures. It also contains a review of information and assessment of data quality marked by asterisks (Figure 8, Point 1). On the right side, there is a discussion forum related to the project (Figure 8, Point 2). To add comments, type inside the “Comment” column and click “Save”. Your comment will appear on the right side. You can see all comments by clicking “See All”. “Variation” is a way to update or edit project information. The variation box shows all variations that the user has made for a project. When you click on the title of your project (Figure 6), you will see the variation profile that shows the project’s geographical location and information. You can assess the information accuracy (Point 4) and use “Previous” and “Next” buttons to see other variations. 4.5. Project Page and Variations The project profile page is a review of project-related information (Figure 8). Below is a map display of a 35 If you want to update or edit project information, you can make a variation by clicking on “Add Variation” and a new window will appear on the map displaying the project location and the information to be edited (Figure 9, Point 3). Figure 8. Project Variations .....,.._ " '-- tt<< t0o4 1111("• GPS W.itW...-y2012 tly("-'tl........,, .................. 36 Figure 9. Project Variations If you want to change the data location or enlarge the project location, then “Add location data” (Figure 10, Point 1). You will be instructed to draw a line, point, or polygon. When you finish drawing, adding, or editing the project details, click on “Save” and then you will then be automatically brought back to the project page where you can find your project in the variations box. 37 Figure 10. Project Variations Note: to add links, documents, or figures, add a title and URL in the link section or browse documents and images related to this project. 4.6. Discussions Discussions refer to ongoing conversations among users with regards to the topics in Sigaptaru. This section can be accessed by clicking on “Discussions” (Figure 11). To access a discussion, scroll down the list of discussions and click on one of the links. Every discussion has a different topic which you can click on to enter. If you want to post your own topic, click on “Post New Topic”, write a subject line, choose a discussion group, and type your comment in the column below it. When you are done, click “Save”. To post a comment, write in the comment column and click on “Save” when you are done. If the discussion uses a foreign language, scroll to the bottom of the page and you will find the Google Translate tool. 38 Figure 11. Discussion Page 39 4.7. Advanced Search If you want to carry out a more specific search using set criteria, e.g. company name or type of road, click on “Advanced Search” (Figure 12, Point 1). First, choose the category. Select the category from the list (Figure 12, Point 2) and the name of the chosen category will appear. Click on the category name (Figure 12, Point 3) to open the search column. Select or enter the choice you want to find. Complete the fields you want to use to filter the search results. Add more keywords in the lower part (e.g. for mining category: copper, Figure 12, Point 4), then click “Search”. Your search results will appear below. Figure 5 Advanced search page 40 Part 5 - Using GIS data in Sigaptaru 5.1. Importing Shapefiles This section describes how to import geographical data into the site. This application is specifically provided for users who have GIS shapefile data or shape data to share. The folder with the shapefile inside should be in “.zip” form. To import data: 1. Click “Import” 2. Click on the dropdown menu (with the title “Project”). Choose the category that matches your data. 3. Prepare the shapefile. The first step is to ensure that its geographical coordinate system is WGS 1984. Next, put the shapefile in one folder, then extract the folder in .zip format. 4. Click “Browse”, choose the file, then click “Open” 5. Click on “Import Shapefile” Figure 13. Importing Data 41 6. When importing is complete, match the table with the project by clicking on the arrow from the dropdown menu for the appropriate column (Figure 14, Point 2). 7. If you do not find the column with the project name in the attribute table, you can add a name for the project into the shapefile. The name you enter will be followed by the number of each project on the shapefile. If you do not enter a name, the project will be labeled as No Name (category) followed by a number (Figure 14, Point 2). 8. Click on “Match Data”. 9. If you find an error field type, it means that the system cannot match the type of the field. Please select the field and leave it blank. Figure 14. Importing Data 42 Part 6 - Reviewing projects in Sigaptaru 6.1. Managing Reviewer Profiles The reviewer plays an important role in this website. When a user is identified as a reviewer, a list will be displayed on the user’s profile indicating preferences or skills. Select your skill category by pressing the control and choosing a category from the list. This will filter all projects which have not been approved, and which are shown on the front page for you to review. 6.2. Reviewing Projects When a regular user changes project details or adds a new project, this should be approved by the reviewer who is responsible for the related category. On the reviewer’s frontpage, there is a block on the left side of the page showing “Projects to Review”. All projects that have not been approved will appear in this box as soon as they are added to the site. To accept variations or changes: 1. 2. 3. 4. Click on “Project Title”. This will bring you to the project approval page. On the left side, there is an option to approve the changes. Click on the “Approve” box to publish the changes or to modify them. If this is a project variation, approve it and make a master version, or public version that you can see on the map, text list, or project profile page. First, approve it by clicking “Approve”, then click on “Set as Master”. Figure 15. Data Review 43 Part 7 - Collecting data that helps to tell a story The objective of Sigaptaru is to create a community for spatial planning. The data types currently proposed on Sigaptaru are intended to aid spatial planning to be effective and account for the variety of land use decisions that create a vibrant economy, ecologically sustainable landscapes, and are not in conflict with traditional land use and rights of local people. Ecologically sustainable landscapes contain elements such as habitat corridors for roaming species such as tiger and elephants, and large forest blocks for orangutans. Furthermore, forest cover around waterways reduce sediment, fertilizer, and pesticide run-off associated with agricultural activities. A vibrant economy contains a variety of jobs in the public Figure 6 Sigaptaru data types and private sector, and includes palm oil plantations and mills, mining, and other activities dependent upon natural resources. These should not occur however in conflict with an ecologicially sustainable landscape or with traditional land uses. Since spatial planning is intended to balance this variety of needs, Sigaptaru can be used to visualize and collect spatial data that helps tell the story about how actual land use on the ground is being administered. Data can tell the story about how oil palm concession boundaries are not being followed, or how new roads are being built which will lead to further deforestation in areas not designated by the spatial plan for agriculture or production forests. Some areas might be designated as “forest” in the spatial plan but are already used for agriculture, areas designated as “plantation” might be used for subsistence agriculture, others might have competing uses like mining and plantation on the same area. Information like that help to create a better spatial plan and make informed decisions. Validated land uses from communities can help to reduce land conflicts and support free, prior and informed consent. Collecting data that helps increase the effectiveness of spatial planning The spatial plan in Indonesia operates at three levels: central, provincial, and district. The concept is for all three levels of planning to complement each other, and for the lower levels of the hierarchy to be approved by the upper levels. Also important to consider are a series of presidential decrees, mandating that 35% of Sumatra be composed of forest cover, and that 40% of Kalimantan be forest cover. To achieve this mandate, central, provincial and district level spatial planning will need to ensure the preservation of current forest cover. 44 The development of an active community and the increased use of spatial tools will hopefully support a culture of sustainable land use in Indonesia. Everyone from government officials to university students can participate in Sigaptaru to make a difference. Making maps with Sigaptaru data Maps help tell stories about our world and generate discussions. Sigaptaru was developed for this very purpose. An export feature allows the user to obtain the editable layers currently on Sigaptaru. For example, it might be interesting to show how some oil palm plantations might be overlapping in areas that are supposed to be protected forest. In the figure below, there is a palm oil plantation that is clearly overlapping a protected forest. It is possible to just cut and paste the data, but its also possible to export the palm oil concession data, and to make your own map. 45 Exporting GIS data from Sigaptaru Note: It is assumed the user here has a basic understanding of using GIS and map making 1. In Sigaptaru, make sure only one editable layer is chose, and choose the export shapefile button on the upper right of the map (circled in the previous image). 2. The file will download as a zipped file, extract the zipped file to a convenient location on your computer. 3. Drag the .shp file directly into your GIS, you may use either ArcGIS or QGIS. 4. Add additional data, such as administrative lines for provinces or regencies or cities. 5. Make sure and add labels and a legend, so that viewers will be able to understand where the map is describing spatially. 6. Stylize the map according to your theme. In the example below, oil palm concessions within the RIMBA corridor are shown. The corridor is intended to provide ecological connectivity between areas, and the oil palm concessions prevent that from happening. Therefore the map might be useful to decision makers who decide on where to place new oil palm concession. 46 47 Adding data from local knowledge Local knowledge can be very difficult to capture, but through the Ground Truth data layer, users can add information about a landscape that only local community people know about. Traditional land uses can be recognized in spatial planning if the information is available to decision makers. It is possible to use a website, called “Field Papers” to complement data collection for Sigaptaru. Field papers constructs a printable map with UTM graticules that allow notes to be taken in the field, and then brought back to a computer and uploaded into Sigaptaru. To make a printable map, follow these steps: 1. Go to fieldpaper.org 2. Choose “Make yourself an atlas” 3. When it ask where in the world you would like your atlas, choose exactly that. In this example, we’ll choose “Sumatera, Indonesia” 48 4. Field papers will open up these two boxes in Sumatra. Using the places on the map circled in the image above, remove one of the boxes, but clicking on the minus sign, and resize and reposition the box at the place where the provinces of West Sumatra, Riau, and Jambi meet 5. When zoomed all the way in, click on the “Next” button 49 6. On the Name/Description page, add some information of your atlas, then click “Next.” 7. Next choose the option to add a UTM grid overlay to the map, then choose if you would like notes to be on the same page as the map. I choose to keep notes separate. 50 8. Field papers prepares the atlas, which can now be downloaded as a “pdf,” choose “Download PDF” 9. The resulting pdf has UTM gridlines on it. These gridlines can be used to help georeference the data in either a GIS, or by entering the data directly into Sigaptaru. Directions on how to draw data directly into Sigaptaru can be found in Part 4 – Using Sigaptaru. 51 Conclusion and discussion Sigaptaru was built to build a community around spatial planning in Indonesia. The maps, discussion boards, and news items are all intended to generate excitement and shared responsibility towards sustainable land use decisions in Indonesia. The tools provided in this document are a first step in establishing a community around spatial planning. In the years to come, we hope to continue to improve the functionality and usability of Sigaptaru. Thank you for all the time you’ve spent learning how to use Sigaptaru and the tools developed to complement it like ODK. We hope you are successful! 52