1
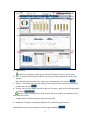
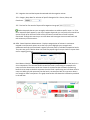
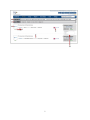
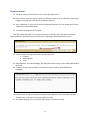
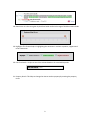
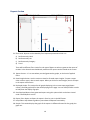
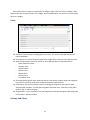
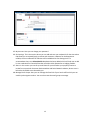
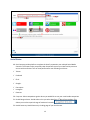
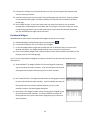
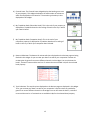
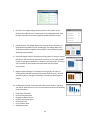
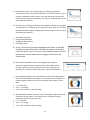
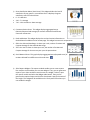
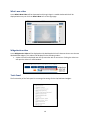
1 Get to know the icons icons Use this for instant information on the section. This icon is available on all sections of the dashboard. Click the help section for FAQs, Searchable headers and a self-explanatory manual around the solution. If you have further questions our support team will be more than happy to assist you. Use this to print the report for filing, operational meeting and record keeping purposes. Use this for any technical questions or for clarification or minor product related issues. Use this to access information, review the agenda and schedule training sessions to understand IQA better Use this button to download the PDF of Quick Reference Guide. Look for this sign throughout the Quick Reference Guide for optimum utilization of the tool Good to know facts about the feature Lets checkout the dashboard. 1. IQA Logo 2. Your Preferred Hotel Group Brand’s logo 3. Username 4. Your Hotel’s name 2 5. Logout Option Always use this option to safely log out instead of clicking the X mark on your browser 6. Help - is comprised of Self Help user Manual (each section of IQA is explained in detail), FAQ’s, Glossary, Math and Downloads and other links - where you can download the user manual. 7. Support - This section assists you with filling out and sending a ticket in the event of a technical problem with the tool. 8. Training - Here you can register yourself for IQA User Trainings, it gives you the training schedule and agenda. There are regular training sessions held, so please feel free to register any members of your team from time to time. 8A QRG- Button for downloading the Quick reference Guide. 9. Dashboard - This page is comprised of different, self - explanatory graphs that are populated from the scores extracted from reviews & guest feedback 3 10. Review Page- is where you will find the actual reviews (for you and your competitors) that are scored and used to populate the dashboard. 11. Settings and Alerts Page - Clicking here will route you to a page where you can save your credentials that allow you to respond to reviews and set up email alerts and change your password for IQA. 12. Date Filter - Is a filter criterion to populate the dashboard for the selected date range. 13. Guest Satisfaction Meter - Shows you the cumulative Guest Satisfaction Score for the selected date range (SDR). Monitor this for a day to day snapshot and overtime to measure improvement This may change with every new commentary. Frequent monitoring will be most helpful. 14. Consumer Review Score Graph - This graph displays your guest satisfaction viz-a-viz your competitors according to consumer review websites like Trip Advisor, Expedia, and Travel post for the selected date range. 14A-Comp view is a display of you and your competitor’s performance according to the Consumer Review sites for the selected date range (from the Date filter) (12). 14B-Category dropdown gives you option of selecting categories like rooms, cleanliness, services, and view you and your competitor’s scores according to the consumer review sites 14C-Trend view is a week on week display of you and your competitors’ performance according to the consumer review sites for the weeks that are falling in the selected date range. Click or select Numeric Score, Key word Score and Average Score icons for better focus 4 Use the trend view option to investigate the data, week on week and relate it to staffing. 15. Social Network Score Graph-This graph displays your guest satisfaction viz-a-viz your competitors according to social network sites like Facebook and Twitter. 15A - Comp view is a display of you and your competitor’s performance according to the social network sites for the selected date range from the Date filter (12). 15B- Trend view is a week on week display of you and your competitor’s performance according to social network sites for the weeks that are falling in the selected date range. 15C - Category dropdown gives you the option of selecting categories like rooms, cleanliness or service and you can view you and your competitors’ scores according to the Social Network sites. 16. Rank and Review Box - Shows your property's rank against your competitors and the number of reviews you received viz a viz your competitors for the selected date range as well as on a year to date basis. SDR - Selected date range YTD - Year to Date (Calendar View) No of reviews comparison if your SDR = YTD, then both rows should have the same data. 17. Keyword Analysis -Analyzes positive & negative comments highlighting specific stay aspects i.e., Rooms, services, F&B, value, cleanliness etc. Presents competitive view as well as trend view. The graph helps you find out the Vital Few categories that are impacting your guest satisfaction negatively as well as positively. 17A- Positive view and keywords associated with the positive reviews. ln a case when no reviews are posted or no comments made, the key word list will not be populated. 17B - Text box for free search of keywords for Positive view graph 5 17C - Negative view and the keywords associated with the negative reviews 17D - Category drop down for selection of specific Categories like - Rooms, Value, and Cleanliness. 17E - Text box for free search of keyword for Negative view graph. Gather Keywords that are your strengths and weakness to address specific issues. i.e. if the term ‘expensive food’ appears in your list of negative keywords, you can use the free search box option to look up for the word ‘Food’ to filter and see all reviews where ‘Food’ has been mentioned. Through this exercise you can drill down and investigate issues around Food’ and take necessary corrective action. 18. GEM - Guest Experience Measurement - Displays categorization of reviews in sentiments mapped on various touch points across the stay cycle to highlight your strengths and weaknesses and help you benchmark it against your own peers or individual competition hotels. The entire stay cycle is broken down into small stay aspects right from pre check in to post check out for mapping precision. Social Network Health – This Widget provides an insight into the performance of the hotel viz a viz its competitors. The tab view shows how well the hotel is performing as compared to its comp set on the above seven social sites. Green tile represents that the hotel is performing better than its comp set. Red tile represents that the hotel is performing at a level lower than its comp set. While grey tile represents that the hotel is at same level with its comp set or data is not enough to make a comparison. The graph view further drills down the information provided in the tab view. 6 7 Reviews Section 19. Key Stats - Shows you key statistics of reviews and response ratio. 20. Filter Criteria - Gives you various options for filtering reviews by scores, channels, property and category. Also gives you a text box for free keyword search. 21. Source of Review - It is the icon for the site review was posted on. You can change the view so it shows other sources like Expedia. 22. The actual review written by the guest. 22A. The response window - To let you put responses to reviews. This opens upon clicking the ‘Reply’ button on comments from all sources where responding is allowed by the source site. 23. Take an action -This option has three items to select from: Forward Report Review Share 24. Job Assignment - As a Hotel Manager, job assignment help to assign a job to hotel staff based on the Guest 25. Translate: There is also an option to translate the Guest reviews in about 40 different languages. 26. Channel Score: It helps you analyze hotel performance based on score received on channels. Channel Score is the score of a hotel on a given channels 27. Trip Advisor Ranking: This is the rank of your Hotel on Trip Advisor Chanel. 8 28. Klout Score: It is the score given by the Klout Social media in the range of 0-100 on twitter feeds. 29. Highlights: This feature helps in highlighting the sentences in reviews as positive, negative and neutral sentences. 30. Free Text Search: It helps to search the reviews based on the searched keywords. 31. Property Search: This helps to change the view to another property by entering the property name. 9 Reports Section 31. Filter Panel: Reports can be viewed by four important parameters which are :a) b) c) d) Performance by Hotel Performance By site Performance by Category Trend There will be different filter criteria for each type of Report to select to generate the report of reviews. In the above shown dashboard, maximum of 6 reports can be viewed on the screen. 32. Report Canvas: - It’s an area where you view/generate the graphs, on the basis of applied filters. 33. Saved Insight Section: Use this section to view list of saved report insights. To open a report either select or type in bar to search report. When you click on a saved insight, then it will open in the report canvas frame. 34. Displayed Graphs: This section lists all graphs displaying in the current open page (Report canvas). Checked graphs will be the one displaying on the page. You can check/uncheck in order to hide/show the display of graphs 35. Save Displayed Report: Save generated reports using this option which can be later viewed under ‘Saved Reports’ section. 36. Export /Print: Option to Export the report in Excel or print in the PDF format. 37. Help Videos: Help Videos to guide any user about the Reports functionality. 38. Graphs: This section displays the graph of the reports in different formats like line graph, bar graph etc. 10 38a. You also have an option to save Reports as widget insights. Once you click on “widget” radio button and create a report and save it as a widget. On the dashboard you can see the very same saved report as a widget. Goals 39. Set Goals: Use this section to assign goals to the users. This section is divided into parts as mentioned below:40. Set Assignee: It is used to assign the goals to the people across various areas of improvement. 41. Areas of Improvement: Goals can be set for seven different areas of improvements as: - Guest Satisfaction Score - Category Score - Response Ratio - Review Count - Review Share - Channel Score - Trip-Advisor Rank 42. Set weekly goal progress report email day and time: Set weekly progress reports for assignees help them to track their goals and measure them against expected result. 43. Goals Status: This section provides view for tracking goals assigned to you and also, goals assigned other members. To track goals assigned to particular users, select them using radio options: ‘Self’ or ‘Select Assignee’. 44. Assigned Jobs: It is the summary of the jobs assigned to hotel staff through the Job Assignment functionality in Reviews module. Settings and Alerts 11 45. My Account: Here you can change your password 46. Site Settings: This is the section where you can add and save your credentials for the sites where IQA allows you to respond/reply to reviews and comments. However for the Restaurants module, the site credentials for F&B sites will be added within Site Settings itself. To accommodate that a new Select Module dropdown has been added, which will help user to add his site credentials for Channels/Sites that are either within Restaurant or Lodging module. 47. Alerts: In this section you can set up email alerts for yourself when your property receives a review from a particular Consumer Review website and Social Network website, whose score is below the threshold score selected by you 48. Manage Email Groups: Here you can manage the Email ids of your hotel staff to which you can send the job assignment alerts. You can also create the email groups to manage. 12 Social Status 49. Social status provides platform to explore the Hotel’s reputation over multiple Social Media channels. This feature helps you quickly view the performance of your Hotel and its presence across social media sites. You can view performance over following social sites: Twitter Facebook Flickr Google+ Foursquare Instagram Pinterest 50. Comp-set: Select competitors against whom you would like to see your social media comparison 51. Period Range selector: Period selector lets you select date from 1st May till current date. This allows you to select a period range of maximum 3 months. 52. Health Summary: Health Summary is landing page of your Social status 13 53. Colored tiles: Indicate your overall performance on each social site against the selected comp set over chosen period time. 54. Hotel Post: Directly post on your Hotel’s Social profile page using “Hotel Post” feature available on the Health Summary page. This feature enables you to post on your Facebook and Twitter profile page. 55. Social media site tabs: To view your Hotel status over each social channel, you can browse through tabs provided adjacent to the Health tab. On clicking any social tab, it takes you to the corresponding page where you can view performance of your Hotel and selected competitors over the selected period range and social channel. Dashboard Widgets IQa dashboard has been made customizable with widgets so that user can change:a) Dashboard widgets settings based upon their requirements. b) Can specify the position, size and visibility of the widgets. c) In case the widget leads to pages which enable the user to drill down further to access more detailed information, the widgets would allow the user to utilize them like buttons. d) Have a list of default widgets with a default position and size which could be controlled from the property sheet or from Settings page. Here is the list of IQa dashboard widgets on Property view which can be customized as per the user requirements:a) Achieved Goals: This widget provides view for tracking goals assigned by you to yourself and to other members. It will only showcase the status of those goals that have been achieved by you or by other members. b) Non -Achieved Goals: This widget provides view for tracking goals assigned by you to yourself and to other members. It will only display the status of those goals that have not been achieved either by you or by other members to whom you had assigned these goals. c) Open Goals: This widget provides view for tracking goals assigned by you to yourself and to other members. It will only showcase the status of those goals that are in open status (either assigned by you to yourself or other members) 14 d) Channel Score: The Channel Score widget displays the booking.com score of your property. This widget also depicts the total number of reviews on which the displayed score is based on. The traveler type breakup is also displayed on this widget. e) My TripAdvisor Rank (Subscriber Hotel): This is the rank of your property as displayed on TripAdvisor based on the ranking of hotels in the city in which your Hotel is based. f) My TripAdvisor Rank (Competitor Hotel): This is the rank of your competitor property as displayed on TripAdvisor based on the ranking of hotels in the city in which your competitor Hotel is based. g) Bottom 10 Reviews: The bottom 10 reviews which are displayed on the Reviews page are being fetched in this widget. So you can view your Hotel’s as well as your competitor’s bottom 10 reviews given by guests from across different channels in this widget. You can also view the hotel’s, reviewer’s name and the total no. of reviews that are available in IQa for the selected hotel property. h) Top 10 Reviews: The top 10 reviews displayed on the Reviews page are displayed in this widget. Thus, you can view your Hotel’s as well as your competitor’s top 10 reviews as provided by guests from across different channels in this widget. You can also view the hotel’s, reviewer’s name and the total no. of reviews that are available in IQa for the selected hotel property. 15 i) Key Stats: This widget displays the key statistics information on the dashboard in addition to the reviews page. This widget depicts the Total Number of Reviews and Positive, Negative, &Neutral Review counts j) Response Ratio: This widget displays the response ratio information on the dashboard in addition to the reviews page. This widget depicts the Total Response Ratio, Negative Response Ratio, Positive Response Ratio, & Neutral Response Ratio. k) Positive Keyword Analysis: The purpose of this graph is to help you visually identify the 20% operational areas that if you focus on, will yield you 80% impact on your guest satisfaction. It shows you Positive impact. This helps you spot what are the functions well performed and what needs improvement. l) Negative Keyword Analysis: The purpose of this graph is to help you visually identify the 20% operational areas that if you focus on, will yield you 80% impact on your guest satisfaction. It shows you both Negative impact. m) Performance by Hotel : Performance by Hotel section helps in analyzing your hotels' performance viz-a-viz your competitor hotels by the following seven parameters: By Number of Reviews By Positive Review Share By Negative Review Share By Guest Satisfaction Score By Channel Score By Trip Advisor Rank By Response Ratio 16 n) Performance by Site: This section helps you analyze site (channels) performance in terms of “Number of Reviews” and “Channel Score” for you and your competitor hotels. Thereby, it lets you find out the most prolific channels for you and your competitors. This helps in narrowing down to the most important channels. o) Performance by Category: Performance by Category analyzes your strengths and weaknesses in different guest experience touch points listed under Standard and GEH Category. Category performance analysis can be done by the following parameters: By Number of Reviews By Positive Review Share By Negative Review Share By Category Score p) Trend: Trend helps you perform detailed trend analysis on Monthly and Quarterly basis. More than 100 different analytics can be draw under this section. You can also run trend comparison report of hotel performance, channel performance, category performance and traveler type. q) Guest Experience Measurement : This Widget shows the guest experience represented as sentiments across various touch points through a typical stay (from booking to check-out). It will help you identify your successes as well as the areas in need of improvement. r) Guest Satisfaction Meter (Social and Consumer sites): This widget exhibits the level of satisfaction of your guests in a cumulative form. It displays the combined guest satisfaction score of social media and consumer review sites. 0 – 3 is deficient 3.10 – 7 is Average 7.10 – 10 is excellent or above average s) Guest Satisfaction Meter (Consumer sites): This widget exhibits the level of satisfaction of your guests in a cumulative form. It displays the guest satisfaction score from consumer sites. 0 – 3 is deficient 3.10 – 7 is Average 7.10 – 10 is excellent or above average 17 t) Guest Satisfaction Meter (Social sites): This widget exhibits the level of satisfaction of your guests in a cumulative form. It displays the guest satisfaction score from Social Sites. 0 – 3 is deficient 3.10 – 7 is Average 7.10 – 10 is excellent or above average u) Consumer Review Score: This widget displays aggregated scores (Numeric/Keyword and Average) for reviews collected from different consumer review sites. v) Rank and Review: This widget displays the rank and review information on the dashboard in addition to the reviews page. This widget has two main components:1. SDR is the Selected Date Range: it shows your rank, number of reviews and Compset Average for the selected date range 2. YTD is the Year-To-Date: it shows your rank, the number of reviews and Compset Average for that current year up to the present date. w) Social Network Score: This graph displays aggregated score (Keyword score) of reviews collected from different social media sites. x) 200+ Reports Widgets: The reports module enables you to create reports like usual but it also enables you to create widgets. Thus, you can generate a report of your choice and then save the same as a widget. To do so, open the reports module and select the Widget radio button. Then you can generate the required report and click the Save button. Specify the name of the insight. This widget will be available on the Tools panel from where you can enable this widget. 18 What’s new video A new What’s New Video will be showcased on IQa Login Page in a modal window which will be displayed when any user clicks on What’s New icon on the Login page. Widgetization video A new Widgetization Video will be displayed on IQa dashboard which will showcase how to use the new IQa dashboard widgets. This video will be displayed in the following modes:1. A video icon will be displayed near the top menu bar with an arrow icon. Clicking the video icon will open the video in a modal window. Tools Panel The functionality of the Tools panel is to manage the settings for the IQa Dashboard widgets. 19 Index A I Alerts ................................................................10, 11 Assigned Jobs..........................................................10 icons ........................................................................ 2 J C Job Assignment .................................................. 6, 10 Channel Score ..................................................... 7, 10 Compset .................................................................12 Consumer Review Score Graph Review score graph ..............................................3 K Key Stats .................................................................. 6 Keyword Analysis Keyword .............................................................. 4 Klout Score ............................................................... 7 D dashboard............................................................. 2, 8 Displayed Graphs ......................................................9 M Manage Email Groups............................................ 11 E P Export /Print .............................................................9 Period Range selector ............................................ 12 Property Search ....................................................... 8 F Filter Criteria filter criteria .........................................................6 Filter Panel ................................................................8 Free Text Search .......................................................8 R Report Canvas .......................................................... 8 S G Save Displayed Report ............................................. 9 Saved Report Section ............................................... 9 Social media site tabs ............................................ 12 Social Network Score Graph Network score graph ........................................... 4 Social Status ........................................................... 11 Source of Review ..................................................... 6 Goals ................................................................... 9, 10 Graphs ......................................................................9 Guest Experience Heatmap ......................................5 H Health Summary .....................................................12 Help Videos...............................................................9 Highlights ..................................................................7 Hotel Post ...............................................................12 T Translate .................................................................. 6 Trip Advisor Ranking ................................................ 7 20