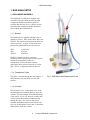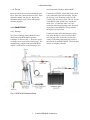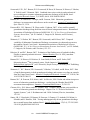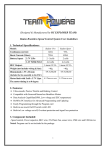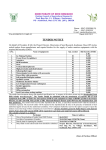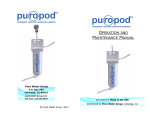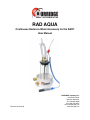
1
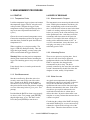
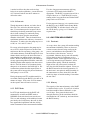
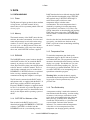
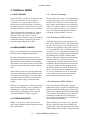
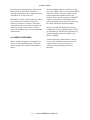
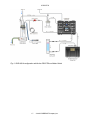
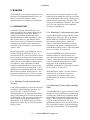
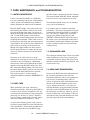
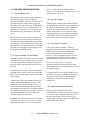
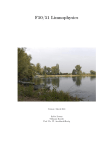
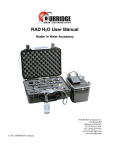
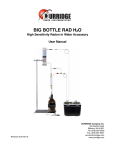
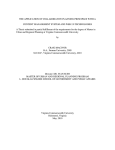
RAD AQUA
Continuous Radon-in-Water Accessory for the RAD7
User Manual
Revision 2015-03-06
DURRIDGE Company Inc.
524 Boston Road
Billerica, MA 01821
Tel: (978) 667-9556
Fax: (978) 667-9557
[email protected]
www.durridge.com
TABLE OF CONTENTS
INTRODUCTION!
5
1. RAD AQUA SETUP!
6
1.1 EXCHANGER ASSEMBLY!
1.1.1 Nozzles!
1.1.2 Temperature Probe!
1.1.3 Air return!
Fig. 1 RAD AQUA with Temperature Probe!
1.1.4 Tie rod!
6
6
6
6
6
7
1.2 CONNECTIONS!
1.2.1 Air loop!
Fig. 2 RAD7 AQUA Standard Setup!
1.2.2 DRYSTIK!
1.2.3 RAD7 and Exchanger Location!
1.2.4 Water Supply !
1.2.5 Temperature Probe!
7
7
7
8
8
8
8
1.3 WATER FLOW!
1.3.1 Water Source!
1.3.2. Water Level!
8
8
8
1.4 AIR FLOW!
1.4.1 Continuous Pumping!
1.4.2 Pump on “Auto”!
1.4.3 Mode set to “Auto”!
9
9
9
9
1.5. PROTOCOL!
1.5.1 RAD7 Protocol!
1.5.2 RAD AQUA Protocol!
1.5.3 User Protocol!
9
9
9
9
2. MEASUREMENT PROCEDURE!
10
2.1 START UP!
2.1.1 Temperature Probe!
2.1.2 Start Measurement!
10
10
10
2.2 SPEED OF RESPONSE!
2.2.1 Measurement in Progress!
2.2.2 Influencing Factors!
2.2.3 Water flow rate!
2.2.4 Air flow rate!
2.2.5 RAD7 Mode!
10
10
10
10
11
11
2
© 2015 DURRIDGE Company Inc.
2.3 Long Term Measurement !
2.3.1 Desiccant!
2.3.2 Memory !
3. DATA!
11
11
11
12
3.1 DATA HANDLING!
3.1.1 Printer!
3.1.2 Memory !
3.1.3 RADLINK!
3.1.4 CAPTURE for Windows or Mac!
3.1.5 Temperature Data!
3.1.6 Time Relationship!
12
12
12
12
12
12
12
3.2 DATA CONVERSION!
3.2.1 FRITZ WEIGEL!
3.2.2 CALCULATION!
13
13
13
4. THORON in WATER!
14
4.1 Why Thoron?!
14
4.2 Measurement in Water!
14
4.3 Thoron Sensitivity!
4.3.1 Source to Exchanger!
4.3.2 Exchanger to RAD7 method 1!
4.3.3 Exchanger to RAD7 method 2!
14
14
14
14
4.4 Speed of Response!
15
5. DRYSTIK!
16
5.1 Passive DRYSTIK!
16
5.2 Active DRYSTIK!
16
5.3 Effect on Response Time !
16
5.4 Custom designed Active DRYSTIK!
16
Fig. 3 RAD AQUA configuration with Active DRYSTIK and Water Switch! 17
6. BOATING!
18
6.1 Response time !
6.1.1 Minimizing T1 with increased water flow rate!
6.1.2 Minimizing T1 with reduced air volume!
6.1.3 Minimizing T2 with a higher sensitivity RAD7!
6.1.4 Minimizing T2 with multiple RAD7s and one RAD AQUA!
6.1.5 Minimizing T2 with multiple RAD7s and multiple RAD AQUAs!
3
© 2015 DURRIDGE Company Inc.
18
18
18
18
19
19
6.2 Pump position!
6.2.1 Positioning Equipment!
7. CARE, MAINTENANCE, and TROUBLESHOOTING!
19
19
20
7.1 WATER CATASTROPHE!
20
7.2 RAD7 CARE!
20
7.3 EXCHANGER CARE!
20
7.4 DESICCANT REGENERATION!
20
7.5 RAD AQUA TROUBLESHOOTING!
7.5.1 Rising Water Level!
7.5.2 Spray Chamber Fills With Water!
7.5.3 Air Path Integrity !
7.5.4 Poor Spray Formation!
7.5.5 Water Overflowing From Base!
21
21
21
21
21
21
References and Bibliography!
4
© 2015 DURRIDGE Company Inc.
22
Introduction
INTRODUCTION
The RAD AQUA is an accessory for the DURRIDGE RAD7 Electronic Radon Detector. It is a device to
bring the radon concentration in a closed air loop into equilibrium with the radon concentration in a flowthrough water supply. It consists of a spray chamber, called an “exchanger”, that brings the air and water
into equilibrium. The radon in the air is monitored continuously by the RAD7.
The partition coefficient, the ratio of radon concentration in the water to that in the air at equilibrium, is
determined by the temperature at the air/water interface. This temperature is measured with a temperature
probe inserted into the exchanger. At typical room temperature the coefficient is about 0.25. That means
there is four times higher concentration of radon in the air than in the water, so there is, in effect, a gain of
four times in the sensitivity of the system to radon in water, compared to radon in air.
It takes time for the water to deliver radon to the air loop and for the RAD7 to respond to the changed
radon concentration. With optimum configuration the response time of the system may be reduced to less
than half an hour.
CAUTION
Tap water and typical ocean water have sufficient dissolved gases to maintain the water level in the
exchanger at an acceptable level. However, should the water level in the exchanger start to rise to an
unacceptable height an air bleed may be added as described in Section 7. This will prevent water from
being drawn into the desiccant and hence into the RAD7.
5
© 2015 DURRIDGE Company Inc.
1. RAD AQUA Setup
1. RAD AQUA SETUP
1.1 EXCHANGER ASSEMBLY
The RAD AQUA exchanger is supplied semiassembled. First the chosen nozzles and other
components should be installed in the head
assembly then the base, trivet, cylinder, rod and
head should be assembled together and held in
place with the brass thumb screw.
1.1.1 Nozzles
The RAD AQUA is supplied with three pairs of
alternative nozzles. These are the WL4, WL1 and
WL0.25. We install one and include the other two
in the accessories. At 20psi (138 Pascal) water
pressure the published flow rates for each are:
WL4 WL1 WL0.25 -
10.98 L/min.
4.1L/min
0.68L/min.
WL0.25 is intended for slow continuous
monitoring where rapid changes are not expected
and where conservation of water is a
consideration. WL4 is intended for those
applications where speed of response is a major
goal. WL1 is a compromise between the two.
1.1.2 Temperature Probe
The probe is inserted through the stem adapter. A
little petroleum jelly may help it to slide into
position.
Fig. 1 RAD AQUA with Temperature Probe
1.1.3 Air return
The air return is sent, via the check valve, to the
internal tubing that terminates halfway down the
cylinder. The actual length of that internal tubing
is not critical. If it is very short air would be able
to short-circuit the exchanger without passing
through the spray. If it were too long it may
terminate beneath the internal water surface and
may lose air through the water outlet. It should be
about halfway down the cylinder.
6
© 2015 DURRIDGE Company Inc.
1. RAD AQUA Setup
1.1.4 Tie rod
feet between the exchanger and the RAD7.
Insert one end of the tie rod into the thread in the
trivet. Place the cylinder in the trivet slots. Push
the head assembly onto the rod. Attach and
tighten the thumb screw to draw and hold the
assembly together.
Connect the OUTLET of the RAD7 to the checkvalve connected to the head assembly. For this,
the 5ft long, 3/16" ID tubing, with a 1/8" ID
section at one end, may be used. The 1/8" end fits
on the RAD7 outlet, and the 3/16" end fits the
check valve. Connect the other 3/16” hose
connector on the head assembly to the laboratory
drying unit, at the SCREW CAP end, with the
tubing and sleeve provided.
1.2 CONNECTIONS
1.2.1 Air loop
Two pieces of tubing connect the RAD7 and
drying unit to the RAD AQUA air/water
exchanger, as shown in Fig. 2. These two pieces
of tubing can be several tens of meters long. The
standard tubing supplied with the RAD7/RAD
AQUA is sufficient for a connection up to five
Connect the other end of the laboratory drying
unit (there should be at least one inch of blue
desiccant left at this end) to the air inlet filter
(with 1/8" ID tubing at the filter end), which is
then placed on the RAD7 INLET. The Luer taper
ensures an airtight connection.
Fig. 2 RAD7 AQUA Standard Setup
7
© 2015 DURRIDGE Company Inc.
1. RAD AQUA Setup
1.2.2 DRYSTIK
1.2.5 Temperature Probe
Please note that the above instructions are for use
of the RAD AQUA without a DRYSTIK humidity
exchanger. A DRYSTIK, if available, should be
placed between the exchanger and the drying unit,
and the outer sheath should be purged with dry air
from the RAD7 outlet. See Fig. 3 in Section 5.
More details are provided in the DRYSTIK user’s
manual.
The temperature probe should be inserted down
the stem adapter as far as it will go. A little
Vaseline smeared on the shaft will help it go in
more easily, and will also ensure an air-tight
fitting. The probe should be plugged into the
temperature data logger, which should be put in
its own plastic bag to protect it, once it has been
launched.
1.2.3 RAD7 and Exchanger Location
1.3 WATER FLOW
Place the RAD7 on a clean, dry surface,
preferably inside a laboratory. If it has to be
located in a harsh environment, then it should be
protected from the elements (especially water). A
simple way to do this is to place the RAD7 inside
a large transparent plastic bag, such as the one in
which it was originally shipped. The bag opening
should be gathered around the inlet and outlet
tubes, so that the instrument is inside a closed
space, completely protected from the elements,
while still allowing observation of the LCD and
print-out, and operation of the key pad.
1.3.1 Water Source
The exchanger unit may be placed upright in a
sink, or higher than a boat’s gunwales. Water will
flow from the hose outlet, in the base of the
exchanger. A garden hose may be connected to
the exchanger base, to take the outflow, provided
it runs downhill from the exchanger.
1.2.4 Water Supply
The water supply should be connected to the two
large hose connectors in the head assembly. If the
supply will be at high pressure, then clamps may
be necessary around the water tubing, to hold the
tubes on.
For a slow-response application, where water
conservation is important, one nozzle can be
sealed with a cap over the hose connector and
water supplied only to the other one.
8
The water entering the instrument should come
direct from the sampling point, below the surface,
and should not have been exposed to any airwater interface en route. The water should be
clean and free from debris. If necessary, it should
be filtered (but not with charcoal) before entering
the exchanger. The preferred delivery system is a
submerged pump, delivering the water at fairly
low pressure, straight from the sampling point to
the exchanger. Three sizes of spray nozzle are
supplied. The choice will depend on the pump
performance and the speed of response required.
1.3.2. Water Level
With the water flowing, a spray will be observed
inside the body of the exchanger. Water will
accumulate inside the base and overflow out
through the hose connector(s). If the flow rate is
very high it may be necessary to utilize both hose
connectors. The level may also start to rise too
high inside the body of the exchanger. To correct,
either reduce the flow rate or purchase the
optional 12” cylinder. A high water level inside
the exchanger is no problem provided it is no
more than 1/3 of the way up the exchanger and is
stable.
If the water level rises slowly but continuously up
the cylinder it will be due to the water source
being completely without dissolved air. To
correct this a bleed may be added to the return air
path from the RAD7. It should be a long piece of
tubing open at one end and connected with a T-
© 2015 DURRIDGE Company Inc.
1. RAD AQUA Setup
connector to the tubing between the head
assembly and the check valve.
charged condition.
1.5.2 RAD AQUA Protocol
1.4 AIR FLOW
Switch on RAD7. Push the MENU key. Go to:
1.4.1 Continuous Pumping
If you choose “SETUP PUMP ON [ENTER]” and
“SETUP MODE SNIFF [ENTER]”, then the
pump will run continuously, regardless of the
length of the cycles, or status of the RAD7, and
the RAD7 will count only 218-Po decays. In this
operational mode, the system will have the fastest
response time, but desiccant is quickly hydrated.
SETUP CYCLE, push <ENTER>. Set the cycle
time required (as discussed above).
SETUP RECYCLE to 00, for continuous
operation.
SETUP MODE: For fast response, with moderate
or high radon concentrations, choose SNIFF. For
low concentrations, to gain better statistics,
choose AUTO.
1.4.2 Pump on “Auto”
SETUP THORON: Choose OFF
The pump, in auto operation, pumps for five
minutes at the beginning of every cycle and then
for one minute in every five. The length of each
cycle is chosen by the user. Short cycle times will
involve more pumping and speed up the response
of the instrument, but will consume more
desiccant. Longer cycle times will give better
statistical precision to the individual readings, and
will conserve desiccant and memory space.
For rapidly changing concentrations of radon in
the water, 10 minute cycles, with the PUMP on
AUTO and MODE on SNIFF, may be a suitable
compromise, though not giving fastest response.
SETUP PUMP: Choose ON or AUTO, depending
on choice, see above
SETUP TONE: Choose what you like
SETUP FORMAT: Choose what you like, but
LONG format with short cycle times uses a lot of
paper. You will probably not need to use the
printer at all, in the field.
SETUP UNITS: Your choice
SETUP SAVUSER: Push <ENTER>. When it
says “Are you sure?” use arrow keys to change
response to “Yes” and push <ENTER>.
1.4.3 Mode set to “Auto”
For very low concentrations, or when long-term
monitoring is desired, long cycle times of an hour
or longer, with the PUMP and MODE set to
AUTO, may make good sense.
1.5. PROTOCOL
1.5.1 RAD7 Protocol
1.5.3 User Protocol
You now have your personalized USER protocol
saved. To recall your settings, go to SETUP
PROTOCOL USER and push <ENTER>. To
make a change, simply display the parameters to
be changed, make your changes then, once more,
go to SETUP SAVUSER and save them.
First, please read the RAD7 manual and learn
how to use the instrument for measurement of
radon in air. The RAD7 should normally be
operated with AC (or, with 12V option, 12V)
power applied, to keep the batteries in a fully
9
© 2015 DURRIDGE Company Inc.
2. Measurement Procedure
2. MEASUREMENT PROCEDURE
2.1 START UP
2.2 SPEED OF RESPONSE
2.1.1 Temperature Probe
2.2.1 Measurement in Progress
Load the temperature logger software and connect
the temperature logger to the PC using the serial
cable provided. Configure the logger to take
temperature readings at frequent intervals (these
may be far more frequent that the RAD7 test
cycles.)
The instrument is now measuring the radon in the
water. With high concentrations and short cycle
times, and depending on the air and water flow
rates, it will take half an hour or more before there
is much of a reading, and maybe fifty minutes
before you can rely on the count rate being close
to the equilibrium value. After that you need to
accumulate sufficient counts for the precision
desired. For example, 100 counts would give a
reading with a standard deviation of 10%. At
very low concentrations, it may take hours, and
averaging over many cycles, to reach a
sufficiently precise value.
Choose the second (external) temperature sensor.
Connect the temperature probe to the logger and
note that when you hold the probe the indicated
temperature rises.
When everything is set, begin recording. The
logger’s LED may flash periodically. Once the
logger has begun running, you may remove the
serial cord from both the logger and the PC.
Warning! Make sure that previous temperature
data has been downloaded before launching the
logger. The launching process may erase previous
data.
If not already done so, insert the probe into the
RAD AQUA.
2.2.2 Influencing Factors
There are two processes requiring time. One is
for the air in the closed loop to approach
equilibrium with the water and the other is for the
RAD7 to respond to the changed radon
concentration in the air loop. The first is
primarily controlled by the water flow rate and the
second is determined by the half life of the first
daughter of radon, namely 218-polonium.
2.1.2 Start Measurement
2.2.3 Water flow rate
Start the water flowing. Note that, after a few
seconds, water starts to flow out of the outlet
hose. Switch on the RAD7 (have the printer
switched on if you are using it. The RAD7 will
then print a header for the data printout, including
a review of the setup, before it gives you a ‘Test’
prompt.)
Provided that the RAD7 has been set up properly,
see above, at the ‘Test’ prompt, push [ENTER]
then the right arrow, to see ‘Test Start’ on the
LCD, then push [ENTER] to start the test.
At typical room temperature, the equilibrium
coefficient for radon in air and water is about 4:1.
That is the concentration of radon in air at
equilibrium with water will be four times higher
than the concentration in the water. If the water
were able to give up all its radon to the air it
would take four times the air volume just to
deliver the radon. In practice the transfer is not
complete so we may estimate that ten times the air
volume is required.
Considering the volume of the RAD7, the drying
unit and the RAD AQUA, we can conservatively
estimate the volume of the air loop to be of the
order 4 litres. Therefore about 40 litres of water
10
© 2015 DURRIDGE Company Inc.
2. Measurement Procedure
is needed to deliver the radon to the air loop
before it can reach equilibrium. A water flow rate
of V L/min will take at least 40/V minutes to
deliver the radon.
For slow, long-term measurements with long
cycle times AUTO mode for the RAD7 is
appropriate. The RAD7’s response time will be a
couple of hours or so. The RAD AQUA can be
running with a low water flow rate and the RAD7
pump can be on AUTO also.
2.2.4 Air flow rate
Though important for thoron, see below, the air
flow rate is less critical to the radon response
time. For maximum speed of response, the air
should keep circulating around the loop so that
the air in the exchanger is continually being
replenished with air from the measurement
chamber of the RAD7. Thus the shortfall from
equilibrium and hence the efficiency of transfer is
maximized. To achieve this the pump may be set
to ON, see 1.4.1 and 1.5.2 above.
For a more relaxed operation, the pump may be
set to AUTO, which will preserve the desiccant
and increase the life expectancy of the pump. Air
will remain stationary in the RAD AQUA for four
minutes before moving to the desiccant where it
waits another four minutes before entering the
RAD7. While in the RAD AQUA, the stationary
air may approach equilibrium with the water thus
inhibiting further radon transfer from the water to
the air. It will be about 15 to 20 minutes before
that parcel of air returns to the RAD AQUA. We
can therefore estimate that the response time of
the system will be increased by about 20 minutes
if the pump is set to AUTO
Having the pump on AUTO would normally be
associated with having the RAD7 cycle time of 30
minutes or longer. So an extra 15 to 20 minutes
on the response time will not be excessive.
2.2.5 RAD7 Mode
In AUTO (the default) mode, the RAD7 will
automatically switch from SNIFF mode to
NORMAL mode after three hours into the run.
This is to take advantage of the additional counts
provided by the 214-Po decays that will, by then,
have approached equilibrium with the (steady)
radon concentration in the measurement chamber.
11
For fast response, however, it is essential to force
the RAD7 to stay in SNIFF mode (Setup, Mode,
Sniff [ENTER]). It will then always count only
the 218-Po decays, giving it a 13-minute, 95%
response time.
2.3 LONG TERM MEASUREMENT
2.3.1 Desiccant
As set up, above, the system will continue making
measurements indefinitely. There are, however,
various resources that are being used up in the
process, and which must be replenished. The
most obvious is the desiccant. A new, or
regenerated, laboratory drying unit will normally
last for about ten days of continuous use in a
temperate climate. In this application, however, it
is receiving saturated air and, therefore, will be
hydrated more quickly. When the remaining
length of blue (dry) desiccant is less than one
inch, the desiccant should be replaced. Please see
the RAD7 manual on desiccant regeneration. If
the desiccant is not replaced, and the humidity in
the instrument rises above about 20%, then the
sensitivity drops off and the reading is lower than
the true value.
2.3.2 Memory
The capacity of the internal memory of the RAD7
is 1,000 records or cycles. If each cycle is half an
hour, that would be data for 500 hours, or just
over 20 days. Every time the desiccant is
changed, therefore, all the stored data should be
downloaded to a PC, backed up, and erased from
the RAD7 memory.
© 2015 DURRIDGE Company Inc.
3. Data
3. DATA
3.1 DATA HANDLING
3.1.1 Printer
The IR printer will print out data in short, medium
or long format - see RAD7 manual. In long
format, there will be a spectrum printed at the end
of every cycle.
3.1.2 Memory
The internal memory of the RAD7 stores the date
and time, the radon concentration, live time, total
count and percentage in each of the main energy
windows, as well as a host of other parameters,
for every cycle - see RAD7 manual. These data
can be downloaded to a PC at any time, during or
after a run, with CAPTURE software, supplied.
RAD7 data that has been collected using the RAD
AQUA should be downloaded using CAPTURE,
then graphed using CAPTURE’s RAD AQUA
radon source option, which uses water
temperature data to calculate radon
concentrations. This water temperature data is
obtained by exporting it from the temperature
logger software, (see Section 3.1.5, below). For
specific instructions on downloading and graphing
RAD7 data, please refer to the CAPTURE user’s
manual, which is available from the DURRIDGE
web site.
Once the data has been downloaded and backed
up securely, you should erase the data on the
RAD7, to prevent it from accumulating and filling
the device’s memory.
3.1.5 Temperature Data
3.1.3 RADLINK
The RADLINK remote control software installed
in the RAD7 enables a PC to control the RAD7
remotely, to grab any or all of the data, and to
divert what would have been sent to the IR printer
to the PC instead - see RAD7 manual. These, as
with all other commands, may be invoked from
DURRIDGE’s CAPTURE software, as explained
below, or using a terminal program that can
communicate through the computer’s serial port.
The PC must be connected to the RAD7 with a
null-modem cable, as supplied with the RAD7. If
the PC does not have an RS232 serial port the
Keyspan USB/RS232 adaptor, as supplied, should
be used. It is advisable to go to the Keyspan web
site (<www.keyspan.com>) to download the latest
driver for the adaptor and the operating system of
the PC.
3.1.4 CAPTURE for Windows or Mac
Data recorded to the RAD7 may be easily
download and graphed DURRIDGE’s CAPTURE
software. CAPTURE is available from the
DURRIDGE web site (<www.durridge.com>).
12
To obtain the temperature data, hook up the
temperature logger to the PC and run its software
to download the data. The program will take a
moment to download the entire memory, and then
display it as a graph. You should save it to your
hard drive before doing anything else. You can
also export it to a comma-delineated .TXT file for
use with CAPTURE, or for incorporating into a
spreadsheet or database program.
Warning! Make sure that the data is properly
downloaded and backed up before launching the
logger again. Certain operations may erase
previous data.
3.1.6 Time Relationship
A temperature reading is made at the moment in
time indicated with the reading. A radon reading,
in contrast, is the average value taken over the
cycle whose end occurred at the time indicated.
More precisely, in SNIFF mode, taking into
account the 218-Po half life, a cycle whose end
occurred about 5 minutes before the time
indicated. For constant radon and temperature
values this is of no consequence but if the
temperature was changing quickly, then the
© 2015 DURRIDGE Company Inc.
3. Data
temperature readings during the course of the
radon cycle, and for five minutes before, should
be averaged to give the average temperature at the
air water interface when the radon being
measured was leaving the water.
3.2 DATA CONVERSION
3.2.1 FRITZ WEIGEL
The RAD7 gives an accurate reading of the radon
concentration in the air. With the RAD AQUA,
this air reaches equilibrium with the water in the
exchanger. To convert the air concentration to
water concentration, the air concentration must be
multiplied by the partition, or equilibrium,
coefficient, given by the Fritz Weigel equation
(Weigel, 1978):
3.2.2 CALCULATION
The RAD7 radon data is stored in the RAD7 and
the water temperature data is stored in the
temperature logger. It is necessary to download
the RAD7 data to a PC, preferably using
DURRIDGE’s CAPTURE software, and to
download the temperature logger data using the
software provided by the logger’s manufacturer.
The water radon concentration may be calculated
using CAPTURE (see the RAD AQUA
information in the CAPTURE user’s manual) or it
may be calculated manually, according to the Fritz
Weigel equation. CAPTURE automatically gives
the average radon concentration of the selected
data between the cursor lines, but the temperature
needs to be assessed separately and entered into
the equation above to determine the partition
ratio.
a = 0.105 + 0.405 * exp(-0.0502*T)
where T is the temperature in deg C.
At room temperature, a is around 0.25, giving, at
equilibrium, a four-to-one ratio of radon in air to
water.
13
© 2015 DURRIDGE Company Inc.
4.Thoron in Water
4. THORON in WATER
4.1 WHY THORON?
4.3.1 Source to Exchanger
Thoron, 220-Rn, an isotope of 222-Rn radon, has
a 55.6 second half life. As a result, almost
everywhere, it is not to be found. Close to a
thoron source, however, the water will still have
measurable thoron as it will be still be young and
not have had time for it all to have decayed away.
The time delay in the water can be made small by
having a high water flow rate and a short, small
diameter hose. If the hose is no more than 3m
long, with an internal diameter of no more than
8mm, say, the hose volume will not exceed 0.15
litre and a water flow rate of, say, 4 L/min will
mean a time delay for the thoron to reach the
exchanger of no more than 2.5 seconds.
Thoron coexists with radon in the soil. Ground
water entering the ocean will therefore bring
thoron as well as radon with it. Around
submarine springs, therefore, there may be thoron
in detectable amounts and this may be used to
locate the springs (Burnett et al, 2007).
4.2 MEASUREMENT IN WATER
Because of its short half-life, the measurement of
thoron in water is fraught with difficulties.
First, the concentration in the water will vary
significantly from point to point and from time to
time depending on the position of the sampling
point relative to the position of the source and the
water flow between the source and the sampling
point.
Second, during the process of getting the thoron
atoms into the measuring device, the thoron will
be decaying thus reducing the size of the sample.
An estimate of the time taken for this process is
required in order to apply a correction to the
reading.
However, if using thoron as a tracer, a knowledge
of the absolute sensitivity is not so important as
minimizing the lower limit of detection. This
may be done by making the transfer of thoron
atoms into the RAD7 as quick as possible.
4.3 THORON SENSITIVITY
Sample is lost by decay while in the water en
route to the exchanger and then again in the air en
route to the RAD7.
14
4.3.2 Exchanger to RAD7 method 1
The RAD7 pump will typically generate an air
flow rate of around 0.9 L/min. The volume of the
air above the water spray in the chamber will be
about 0.5L, the laboratory drying unit is about 1L
as is also the RAD7 itself. An estimate, therefore
of about 2.5L of air is required to be pumped for a
thoron atom in the exchanger to reach the RAD7.
At 900ml/min this will take a little less than 3
minutes. The thoron will have decayed through
about three half lives between leaving the
sampling point and being detected in the RAD7.
In addition, the transfer from the water to the air
will not be complete and the returning air from
the RAD7 will have lost almost all its thoron, so
there is another factor to be multiplied in. All in
all, we may estimate that we see no more than
10% of what would have been seen had there
been no thoron decay during acquisition.
4.3.3 Exchanger to RAD7 method 2
Instead of using the RAD7 pump, a separate
pump may be used to circulate air round the loop
much faster than the RAD7 pump. However, the
RAD7 cannot tolerate an air flow rate higher than
3L per minute. The RAD7, therefore, should be
connected to tap into the fast recirculating air
loop, using its own pump to do so, with the main
air flow bypassing the RAD7.
With a circulating air flow rate of, say, 10L/min
the delay from the exchanger to the RAD7 tap
will be about 0.2 minutes and from the tap to the
RAD7 chamber about 1 minute. So now, the total
© 2015 DURRIDGE Company Inc.
4.Thoron in Water
time delay from sampling point to entry into the
RAD7 will be no more than 1.5 minutes so
reducing the attenuation due to radioactive decay
of the thoron to no more than 70%.
Furthermore, with the external pump, the time for
air to circulate once round the loop will be
reduced to a fraction of a minute. The thoron
concentration in the recirculated air will now be
significant, giving a better chance for the air
leaving the exchanger to be closer to equilibrium
with the water.
The first daughter of thoron, 216-Po, has a half
life of just 150mS. Thus in 0.5 seconds the RAD7
window B, 216-Po, count rate will have nearly
reached equilibrium with the thoron in the
chamber. So the speed of response of the RAD7
to thoron is limited not be the half life of the
polonium daughter but by the time it takes to get
the sample into the measurement chamber.
We have seen that with the highest sensitivity
configuration, using a separate pump to circulate
air round the loop, the total time for thoron to go
from the sampling point to the RAD7 is only
about 1.5 minutes.
4.4 SPEED OF RESPONSE
There is another advantage to using thoron as a
tracer to locate submarine springs. That is the
almost instantaneous response of the RAD7 to
thoron.
15
A boat carrying the system, therefore, moving
slowly, will see the thoron count rate increase
within a minute or two of passing over a
submarine spring and drop again shortly
thereafter.
© 2015 DURRIDGE Company Inc.
5. DRYSTIK
5. DRYSTIK
a tiny volume to the air loop, maintaining a fast
response. See Fig. 3.
5.1 PASSIVE DRYSTIK
A passive DRYSTIK may be installed in the RAD
AQUA system without modifying any other part
of the system or the operating conditions. The
inner membrane tube goes between the exchanger
and the desiccant while the outer sheath is purged
by dry air from the RAD7 outlet. The two flows
should be in opposite directions along the
DRYSTIK. A 12” DRYSTIK will increase the
life of the desiccant by a factor of about five. A
48” DRYSTIK will increase the life by about 10
times.
5.3 EFFECT ON RESPONSE TIME
With a flow rate of only 0.2 L/min it will take
about 20 minutes for the air in the loop to go
round once. This will make thoron detection
impossible and also add an extra 10 or 15 minutes
to the response time for radon. For long term
studies the slower response is generally not
important, whereas the frequency of replacing the
desiccant may be. So an active DRYSTIK may
be of considerable benefit.
5.2 ACTIVE DRYSTIK
In active configuration, there is a pump upstream
and a needle valve downstream of the inner
membrane tube. This increases the pressure
inside the tube which increases its efficiency.
A typical setup has the RAD7 pump set to OFF
(Setup, Pump, Off [ENTER]), the DRYSTIK
pump running continuously and the needle valve
adjusted to give a flow rate of about 0.2 L/min.
When using an active DRYSTIK, a small drying
tube, inserted between the DRYSTIK needle
valve outlet and the inlet filter on the RAD7, will
keep the air sample in the RAD7 below 7% RH. It will also last for a very long time and add only
16
5.4 CUSTOM DESIGNED ACTIVE
DRYSTIK
The 0.2 L/min of the DURRIDGE-supplied active
DRYSTIK arises because it matches the average
flow rate of a RAD7 in AUTO mode and also
matches the performance of the installed pump at
a pressure of 44 PSI (3 atmospheres). With the
appropriate choice of pump and needle valve, an
active DRYSTIK can be produced that will
maintain a 44 PSI pressure inside the inner
membrane tubing and a flow rate of 1L/min or
even more, to restore the speed of response of the
system while virtually eliminating the need to
replace the desiccant periodically.
© 2015 DURRIDGE Company Inc.
5. DRYSTIK
Fig. 3 RAD AQUA configuration with Active DRYSTIK and Water Switch
17
© 2015 DURRIDGE Company Inc.
6. BOATING
6. BOATING
The RAD AQUA was originally designed to serve
the needs of oceanographers making surveys, by
boat, of coastal zones and lakes. In this
application there are a number of considerations.
6.1 RESPONSE TIME
If the boat is moving, which it usually is, the
speed of response of the system translates to the
spatial discrimination of the data. Roughly
speaking, the minimum distance that can be
separated in terms of radon concentration is the
95% response time, to a step change in radon,
times the boat velocity. It behoves one, therefore,
to minimize the response time in order to have
reasonable spatial resolution at a boat speed that
is not too slow.
By going through the spray chamber the water is,
in effect, delivering radon to the air loop. As
discussed earlier, if V is the total volume of the air
loop, it needs 10 to 20 times that volume of water
to pass through the exchanger to deliver sufficient
radon to the air for the reading to approach close
to equilibrium. After equilibrium is reached,
sufficient counting time then has to pass for the
reading to achieve the desired precision. Call T1
the time to reach equilibrium and T2 the counting
time needed to reach the desired precision. For a
given setup and flow rates, T1 will be a constant. T2 will be a function of the radon concentration.
However, for fastest possible response time, the
RAD AQUA can handle flow rates up to 10 L/min
or more, through two W4 nozzles. But the power
needed increases significantly. The Rule 3700
delivers 6 L/min through a W4 nozzle, but it takes
over 15A. One 8-hour run would completely
discharge a 120 AH battery.
6.1.2 Minimizing T1 with reduced air volume
A typical RAD AQUA setup has a RAD7, a spray
chamber and a drying unit. The spray chamber
and the RAD7 are each around 1L in volume. The Laboratory Drying Unit is about 0.5L. Tubing volume can be minimized by avoiding
unnecessarily long lengths of tubing and using
small ID tubing where possible. This setup would
have an air volume, V, of about 2.5L.
An Active DRYSTIK, that efficiently removes
humidity from the air even when there is no
desiccant in the circuit, has only a small air path
volume. It can replace the Laboratory Drying
Unit. For optimum drying efficiency a small
drying tube can be inserted between the
DRYSTIK and the RAD7. This setup would have
an air volume, V, of about 2.2L.
With a Rule360, 10 times V of water would be
delivered in 11 or 9 minutes, respectively. Conservatively, the response time to reach
equilibrium may be taken to be 20 minutes in
either case.
6.1.1 Minimizing T1 with increased water
flow rate
Use the fastest pump that is consistent with power
availability. A Rule360 bilge pump draws less
than 2.2A at 12V. It delivers 4.8 L/min,
unobstructed flow, to 2ft above the water surface,
and 2.4 L/min through two W1 nozzles mounted
in a RAD AQUA. For many purposes, this pump
rate is adequate and the power requirement is
quite modest. A 45 AH car battery can run the
pump for two 8-hour days of surveying and have
energy to spare.
18
6.1.3 Minimizing T2 with a higher sensitivity
RAD7
A standard RAD7 has a typical sensitivity of 0.25
cpm/(pCi/L) (0.007 cpm/(Bq/m3)) in Sniff mode
(counting only 218Po decays) and double that in
Normal mode (counting both 218Po and 214Po
decays). Water at typical room temperature with
2.5 pCi/L radon concentration will reach
equilibrium with radon in air at around 10 pCi/L. This will produce around 2.5 cpm in Sniff mode
and 5 cpm in Normal mode, in a standard RAD7.
© 2015 DURRIDGE Company Inc.
6. BOATING
For 10% standard deviation, or 20% two-sigma
uncertainty, we need, according to Poisson
statistics, 100 counts. In Sniff mode that would
take 40 minutes. Thus, at 2.5 pCi/L radon in the
water, with a Rule 360 pumping the water and a
single, standard RAD7, the total time to reach a
reading with better than 20% two-sigma
uncertainty would be about one hour. A much
faster pump could perhaps reduce that time by
about 10 minutes.
A high-gain RAD7 generally has an oversized
dome and and oversized alpha detector. The gain
is increased by better than 50%, over a standard
RAD7, and the volume increased by about 0.2L. Thus the equilibrium time, T1, will be increased
by a minute or two while the counting time will
be reduced by more than 33% which, in this case,
will be around 14 minutes. So, for this radon
concentration, there will be a net reduction of
more than ten minutes in the response time.
6.1.5 Minimizing T2 with multiple RAD7s and
multiple RAD AQUAs
If each RAD7 has its own RAD AQUA and bilge
pump, adding another complete system will not
change T1, but will reduce T2. A compromise of
adding another bilge pump and RAD AQUA for
every two RAD7s may best meet a user's need for
fastest response on the one hand and minimum
power requirements on the other.
6.2 PUMP POSITION
In a stationary boat it is simple to hang a bilge
pump over the side to the depth of interest. But
when the boat is moving there is a lateral force on
the pump that may force it towards the stern and
consequently bring it closer to the surface.
6.2.1 Positioning Equipment
6.1.4 Minimizing T2 with multiple RAD7s and
one RAD AQUA
Several RAD7's may be deployed in parallel, all
accessing one RAD AQUA. In analyzing the data
uncertainty, the counts of all the RAD7s are
summed. Thus three RAD7s will reduce the time
to reach a given precision by a factor of three. On
the other hand, each RAD7 adds about 1L to the
air-loop volume, thus potentially increasing T1.
A long tether, running from the near the bow, will
stop the pump from swinging to the stern, when
the boat is under way. If the pump is heavy
enough, or if a weight is added, this tether may be
enough. Another tether, from the near the stern,
will support the pump when the boat is stationary.
A stiff pole could be used, with the tether, to keep
the pump at a fixed depth, regardless of the boat
speed.
For example, with the radon concentration as
above, three high-gain RAD7s with one
Laboratory Drying Unit, one RAD AQUA and a
Rule 360 pump, the counting time to reach about
20% two-sigma uncertainty will be about 10
minutes (reduced from 30 minutes with only one
RAD7). On the other hand, there is an extra 2L in
the air loop, requiring an extra 20L - 40L of water. With the Rule 360 that would take an extra 10 15 minutes, reducing the advantage of the three
pumps to only 5 to 10 minutes. But with the Rule
3700, the extra 20L to 40L of water would take
only 3 or 4 minutes to deliver, thus preserving
almost all the 20 minute gain of the multiple
counting technique.
19
© 2015 DURRIDGE Company Inc.
7. CARE, MAINTENANCE, and TROUBLESHOOTING
7. CARE, MAINTENANCE, and TROUBLESHOOTING
7.1 WATER CATASTROPHE
If water ever enters the RAD7, or if the RAD7
ever goes swimming in the water, it will probably
cease to operate and immediate steps should be
taken to minimize the impact on the instrument.
Keep the RAD7 upright. This will prevent water
from touching the detector, which is close to the
face plate at the top of the dome. Put a piece of
tubing on the RAD7 outlet with the other end in a
sink. Use the RAD7 pump if it still works or,
otherwise, an external pump into the inlet, to blow
air through the instrument. When water ceases to
be blown out of the outlet, put desiccant upstream
of the RAD7 to dry out the air path. When the air
path is fully dry (after dry air has been blown
through it for approximately one hour), remove
the face plate from the case, empty the water out
of the case and blow dry the case and the RAD7
electronics.
Once there is no visible water in or on the
instrument, it can be put in an oven at 50℃ for a
few hours to dry out completely. Additionally,
desiccated air can be passed through the air path
until the air leaving the RAD7 drops below 10%
RH. After this treatment further corrosion will be
prevented, and the RAD7 will boot once more and
you can use the internal RH sensor to measure
how dry the air path is. At this point the
instrument should be returned to DURRIDGE for
service.
7.2 RAD7 CARE
Water, particularly salt water, is hostile to
electronic instruments. Please keep the RAD7 in
a relatively clean and dry environment. One way
is to enclose the instrument in a large, transparent
plastic bag, see Section 1.2.3 above. Should it
ever be seriously splashed with salt water, please
follow the instructions in Section 7.1, above.
into their sockets, and push the lid onto its hinges.
The wrap will make the RAD7 almost watertight.
If it tears it can be easily replaced at any time.
The instrument should, in any case, be returned
every year for recalibration.
It is useful to look at a cumulative spectrum
periodically. This may be obtained by having the
printer on and allowing the RAD7 to complete a
run. The “Recycle” number may be set to the
current cycle number (Setup, Recycle, NN
[ENTER]). When the RAD7 reaches the end of
the current cycle it will then print out the end of
run summary including the cumulative spectrum.
Look to see that the peaks are clean and in the
normal position.
7.3 EXCHANGER CARE
The exchanger should be kept as clean as possible
in the circumstances. Sea water, if carrying any
solid matter, should be filtered. The spray nozzle
should be examined for build-up of deposits, and
cleaned if necessary.
7.4 DESICCANT REGENERATION
Please see the RAD7 manual for information on
the care and regeneration of the desiccant.
Regenerated desiccant, after a few regenerations,
loses most of its indicating ability (due, we
believe, to migration of the cobalt chloride to the
interior of the calcium sulphate crystals). One
way to ‘indicate’ the status is, every time you
refill the laboratory drying unit with regenerated
desiccant, you first add half an inch or so of new,
blue desiccant, out of the jar. This way, you can
always tell if the unit is still working, as the new
desiccant will only turn pink when the rest of the
desiccant, upstream, has become hydrated.
As a preventive measure, plastic cling wrap can
be placed over the RAD7 face plate and down the
sides of the RAD7. Push it down around the hose
connections, push the power and RS232 plugs
20
© 2015 DURRIDGE Company Inc.
7. CARE, MAINTENANCE, and TROUBLESHOOTING
7.5 RAD AQUA TROUBLESHOOTING
7.5.1 Rising Water Level
Should water rise inside the exchanger there is a
danger that it may be sucked out into the
desiccant and RAD7. This may occur because of
the water supply having no dissolved gas and
absorbing air from the exchanger. To prevent this,
a bleed consisting of a long, small bore piece of
tubing may be connected, with a T-connector, to
the return air supply downstream of the check
valve.
Rising foam, due to some forms of pollution in
the water, may also be treated with a bleed as in
the above paragraph. Should that not prevent the
foam rising too far, the intensity of the spray and
flow velocity of the water will need to be reduced.
This will slow down the speed of response of the
RAD AQUA and RAD7 system.
7.5.2 Spray Chamber Fills With Water
If the spray chamber fills with water, the air return
tubing inside the spray chamber may be too long. The open end should be about half way between
the spray nozzle opening and the water level in
the base.
If the tubing is too long it is easy to disassemble
the RAD AQUA (simply remove the knurled nut
and pull the assembly apart) and cut off the extra
tubing length.
Another cause of the spray chamber filling with
water is the depletion of dissolved gases. This
would cause air to be lost from the air loop. A
bleed inserted between the check valve and the
spray chamber air connection, with approximately
1m of tubing, will replace any air that is removed
and will establish the air pressure inside the
chamber at atmospheric pressure.
In addition, the spray chamber may fill with water
if the system’s air loop is not closed, or if it has a
significant leak. This will cause the air pump to
21
remove air from the spray chamber without
replacing it. Verify that the closed air loop has no
open connections or leaks.
7.5.3 Air Path Integrity
When drawing a sample from a remote location,
air path integrity is essential to prevent dilution of
the sample with ambient air. Always make sure
that there are no loose connections or leaky
fittings (such as the screw cap of the laboratory
drying unit) in the air loop, particularly upstream
of the RAD7. In the event of unexpectedly low
radon values, check the air path for integrity.
7.5.4 Poor Spray Formation
If the spray pattern is degraded, with no or
inadequate spray curtain, the response time of the
RAD AQUA will be increased, though the
eventual equilibrium for radon will not be
affected. (Thoron equilibrium will be seriously
affected because the additional time to reach
equilibrium allows more of the thoron to decay.)
One cause of a poor spray is a pump of
insufficient strength. Be advised however that
larger pumps may cause other problems related to
the supply of power.
If a bigger pump is not an option, another way to
increase the flow rate to generate a better spray is
to switch to smaller nozzles. Disassemble the
RAD AQUA, and replace the nozzles with
smaller ones.
7.5.5 Water Overflowing From Base
Where possible, place the RAD AQUA
somewhere that overflowing water doesn't matter.
It is also advisable to screw the drain hose onto
the lower base outlet. The top outlet may be
opened and if permitted, water may be allowed to
spill from the outlet directly.
© 2015 DURRIDGE Company Inc.
References and Bibliography
References and Bibliography
In chronological order
Weigel, F, 1978. Chemiker Zeitung, 102 (1978) 287
Burnett, W.C., G. Kim, and D. Lane-Smith, 2001. A continuous radon monitor for assessment of
radon in coastal ocean waters. Journal of Radioanalytical and Nuclear Chemistry, 249,
167-172.
Burnett, W.C., J. Chanton, J. Christoff, E. Kontar, S. Krupa, M. Lambert, W. Moore, D.
O’Rourke, R. Paulsen, C. Smith, L. Smith, and M. Taniguchi, 2002. Assessing
methodologies for measuring groundwater discharge to the ocean. EOS, 83, 117-123.
Lambert, M.J. and W.C. Burnett, 2003. Submarine groundwater discharge estimates at a Florida
coastal site based on continuous radon measurements. Biogeochemistry, 66, 55-73.
Chanton, J.P., W.C. Burnett, M. Taniguchi, H. Dulaiova, and D.R. Corbett, 2003. Seepage rate
variability derived by Atlantic tidal height. Biogeochemistry, 66, 187-202.
Burnett, W.C. and H. Dulaiova, 2003. Estimating the dynamics of groundwater input into the
coastal zone via continuous radon-222 measurements. Journal Environmental Radioactivity,
69, 21-35.
Dulaiova, H., R. Peterson, W.C. Burnett, and D. Lane-Smith, 2005. A multi-detector continuous
monitor for assessment of 222Rn in the coastal ocean. Journal of Radioanalytical and
Nuclear Chemistry, 263(2), 361-365.
Dulaiova, H. and W.C. Burnett, 2006. Radon loss across the water-air interface estimated from
222Rn-224Ra. Geophysical Research Letters, 33, L05606, doi:10.1029/2005GL025023.
Burnett, W.C. and H. Dulaiova, 2006. Radon as a tracer of submarine groundwater discharge
into a boat basin in Donnalucata, Sicily. Continental Shelf Research, 26, 862-873.
Dulaiova, H. , W.C. Burnett, G. Wattayakorn, and P. Sojisuporn, 2006. Are groundwater inputs
into river-dominated areas important? The Chao Phraya River – Gulf of Thailand.
Limnology and Oceanography, 51, 2232-2247.
Povinec, P.P., P.K. Aggarwal, A. Aureli, W.C. Burnett, E.A. Kontar K.M. Kulkarni, W.S. Moore,
R. Rjar, M. Taniguchi, and 11 others. 2006. Characterization of submarine groundwater
discharge offshore south-eastern Sicily. Journal Environmental Radioactivity, 89, 81-101.
Burnett, W.C., P.K. Aggarwal, H. Bokuniewicz, J.E. Cable, M.A. Charette, E. Kontar, S. Krupa,
K.M. Kulkarni, A. Loveless, W.S. Moore, J.A. Oberdorfer, J. Oliveira, N. Ozyurt, P.
Povinec, A.M.G. Privitera, R. Rajar, R.T. Ramessur, J. Scholten, T. Stieglitz, M. Taniguchi,
J.V. Turner, 2006. Quantifying submarine groundwater discharge in the coastal zone via
multiple methods. Science of the Total Environment, 367, 498-543.
Dulaiova, H., W.C. Burnett, J.P. Chanton, W.S. Moore, H.J. Bokuniewicz, M.A. Charette, and E.
Sholkovitz, 2006. Assessment of groundwater discharges into West Neck Bay, New York,
via natural tracers. Continental Shelf Research, 26, 1971-1983.
22
© 2015 DURRIDGE Company Inc.
References and Bibliography
Swarzenski, P. W., W.C. Burnett, W.J. Greenwood, B. Herut, R. Peterson, N. Dimova, Y. Shalem,
Y. Yechieli, and Y. Weinstein, 2006. Combined time-series resistivity and geochemical
tracer techniques to examine submarine groundwater discharge at Dor Beach, Israel.
Geophysical Research Letters, 33, L24405, doi:10.1029/2006GL028282.
Burnett, W.C., H. Dulaiova, C. Stringer, and R. Peterson, 2006. Submarine groundwater
discharge: its measurement and influence on the coastal zone. Journal of Coastal Research,
Spec. Issue 39, 35-38.
Peterson R.N., W.C. Burnett, C.R. Glenn, and A.J. Johnson, 2007. A box model to quantify
groundwater discharge along the Kona coast of Hawaii using natural tracers. International
Association of Hydrological Sciences (IAHS) Publ. 312, “A New Focus on GroundwaterSeawater Interactions,” (ed. W. Sanford, C. Langevin, M. Polemio, and P. Povinec),
142-149.
Weinstein, Y., Y. Shalem, W.C. Burnett, P.W. Swarzenski, and B. Herut, 2007. Temporal
variability of Submarine Groundwater Discharge: assessments via radon and seep meters,
the southern Carmel Coast, Israel. International Association of Hydrological Sciences
(IAHS) Publ. 312, “A New Focus on Groundwater-Seawater Interactions,” (ed. W. Sanford,
C. Langevin, M. Polemio, and P. Povinec), 125-133.
Dulaiova, H. and W.C. Burnett, 2007. Evaluation of the flushing rates of Apalachicola Bay,
Florida via natural geochemical tracers. Marine Chemistry, doi: 10.1016/j.marchem.
2007.09.001.
Burnett,W.C., N. Dimova, H. Dulaiova, D. Lane-Smith, B. Parsa, and Z. Szabo, 2007.
Measuring thoron (220Rn) in natural waters. Book chapter in “Environmental
Radiochemical Analysis III” (ed. P. Warwick), Royal Society of Chemistry, RSC Publishing,
Cambridge, 24-37.
Weinstein, Y., W.C. Burnett, P.W. Swarzenski, Y. Shalem, Y. Yechieli, and B. Herut, 2007. Role
of aquifer heterogeneity in fresh groundwater discharge and seawater recycling: an example
from the Carmel coast, Israel. Journal of Geophysical Research - Oceans, 112, C12016, doi:
10.1029/2007JC004112.
Burnett, W.C., R. Peterson, W.S. Moore, and J. de Oliveira, 2008. Radon and radium isotopes as
tracers of submarine groundwater discharge – results from the Ubatuba, Brazil SGD
assessment intercomparison. Estuarine, Coastal and Shelf Science, 76, 501-511.
Charette, M.A., W.S. Moore, and W.C. Burnett, 2008. Uranium- and thorium-series nuclides as
tracers of submarine groundwater discharge. Chapter 5 In: “U-Th Series Nuclides in
Aquatic Systems,” (eds. S. Krishnaswami and J. Kirk Cochran), Elsevier, Amsterdam,
155-191.
Santos, I.R., F. Niencheski; W. Burnett; R. Peterson; J. Chanton, C.F. Andrade; I.B. Milani; A.
Schmidt; and K. Knoeller, 2008. Tracing anthropogenically-driven groundwater discharge
into a coastal lagoon from southern Brazil. Journal of Hydrology, 353(3-4), 275-293, DOI:
210.1016/j.jhydrol.2008.1002.1010.
23
© 2015 DURRIDGE Company Inc.
References and Bibliography
165. Peterson, R.N., W.C. Burnett, M. Taniguchi, J. Chen, I.R. Santos, and S. Misra, 2008.
Determination of transport rates in the Yellow River-Bohai Sea mixing zone via natural
geochemical tracers. Continental Shelf Research, 28 (19), 2700-2707.
167. Povinec, P.P., H. Bokuniewicz, W.C. Burnett, J. Cable, M. Charette, W.S. Moore, J.A.
Oberdorfer, J. de Oliveira, R.N. Peterson, T. Stieglitz, and M. Taniguchi, 2008. Isotope
tracing of submarine groundwater discharge offshore Ubatuba, Brazil: Results of the IAEAUNESCO SGD project. Journal of Environmental Radioactivity, 99, 1596–1610.
Peterson, R.N., W.C Burnett, M. Taniguchi, J. Chen, I.R Santos, and T. Ishitobi, 2008. Radon
and radium isotope assessment of submarine groundwater discharge in the Yellow River
Delta, China. Journal Geophysical Research - Oceans, 113, C09021, doi:
10.1029/2008JC004776.
Burnett W.C., R.N. Peterson, M. Taniguchi, G. Wattayakorn, S. Chanyotha, and F. Siringan,
2009. Importance of groundwater discharge in developing urban centers of Southeast Asia.
In: “From Headwaters to the Ocean: Hydrological Change and Watershed
Management,” (eds. M. Taniguchi, Y. Fukushima, W.C. Burnett, M. Haigh and Y.
Umezawa), Taylor & Francis, London, 289-294.
Burnett, W.C., S. Chanyotha, G. Wattayakorn, M. Taniguchi, Y. Umezawa, and T. Ishitobi, 2009.
Groundwater as a pathway of nutrient contamination in Bangkok, Thailand. Science of the
Total Environment, in press.
Peterson, R.N., W.C. Burnett, C.R. Glenn, and A.G. Johnson, 2009. Quantification of pointsource groundwater discharges from the shoreline of the Big Island, Hawaii. Limnology
and Oceanography, 54, 890-904.
Santos, Isaac R., N. Dimova, R. Peterson, B. Mwashote, J.P. Chanton, and W.C. Burnett, 2009.
Extended time series measurements of submarine groundwater discharge tracers (222Rn and
CH4) at a coastal site in Florida. Marine Chemistry, 113, 137-147.
Santos, I.R., W.C. Burnett, J. Chanton, N. Dimova, R.N. Peterson, 2009. Land or ocean?
Assessing the driving forces of submarine groundwater discharge at coastal site in the Gulf
of Mexico. Journal of Geophysical Research - Oceans, 73, 1325-1339.
Burnett, W.C., R.N. Peterson, I.R. Santos, R.W. Hicks, 2009. Use of automated radon
measurements for rapid assessment of groundwater flow into Florida streams. Journal of
Hydrology, submitted.
24
© 2015 DURRIDGE Company Inc.