1
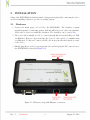
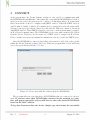
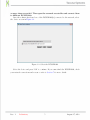
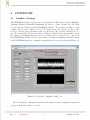
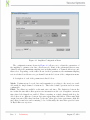
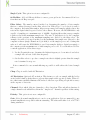
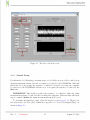
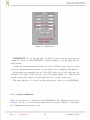
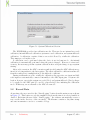
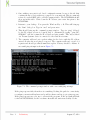
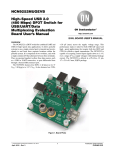
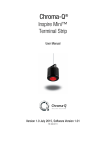
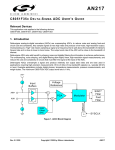
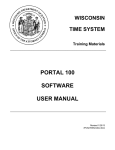
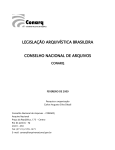
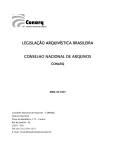
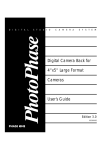
DCSGB1000 Software Manual
1
DESCRIPTION
This manual is a quick reference and guide to use the Tacuna Systems software for the
DCSGB1000. The DCSGB1000 is an all-in-one precision strain gauge/load cell amplification and data collection device. It can collect and transmit data through several types of
communication channels including RS232, USB, or Ethernet (to read more info about the
DCSGB1000 refer to the datasheet).
This software simplifies the communications protocol to the device through a LabVIEW
Virtual Instrument (VI) and provides an easy way to configure the DCSGB1000. It also
provides a method for collecting, recording, storing and visualizing the data. The recorded
data can easily be imported to a third party program for data manipulation.
Rev. 1
Preliminary
1
August 17, 2012
2
INSTALLATION
Setup of the DCSGB1000 is relatively simple. Setup involves physically connecting the device
as well as installing software to produce a working system.
2.1
Hardware
1. Connect the strain gauge or load cell to the DCSGB1000. The datasheet contains
helpful diagrams for connecting quarter, half and full bridge/load cells to the amplifier.
Please refer to Section 8 within the datasheet. The datasheet can be viewed here.
2. The device will eventually be able to connect through RS-232 via the DB9 port, USB
and Ethernet. However, at present time, the device is only capable of communicating
over Ethernet. To this end, connect a RJ45 cable from your network’s switch or router
to the device.
3. Finally, plug the provided power supply into the wall and plug the DC connector in to
the DCSGB1000 as shown in (Figure 2.1)
Figure 2.1: Hardware setup with Ethernet connection
Rev. 1
Preliminary
2
August 17, 2012
2.2
Software
Tacuna Systems’ data collection, storage and visualization software is based on the LabVIEW
software suite developed by National Instruments. Although a full LabVIEW installation is
not required to run the Tacuna Systems software, the LabVIEW 2011 runtime environment
is required. The LabVIEW run-time environment can be downloaded from National Instruments’ website free of charge. Follow the links below to download the run time environment.
• LabVIEW 2011 Run-Time Environment download for Windows Server 2008, XP, Vista
and 7 (32-bit): Click here.
Install the 32-bit runtime environment for both 32 and 64-bit operating systems. The
Tacuna Systems software will only run if the 32-bit version is installed.
The Tacuna Systems software consists of two files. The first is the .exe file which is the
main program that is ran to launch the software. The second file is a .dll file which contains
libraries necessary for the executable to run. It is necessary for both the .dll and the .exe
files to be in the same directory on your hard drive.
Double click on the .exe file to launch the Tacuna Systems software. Software and
hardware installation is now complete. Please refer to the instructions outlined in the configuration section to set up the software.
Rev. 1
Preliminary
3
August 17, 2012
3
CONNECT
At the present time, the Tacuna Systems’ software is only capable of communicating with
the DCSGB100 through Ethernet. After physically connecting the DCSGB1000 as described
in the previous section, the next step is to connect to it through software. It is important
that your network’s router be configured with DHCP enabled. When the DHCP server is
enabled (this is default on almost all consumer grade routers), the server will assign an IP
address to any new device that is connected to the network. This is in contrast to a network
with DHCP disabled. When DHCP is disabled, each device on the network must be assigned
an IP address by manual entry. The DCSGB1000 is not set up with a standard IP address
from the factory. Therefore, it is necessary for a DHCP server to assign it an IP address.
Please consult your router’s user manual for instructions on how to enable the DHCP server.
Once the DCSGB1000 is connected physically to the network, double click on the .exe file
within the Tacuna Systems’ software directory. When the program first loads it will bring
you to the screen shown in Figure 3.1 below:
Figure 3.1: Please wait while the software finds the DCSGB1000
The program will scan your network for all DCSGB100s that are connected to the network. If you have more than DCSGB1000 connected to the network at a time,
they will appear separately and you will have to select the desired DCSGB1000
based on the MAC address.
To log data from more than one device, simply copy and rename the executable
Rev. 1
Preliminary
4
August 17, 2012
as many times as needed. Then open the renamed executables and connect them
to different DCSGB100s.
Once the software has found one of the DCSGB1000(s) connected to the network, select
the device as seen in Figure 3.2.
Figure 3.2: Select the DCSGB1000
Select the device and press ”Ok” to continue. If you cannot find the DCSGB1000, check
your network connections and rescan or refer to Section 7 for more details
Rev. 1
Preliminary
5
August 17, 2012
4
CONFIGURE
4.1
Amplifier Settings
The DCSGB1000 works by reading a microvolt signal from a Wheatstone circuit, amplifying,
digitizing, filtering, and finally transmitting the data to a client. In this case, the client
is a PC with the Tacuna Systems DCSGB1000 software. The software is setup to easily
configure and view the output of a load cell. Strain gauge data can also be viewed and
recorded, but the gauge parameters such as gauge factor and capacity will likely not be
used. For strain gauge use, the user will record the raw digitized data and manually convert
the output to meaningful units (see Section 6). This section describes how to control how
the DCSGB1000 performs each one of those tasks. To change the amplifier and filter settings
of the DCSGB1000 enter the configuration menu from the home screen shown in Figure 4.1.
Figure 4.1: Select the ”Amplifier Config” box
After selecting the configuration menu from the main screen, the configuration menu will
pop up. It is shown in Figure 4.1 below.
Rev. 1
Preliminary
6
August 17, 2012
Figure 4.2: Amplifier Configuration Menu
The configuration menu, shown in Figure 4.2 allows you to adjust the parameters of
the amplifier to optimize your data collection needs. Many of the parameters that are user
definable affect the maximum sampling rate including number of channels, filter type and
filter select. Depending on the values chosen for these parameters, the maximum sampling
rate is calculated and shown on a per channel basis in the bottom of the configuration menu.
A description of each of the parameters is listed below:
Mode: Continuous mode reads data and transmits it according to the user’s two available methods: single channel or burst mode. This is the default operation and is not user
configurable.
Filter: Two filters are available on the unit, sinc3 and sinc4 . The distinction between the
two is that the sinc4 filter offers greater noise attenuation at the cost of lengthier conversion
time when both channels are enabled. When converting on a single channel with chop disabled, there is no difference between data rates when using either filter. When using high
output data rates (FS values less than 5), the sinc4 filter gives better performance than the
sinc3 filter for rms noise and no missing codes. Additionally, the sinc4 filter provides better
50 Hz/60 Hz noise rejection.
Rev. 1
Preliminary
7
August 17, 2012
Single Cycle: This option is not user configurable.
60 Hz filter: Add a 60 Hz notch filter to remove power grid noise. Recommended in locations that use 60 Hz power grid.
Filter Select: The number entered in this box determines the number of data samples
that are combined/averaged in the filter selected in “Filter Type” box before it is sent to
the computer. Increasing this number helps average many data samples which reduces the
noise in the digital values reported back to the software. However, the DCSGB1000 is only
capable of sampling at a maximum rate of 4800Hz. Applying filters that average samples
together reduces this maximum sample rate. The rate of data that is fed to the computer
software is the quotient of the maximum sampling rate divided by the filter select. For
example, if a value of 8 is typed in this box, the maximum data sample rate delivered to the
computer software (single channel mode) is 4800/8 or 600 samples per second. Setting this
value at 1 will cause the DCSGB1000 to send data samples (with no digital averaging) to
the computer at the maximum rate of 4800 samples per second. To set the filter select for
a custom application, follow these steps:
1. Per the Nyquist theorem, determine the highest frequency to be monitored and select
a sample rate at least double that frequency.
2. Set the filter select to produce a sample rate that is slightly greater than the sample
rate determined is step one.
It is recommended to use as much filtering as possible to still achieve the desired sample
rate.
Chop: Chop is enabled with AC Excitation.
AC Excitation: Optional AC excitation. This feature records one sample with the bridge
excited with default polarity then records another sample with opposite polarity. When active, this feature virtually eliminates DC-induced offset error providing exceptional accuracy
at the expense of data rate.
Channel: Select which of the two channels to collect data from. This only affects burst mode
- single channel reads will still read from the ”‘single read”’ channel regardless of this setting.
Polarity: This option is not user configurable.
Gain: Select how much amplification to use for your application. It is recommended to use
as much amplification as possible without saturating. The values will either be 0 or 16777215
during saturation.
Rev. 1
Preliminary
8
August 17, 2012
Data Rate: The specified rate for collection of data. The maximum is determined by the
filters selected.
4.2
Cell Parameters
Before collecting data with a load cell, enter the parameters for the software to scale the
data correctly. Figure 4.3.
Figure 4.3: Enter the load cell parameters.
Rev. 1
Preliminary
9
August 17, 2012
5
COLLECT DATA
After the amplifier is configured properly and the load cell parameters have been specified
you can now start collecting data. First you need to set the ”Read Control” as shown in
Figure 5.1.
Burst Read: Continuous collection of data at the data rate specified by the amplifier
configuration.
Single Read/Read Once: Collects one sample of data on the specified channel.
5.1
Calibrate
With the load cell or strain gauge in an unloaded state, the software must be calibrated so
it reads a correct value of 0 lbs. for the unloaded state. There are two methods to calibrate
the software.
If the application allows the load cell or strain gauge to be in an unloaded state each time
the computer connects to the DCSGB1000, refer to Section 5.1.1. If the application does
not allow the load cell or strain gauge to be in an unloaded state each time the computer
connects to the DCSGB1000, refer to Section 5.1.2.
5.1.1
Automatic Taring
With the load cell or strain gauge in an unloaded state, the program must can be configured
to return 0 lbs for this state. To do this, after collecting a few samples of data and when
strain measurement system is in an unloaded state, select the “Tare” button (shown in Figure
5.1) to set the reference offset to zero.
Rev. 1
Preliminary
10
August 17, 2012
Figure 5.1: The data collection screen
5.1.2
Manual Taring
Use this method of calibrating your strain gauge or load cell if you are not able to unload your
strain measurement system each and every time you connect to the DCSGB1000. Although
this method does not require the system to be unloaded each and every time the computer
is connected to the DCSGB1000 calibrate it, it does require the system to be unloaded the
first time.
IMPORTANT: This method requires the system to be calibrated while the strain
measurement system to be unloaded the very first (and only) time. Make sure this calibration
step is completed before the strain measurement system is loaded.
To determine the initial tare value, follow the steps above in Section 5.1.1. Then record
the value in the cell “Tare (lbs)” within the respective box ”Load Cell Output Ch(x)”, as
shown in Figure 5.2.
Rev. 1
Preliminary
11
August 17, 2012
Figure 5.2: Manual tare
IMPORTANT: Do not lose this value. It will be required each and every time the
computer is connected to the DCSGB1000 to calibrate software to correctly display the load
on the system.
Connect the strain measurement system and load it. With the steps described in this
section, the strain measurement system can stay in this loaded configuration indefinitely.
In the main screen, manually type the “Tare (lbs)” value you recorded earlier into the
cell named ”Tare (lbs)” in the respective ”Load Cell Output Ch(x)” box. This step will
properly calibrate the software so it will display the load correctly on the screen.
This value will have to be entered each time the software connects to the DCSGB1000.
5.1.3
System Calibration
There are a few methods of calibration for the DCSGB1000. The calibration menu (as seen
in Figure 5.3) can be accessed from the main screen by selecting ”‘Calibrate”, found under
the ”Configuration and Status” section.
Rev. 1
Preliminary
12
August 17, 2012
Figure 5.3: System Calibration Selection
The DCSGB1000 provides four calibration modes. These modes are internal zero-scale
calibration, internal full-scale calibration, system zero-scale calibration, and system full-scale
calibration. A calibration consists of first a zero-scale followed by a full-scale calibration.
They must proceed in this order.
A calibration can be performed when the device is not in burst mode. An internal
calibration is automatically performed when the gain is changed. However, for increased
accuracy, the user may perform a system calibration after each gain change or upon system
startup.
After each conversion, the ADC conversion result is scaled using the ADC calibration registers before being written to the data register. The offset calibration coefficient is subtracted
from the result prior to multiplication by the full-scale coefficient.
During an internal zero-scale or full-scale calibration, the respective zero input and fullscale input are automatically connected internally to the ADC input pins. A system calibration, however, expects the system zero-scale (VE −) and system full-scale (VE +) voltages
to be applied to the ADC pins (S− and S+ respectively) before initiating the calibration
mode. In this way, errors external to the ADC are removed.
5.2
Record Data
At any time, the user can select the ”Start Logging” button from the main screen as shown
in Figure 5.1. This button records the amplifier data from the time it is selected until it is
disabled. Each time the user clicks ”‘Start Logging,”’ the software automatically creates a
new .csv file in the directory of the executable. The filename contains a date/time stamp
and auto increments so as not to overwrite old logs.
Rev. 1
Preliminary
13
August 17, 2012
6
OUTPUT CODING
To use the software with a strain gauge application, the user will record the raw digitized
values then convert these values to meaningful units.
The raw data from the DCSGB1000 is the result of the 24 bit analog to digital converter.
This digital number depends on excitation voltage, resistance of the Wheatstone bridge, and
amplification. This section will explain the relationships such that the user can calculate the
output for strain gauge applications.
The DCSGB1000 relates the input voltage to a digital number as:
Vin × Gain
23
+1
Data Out = 2 ×
Vref
(1)
This relationship allows the unit to output values for positive and negative relative inputs.
For example, with the inputs shorted:
23
Data Out = 2 ×
0×1
+1
5
= 8388608
(2)
the output is at half of the full scale output of 224 or 16777216.
With an input of +(Vref /2), the output of the amplifier is at full scale:
23
Data Out = 2 ×
2.5 × 1
+1
5
= 16777216
(3)
Obviously, to convert this output value to a signed number (centered at 0), simply subtract 8388608 from the output.
7
TROUBLESHOOTING
Cannot find the DCSGB1000 after scanning for devices
• Ensure that all cables are properly connected and the DCSGB1000 is powered.
• Verify that network routers and hubs are working properly and that any firewalls are
not interfering with communication. Pinging the device is a good way to determine
whether your network is configured properly to allow the computer to talk to the
device. Follow the steps below to ping the router.
1. Login to your router’s configuration menu. This is done by opening up a web
browser and typing in the address bar the IP address of your router. Typically,
the IP address of the router is 192.168.0.1.
Rev. 1
Preliminary
14
August 17, 2012
2. Once within your router’s web based configuration menu, browse to the tab that
contains the list of devices that are connected to your network. This is commonly
referred to as the DHCP table or LAN Computers table. The DCSGB1000 should
show up in this table. Write down the IP address your router has given to the
DCSGB1000.
3. Return to your desktop. Now press the Windows Key + R. This will bring up
the “Run” dialog box. Type in “cmd” and press enter.
4. This should bring up the command prompt window. Type in “ping” followed
by the IP address you wrote down in Step 2. Alternatively, typing ”‘ping DCSGB1000”’ will also return the IP address and ping results. This only works if
one Tacuna Systems device is connected to the network at a time.
5. The computer will send out a packet asking for the device with the IP address
entered in after the word ping to respond. The computer will send a total of 4
requests and should get almost immediate replies. Latency should be 100ms. A
successful ping attempt is shown in Figure 7.1.
Figure 7.1: The command prompt window with a successful ping attempt
If the ping response fails, then there is something blocking the path for connectivity,
reconfigure your network hardware and possibly software and try to get a ping response.
If the ping response succeeds, try to rescan in the program. If the program still fails
to find the DCSGB1000, check for software firewalls and anti virus security blocks.
Rev. 1
Preliminary
15
August 17, 2012
8
NOTES
Tacuna Systems and the Tacuna Systems logo are trademarks of Tacuna Systems LLC. All other trademarks are the property
of their respective owners. Tacuna Systems reserves the right to make changes or discontinue without notice to any product,
documentation and/or services at any time. Parameters and information provided by and through Tacuna Systems can vary in
different applications and actual performance may vary over time. All parameters, including ”typicals” must be validated for
each customer application by customer’s technical experts. No representation or warranty is given and no liability is assumed
by Tacuna Systems with respect to the accuracy or use of such information, or infringement of patents or other intellectual
property rights arising from such use or otherwise. Tacuna Systems assumes no liability for applications assistance or customer
product design. Customers are responsible for their products and applications using Tacuna systems products or products
sold by Tacuna systems. No license is granted by implication or otherwise under any patent or patent rights, copyrights, or
intellectual property rights of Tacuna Systems. Tacuna Systems products are not designed, intended, or authorized for use in
medical applications or other applications intended to support or sustain life, or for any other application in which the failure
of the Tacuna Systems product could create a situation where personal injury or death may occur. Buyers represent that they
have all necessary expertise in the safety and regulatory ramifications of their applications, and acknowledge and agree that
they are solely responsible for all legal, regulatory and safety related requirements concerning their products and any use of
Tacuna Systems products in such safety critical applications, notwithstanding any applications related information or support
that may be provided by Tacuna Systems. Buyer shall indemnify and hold Tacuna Systems and its owners, officers, employees,
subsidiaries, affiliates, and distributors harmless against all claims, costs, damages, and expenses, and attorney fees arising
out of, directly or indirectly, any claim of personal injury or death associated with such unintended or unauthorized use, even
if such claim alleges that Tacuna Systems was negligent regarding the design or manufacture of the part. Tacuna Systems
products are neither designed nor intended for use in military/aerospace applications or environments. Buyers acknowledge
and agree that any such use of Tacuna Systems products is solely at the Buyer’s risk, and that they are solely responsible
for compliance with all legal and regulatory requirements in connection with such use. Tacuna Systems products are neither
designed nor intended for use in automotive applications or environments. Buyers acknowledge and agree that any such use of
Tacuna Systems products is solely at the Buyer’s risk, and that they are solely responsible for compliance with all requirements
in connection with such use.
Rev. 1
Preliminary
16
August 17, 2012