1
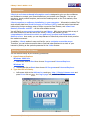
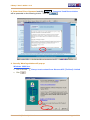
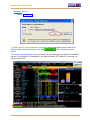
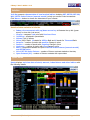
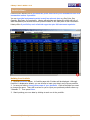
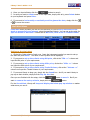
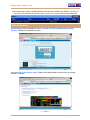
User's Guide v. 2.0 for further information please contact Bisnews AFE (Thailand) Ltd. 17th Fl. U Chu Liang Building 968 Rama IV Rd. Bangkok 10500 Tel: 0 2637 5555 Fax: 0 2637 5679 Email: [email protected] ©2006 Bisnews AFE (Thailand) Ltd. All Rights Reserved. Liberty-i User's Guide v. 2.0 Content Introduction …………………………………………………………………………… 3 Getting Started with Liberty ………………………………………………………… 3 Info Bar …………………………………………………………………………………. 6 Quote Menu ……………………………………………………………………………. 6 Warrant Menu ………………………………………………………………………… 9 Index Futures Menu …………………………………………………………………. 10 Multiple View ………………………………………………………………………….. 11 Trade Log Menu ……………………………………………………………………… 12 3Bid/3Offer Menu …………………………………………………………………… 13 Ranking Menu ……………………………………………………………………….. 14 Chart Menu …………………………………………………………………………… 15 Ticker Menu ………………………………………………………………………….. 21 News Menu …………………………………………………………………………… 22 Indices Menu …………………………………………………………………………. 24 Forex Menu …………………………………………………………………………… 25 Stock Search Menu …………………………………………………………………. 26 My Favorite Menu …………………………………………………………………… 29 Portfolio Menu ……………………………………………………………………….. 30 Limit Alert Menu …………………………………………………………………..... 32 Online Help Menu …………………………………………………………………… 33 Bisnews AFE (Thailand) Limited Page 2 of 33 Liberty-i User's Guide v. 2.0 Introduction Liberty is an Internet-based information service designed to give you the confidence and freedom to conduct your financial affairs as you conduct your lifestyles. You can go anywhere, check portfolio anytime, and monitor breaking news on the Thai markets, even when traveling. Liberty requires no software installation in your computer. Information includes Thai stock market data from Stock Exchange of Thailand (SET); local and major international indices plus foreign exchange rates of major currencies from Reuters; and news from Reuters, Bisnews and SET -- all the most reliable sources. You will find it so easy and convenient to use Liberty. With just a mouse click at any of the menu buttons on the left side of the screen, Liberty will present you the comprehensive information which are gathered, grouped and illustrated with distinct colors. As a result, you can keep abreast of news and prices while closely monitor the market movement. In addition, Liberty makes it easy and fast for you to navigate across the menu. Therefore, you can retrieve warrant data or Sectoral index pertinent to a stock of your interest by clicking at the symbols presented in the Links window. Getting Started with Liberty You can access Liberty by the following procedures. 1. Open Internet Explorer Windows 2000 User ª Left-mouse click at Start then choose Program and Internet Explorer Windows XP ª Left-mouse click at Start then choose All Programs and Internet Explorer 2. Type the URL of Liberty ª Left-mouse click at the Address box and type http://liberty.bisnews.com and press Enter click at , the Login page will present as follows: Bisnews AFE (Thailand) Limited Page 3 of 33 Liberty-i User's Guide v. 2.0 3. Enter User ID และ Password and click . Terms and Conditions window . will be presented as the following picture. Then click 4. Security Warning window will pop up. Windows 2000 User ª Click to choose ª Click Always trust content from Bisnews AFE (Thailand) Limited . Bisnews AFE (Thailand) Limited Page 4 of 33 Liberty-i User's Guide v. 2.0 Windows XP User ª Click at . 5. When Liberty screen appears, you need to ensure that that the color of the Info Online button turns into green color like service. . Then Liberty is at your To retrieve real-time data, move your mouse to the symbol box and input the instrument symbol of your interest. For example, if you want to retrieve PTT Public Co., Ltd data, you need to input "PTT". Bisnews AFE (Thailand) Limited Page 5 of 33 Liberty-i User's Guide v. 2.0 Info Bar Info Bar presents relevant data of local market indices including SET, SET50, SET100, MAI, SET50 Index Futures (nearest month) to help you monitor index movements. Click More>> button to choose the index data of your interest. Details of data available in Info Bar ª ª ª ª ª ª ª ª ª ª ª Index price movement with up/down arrow key to illustrate the up tick (green arrow) or down tick (red arrow) Change - compares Last price with Previous Close %Change - displayed in parenthesis Volume (Vol) in shares Value (Val) in Baht. M stands for Million Baht and K stands for Thousand Baht Advance – number of stocks with positive Change in price Decline – number of stocks with negative Change in price Unchange – number of stocks with zero Change in price Basis – comparison between the price of SET50 Index Futures (nearest month) and SET50 Index Vol of SET 50 Index Futures - number of futures contracts traded on that day Open Interest (OI) - number of futures contracts with open status Quote Menu Quote displays real-time data of stock, warrant, index futures and other indices with the following details: Bisnews AFE (Thailand) Limited Page 6 of 33 Liberty-i User's Guide v. 2.0 ª Box 1 – Symbol box allows you to input an instrument symbol of your interest such as then press Enter. Liberty will present the full name of Seamico Securities PLC. Box 2 – Details box displays both real-time price data and end-of-day operating data e.g. P/E, P/BV, DPS and Yield, etc. ª Color Description Field Last, Change, %Chg ลูกศร ↑ หรือ ↓ Color green Description Last > Previous Close red yellow green red yellow Last Last Last Last Last < = > < = Previous Previous Previous Previous Previous Close Close Tick (Last) Tick (Last) Tick (Last) ª Box 3 – 3Bid/3Offer displays real-time 3 best bid and 3 best offer prices and volumes of a particular instrument. Liberty presents data with the following color codes. Strength Bar Indicator illustrates % Bid and % Offer of such instrument in realtime. Color green red Description Bid data Offer data ª Box 4 – Trade Log presents all executed transactions of such instrument in real-time with the following distinctive color code of Buy (B) or Sell (S). Liberty also presents Strength Bar Indicator to illustrate % Buy and % Sell of such instrument being traded in real-time. Color Description orange Buy data purple Sell data Box 5 - Volume at Price illustrates all executed transactions at each price in bar chart with distinct colors of buy and sell proportion. You can go to Trade Log menu to view the bigger chart. ª Color Description orange Buy data purple Sell Data ª Box 6 - 2 windows of Intra-day Chart or Tic Chart that can be toggled to display today's real-time chart data of a particular instrument and Thai market indices such as stock, warrant, SET index, SET50 index, SET100 index, or MAI. You can click the button to toggle the display. The red line represents Previous Close price so you can see if today's prices are above or below yesterday Previous Close line. ª Box 7 - Links box displays other symbols relevant to the main instrument such as warrant, preferred stock, foreign board, Sector, Industry. You can click each symbol to view the data. ª Box 8 – Streaming real-time news from Reuters, Bisnews and SET. Bisnews AFE (Thailand) Limited Page 7 of 33 Liberty-i User's Guide v. 2.0 The following picture shows how Liberty navigates you from one symbol to another. In case you input a symbol of SET index in Box1, Liberty will display, in the lower-right box, real-time data of all Industries. But if you input the Sectoral symbol, Liberty will display real-time data of all stocks listed under such sector. And if you click at any symbol in this box, Liberty will display a full data of it. Bisnews AFE (Thailand) Limited Page 8 of 33 Liberty-i User's Guide v. 2.0 Warrant Menu Warrant page presents real-time price and analytic data of all warrants in the market. Warrant symbols are displayed in alphabetical order (A to Z). You can click at the warrant symbol then Liberty will navigate you to the Quote page Data Description ª ª ª ª ª ª ª ª ª ª ª ª ª Last - latest price Change - Last compared with Previous Close %Chg All in Premium Black-Scholes Gearing Delta Volatility Expiry Date Previous Close - yesterday's closing price Volume trading volume in share Value - trading value in Baht Time - time that such transaction occurs Bisnews AFE (Thailand) Limited Page 9 of 33 Liberty-i User's Guide v. 2.0 Index Futures Menu Index Futures window presents real-time data of all Index Futures series traded in the market. Data Description Field Fair Value Fair Basis Basis Premium Implied Rate Fund Rate Div Yld Days O/I Vol Ch (Volume Change) Description Cash price plus the net cost of carrying such futures contract until the contract's expiry date. (The calculated figures is the projected price of such futures compared with risk-free cost) If Fair Value > Last, such futures contract is an interesting one. Fair Value minus SET50 Index Current price of Index Futures minus SET50 Index Current price of Index Futures minus Fair Value If Current price of Index Futures < Fair Value, such futures contract is an interesting one. Interest rate or cost of carrying such futures contract, whether the investment cost is high or low Interpolated yield curve from Thai BMA Dividend Yield of SET50 Index Days to delivery - Number of days from today until expiration date. Days include holidays and weekends. Open Interest - Number of futures contracts with open status Volume Change - Today's Volume compared with yesterday's volume Bisnews AFE (Thailand) Limited Page 10 of 33 Liberty-i User's Guide v. 2.0 Multiple View Menu You can view data of 2 instruments simultaneously by typing symbol of stock, warrant, index futures in the symbol box and click Enter e.g. PTT and S50M06. Simply click the More>> button to view further details. Bisnews AFE (Thailand) Limited Page 11 of 33 Liberty-i User's Guide v. 2.0 Trade Log Menu Trade Log menu displays all executed transactions of a particular instrument throughout the day both in numeric and graphical manner. Even though Liberty automatically calculates real-time Volume Weighted Average Price (VWAP), you can specify the time period of your interest for the calculation. Data Description ª Box 1 – Displays all executed transactions and traded volume of an instrument throughout the day in the following details. Field Column Column Column Column Column 1 2 3 4 5 : : : : : Time Lot Price B or S Change Description Time that such transaction occurs Volume of instrument being traded (1 Lot = 100 Shares) Price at which instrument is traded Transaction type. B = Buy and S = Sell Change in Price (compare Price with Previous Close) ª Box 2 – Volume at Price illustrated the traded transactions at each price in bar chart with distinct colors. The number at the top of each chart represents the traded volume (Lot) at each price. Color Description orange Buy transaction purple Sell transaction ª Box 3 – No. Trade displays number of transactions such instrument being traded during the day. Bisnews AFE (Thailand) Limited Page 12 of 33 Liberty-i User's Guide v. 2.0 Box 4 – Buy/Sell Strength Bar illustrates the real-time percentage (%) of traded volume (whether it comes from Buy or Sell side) with distinct colors. ª Color Description orange Buy volume purple Sell volume Box 5 – VWAP (Volume-Weighted Average Price) presents real-time average price, weighted by total volume of an instrument. You can specify in the From: and To: boxes the time period of the day that you want Liberty to calculate the average price. If you ª want to use the default time, simply click the button. 3 Bid/3 Offer Menu With 3Bid/3Offer menu, you can simultaneously monitor the 3 best bid and 3 best offer prices and quantity including Bid/Offer Strength Indicator of 6 instruments. Liberty also presents 6 latest executed transactions plus Buy (B) and Sell (S) so you know what is happening with each instrument. The 3Bid/3Offer menu supports the display of stock, warrant and index futures. Color Description Color green red Description Bid data Offer data Bisnews AFE (Thailand) Limited Page 13 of 33 Liberty-i User's Guide v. 2.0 Ranking Menu Updated every minute, Ranking menu presents Top-20 ranking of stocks, warrants, sector and industry in SET and MAI according to the selected criteria in the combo box. You can choose your preferred criteria using a mouse click at the following part. Once the ranking result appears, you can click at the instrument symbol of your interest for further information relevant to such symbol. Liberty will navigate you to the Quote page. Criteria Description Criteria % Gain % Loss Net Gain Net Loss Volume Most Active %Fluctuation Description Highest % change in price, calculated from the comparison between Last price and Previous Close Lowest % change in price, calculated from the comparison between Last price and Previous Close Highest change in price, calculated from the comparison between Last price and Previous Close Lowest change in price, calculated from the comparison between Last price and Previous Close Highest traded Volume Highest traded Value Highest difference between High and Low price Bisnews AFE (Thailand) Limited Page 14 of 33 Liberty-i User's Guide v. 2.0 Chart Menu Chart menu displays graphical data with histories and 16 major technical analysis tools and Trend Line. You can click at the tool you like. Chart will be changed according to your selection. Icon in Tool Bar Usage Description Zoom-in for you to get into more details for chart during a certain time period Cross Hair facilitates you to easily glance the price and technical analysis results at a certain point of chart Color Palette for you to change the colors of technical analysis tools Chart Interval allows you to specify your preferred time period for the display e.g. tic, 5 minutes, 15 minutes, 3 months, 2 years Setting for you to select the colors of background, foreground, grid line, highlight box of your preference How to Use Chart You can retrieve the chart by inputting the symbol of stock, warrant, index futures, sectoral index, industry and main indices (SET, SET50, SET100, MAI) in the symbol box . Liberty will display a default Daily Candlestick chart as well as traded Volume with the letter "D" presented at the right-bottom corner. Bisnews AFE (Thailand) Limited Page 15 of 33 Liberty-i User's Guide v. 2.0 You can maximize the Chart window by clicking at the box at the top-right corner. Toolbar supports the following items and actions. 1. Technical Analysis Tools 2. Changing Chart Types 3. Drawing Trend Lines You can print out the chart by clicking the button. Changing Chart Colors You can change the colors of chart by clicking at Setting menu will appear. Bisnews AFE (Thailand) Limited (Setting) button. The following Page 16 of 33 Liberty-i User's Guide v. 2.0 Setting Menu Description Menu Base Time Series Candle Up Color Candle Down Color Description Colors of Candlestick chart Color of Candlestick in case of up tick Color of Candlestick in case of down tick In case you want to change the Volume color, just click the the following sub-menu will be displayed. button and choose Volume, Click the color box until the red frame appears, then click to choose the color you want from the color palette, and click OK. If you tick the Default box, the color you opt will become the default color of Volume every time you retrieve the chart. The other way to change the Volume color is to click the following VOL sub-menu will appear. icon in the toolbar. The Then click the Color box until the red frame appear, choose the color you want from the color palette, and click OK. You can also choose "Save to user default" so the Volume is displayed with the color you choose every time it is retrieved. You can add Simple Moving Average (SMA) line in Volume window by clicking the Draw SMA box and input your preferred SMA period (day) as follows: Also, if you need to change the color of SMA line, click the color the same as you do for Volume. Bisnews AFE (Thailand) Limited icon and choose the SMA Page 17 of 33 Liberty-i User's Guide v. 2.0 Adding Technical Analysis Tools You can browse the Technical Analysis Tools list by clicking the button; the dropdown list of technical analysis tools will be displayed. If you want to add an analysis tool into your chart window, you can choose it from the list. Liberty displays upto 3 technical analysis tools excluding Price and Volume charts in one page. If you need to change the parameter of a particular analysis, simply click at the name of analysis tool in the chart area until the blue highlight is displayed (the orange frame). The parameter box at the top of the chart window will appear for you to input the parameter you prefer. In case you want to change the color of such analysis, just click the and choose the color you want. Bisnews AFE (Thailand) Limited button Page 18 of 33 Liberty-i User's Guide v. 2.0 Deleting Technical Analysis Tools You can delete a technical analysis tool displayed in the chart area by clicking the name of such tool until the blue highlight appears, then click the delete all technical analysis tools you previously chose, click the icon. If you want to icon. Changing Chart Pattern Chart Mode Clicking the Chart Mode button, you can change the display of chart into your preferred one -- Line Chart, Bar Chart or Candlestick Chart Chart Interval Allows you to retrieve historical chart of various time period. Just click to choose the period of your preference. In case you choose to display Daily chart, there will be "D" displayed at the right-bottom corner of the window. "W" represents Weekly chart, "M" represents Monthly chart. Tic, 5-minute or 15-minute will be displayed if you choose such interval. Show/ Hide Option Allows you to display or remove the display of Volume, Time axis (X-Axis), Price axis (Y-Axis), or Grid Line. Cross Hair Option Helps you to easily glance the price, volume and other technical analysis figures of the chart. Price figures start from "O" (Open), "H" (High), "L" (Low), "C" (Close) and "V" (Volume). You can choose the type of Cross Hair you like or choose "Off" to hide it. While moving the Cross Hair along the chart area, if you want to freeze the Cross Hair, simply click your mouse at the certain point. And click your mouse again to move the Cross Hair. Zoom In You can click the Zoom In button to see more details of chart within a certain time period of your interest. Move your mouse to the starting point of time, left-mouse click and hold it, drag the mouse to the ending point, then release the mouse click. Zoom Out Once zooming in the chart, you can squeeze the time period to display chart with further histories by clicking the Zoom Out button. Bisnews AFE (Thailand) Limited Page 19 of 33 Liberty-i User's Guide v. 2.0 Drag Chart Instead of using scroll bar, you can move the whole chart by clicking the Drag Chart button to change the mouse cursor from arrow key to a hand. Then click at the chart area, hold your mouse and drag the chart to the certain time period you want to views. If you want to exit this mode, simply click the Drag Chart button again. Help Menu Online help for Chart Menu Trendlines Trendline Button: Draw a trend line by clicking the Trendline button. Then place the mouse at your preferred starting point, left-mouse click, hold it and drag the mouse to the ending point and release it. Trendline will be drawn. Horizontal Line Button: Draw a horizontal line by clicking the Horizontal Line button. Then place the mouse at your preferred starting point, left-mouse click, hold it and drag the mouse to the ending point and release it. Horizontal Line will be drawn. Vertical Line Button: Draw a vertical line by clicking the Channel Line button. Then place the mouse at your preferred starting point, left-mouse click, hold and drag the mouse to the ending point and release it. Vertical Line will be drawn. Channel Line Button: Draw a channel line by clicking the Vertical Line button. Then place the mouse at your preferred starting point, left-mouse click, hold and drag the mouse to the ending point and release it. The lower line of the Channel will be drawn. Move your mouse to the other point you want to draw a channel (parallel) line, then leftmouse click and release it. Channel line will be drawn. Fibonacci Arc Button: Draw Fibonacci Arc Trendline by clicking the Fibonacci Arc button. Then click your mouse at the starting point, drag the mouse to your preferred point to specify the width of semi-circle you want to draw, and release the mouse. If you drag the mouse below the angle of 180 degrees, the Fibonacci Arc will be drawn below the main chart. Upward Gann Angles Button: Draw Upward Gann Angles lines by clicking the Upward Gann Angles button. Then click the mouse at your preferred point. Upward Gann Angles lines will be drawn. Downward Gann Angles Button: Draw Downward Gann Angles lines by clicking the Downward Gann Angles button. Then click the mouse at your preferred point. Downward Gann Angles lines will be drawn. Retracement Trendline Button: Draw Retracement trend Line by clicking the Retracement Trendline button. Then click your mouse at the starting point, hold and drag the mouse diagonally to the ending point you want. Retracement trend line will be drawn. Fans Button: Draw Fans lines by clicking the Fans button. Then click your mouse at the starting point, hold and drag the mouse diagonally to the ending point you want. Fans trend line will be drawn. Time Zones Button: Draw Time Zones lines by clicking the Time Zones button. Then click the mouse at your preferred point. Time Zones lines will be drawn. Getting Out of Trend Line Mode or Deleting Trend Lines: Click you mouse and hold it until a rectangular frame appears. Drag you mouse to have this frame cover Bisnews AFE (Thailand) Limited Page 20 of 33 Liberty-i User's Guide v. 2.0 the trend lines you previously draw. Then click the In case you want to delete all trend lines, click the removed. button to delete such trend lines. button. All Trend lines will be Ticker Menu Ticker page displays all executed transactions in SET and MAI in real-time. You can choose the displayed criteria by clicking one of the following buttons. Criteria All (Stock & Warrant) My Favorite (Stock & Warrant) Index Futures Description Display all executed transactions of stocks and warrants in the market Display only execution of stocks and warrants specified in My Favorite menu Display all executed transactions of index futures Sign Color Description Sign ↑ or ↓ key Color green red Bisnews AFE (Thailand) Limited Description Last price > Previous Last price Last price < Previous Last price Page 21 of 33 Liberty-i User's Guide v. 2.0 News Menu News menu presents both Thai and English language news from reliable news sources e.g. Reuters, Bisnews, SET, and Manager. There are 2 news areas for your usage Box 1 is displayed when you click the News button. This news display is updated every minute ª Box 2 is always displayed at the bottom of the screen. In this area, news is presented on a real-time streaming update manner. ª You can choose to view news of your preference by selecting news sources, categories, after each combo box or type the language, or instrument symbol. Simply click at instrument symbol in the then click button. Description of News Sources, News Categories and Languages Sources and Language News Sources All Bisnews Reuters SET Manager Description All sources Bisnews AFE Reuters Stock Exchange of Thailand Manager Bisnews AFE (Thailand) Limited Language Thai and English Thai and English Thai Thai and English Thai Page 22 of 33 Liberty-i User's Guide v. 2.0 Category Category All Announcement Banking Commodities General Marketing Politics Sport Stock Description All categories Announcement from SET Finance and Banking Agricultural, commodities, oil prices, gold General news Marketing news Political news Sport news News relevant to stocks and warrants You can view the news story by clicking at news headline; another window of news story will be displayed. You can also print such news story by clicking the button or choose to close the window by clicking the now offers 7-day news histories. button. Liberty Bisnews AFE (Thailand) Limited Page 23 of 33 Liberty-i User's Guide v. 2.0 Indices Menu Indices menu displays prices of major international and local indices including SET sectoral and industrial ones. You can choose to view a group of indices by clicking the button of your preferences; a list of pertinent indices will be displayed. International indices data will be update on an hourly basis while all local indices are updated in real time. Description of Indices Index SET ALL SET INDUSTRY SET SECTOR WORLD Description SET, SET50, SET100, MAI, all Industries, and all Sectors All Industrial Index of the SET All Sectoral Index of the SET Major World indices In case you want to view further details of each index, you can simply click at such index symbol. Liberty will navigate you to the Quote page. Bisnews AFE (Thailand) Limited Page 24 of 33 Liberty-i User's Guide v. 2.0 Forex Menu Forex menu presents exchange rates of major currencies crossed with Thai Baht with an hourly update. Description on Currencies Currency USD GBP EUR JPY CHF SGD HKD AUD CAD NZD MYR Description US Dollar Pound Sterling Euro Dollar Japanese Yen Swiss Franc Singapore Dollar Hong Kong Dollar Australian Dollar Canadian Dollar New Zealand Dollar Malaysian Ringgit Bisnews AFE (Thailand) Limited Page 25 of 33 Liberty-i User's Guide v. 2.0 Stock Search Menu Stock Search menu facilitates you to search for the instrument both by instrument symbol or instrument name. Stock Search support stocks, warrants, and index futures. The search for instrument symbol of your preference can be done by either of the following ways. 1. Stock Search: search by symbol or company name e.g. PTT, S50, or LAND. 2. Stock Selection: search by financial criteria e.g. P/E, P/BV, EPS, Dividend or Market Capitalization. Once the search result is displayed, you can click at the instrument symbol to see further details in Quote page. Searching by Stock Search Click at folder to start the search Search by Symbol: Click at the Symbol button and type full or a part of button. Liberty will search for and instrument symbol you know then click the display all the symbols that match with your requirement. ª Bisnews AFE (Thailand) Limited Page 26 of 33 Liberty-i User's Guide v. 2.0 Search by Name: Click at the Company Name button and type full or a button. Liberty will search for part of company name you know then click the and display all the symbols and company names that match with your requirement. ª Searching by Stock Selection Click at folder to start the search. Bisnews AFE (Thailand) Limited Page 27 of 33 Liberty-i User's Guide v. 2.0 ª Select Instrument Type: Click at of the box) and choose the instrument type be it Stock or Warrant. (instrument Identify the Search Criteria: Click at and choose the search criteria of your requirement. (criteria box) ª of the Description of Search Criteria Criteria Mkt. Cap. Yield P/E EPS DPS RSI14 52W Hi 52 W Lo %Chg %Fluctuation Volume Description Market Capitalization: the value of a company as measured by the value of its total paid up equity securities at a market price Yield rate (%) Price Earning Ratio Earning Per Share Dividend Per Share Relative Strength Index: 14 days Highest price in the past 52 weeks Lowest price in the past 52 weeks % change in price, comparing Last price with Previous Close % change in price, comparing High and Low prices during the day Traded volume Identify the Comparing Sign: Click at of the sign box) and choose the comparing sign of your requirement. ª Identify the Criteria: Type the figure of your requirement in the complete the financial criteria. ª (comparing box to Then click at the button. Liberty will search for and display all the instrument symbols that match with your criteria. You can click at the symbol of your interest to view its further details in Quote page. Bisnews AFE (Thailand) Limited Page 28 of 33 Liberty-i User's Guide v. 2.0 My Favorite Menu My Favorite menu assists you to closely monitor the price movement and relevant data of 20 instruments of your favorite. You can add, delete, or save those symbols in My Favorite page for your convenience in the next retrieval. Instruments can be stock, warrant, index futures. Adding, Deleting and Saving the Instrument Symbol in My Favorite Page ª Adding Symbol: Type the instrument symbol in the (symbol box) and click the button or press Enter. ª Deleting Symbol: Click at the instrument symbol so such symbol is displayed in the symbol box. Then click the button. ª Saving My Favorite Page: Once you finish adding the symbols you want to monitor, click the button so Liberty can display it on your next retrieval. You can also opt to view the type of relevant data by clicking at the data type as follows: ª Price Data ª Fundamental Data ª Technical Data Bisnews AFE (Thailand) Limited button in front of the Page 29 of 33 Liberty-i User's Guide v. 2.0 Portfolio Menu Portfolio menu assists you to calculate the profit and loss of your investment both as a transaction and as a portfolio. You can type the instrument symbol as well as relevant data e.g. Buy Price, Buy Quantity, Buy Data, % Commission. Liberty will calculate and display the profit and loss of each transaction you did and the whole portfolio based on the Last price of such instrument. Liberty offers 3 portfolios, each of which supports upto 30 instrument symbols. Building Your Portfolio 1. Click the Portfolio button. A Portfolio page with 3 folders will be displayed. Although Portfolio1 is displayed a default, you can choose to input your data in any of these portfolio. 2. In case you want to change the name of your portfolio. Click at the folder you want to change the name. There will be a box for you to input your preferred portfolio name e.g. "Ultraman 7". Then press Enter. 3. Start inputting your own data by clicking at each row in the portfolio. Bisnews AFE (Thailand) Limited Page 30 of 33 Liberty-i User's Guide v. 2.0 Description of Portfolio Field Description Code Instrument symbol e.g. PTT Avail Qty Net available stock or warrant instruments. Calculated from "Buy Qty minus Sell Qty" Buy Qty Number of stock or warrant you buy. 1 Qty equals 1 share. Buy Price Price you bought such stock or warrant % Comm. % commission you pay to brokerage firm when you buy or sell your stock or warrant Buy Date (DD/MM/YYYY) Buying date such as 1/8/2005 (1 August 2005) Investment Cost Total investment for stock or warrant in each transaction Last Price Latest market price Market Value Total value of your invested stock or warrant based on market price at this moment. Calculated from "Avail Qty multiplies by Last Price" Sell Qty Number of stock or warrant you sell. 1 Qty equals 1 share. Sell Price Price you sell such stock or warrant Unrealized P/L Return from an investment in case that you have not sold such stock or warrant. Formula: “ [(Last Price – Buy Price) x Avail Qty] – Buy and Sell commission ” Realized P/L Return from an investment calculated by the price you input in Sell Price. Commission is already taken into this calculation. Total Unrealized P/L Sum of profit and loss in your portfolio, calculated from market price Total Realized P/L Sum of profit and loss in your portfolio, calculated from the price you actually sell your stock or warrant Total P/L Sum of profit and loss in your portfolio, calculated from "Total Unrealized P/L plus Total Realized P/L" Total Port (MV) Market Value of your portfolio, calculated from total number of stocks or warrants available in the portfolio and their market prices Total Commission Total commission you have paid to brokerage firms Holding Cost Cost of total investment of your portfolio, calculated from “ Buy Price multiplies by Avail Qty ” Bisnews AFE (Thailand) Limited Page 31 of 33 Liberty-i User's Guide v. 2.0 4. Once you input all data, click the button to save it. 5. In case you want to delete some of the input data, simply click at it, press Delete button at your keyboard and press Enter. 6. If you want to horizontally or vertically scroll to glance the data, simply click the to move the screen. or Limit Alert Menu Limit Alert menu provides you with the convenience for you to set up the alert for the stock or warrant of your interest, using the specified criteria. You can set up the alert for upto 10 stocks or warrants. Criteria can be Bid Price, Offer Price or Traded Volume. Setting up the Limit Alert 1. Click at the Code column of each row. Input the instrument symbol you want to set up the alert and press Enter. The name of such symbol will be displayed. 2. If you want to set up the criteria using Bid price, click at the "Bid <=" column and input the Bid price of your requirement. 3. If you want to set up the criteria using Offer price, click at the "Offer >=" column and input the Offer price of your requirement. 4. If you want to set up the criteria using Traded Volume, click at the "Volume >=" column and input the Traded Volume of your requirement. 5. If you want Liberty to beep you, simply tick the Sound box. And if you want Liberty to pop up an alert window, simply tick the Pop Up Alert box. Once you are finished with the setup, click the want to remove the set-up criteria, simply click the button to save it. But if you button. For the Sound Alert, Liberty will beep and display the below pop-up window no matter what menu you are at. Bisnews AFE (Thailand) Limited Page 32 of 33 Liberty-i User's Guide v. 2.0 At the same time, Liberty will also display in the Breaker window the details of stock or warrant that matches with the criteria you set up so you can browse them later. Online Help Menu Online Help is always available for you to call up the User's Manual while using Liberty. Details are separated by menu. You only click at the menu name; Liberty will display details of such menu in another window as follows: ----- End----Bisnews AFE (Thailand) Limited Page 33 of 33