1
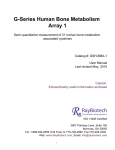
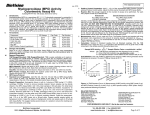
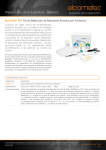
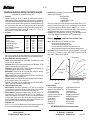
BioVision II. Introduction: Glutathione Reductase (GR, EC 1.8.1.7) catalyzes the NADPH-dependent reduction of oxidized glutathione (GSSG) to reduced glutathione (GSH), which plays an important role in the GSH redox cycle that maintains adequate levels of reduced GSH. A high GSH/GSSG ratio is essential for protection against oxidative stress. BioVision’s Glutathione Reductase Assay Kit is a highly sensitive, simple, direct and HTS-ready colorimetric assay for measuring GR activity in biological samples. In the assay, GR reduces GSSG to GSH, which reacts with 5, 5′Dithiobis (2-nitrobenzoic acid) (DTNB) to generate TNB2- (yellow color, max = 405 nm). The assay can detect 0.1 – 40 mU/ml GR in various samples. Kit Contents: Components GR Assay Buffer 3 % H2O2 Catalase (lyophilized) TNB Standard (lyophilized) DTNB (lyophilized) NADPH-GNERAT™ (lyophilized) GSSG (lyophilized) GR Positive Control (10 mU; lyophilized) III. IV. V. 1. 2. 3. K761-200 Cap Code Part Number 100 ml 1 ml 1 vial 1 vial 1 vial 2 vials 1 vial 1 vial NM Orange Clear Brown Red Blue Yellow Green K761-200-1 K761-200-2 K761-200-3 K761-200-4 K761-200-5 K761-200-6 K761-200-7 K761-200-8 Storage and Handling: Store kit at -20°C, protect from light. Warm Assay Buffer to room temperature before use. Briefly centrifuge vials before opening. Read the entire protocol before performing the assay. Reagent Reconstitution and General Consideration: Catalase: Dissolve lyophilized catalase with 1 ml Assay Buffer. The Catalase solution is stable for 1 week at 4°C and 1 month at -20°C. TNB Standard: Dissolve in 0.5 ml of assay buffer to generate 5 mM TNB Standard. The TNB standard solution is stable for at least 2 months at -20°C. DTNB Solution: Dissolve DTNB with 0.45 ml Assay Buffer, sufficient for 200 assays. The DTNB solution is stable for 2 weeks at 4°C and 1 month at -20°C. NADPH-GNERAT™: Dissolve one vial with 0.22 ml Assay Buffer; sufficient for 100 assays. The solution is stable for 10 hours at 4°C and 2 weeks at -20°C. GSSG: Dissolve GSSG with 1.3 ml Assay Buffer, sufficient for 200 assays. The GSSG solution is stable for 2 weeks at 4°C and 2 months at -20°C. GR Positive Control: Dissolve lyophilized GR into 100 µl Assay Buffer, aliquot into vials, store at -20°C. It is stable for 1 day at 4°C and 1 month at -20°C. Ensure that the Assay Buffer is at room temperature before use. Keep samples, NADPHGNERAT™ solution and GR standard on ice during the assay. Glutathione Reductase Activity Assay: Sample Preparations: Homogenize 0.1 gram tissues, or 1 x 10⁶ Cells, or 0.1 ml Erythrocytes on ice in 4 volumes of cold assay buffer; Centrifuge at 10,000 x g for 15 min at 4°C; Collect the supernatant for assay and store on ice, serum can be tested directly. Store at -80°C. Sample Pretreatment: Samples should be treated to destroy GSH before the assay. Take 100 µl sample, add 5 µl 3% H2O2, mix and incubate at 25°C for 5 min. Then add 5 µl of catalase, mix and incubate at 25°C for another 5 min. Add 2 -50 µl of the pretreated samples into a 96-well plate, bring the volume to 50 µl with Assay Buffer. We suggest testing several doses of your sample to make sure the readings are within the standard curve range. Use 10 µl /well Positive Control (optional) and adjust to 50 µl with Assay Buffer. TNB Standard Curve: Add 0, 2, 4, 6, 8, 10 µl of the TNB Standard into 96-well plate in duplicate to generate 0, 10, 20, 30, 40, 50 nmol/well standard. Bring the final volume to 100 µl with Assay Buffer. BioVision Incorporated 155 S. Milpitas Boulevard, Milpitas, CA 95035 USA 4. Reaction Mix: Mix enough reagents for the number of assays to be performed. For each well, prepare a total 50 µl Reaction Mix: 40 µl GR Assay Buffer 2 µl DTNB solution 2 µl NADPH-GNERAT™ solution 6 µl GSSG solution Add 50 µl of the Reaction Mix to each test samples. Mix well. Measure OD 405 nm at T1 (reading A1). Incubate the reaction at 25°C for 10 min (or incubate longer time if the GR activity is low), protect from light, measure OD 405 nm again at T2 (reading A2). ∆A405 nm = A2 – A1. Note: It is essential to read A1 and A2 in the reaction linear range. It will be more accurate if you read the reaction kinetics, and ensure A1 and A2 in the reaction linear range. 5. Calculation: Plot the TNB standard Curve. Apply the ∆A405nm to the TNB standard curve to get ∆B nmol of TNB (TNB amount generated between T1 and T2 in the reaction wells). GR Activity = Where: Sample Dilution Factor = nmol/min/ml = mU/mL ( ) ∆B is the TNB amount from TNB standard Curve (in nmol). T1 is the time of the first reading (A1) (in min). T2 is the time of the second reading (A2) (in min). V is the pretreated sample volume added into the reaction well (in ml). 0.9 is the sample volume change factor during sample pre-treatment procedure. Unit Definition: One unit is defined as the amount of enzyme that generates 1.0 µmol of TNB per minute at 25°C. The oxidation of 1 mole of NADPH to NADP+ will generate 2 mole TNB finally, therefore, 1 TNB unit equals 0.5 NADP unit. 1.4 GR assay kinetics 3 8 mU 4 mU 1.2 1 0.8 0.6 y = 0.024x + 0.0585 R² = 0.9992 0.4 OD 405 nm (Catalog #K761-200; 200 reactions; Store kit at –20°C) OD 405 nm Glutathione Reductase Activity Colorimetric Assay Kit I. For research use only rev. 4/14 2 mU 2 1 mU 1 0.5 mU 0.25 mU 0.063 mU 0.016 mU 0.2 0 0 0 10 20 30 40 50 nmoles TNB RELATED PRODUCTS: Colorimetric Glutathione Detection Kit Glutathione Kit (GSH, GSSG and Total) GST Colorimetric Assay Kit Acid Phosphatase Assay Kit Phosphate Fluorescence Assay Kit NAD/NADH Quantification Kit Pyruvate Assay Kit Ammonia Assay Kit Glucose Assay Kit Ethanol Assay Kit 0 5 10 Time (minutes) 15 ApoGSH Glutathione Detection Kit GST Fluorometric Assay Kit Triglyceride Assay Kit ADP/ATP Ratio Assay Kit Phosphate Colorimetric Assay Kit NADP/NADPH Quantitation Kit Lactate Assay Kit/ II Glutamate Assay Kit Fatty Acid Assay Kit Uric Acid Assay Kit FOR RESEARCH USE ONLY! Not to be used on humans. Tel: 408-493-1800 | Fax: 408-493-1801 www.biovision.com | [email protected] Page 1 of 2 BioVision For research use only rev. 4/14 GENERAL TROUBLESHOOTING GUIDE: Problems Cause Solution Assay not working • Use of ice-cold assay buffer • Assay buffer must be at room temperature • Omission of a step in the protocol • Refer and follow the data sheet precisely • Plate read at incorrect wavelength • Check the wavelength in the data sheet and the filter settings of the instrument • Use of a different 96-well plate • Fluorescence: Black plates (clear bottoms) ; Luminescence: White plates ; Colorimeters: Clear plates • Use of an incompatible sample type • Refer data sheet for details about incompatible samples • Samples prepared in a different buffer • Use the assay buffer provided in the kit or refer data sheet for instructions • Cell/ tissue samples were not completely homogenized • Use Dounce homogenizer (increase the number of strokes); observe for lysis under microscope • Samples used after multiple free-thaw cycles • Aliquot and freeze samples if needed to use multiple times • Presence of interfering substance in the sample • Troubleshoot if needed • Use of old or inappropriately stored samples • Use fresh samples or store at correct temperatures until use • Improperly thawed components • Thaw all components completely and mix gently before use • Use of expired kit or improperly stored reagents • Always check the expiry date and store the components appropriately • Allowing the reagents to sit for extended times on ice • Always thaw and prepare fresh reaction mix before use • Incorrect incubation times or temperatures • Refer datasheet & verify correct incubation times and temperatures • Incorrect volumes used • Use calibrated pipettes and aliquot correctly • Use of partially thawed components • Thaw and resuspend all components before preparing the reaction mix • Pipetting errors in the reaction mix • Prepare a master reaction mix whenever possible • Air bubbles formed in well • Pipette gently against the wall of the tubes • Calculation errors • Recheck calculations after referring the data sheet • Substituting reagents from older kits/ lots • Use fresh components from the same kit • Measured at incorrect wavelength • Check the equipment and the filter setting • Samples contain interfering substances • Troubleshoot if it interferes with the kit • Use of incompatible sample type • Refer data sheet to check if sample is compatible with the kit or optimization is needed • Sample readings above/below the linear range • Concentrate/ Dilute sample so as to be in the linear range Samples with erratic readings Lower/ Higher readings in Samples and Standards Readings do not follow a linear pattern for Standard curve Unanticipated results Note: The most probable list of causes is under each problem section. Causes/ Solutions may overlap with other problems. BioVision Incorporated 155 S. Milpitas Boulevard, Milpitas, CA 95035 USA Tel: 408-493-1800 | Fax: 408-493-1801 www.biovision.com | [email protected] Page 2 of 2