1
INTERUNIS-IT
A-Line 32D
User manual
2012
2
User manual — A-Line 32D
Table of Contents
3
Table of Contents
Table of Contents . . . . . . . . . . . . . . . . . . . . . . . . . . . . . . . . . . . . . . . . . . . . . . . .
3
Chapter 1. Getting Started . . . . . . . . . . . . . . . . . . . . . . . . . . . . . . . . . . . .
7
7
8
9
10
11
11
12
12
13
13
13
14
14
14
15
16
16
Chapter 2. System control during measurement . . . . . . . . .
17
17
19
20
20
20
21
21
21
22
Chapter 3. Files . . . . . . . . . . . . . . . . . . . . . . . . . . . . . . . . . . . . . . . . . . . . . . . . . . .
24
24
24
24
25
25
25
1.1.
1.2.
1.3.
1.4.
1.5.
A-Line features . . . . . . . . . . . . . . . . . . . . . . . . . . . . . . . . . . . . . . . . . . . . . . .
Measured and programmed channel parameters . . . . . . . . . .
Results display windows . . . . . . . . . . . . . . . . . . . . . . . . . . . . . . . . . . . .
File types . . . . . . . . . . . . . . . . . . . . . . . . . . . . . . . . . . . . . . . . . . . . . . . . . . . . .
Main menu . . . . . . . . . . . . . . . . . . . . . . . . . . . . . . . . . . . . . . . . . . . . . . . . . . . .
File menu . . . . . . . . . . . . . . . . . . . . . . . . . . . . . . . . . . . . . . . . . . . . . . . . . . . . . . .
View menu . . . . . . . . . . . . . . . . . . . . . . . . . . . . . . . . . . . . . . . . . . . . . . . . . . . . .
Control menu . . . . . . . . . . . . . . . . . . . . . . . . . . . . . . . . . . . . . . . . . . . . . . . . . . .
Location menu . . . . . . . . . . . . . . . . . . . . . . . . . . . . . . . . . . . . . . . . . . . . . . . . . .
Classification menu . . . . . . . . . . . . . . . . . . . . . . . . . . . . . . . . . . . . . . . . . . . . .
Options menu . . . . . . . . . . . . . . . . . . . . . . . . . . . . . . . . . . . . . . . . . . . . . . . . . .
Window menu . . . . . . . . . . . . . . . . . . . . . . . . . . . . . . . . . . . . . . . . . . . . . . . . .
Help menu . . . . . . . . . . . . . . . . . . . . . . . . . . . . . . . . . . . . . . . . . . . . . . . . . . . . . .
1.6. Toolbar . . . . . . . . . . . . . . . . . . . . . . . . . . . . . . . . . . . . . . . . . . . . . . . . . . . . . . . .
1.7. Viewbar (Viewbar) . . . . . . . . . . . . . . . . . . . . . . . . . . . . . . . . . . . . . . . . . . .
1.8. Status bar . . . . . . . . . . . . . . . . . . . . . . . . . . . . . . . . . . . . . . . . . . . . . . . . . . . .
1.9. "Hotkeys" . . . . . . . . . . . . . . . . . . . . . . . . . . . . . . . . . . . . . . . . . . . . . . . . . . . . .
2.1. Preparing for new measurement . . . . . . . . . . . . . . . . . . . . . . . . . . . .
2.2. Complex operating during the data acquisition . . . . . . . . . . . .
Oscilloscope control . . . . . . . . . . . . . . . . . . . . . . . . . . . . . . . . . . . . . . . . . . . . .
2.3. Additional features . . . . . . . . . . . . . . . . . . . . . . . . . . . . . . . . . . . . . . . . . .
Controlling sound messages . . . . . . . . . . . . . . . . . . . . . . . . . . . . . . . . . . . .
2.4. Using the Viewbar . . . . . . . . . . . . . . . . . . . . . . . . . . . . . . . . . . . . . . . . . . .
2.5. Synchronous view . . . . . . . . . . . . . . . . . . . . . . . . . . . . . . . . . . . . . . . . . . . .
Synchronous view (On-line mode) . . . . . . . . . . . . . . . . . . . . . . . . . . . . . .
Synchronous View (Off-Line mode) . . . . . . . . . . . . . . . . . . . . . . . . . . . . . .
3.1. Working with files . . . . . . . . . . . . . . . . . . . . . . . . . . . . . . . . . . . . . . . . . . .
Opening a data file . . . . . . . . . . . . . . . . . . . . . . . . . . . . . . . . . . . . . . . . . . . . .
File reading panel . . . . . . . . . . . . . . . . . . . . . . . . . . . . . . . . . . . . . . . . . . . . . . .
Saving a data file . . . . . . . . . . . . . . . . . . . . . . . . . . . . . . . . . . . . . . . . . . . . . . .
Opening an oscillogram file . . . . . . . . . . . . . . . . . . . . . . . . . . . . . . . . . . . . .
Saving an oscillogram file . . . . . . . . . . . . . . . . . . . . . . . . . . . . . . . . . . . . . . .
User manual — A-Line 32D
Table of Contents
4
3.2. File header . . . . . . . . . . . . . . . . . . . . . . . . . . . . . . . . . . . . . . . . . . . . . . . . . . .
Data file information . . . . . . . . . . . . . . . . . . . . . . . . . . . . . . . . . . . . . . . . . . . .
Control elements . . . . . . . . . . . . . . . . . . . . . . . . . . . . . . . . . . . . . . . . . . . . . . .
3.3. Oscillogram file header . . . . . . . . . . . . . . . . . . . . . . . . . . . . . . . . . . . . . .
3.4. Concatenation (data files concatenation) . . . . . . . . . . . . . . . . . .
Using a pattern . . . . . . . . . . . . . . . . . . . . . . . . . . . . . . . . . . . . . . . . . . . . . . . . .
3.5. Project . . . . . . . . . . . . . . . . . . . . . . . . . . . . . . . . . . . . . . . . . . . . . . . . . . . . . . . .
Creating a project . . . . . . . . . . . . . . . . . . . . . . . . . . . . . . . . . . . . . . . . . . . . . .
Project Work Space . . . . . . . . . . . . . . . . . . . . . . . . . . . . . . . . . . . . . . . . . . . . .
Controlling the project work space . . . . . . . . . . . . . . . . . . . . . . . . . . . . . .
25
26
27
28
31
32
33
33
34
35
Chapter 4. Data processing . . . . . . . . . . . . . . . . . . . . . . . . . . . . . . . . . . . .
36
36
36
37
38
40
41
41
41
43
43
43
44
46
46
47
48
48
48
48
49
Chapter 5. System Parameters Setup . . . . . . . . . . . . . . . . . . . . . . .
50
50
50
52
53
54
55
56
4.1. Data filtering . . . . . . . . . . . . . . . . . . . . . . . . . . . . . . . . . . . . . . . . . . . . . . . . .
Filtering parameters . . . . . . . . . . . . . . . . . . . . . . . . . . . . . . . . . . . . . . . . . . . .
Filter and review window . . . . . . . . . . . . . . . . . . . . . . . . . . . . . . . . . . . . . . .
Filtering . . . . . . . . . . . . . . . . . . . . . . . . . . . . . . . . . . . . . . . . . . . . . . . . . . . . . . . . .
Formula filtering . . . . . . . . . . . . . . . . . . . . . . . . . . . . . . . . . . . . . . . . . . . . . . . .
Filtering after region . . . . . . . . . . . . . . . . . . . . . . . . . . . . . . . . . . . . . . . . . . . .
Filtering of synchronous interference . . . . . . . . . . . . . . . . . . . . . . . . . . . .
Filtering AEP packs . . . . . . . . . . . . . . . . . . . . . . . . . . . . . . . . . . . . . . . . . . . . .
Filtering of incorrect started pulses . . . . . . . . . . . . . . . . . . . . . . . . . . . . .
Additional filtering parameters . . . . . . . . . . . . . . . . . . . . . . . . . . . . . . . . . .
4.2. Classification . . . . . . . . . . . . . . . . . . . . . . . . . . . . . . . . . . . . . . . . . . . . . . . . .
Amplitude criterion . . . . . . . . . . . . . . . . . . . . . . . . . . . . . . . . . . . . . . . . . . . . .
Locally-dynamic criterion . . . . . . . . . . . . . . . . . . . . . . . . . . . . . . . . . . . . . . . .
S-H Diagram . . . . . . . . . . . . . . . . . . . . . . . . . . . . . . . . . . . . . . . . . . . . . . . . . . . .
4.3. Printing . . . . . . . . . . . . . . . . . . . . . . . . . . . . . . . . . . . . . . . . . . . . . . . . . . . . . . .
Printer setup . . . . . . . . . . . . . . . . . . . . . . . . . . . . . . . . . . . . . . . . . . . . . . . . . . . .
Making a screen copy . . . . . . . . . . . . . . . . . . . . . . . . . . . . . . . . . . . . . . . . . .
4.4. Data export . . . . . . . . . . . . . . . . . . . . . . . . . . . . . . . . . . . . . . . . . . . . . . . . . . .
Exporting ALD data files . . . . . . . . . . . . . . . . . . . . . . . . . . . . . . . . . . . . . . . .
Exporting oscillogram files . . . . . . . . . . . . . . . . . . . . . . . . . . . . . . . . . . . . . .
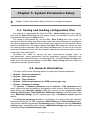
5.1. Saving and loading configuration files . . . . . . . . . . . . . . . . . . . . .
5.2. General information . . . . . . . . . . . . . . . . . . . . . . . . . . . . . . . . . . . . . . . . .
5.3. Setting the main channel parameters . . . . . . . . . . . . . . . . . . . . . .
Setting the autothreshold parameters . . . . . . . . . . . . . . . . . . . . . . . . . . .
5.4. Channel time parameters setup . . . . . . . . . . . . . . . . . . . . . . . . . . . .
5.5. Oscilloscope channels setup . . . . . . . . . . . . . . . . . . . . . . . . . . . . . . . .
5.6. Setting the parametric channels . . . . . . . . . . . . . . . . . . . . . . . . . . . .
5.7. Setting the calibrators parameters (for DDM systems type
only) . . . . . . . . . . . . . . . . . . . . . . . . . . . . . . . . . . . . . . . . . . . . . . . . . . . . . . . . . . . . .
5.8. Additional parameters setting (for PCI systems type only)
....................................................................
User manual — A-Line 32D
57
58
Table of Contents
5.9. Setting general system parameters . . . . . . . . . . . . . . . . . . . . . . . .
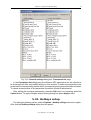
5.10. Hotkeys setup . . . . . . . . . . . . . . . . . . . . . . . . . . . . . . . . . . . . . . . . . . . . . . .
5
59
65
Chapter 6. Working with windows . . . . . . . . . . . . . . . . . . . . . . . . . . .
67
67
68
68
69
71
71
72
73
74
74
76
76
77
Chapter 7. Location . . . . . . . . . . . . . . . . . . . . . . . . . . . . . . . . . . . . . . . . . . . . . .
79
79
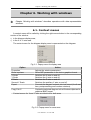
6.1. Context menus . . . . . . . . . . . . . . . . . . . . . . . . . . . . . . . . . . . . . . . . . . . . . . .
6.2. Setting the window working field . . . . . . . . . . . . . . . . . . . . . . . . . . .
Location windows feature . . . . . . . . . . . . . . . . . . . . . . . . . . . . . . . . . . . . . . .
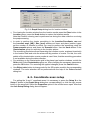
6.3. Coordinate axes setup . . . . . . . . . . . . . . . . . . . . . . . . . . . . . . . . . . . . . . .
Scrolling . . . . . . . . . . . . . . . . . . . . . . . . . . . . . . . . . . . . . . . . . . . . . . . . . . . . . . . .
Synchronous scrolling . . . . . . . . . . . . . . . . . . . . . . . . . . . . . . . . . . . . . . . . . . .
6.4. Windows manager . . . . . . . . . . . . . . . . . . . . . . . . . . . . . . . . . . . . . . . . . . .
6.5. Page manager . . . . . . . . . . . . . . . . . . . . . . . . . . . . . . . . . . . . . . . . . . . . . . . .
6.6. Imposing additional lines and diagrams . . . . . . . . . . . . . . . . . . . .
Additional line setup . . . . . . . . . . . . . . . . . . . . . . . . . . . . . . . . . . . . . . . . . . . .
Imported graphics setup . . . . . . . . . . . . . . . . . . . . . . . . . . . . . . . . . . . . . . . .
Creating a loading line . . . . . . . . . . . . . . . . . . . . . . . . . . . . . . . . . . . . . . . . . .
Recommendations on creating the joints map . . . . . . . . . . . . . . . . . . .
7.1. Intro . . . . . . . . . . . . . . . . . . . . . . . . . . . . . . . . . . . . . . . . . . . . . . . . . . . . . . . . . . .
7.2. Determining the AEP propagation velocity and the
distance between sensors . . . . . . . . . . . . . . . . . . . . . . . . . . . . . . . . . . . . .
Determining the AEP propagation velocity. . . . . . . . . . . . . . . . . . . . . . .
Determining the distance between sensors. . . . . . . . . . . . . . . . . . . . . .
Operations with sensors arrangement scheme. . . . . . . . . . . . . . . . . . .
7.3. Forming location groups . . . . . . . . . . . . . . . . . . . . . . . . . . . . . . . . . . . . .
Additional features . . . . . . . . . . . . . . . . . . . . . . . . . . . . . . . . . . . . . . . . . . . . . .
7.4. Sensors arrangement scheme setup . . . . . . . . . . . . . . . . . . . . . . . .
7.5. Setting sensors coordinates . . . . . . . . . . . . . . . . . . . . . . . . . . . . . . . . .
7.6. Sensors distribution in zones . . . . . . . . . . . . . . . . . . . . . . . . . . . . . . .
7.7. Linear location . . . . . . . . . . . . . . . . . . . . . . . . . . . . . . . . . . . . . . . . . . . . . . .
Including sensors into a location group . . . . . . . . . . . . . . . . . . . . . . . . . .
Sensors arrangement scheme setup . . . . . . . . . . . . . . . . . . . . . . . . . . . .
7.8. Plane location . . . . . . . . . . . . . . . . . . . . . . . . . . . . . . . . . . . . . . . . . . . . . . . .
Including sensors into location group . . . . . . . . . . . . . . . . . . . . . . . . . . . .
Sensors arrangement scheme setup . . . . . . . . . . . . . . . . . . . . . . . . . . . .
7.9. Cylinder location (cylinder vessels) . . . . . . . . . . . . . . . . . . . . . . . . .
Including sensors into location group . . . . . . . . . . . . . . . . . . . . . . . . . . . .
Sensors arrangement scheme setup . . . . . . . . . . . . . . . . . . . . . . . . . . . .
7.10. Sphere location (spherical vessels) . . . . . . . . . . . . . . . . . . . . . . .
Including sensors into location group . . . . . . . . . . . . . . . . . . . . . . . . . . . .
Sensors arrangement scheme setup . . . . . . . . . . . . . . . . . . . . . . . . . . . .
User manual — A-Line 32D
79
79
81
81
82
84
84
85
87
89
89
90
91
91
91
92
93
94
95
95
96
Table of Contents
6
7.11. Bottom location . . . . . . . . . . . . . . . . . . . . . . . . . . . . . . . . . . . . . . . . . . . . .
Including sensors into location group . . . . . . . . . . . . . . . . . . . . . . . . . . . .
Sensors arrangement scheme setup . . . . . . . . . . . . . . . . . . . . . . . . . . . .
7.12. 3D volume Location . . . . . . . . . . . . . . . . . . . . . . . . . . . . . . . . . . . . . . . .
Including sensors into location group . . . . . . . . . . . . . . . . . . . . . . . . . . . .
Sensors arrangement scheme setup . . . . . . . . . . . . . . . . . . . . . . . . . . . .
7.13. Zone location . . . . . . . . . . . . . . . . . . . . . . . . . . . . . . . . . . . . . . . . . . . . . . .
Including sensors into location group . . . . . . . . . . . . . . . . . . . . . . . . . . . .
Zone location scheme parameters . . . . . . . . . . . . . . . . . . . . . . . . . . . . . .
Displaying results . . . . . . . . . . . . . . . . . . . . . . . . . . . . . . . . . . . . . . . . . . . . . . .
7.14. Additional location options . . . . . . . . . . . . . . . . . . . . . . . . . . . . . . . .
Controlling a 3D location model window . . . . . . . . . . . . . . . . . . . . . . . . .
7.15. Filtering after location . . . . . . . . . . . . . . . . . . . . . . . . . . . . . . . . . . . . .
7.16. Clusterization . . . . . . . . . . . . . . . . . . . . . . . . . . . . . . . . . . . . . . . . . . . . . . .
✶
✶
User manual — A-Line 32D
✶
97
97
98
99
99
99
101
101
101
102
102
104
104
106
Chapter 1. Getting Started
7
Chapter 1. Getting Started
✻
Chapter “Getting Started” gives a brief overview of system capabilities and
interface.
1.1. A-Line features
✧
✧
◇
◇
This software product supports two modes of system operation.
On-Line mode (hardware component connected) – the mode for data collection and
postprocessing.
Off-Line mode (hardware component disconnected)) - the mode for postprocessing
only.
In data collection mode the following will be performed:
• system parameters setup;
• system administration during the data logging (startup, temporary shutdown and
subsequent startup, complete shutdown of the system);
• graphic representation of the obtained data in the real time mode;
• recording the obtained data into a file or exporting it to a text file;
• defects location for different types of location (linear, plane, cylindrical vessels,
spherical vessels, conic vessels, reservoir bottoms, zonary, 3D and picture) at
independent sensors arrangement.
In the postprocessing mode the program provides for the following options:
• reading data from files, their graphical and text representation;
• creation of dependence graphs between any parameters and histograms for events
distribution after any parameter;
• data filtering after the following parameters:
• time;
• channel number;
• amplitude;
• energy;
• time of the AE pulse rise;
• duration of the AE pulse;
• counts of threshold crossings in the AE pulse;
• average frequency;
• optional flags;
• data filtering after location results (coordinate, location amplitude, cluster power);
• filtering after formula;
• filtering after clusterization results;
• filtering after area;
User manual — A-Line 32D
Chapter 1. Getting Started
8
• possibility of saving and subsequent work with data obtained in the result of filtering;
• data export into the text format;
• data export from parameter channels into the text format.
1.2. Measured and programmed
channel parameters
ALine 32D represents a multichannel system for AE pulse registration, where every
channel operates independently from other channels. Every channel includes a Former for
AE pulse parameters (PF). Objectives for every PF consist of AE pulse (AEP) registration
and forming a measured parameters block for:
◇ maximum AEP amplitude;
◇ AEP energy;
◇ time of the AEP beginning registration;
◇ time of the AEP peak amplitude registration;
◇ time of the AEP end registration.
◇ counts of the AEP threshold crossings.
For correct extraction of the AEP against noises in the background, in addition to
measured parameters there is a set of programmed parameters for every channel and
namely:
◇ gain or main amplifier (Gain); (Gain);
◇ discrimination threshold (Threshold);
◇ peak amplitude formation timeout (RTTO);
◇ AEP end timeout (SCETO);
◇ maximum AEP duration (Duration max);
◇ dead time (Dead time).
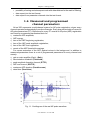
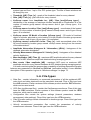
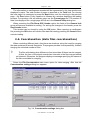
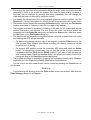
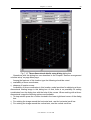
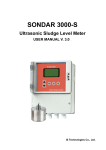
Fig. 1.1. Oscillogram of the real AE pulse waveform
User manual — A-Line 32D
Chapter 1. Getting Started
9
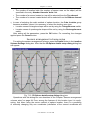
The figure above displays the oscillogram of the real AE pulse. Amplitude values of the
AE pulse are displayed on the vertical (the scale is graded in ADC points for convenience)
axis, time is displayed on the horizontal axis. By using this figure, we can examine the
principles of the AE event formation.
1.3. Results display windows
◇ Averaged amplitude, [dB] / Time, [s] - average value of the AEP maximum amplitude
for every channel during the averaging period.
◇ AE activity / Time, [s] - the number of AEP’s for every channel during the averaging
period (intensity).
◇ Events run-on / Time, [s] - total number of AEP depending on the time for every
channel from the moment of the data retrieval.
◇ Events summary/ Channel - histogram of the total number of AEP from the moment
of the system startup for every channel until the current moment of time.
◇ Averaged energy, [dB] / Time, [s] - average value of the AEP energy for every
channel during the averaging period.
◇ Energy run-on, [dB] / Time, [s] - total accumulated value of the AEP energy for every
channel during from the moment of the data retrieval.
◇ Averaged rise time, [mcs] / Time, [s] - average value of the AEP rise time for every
channel during the averaging period.
◇ Averaged duration, [mcs] / Time, [s] - average value of the AEP duration for every
channel during the averaging period.
◇ Averaged amplitude total, [dB] / Time, [s] - the sum of the average values of the
AEP maximum amplitude for all the channels during the averaging period.
◇ Total AE activity / Time, [s] - average value of the AEP number for all the channels
during the averaging period (total intensity).
◇ Noise level, [dB] / Channel - histograms of the obtained noise level, threshold value
and minimal noise level for every channel.
◇ Averaged noise level, [dB] / Time, [s] - average value of the obtained noise level for
every channel during the averaging period.
◇ Averaged counts / Time, [s] - the averaged number of threshold crossings in the
AEP for every channel during the averaging period.
◇ Counts run-on / Time, [s] - total accumulated value of the AEP counts for every
channel during from the moment of the data retrieval.
◇ N. Digital Oscilloscope: [ADC Scale/mcV/dB] / Time, [mcs] - digital oscillogram of
the AEP waveform for the channels selected to output into this window. The number
N of these windows can be from 1 up to 50.
◇ N. Spectral power: [(J*1e-26/kHz)^1/2] / Frequency, [kHz] - frequency spectrum of
the AEP waveform for the channels selected to output into this window. The number
N of these windows can be from 1 up to 50.
◇ <Parameter N / Time, [s]> - the averaged value of the external parametric
measurements (e.g. pressure, temperature etc.), which come from the sensors,
connected by the user. The number N of these windows can be from 1 up to 4 for DDM
User manual — A-Line 32D
Chapter 1. Getting Started
10
system type and from 1 up to 2 for PCI system type. The title of these windows can
be change by user
◇ Threshold, [dB] / Time, [s] - graph of the threshold value for every channel.
◇ Gain, [dB] / Time, [s] - gain values for every channel.
◇ N.<Group name> Loc. Amplitude loc., [dB] / Size, [mm][<Group type>] distribution of the average or maximum location amplitude on coordinates. N is the
number of location group named <Group name> and of type <Group type>, N is
unlimited.
◇ N.<Group name> Location / Size, [mm][<Group type>] - coordinates of the located
events. N is the number of location group named <Group name> and of type <Group
type>, N is unlimited.
◇ N.<Group name> 3D Model of location [<Group type>] - 3D model of localized
object for cylinder, spherical or conic location. N is the number of location group named
<Group name> and of type <Group type>, N is unlimited.
◇ N.<Group name> Located AE run-on / Time, [s] - total accumulated value of the
AE event located by location group named <Group name> during from the moment
of the data retrieval.
◇ Amplitude Attenuation Histogram N / Attenuation, [dB/m] - histograms of the
obtained attenuation distribution.
◇ Velocity Measurement Histogram N / Velocity, [m/s] - histograms of the obtained
velocity distribution.
◇ Max. amplitudes, [dB] / Time, [s] - maximum AEP amplitude values for every channel
between all AEP maximum amplitude obtained during averaging period.
◇ Max. counts / Max. amplitude, [dB] - maximum AEP count vs maximum AEP
amplitude values for every channel between all AEP obtained during averaging period.
It is worth mentioning that the program has a capability of building dependence graphs
between any parameters in On-Line and Off-Line (preferable) modes. A more detailed
description of this operation is given in “Windows manager” on page 72.
1.4. File types
◇ Data files - contain information on measured parameters of all the registered AEP,
noise level and data, obtained from the parametric channels. Files of this type have
the .ALD extension. Earlier versions of this software product used the .DAT extension,
which can be used as well.
◇ OSC-files (oscilloscope files) - contain the Oscilloscope waveforms. Files of this type
have the .OSC extension. Earlier versions of this software product used the .SDO
extension, which can be used as well.
◇ Configuration files contain the system settings (channel parameters, windows
arrangement, other settings). Files of this type have the .CFG extension.
◇ Files of location settings contain information on location groups. Files of this type have
the .LFG extension.
◇ Velocity measurement parameters files contain the parameters of velocity
measurement schemes. Files of this type have the .VFG extension.
User manual — A-Line 32D
Chapter 1. Getting Started
11
◇ Data filtration parameters files contain the parameters of data filtering. Files of this type
have the .FLT extension.
◇ A-Line project parameters files contain the parameters of working A-Line project. Files
of this type have the .ALP extension.
◇ Files with additional line description contain additional lines description, placed on the
windows. Files of this type have the .NAG extension. It is also possible to use the .ТХТ
extension for this file type.
◇ Imported graphics files contain the images placed on the 2D windows. ALine 32D
can work with the following formats of graphical files: Windows metafile (files with the
.WMF extension) and Enhanced Metafile (files with the .EMF extension). For creation
of imported graphics files, it is necessary to use graphics editor creating images in
vector format (e.g. CorelDraw or Visio).
◇ Imported 3D graphics files contain the images placed on the 3D windows. ALine 32D
can work with the following format of 3D graphical files: ASCII Scene Export (files with
the .ASE extension). For creation of 3D imported graphics files, it is necessary to use
graphics editor exporting images in ASE format (e.g. AutoCAD).
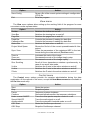
1.5. Main menu
File menu
All the options related to operations with files are concentrated in this menu. It contains
the following options:
Option
Create project
Open
Show Header
Save
Open OSC Wave
Show OSC Header
OSC Save OSC
Open project
Close project
Printer setup
Print
Filter and review
Filter current file
Concatenation
Export ALD Data
Export OSC data
Create Config
Open Config
Action
Creates an A-Line project from the selected files and
saves them in the selected subfolder.
Opens (loads) a data (ALD) file.
Shows information about opened data (ALD) file.
Saves the data of the current measurement into a file.
Opens (loads) an oscillogram (OSC) file.
Shows information about opened oscillogram (OSC) file.
Saves an oscillogram (OSC) file.
Opens an A-Line project file.
Closes an A-Line project file.
Sets the printer parameters.
Prints data.
Filters and text views of the selected data (ALD) file.
Filters and text views of the opened data (ALD) file.
Concatenates data from files.
Transforms data (ALD) files into text format.
Transforms oscillogram (OSC) files into text format.
Creates a system configuration (CFG) file.
Loads a system configuration (CFG) file.
User manual — A-Line 32D
Chapter 1. Getting Started
Option
Save Config
Exit
12
Action
Saves a file of the current system settings in configuration
(CFG) file.
Exits the program.
View menu
The View menu options allow setting up the working field of the program for more
convenient results representation.
Option
Toolbar
View Bar
Page Bar
Read Bar
Calibration Bar
Status Bar
Project Work Space
Sync. View
Zoom in
Zoom out
Zoom back
Sinc. Scrolling
X-Axis
Y-Axis
Z-Axis
Action
Switches the toolbar on and off.
Switches the viewing bar on and off.
Switches the pages bar on and off.
Controls the process of reading the data files.
Controls the process of reading the data files.
Switches the status bar on and off.
Shows the file list of the current opened/created A-Line
project.
Views the parameters of the registered AEP in the text
format during the data retrieval (On-Line mode).
Increases the scale of the image.
Decreases the scale of the image step-by-step.
Decreases the scale of the image rapidly.
Scroll all time dependence windows synchronously in
case of use scroll axis mode.
Switches the X-axis in the active window on and off.
Switches the Y-axis in the active window on and off.
Switches the Z-axis in the active window on and off.
Control menu
The Control menu options provide for complex administration during the data
registration. All the options of this menu, except the New Measurement are available in
the On-Line mode only.
Option
Start
Stop
Pause
Continue
Noise events ON/OFF
Sound ON/OFF
Autothreshold
OSC Start
OSC Stop
Action
Starts the system.
Stops the system
Temporary system shutdown.
Resumes operations after the temporary shutdown.
Turns the noise packs reception mode on or off.
Turns the audio signal on or off.
Turns the automatic threshold mode on or off.
Starts the Oscilloscope channel.
Stops the Oscilloscope channel.
User manual — A-Line 32D
Chapter 1. Getting Started
Option
OSC Record
New Measurement
Relogin
Marker
13
Action
Turns the oscillogram record mode on of off.
Prepares for a new measurement.
Relogin modules without power shutdown (for DDM type
system only).
Insert text marker into data flow.
Location menu
The Location menu options allow setting the location parameters.
Option
New Location
Open Location
Edit Current
Close Current
Clear Locations
Restore Locations
New velocity
Open velocity
Edit velocity
Close velocity
New calibration
Open calibration
Edit current calibration
Close current calibration
Action
Creates new schemes of location groups.
Opens previously saved location schemes.
Corrects parameters of current location schemes.
Closes current location schemes.
Temporary clears contents of all location windows.
Restores contents of all location windows.
Creates new scheme to determine the velocity of AEP
distribution.
Opens previously saved scheme for velocity of AEP
determination.
Corrects current arrangement scheme for velocity of AEP
determination.
Closes current velocity measurement scheme.
Creates new scheme to calibrate installed AE sensors.
Opens previously saved scheme to calibrate installed AE
sensors.
Corrects current arrangement scheme to calibrate
installed AE sensors.
Closes current arrangement scheme to calibrate installed
AE sensors.
Classification menu
The Classification menu options allow classification of the AE sources according to
their risk level.
Option
Amplitude criterion
Locally-dynamic criterion
S-H diagram
Statistic criterion
Action
Applies an amplitude criterion.
Applies a local-dynamic criterion.
Display a S-H diagram.
Applies statistic criterion.
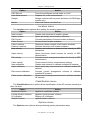
Options menu
The Options menu options allow performing system parameters setup.
User manual — A-Line 32D
Chapter 1. Getting Started
Option
Channels parameters
OSC parameters
Time definition
Calibration settings
Parameters settings
Profile settings
Current window
Hot Key
Settings
14
Action
Sets the gain (Gain), discrimination thresholds
(Threshold), frequency bandwidth and representation
channels for every channel.
Sets oscilloscope channel parameters.
Determines time parameters (SCETO, Dead Time, Max
Duration) for every channel.
Sets calibration pulsars parameters (only for DDM type
system).
Sets parametric channel parameters.
Sets hardware profiles manager.
Sets active window setup.
Sets hotkey system.
Sets general system parameters.
Window menu
The Window menu options provide for operations with windows.
Option
Page Manager
Alarm Manager
Windows manager
Additional lines
Restore all
Cascade
Tile
Arrange Icons
9 names of windows on
current visual page
More Windows
Action
Sets windows displaying pages manager.
Sets sound alarm manager.
Sets data windows manager.
Creates an additional (parametric) line.
Restores all the working windows and arranges them in
a certain order.
Arranges the working windows sequentially one by one
with a shift.
Arranges the working windows without overlapping.
Arranges the working windows minimized to pictograms.
Quickly activates a corresponding window.
Allows activation of any window on current visual page.
Help menu
The Help menu options allow getting help on working with system.
Option
Help Index
Help Topics
About
Action
Displays help index
Displays help topics.
Displays brief information about the program.
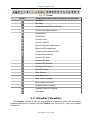
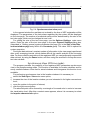
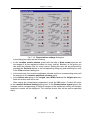
1.6. Toolbar
The Toolbar consists of the buttons with pictograms displayed on them. Every button
is connected with some operation, which in most cases duplicates a main menu item.
User manual — A-Line 32D
Chapter 1. Getting Started
15
Fig. 1.2. Toolbar
Button
Duplicates a menu item or performs an operation.
File-Open
File-Save
File-Review and Filter current file
Control-New Measurement
Control-Start
Control-Stop
Control-Pause
Control-Continue
Options-Channels parameters
Options-OSC parameters
Control-Autothreshold On/Off
Control-Sound On/Off
Control-OSC Start
Control-OSC Stop
Control-OSC Record
Previous OSC wave
Next OSC wave
View-Zoom in
View-Zoom out
Draw region / polygon
Shift visible area mode
Location-Clear Locations
Location-Restore Locations
Help-About
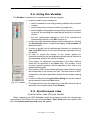
1.7. Viewbar (Viewbar)
The Viewbar located to the left is intended for convenient work with the system.
Detailed description of working with the Viewbar may be found in “Using the Viewbar”
on page 21.
User manual — A-Line 32D
Chapter 1. Getting Started
16
1.8. Status bar
The Status bar displays brief hints on working with menu and the Toolbar, as well as
specifies the pointer position (X and Y coordinates) within the active window as well as
additional information for some windows.
Fig. 1.3. Status bar
1.9. "Hotkeys"
In order to increase the convenience level while working with the program, provisions
were made for using "the hotkeys" (combinations of different keys). Every keys
combination allows on-the-fly activation of a main menu option.
"Hotkey"
Alt + N
Ctrl + O
Ctrl + S
Alt + O
Ctrl + P
Alt + F4
Ctrl + F5
Ctrl + F6
Ctrl + F7
Ctrl + F8
Ctrl + Shift + F5
Ctrl + Shift + F6
Ctrl + R
Ctrl + N
Ctrl + L
Duplicates a menu item or performs an operation
File – Create project
File – Open
File – Save
File – Open project
File – Print
File – Exit
Control – Start
Control – Stop
Control – Pause
Control – Continue
Control – OSC Start
Control – OSC Stop
Control – OSC Record
Control – New Measurement
Control – Relogin
We should note that the above mentioned "hotkeys" are the default hotkeys. At user’s
will it is possible to change the existing ones and add the new combinations. "Hotkeys"
setup will be described in the “Hotkeys setup” on page 65.
✶
✶
User manual — A-Line 32D
✶
Chapter 2. System control during measurement
17
Chapter 2. System control
during measurement
✻
Chapter “System control during measurement” describes the preparation to the new
measurement and system control during measurement.
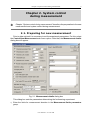
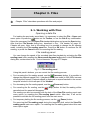
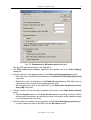
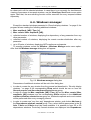
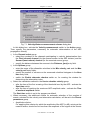
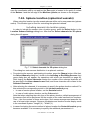
2.1. Preparing for new measurement
Prior to data retrieval it is necessary to set the experiment parameters. For this, select
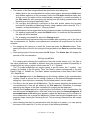
the Control-New Measurement main menu option. After that, the Measurement details
dialog box will appear.
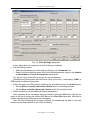
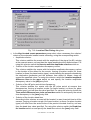
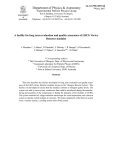
Fig. 2.1. Measurement details dialog box
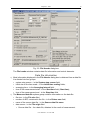
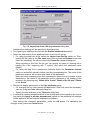
This dialog box sets the parameters determining the forthcoming experiment:
◇ Enter the limits for measurement duration in the Measurement limits parameters
group.
User manual — A-Line 32D
Chapter 2. System control during measurement
18
• Maximal measurement time duration will be checked and specified in the switch
and entry fields for number of hour(s) and min(s), located in the Maximal
measurement time line. The time interval will be specified in hours and minutes.
In case of the switch is checked, at the end of the time specified, data retrieval will
be stopped.
• Maximal number of AEP will be checked and specified in the switch and entry fields
for number of pulses, located in the Maximal pulse number line. In case of the
switch is checked, at the moment when specified number of AEP would come, data
retrieval will be stopped.
• Maximal number of AEP total counts will be checked and specified in the switch
and entry fields for number of counts, located in the Maximal counts number line.
In case of the switch is checked, at the moment when specified number of AEP
total counts would come, data retrieval will be stopped.
• Maximal data file size will be checked and specified in the switch and entry fields
for file size, located in the Maximal file size line. The file size will be specified in
kBytes. In case of the switch is checked, at the moment when specified data file
size would be reached, data retrieval will be stopped.
• Maximal AEP waveform number will be checked and specified in the switch and
entry fields for waveforms, located in the Maximal waves number line. In case of
the switch is checked, at the moment when specified waveform number would be
reached, data retrieval will be stopped.
• The switch Restart measurement automatically should be checked to restart
measurement immediately after previous one have been stopped by any reasons
described above. At least one limit switch should be checked. In case of several
limits condition would be activated the measurement will be stopped after the
earliest one will occur.
• The initial time interval set in the window, will be specified in the entry fields for
number of hour(s) and min(s), located in the Initial Time Scaling line. The time
interval will be specified in hours and minutes.
• The averaging time of the data obtained, expressed in seconds, will be specified
in the Averaging Interval entry field.
◇ Parameters for data saving should be entered in the Saving options group:
• The program provides for possibility do not save obtained basic data to the disk by
setting the Don't write data to disk switch.
• In case there is no need to save data from parametric inputs, it is necessary to set
the Don't write parameter channels' data to disk switch.
• In order to exclude writing the noise data to the disc it is necessary to set the Don't
write noise data to disk switch.
• The program as well provides for possibility do not save obtained AEP waveforms,
by setting the Don't write OSC wave to disk switch.
• The limit number of AEP waveforms written to the disc, should be entered in the
Max number of OSC waves field.
◇ The names of the files for saving the basic data should be entered in the File names
for saving group.
User manual — A-Line 32D
Chapter 2. System control during measurement
19
• The name of the file for saving the data can be entered either manually in the
Measured data entry field, or selected by means of a standard dialog box for
working with files, by pressing the Browse button.
• The name of the file for saving the waveforms of the received AEP can be entered
either manually in the OSC wave entry field, or selected by means of a standard
dialog box for working with files, by pressing the Browse button.
• The name of the configuration file will be specified in the Configuration field.
◇ Pre-filtering parameters can be set in the Pre-filter options group:
• For switching the pre-filtering mode on it is necessary to set the Use data pre-filter
switch.
• Pre-filtering parameters can be set by pressing the Edit pre-filter button. After that,
the Filter Settings dialog box will appear. More details on this dialog box can be
found in “Data filtering”on page 36
◇ Comments to data can be set in the Information group. All of them are purely
informational and used for convenience of data identification during the subsequent
processing, without influencing the measurement process.
• The name of the object will be specified in the Object Name entry field;
• The name of the operator will be specified in the Operator entry field;
• Additional information can be entered in the Reference entry field;
• Comments will be specified in the Comments entry field.
After entering all the parameters it is necessary to press the ОК button in the
Measurement Details dialog box. The system will be ready for data retrieval. For
canceling the set parameters it is necessary to use the Cancel button.
⚐
In case the data retrieval does not take place, the use of the New Measurement
option only prepares the system for data collection. Registration of the AEP begins
from the moment of performing the Control-Start option. Further description of
the complex administration will be given below in the Chapter “Complex operating
during the data acquisition”.
The New Measurement option is also available during the data retrieval. Using it at
this moment will lead to completion of the current measurement and immediate start of
the new measurement with the same parameters. At that, the data will be recorded to the
new files without activating the corresponding dialog. For specifying the new file names,
the automatic file names numbering of the previous (interrupted) measurement is used.
2.2. Complex operating during the data acquisition
In order to start the data acquisition process select the Control-Start option of the main
menu or press the
button on the Toolbar, or use the [Ctrl-F5] key combination. From
this moment, the experiment time countdown and registration of the AE pulses will begin.
Provisions are made for temporary system halt during the data acquisition without
stopping the total experiment time countdown. For this, use the Control-Pause main
menu option, or press the
button on the Toolbar, or use the [Ctrl-F7] hotkey
User manual — A-Line 32D
Chapter 2. System control during measurement
20
combination. In order to continue the operations use the Control-Continue main menu
option, or press the
button on the Toolbar, or use the [Ctrl-F8] hotkey combination.
After that, the system continues events registration.
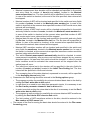
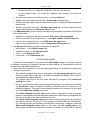
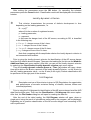
For finishing the data registration use the Control-Stop main menu option, or press
the
button on the Toolbar, or use the [Ctrl-F6] hotkey combination. The measurement
will finish when any limit condition specified for this measurement in the Measurement
details dialog box, described in the Chapter on page “Preparing for new measurement”
on page 17 will complete. In this case, the system informs on the end of the data
acquisition process.
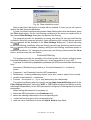
Fig. 2.2. Time over message
Oscilloscope control
Provisions are made for switching the oscilloscope channel on and off at any moment
during the data acquisition except when in the Pause mode.
For starting the oscilloscope, you can use the Control-OSC start main menu option,
or press the button
on the Toolbar.
For stopping the oscilloscope, use the Control-OSC stop main menu option, or press
the
button on the Toolbar.
For saving the received oscilloscope waves, it is necessary to press the
button
on the Toolbar, or use the Control-OSC record main menu option. In case this button
was not pressed, the oscilloscope waves will be displayed on the screen but will not
save. Note, that saving the oscilloscope waves may not be possible in case, while setting
the experiment parameters the Don't write OSC wave to disk option was set in the
Measurement details dialog box, described n the “Preparing for new measurement” on
page 17. Besides, after saving the number of oscilloscope waves set while entering
the experiment parameters, the possibility of save them may as well be lost.
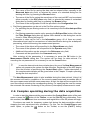
2.3. Additional features
Controlling sound messages
The Control-Sound ON/OFF main menu is intended for systems equipped with
sound-card. It allows switching the sound on/off. This option is not available for other
systems. The
button on the Toolbar duplicates this option.
User manual — A-Line 32D
Chapter 2. System control during measurement
21
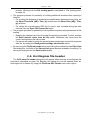
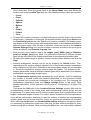
2.4. Using the Viewbar
The Viewbar is intended for convenient work with the program.
◇ It can be used for every channel to:
• switch a channel on and off by pressing a button with a channel
number;
• quickly determine a channel number by graph color;
• switch display of the graphs corresponding to the given channel
on and off, by activating and resetting the switches in the show
column;
• turn any oscilloscope channel on and off by checking the
corresponding switch in the OSC column on.
◇ In order to quickly switch the display of all the channels on, activate
the all channels switch. To switch the display of all channels off
reset this switch.
◇ In order to quickly turn all oscilloscope channels on, activate the
turn on all OSC switch. To turn all oscilloscope channels off reset
this switch.
◇ In order to switch the display of the results graphs for
channels constituting the corresponding location group, select the
corresponding string in the location dropbox.
◇ The number of waveforms accumulated in the data retrieval
mode will be specified in the Nosc field. The number of the
currently opened waveform will be specified in this field in the
postprocessing mode.
◇ The number of AEP accumulated during the data collection mode
will be specified in the events sum field. The total number of AEP,
contained in a file will be specified in this field in the postprocessing
mode.
◇ In order to activate the Location filter dialog box for the location
group selected, press the Filter button.
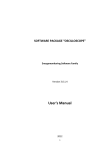
Fig. 2.3. Viewbar ◇ The elapsed time from the beginning of the data retrieval will be
specified in the lowest button of the Viewbar.
2.5. Synchronous view
Synchronous view (On-line mode)
When registering the AEP (On-Line mode) the program provides for viewing their
parameters in text format. For this, select the View – Sync. View main menu option. After
this, the Synchronous text view panel will appear.
User manual — A-Line 32D
Chapter 2. System control during measurement
22
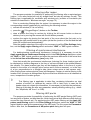
Fig. 2.4. Synchronous text view panel
In the opened window the real data not ordered by the time of AEP registration will be
displayed. The parameters of the last pulses registered by the system will be displayed
on the view page. The number of presented events will be determined by the size of the
text view page, which can be changed at user’s will.
For setting the size of the text view page, use the Options–Settings main menu
option. Enter the size of the text view page in the open General Settings dialog box,
(described in “Setting general system parameters”on page 59), in the Size of the filter
and text window page entry field in the Constants group. The value 1000 is optimal for
system operation.
During the data retrieval, constant update of information in the view page is performed
after every averaging interval, which makes difficult the careful analysis of the incoming
data. For more careful examination of the registered AEP you can temporarily suspend the
data retrieval, by using the Pause button, and then using the scroll bar in the synchronous
text view window.
Synchronous View (Off-Line mode)
The program provides for possibility of the registered AEP parameters synchronous
view in the postprocessing mode. This function is available for location windows and for
newly created windows. Note that for actual windows and histograms this function is not
available.
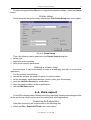
For performing synchronous view in the location windows it is necessary to:
◇ select the View-Sync. View main menu option;
◇ increase the size of the location window you are interested in for higher convenience
level;
◇ move the pointer to the point of interest;
◇ click the right mouse button.
The selected point will be framed by a rectangle of inversed color in order to increase
the visualization level. After this a context menu appears, where it is necessary to select
the Impulse characteristic option.
User manual — A-Line 32D
Chapter 2. System control during measurement
23
Fig. 2.5. Popup menu for display area
Then the records of all actual pulses, which led to location event with the coordinate
selected, will appear in the synchronous text view window. In case of linear location, all
the events are selected (the whole column). Every new demonstration will be highlighted
in the synchronous text view window.
When a new window is created, the function of synchronous view for events with the
current coordinate in the postprocessing windows is available. Note, that this procedure
is not available for histograms.
✶
✶
User manual — A-Line 32D
✶
Chapter 3. Files
24
Chapter 3. Files
✻
Chapter “Files” describes operations with files and project.
3.1. Working with files
Opening a data file
For loading the previously saved data, it is necessary to select the File – Open main
menu option or press the
button on the Toolbar, or use the Ctrl-O key combination.
Select the necessary file in the Open File standard dialog box and press the Open button.
After that the File Header dialog box, described in the “ File header” on page 25
Chapter will open. Note, that in this dialog box it is possible to change the file opening
mode, including the File reading panel bar. Press the OK button to continue the file
reading, or press the Cancel button for canceling the file reading.
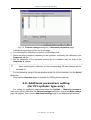
File reading panel
You can change the speed of the recorded data files playback by activating the File
reading panel, after resetting the Show result diagrams only switch in the File Header
dialog box, as described in the “Control elements” on page 27 Chapter.
Fig. 3.1. File reading panel
Using this panel’s buttons, you can control the file reading process.
◇ For increasing the file reading speed, use the
(Increase) button. It is possible to
change the playback speed from 1 (playback in real time mode) to 500 (500x increase
of the playback speed). Playback speed is displayed in square brackets in the current
temporal window in the lower part of the Viewbar.
◇ For decreasing the file reading speed, use the
(Decrease) button.
◇ For canceling the file reading, use the
(Stop) button. At that, file reading will be
cancelled and the panel will disappear.
File reading can also be canceled with the help of the View-File reading panel main
menu option, by resetting the File reading panel switch. After that, it will not be
possible to activate the file reading panel from the main menu.
◇ For temporary halting the file reading process, use the
(Pause) button.
For removing the File reading panel during the temporary halt, select the View-File
reading panel main menu option. For restoring the file reading panel select this main
menu option again.
User manual — A-Line 32D
Chapter 3. Files
◇ For continuing the file reading, press the
25
(Continue) button.
After the end of file reading the File reading panel will disappear. The View-File
Reading Panel main menu option will also become unavailable.
Saving a data file
The program provides for automatic saving of measurement data performed once per
minute after the end of data retrieval and with the pause mode on. However, the forced
data save between these two events is possible. For this, select the File-Save main
menu option. The name of the file for storing the data will be specified when setting the
experiment parameters.
Opening an oscillogram file
Opening oscillogram files is similar to opening a data file excluding the following:
◇ For opening oscillogram files a File-Open OSC wave main menu option is used;
◇ Instead of the File Header window the OSC wave file header window, similar to the
File Header window, but containing additional information on oscillograms will appear.
The OSC wave file header is described in “Oscillogram file header” on page 28.
Saving an oscillogram file
Use the File-Save OSC main menu option for saving oscillogram files. In case the file
with such name already exists, the system prompts for rewriting the file. When pressing
the Yes button, oscillograms will be saved in the file specified. When pressing the No
button, the system will display the Save File dialog box, where it is necessary to specify
the new file name and press the Save button. In case the file with the name specified
does not exist it will be saved, otherwise, the system prompts to confirm the overwriting
of the selected file again.
Pay special attention to the fact, that oscillograms are saved only at operator’s request
(and not automatically like data files).
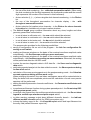
3.2. File header
The File Header dialog box will appear when opening a data file, (procedure described
on on page 24 ), or performing the filtering (operation described on on page 37).
Besides, you can open this window when a data file is loaded by using the File-Show
Header main menu option.
User manual — A-Line 32D
Chapter 3. Files
26
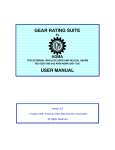
Fig. 3.2. File Header dialog box
The File header window contains data file information and control elements.
Data file information
◇ Most information displayed in the File Header dialog box is obtained from a data file.
It is divided into four groups.
• system stop reason – in the System stop reason field;
• initial size of the time scale – in the Initial time scaling fields;
• averaging time - in the Averaging interval field;
• time of the measurement start - in the Start time field; (Start time);
• time of the measurement end - in the Stop time field.
◇ The Measured data file options group contains information on the data file:
• file size - in the File size field;
• number of AEP, contained in the file – in the Pulses sum field;
• name of the source data file - in the Source data file name
• data source - in the File origin field:
• Source data file – for a data file, obtained in the result of measurement;
User manual — A-Line 32D
Chapter 3. Files
27
• Filtered data file - for a data file, obtained in the result of filtering;
• Location filtered data - for a data file, obtained after filtering in the result of
location;
• file name and number of location group - in the Loc.info field;
• whether the noise data was recorded - Noise data is present flag;
• whether the parametric channels data was recorded - Parameter channels data is
present flag;
• whether a pre-filter was used - Pre-filter was used flag. Pre-filter settings can be
viewed after pressing the Show pre-filter button.
◇ The Additional info group contains information on accompanying waveform OSC files
and configuration:
• whether an oscillogram file was recorded- OSC waves file was written;
• maximum number of oscillogram files – in the Max number of OSC wave field;
• name of the oscillogram file - in the OSC wave file name field;
• name of the configuration file - in the Configuration file name field.
◇ The General info group contains comments to a data file:
• object name - in the Object name field;
• operator’s name - in the Operator field;
• notes - in the Reference field;
• comments - in the Comments field.
Control elements
In addition to information on the data file the File Header dialog box contains a group
of switches, allowing to change the process of data loading, its representation and the
values of the adjustable parameters.
◇ When opening a data file use the following parameters to increase the loading and
viewing convenience.
• The offered averaging time can be changed in the Averaging interval entry field.
When the data level is high, we recommend increasing the offered value, since it
accelerates the loading process.
• The default initial size of the time scale can also be changed in the Initial time
scaling entry field.
• For your convenience, when viewing temporal diagrams, it is necessary to activate
the Scroll time switch. It makes it possible to visualize the time scroll bar on all
temporal diagrams. The width of the temporal window will correspond to the value
set in the Initial time scaling entry field.
• The Show diagrams on-line view switch makes it possible to build a diagram
based on the registered events and their parameters. Otherwise, the diagrams are
build on the basis of the data contained in the file.
• The Show result diagrams only switch allows building diagrams not during the
file loading, but after the end of it. This operation also decreases the loading time.
For viewing the data accumulation process and construction of diagram, reset the
Show result diagrams only switch. In this case, the File reading panel will
appear after loading the file and with its help it is possible to control the file reading
User manual — A-Line 32D
Chapter 3. Files
28
process. Working with the File reading panel is described in “File reading panel”
on page 24.
◇ The program provides for possibility of creating additional windows when opening a
data file.
• For creating the diagrams of threshold and amplification dependencies on time, set
the Show Threshold, [dB] / Time, [s] window and the Show Gain, [dB] / Time,
[s] switches.
• For calling the corresponding OSC file (in case it was recorded during the data
retrieval) use the Open OSC waves file switch.
◇ The program provides for possibility of using different system setup parameters at file
loading.
• Reading the channel color from the data file opened is permitted. For this, activate
the Read channel colors from the file switch. Otherwise, the colors from the
current configuration file will be used.
• Provisions are made for using the general system parameters, saved in the opened
data file, by setting the Read general settings from the file switch.
◇ By executing the File-Show header option and calling this window from the Filter View
field dialog box, the fields of the General info group become available for editing. For
saving the changes use the Save header button.
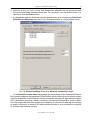
3.3. Oscillogram file header
The OSC wave file header dialog box will appear when opening an oscillogram file
(procedure described on page 25). Besides, this dialog box can be opened when an
oscillogram file is loaded, by using the File-Show OSC Header main menu option.
User manual — A-Line 32D
Chapter 3. Files
29
Fig. 3.3. OSC wave file header box
The following groups of the OSC wave file header window contain information on an
oscillogram file.
◇ The Measurement info group contains information on time parameters of the
experiment:
• experiment duration – in the Max measurement time fields;
• time of the experiment beginning – in the Start time field;
• time of the experiment end – in the Stop time field;
• name of data file obtained in the result of measurements – in the Source data file
name field. In case the data was not saved, the Data was not recorded message
will appear in this field.
◇ The OSC waves info group contains information on the number of oscillograms in
the file:
• the actual number of oscillograms taken – in the Real number of OSC wave field;
• the current oscillogram number – the Current OSD wave № spinner.
The current oscillogram selected will be displayed in the Oscilloscope : <N>. Digital
Oscilloscope: [ADC Scale/mkV/dB] / Time, [mks] window. At that, the self-scaling of
User manual — A-Line 32D
Chapter 3. Files
30
the oscilloscope window on the Y-axis will be performed according to the full ADC scale
or maximum of the current waveform (the Axis Setup Dialog dialog box). Calculation
and display of the current oscillogram frequency spectrum will be performed in the
data collection mode and displayed in the <N>. Spectral power: [(J*1e-26/kHz)^1/2] /
Frequen, [kHz] window.
◇ When opening an OSC file the program provides for possibility of using different system
parameter settings:
• Simultaneous reading of an OSC file and a data file is possible. For this, activate
the Open corresponding data file switch.
• Procedure of reading general system parameters saved in the oscillogram OSC file
being opened is available. For this, set the Read general settings from the file
switch. Otherwise, general parameters will be read from the current configuration
file.
◇ The General Info group contains comments to an oscillogram file:
• object name - in the Object name field;
• operator’s name - in the Operator field;
• notes - in the Reference field;
• comments - in the Comments field.
◇ The lower part of the OSC wave file header window contains the following information
on all the waveforms recorded:
• oscillogram representation color – the column with colored squares. In case the
whole large square is filled, it means assigning an individual channel color for this
very channel. In case a small square within the big square is colored, it means the
color assigned to an oscilloscope channel corresponds to the color selected for the
data collection channel.
• oscillogram number – in the N column;
• time of the waveform arrival (absolute, measured accurate within mcs) and the time
of the waveform relatively to beginning of the measurement – in the Time columns,
correspondingly. Time measurement accurate within mks is used for calculating the
acoustic wave velocity on an oscillogram.
• number of the channel, from which an oscillogram was recorded – in the Chan
column;
• window number (one out of eight), in which an oscilloscopic channel will be
displayed – in the Window coumn;
• digitization frequency of an oscilloscopic channel – in the Frequency quantization,
kHz column;
• number of points in an Oscilloscope frame – in the Number points column;
• oscilloscope scanning value – in the Duration, mks column;
• oscilloscope operation modes- in the Pre-triggering, Sync columns (detailed
description of the oscilloscope’s operation modes is given in “Oscilloscope channels
setup” on page 55);
• threshold value in dB – in the Threshold, dB column;
• threshold value in ADC units – in the Threshold, ADC bits column;
User manual — A-Line 32D
Chapter 3. Files
31
The information on oscillograms recorded will be represented in the view window and
displayed in parts. The total number of pages is specified in the Total field. For viewing
the next page it is necessary to press the Next button, and for returning to the previous
page – the Prev button. Every transition is followed by a window displaying the loading
process. For opening a file on arbitrary page use the Current page list. The number of
data lines displayed on a single page will be set in the General Setup dialog box.
When executing the File-Show OSC Header option the fields of the General Info
group will become available for editing. For saving the changes in the header, press the
Save header button.
This window can be closed by using the OK button. When opening an oscillogram
file, pressing the OK button will continue the data file loading, pressing the Cancel button
cancels loading.
3.4. Concatenation (data files concatenation)
When conducting different tests, often there are situations, when the need for merging
the data contained in several files exists. The program provides for this possibility. It allows
merging the unlimited number of files.
⚐
The files with starting time difference of not more than 48 hours can be merged.
At that, the time of the signal records time intervals in the files merged should
not intersect. Otherwise, the program displays a message specifying the names of
the files unsuitable for merging.
Select the File-Concatenation main menu option for data merging. After that the
Concatenation settings dialog box appears.
Fig. 3.4. Concatenation settings dialog box
User manual — A-Line 32D
Chapter 3. Files
32
◇ The names of the files merged should be specified in this dialog box.
• Adding files to the concatenation list will be performed by pressing the Add button
and random selection of the necessary files in the File open standard dialog box.
At that, every file added will be automatically arranged in a certain sequence in
the File name list with specifying the starting and the ending measurement time
depending on the signal registration time.
• For merging and selecting a multitude of files with similar names the program
provides for possibility of specifying files by using a pattern which uses the '?' or '*'
symbols, as described below in “Using a pattern”.
◇ For modification of the merged files list, the program provides for following possibilities:
• For deleting a selected file, press the Delete button. If no definite file was selected,
the total list will be deleted.
• For changing a selected file, press the Change button.
The abovementioned operations become available after selecting one of the files in
the concatenation list. Deletion and replacement operation will be performed for the file
selected.
◇ For assigning the name to a result file, press the press the Browse button. Then,
specify the name of the file for saving the merged data in the Save as standard dialog
box.
◇ After specifying the file names press the OK button. The Status bar will display the
process of file concatenation.
Using a pattern
For merging and selecting the multitude of files with similar names (e.g., the files of
the same experiment, recorded in different time) the program provides for possibility of
selecting files by using a pattern which uses the '?' or '*' symbols.
The '?' symbol substitutes any single symbol in the file name, the '*' symbol – any
number of symbols in the file name. Thus, the Data?1 pattern corresponds to the files
Data01, Data 11, DataB1 etc. The Data* pattern corresponds to files Data, Data1, Data
123, DataCB etc..
◇ Use the Assign button in the Pattern group for setting a pattern in the concatenation
window. Select a source file for crating a pattern in the opened File open standard
dialog box. Note that when necessary, the selected pattern can be edited.
◇ For filling in the list press the In list button. The file names satisfying the pattern and
not intersecting in time will be added to the File name list. Otherwise, a message
specifying the names of the files unsuitable for merging will be displayed.
◇ Activate the Confirm switch for confirming the file inclusion to the concatenation list
and then press the In list button. After that, every time when the Acknowledgment of
accompaniment of file dialog box appears, press the Yes button for file inclusion to
the concatenation list or press the No button. When selecting the Cancel option, the
program stops viewing the following file list. The previously selected files will remain
in the list.
◇ After selecting the files for concatenation with the help of a pattern, you can specify
the name of the result file. For this, use any of the following methods:
User manual — A-Line 32D
Chapter 3. Files
33
• press the In result button. The name of the result file offered by the program will be
specified in the Result files field. It will be composed from the name of the pattern
specified, including the differing parts for every merged file.
• select one or several files in the File name list. Then press the In result button. The
name of the result file will be displayed in the Result files field. It will be composed
of the name of the pattern specified, including the differing parts for every merged
file.
✱
In most cases a digit after '#' is substituted in the pattern for '*'. E.g., if you
specify ...#0* (#1*, #2*...) in the pattern, the program will select the files for merging
from ..#00 (..#10, ..#20) to ...#09 (..#19, ..#29..) correspondingly.
3.5. Project
In order to increase the convenience of working with files the program provides for
creating a project combining different file types (data files, oscillograms, location, velocity
measurement, load, settings), related to the examined object.
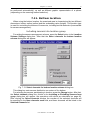
Creating a project
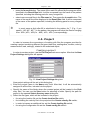
In order to create a project, use the File-Project main menu option. After that the New
Project Settings dialog box will appear.
Fig. 3.5. New Project Settingsdialog box
New project settings will be set in this dialog box.
◇ Enter the project name in the Name entry field. After that, it will be automatically
assigned to all the files, included into the project.
◇ Specify the name of the folder where the created project will be located in the Path
entry field. You can use the View button for selecting a folder. Specify the path for
project in the opened Select directory name dialog box.
◇ Select the file types, which will be included in the project:
• for using the location file set the Create location file switch;
• for including the velocity file in the project set the Create velocity file switch;
• in order to impose an additional line set the Create loading file switch;
• for using the configuration file set the Create config file switch.
User manual — A-Line 32D
Chapter 3. Files
34
Press the Create button to create a project, after that, the project window will appear.
For canceling the entered setting press the Cancel button.
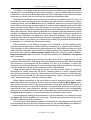
Project Work Space
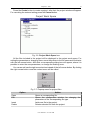
Fig. 3.6. Project Work Space box
All the files included in the project will be displayed in the project work space. For
setting the parameters or changing them, move the pointer to the file name and click twice
with the left mouse button. After that a corresponding dialog box will appear, where it is
possible to enter the new parameters, or change the existing ones.
You can as well use the right mouse button instead of the left mouse button. By clicking
the right mouse button once the context menu will be called.
Fig. 3.7. Popoup menu for project files
Option
Open
Edit
Insert
Delete
Action
Opens a corresponding file.
Opens the configuration window for changing the
parameters of the corresponding file type.
Adds new file to the project.
Deletes selected file from the project.
User manual — A-Line 32D
Chapter 3. Files
35
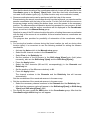
Controlling the project work space
For opening an earlier created project use the File-Open project main menu option.
After that the project work space appears, which can remain open during the data retrieval.
It allows entering the necessary changes during the measurements.
For temporary closing the project work space use the View-Project Work Space main
menu option. For restoring - select the View-Project Work Space main menu option
again.
When necessary close the project work space by using the File-Close project main
menu option.
✶
✶
User manual — A-Line 32D
✶
Chapter 4. Data processing
36
Chapter 4. Data processing
✻
Chapter “Data processing” describes operations on data - filtration, classification,
printing and exporting.
4.1. Data filtering
Filtering parameters
The program allows performing data filtering after the following parameters:
◇ AEP number one after another - Number;
◇ AEP arrival time - Time, [s];
◇ channel number - Channel;
◇ AEP maximal amplitude (expressed in conventional units or decibels) - Amplitude,
[ADC] / [dB];
◇ AEP energy (expressed in joles or decibels) – Energy, [J] / [dB];
◇ AEP duration - Duration, [mcs];
◇ AEP rise time - Rise Time, [mcs];
◇ number of AEP threshold crossings (counts) - Counts;
◇ average AEP frequency (counts / duration) - Counts / Dur., [kHz].
In addition to filtering after parameters you can perform filtering after optional flags:
◇ AEP maximal amplitude exceeds ADC maximal value - Flag A;
◇ AEP duration exceeds maximum level - Flag D;
◇ AEP has corresponding waveform saved - Flag О.
After performing location filtering additional parameters becomes available:
◇ location coordinates - Loc. X, [mm], Loc. Y, [mm] and Loc. Z, [mm] (for 3D location
only);
◇ location amplitude - Loc. Amplitude, [dB];
◇ on the basis of the fact that an event was simultaneously located in different location
zones - Loc.****;
◇ clustering results - Locations per cluster (filtering of such location events, the number
of which in a cluster fits the set range).
Except the data filtering after parameters the program provides for more complex
filtering algorithms.
◇ Filtering after a formula, reflecting some functional dependency (linear, logarithmic
etc.) of two parameters of every AEP.
◇ Filtering after the region.
◇ Filtering of synchronous interference.
◇ Filtering AEP packs.
User manual — A-Line 32D
Chapter 4. Data processing
37
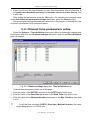
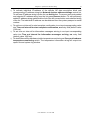
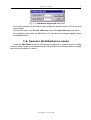
Filter and review window
For viewing the data in the text mode, select the File-Filter and review main menu
option. Then, select an ALD data file to view and filter in the Open File standard dialog
box, and press the Open button. Then the File Header dialog box will open. By selecting
the OK button in this dialog box, a file loading status window will be displayed. By selecting
the Cancel button, the loading will not be performed.
Fig. 4.1. File loading process
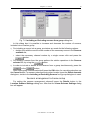
After the end of loading a window for viewing the file in the text form, where the data
contained in the file will be represented appears. For viewing and filtering the currently
opened file, use the File-Filter current file main menu option.
Every line in the view window corresponds to one AEP. The name of the file will be
displayed in the window title. For better visualization the channel numbers are duplicated
by colors.
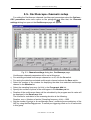
Fig. 4.2. Filter and Review box
The data in the window for file viewing in the text mode is displayed in pages. The total
number of pages in the file is shown in the Total field. For viewing the next page of the
data, it is necessary to press the Next button, and for returning to the previous page –
the Prev button. Every transition is followed by a window, displaying the loading process.
For opening a file on arbitrary page, use the Current page list. The number of data lines
displayed on a single page will be set in the General Setup dialog box.
User manual — A-Line 32D
Chapter 4. Data processing
38
◇ For sorting the data after some parameter within one page, press the button with this
parameter’s name in the events list header. The order for data sorting (increase or
decrease) can be changed by pressing this button repeatedly. You can change the
width and the order of columns by using the mouse.
◇ For loading the viewed data file in the program’s graphics window interface, use the
Open button. At that, the window for viewing the file in the text mode will remain open.
◇ File header can be viewed after pressing the Header button. After that, the File Header
window, described in “Opening a data file” on page 24 will appear.
◇ The program provides for possibility of loading a new data file for viewing and filtering
without closing the view window. For this, press the Load new button, select the
necessary file in the Open file dialog box, and press the Open button. After that, press
the OK button in the File Header dialog box.
◇ The data filtering can be performed by two methods: using the program filtering function
and deleting the AEP strings manually.
• For performing filtering with the help of the program, press the Filter button in the
view window. More detailed information on setting the filtering conditions can be
found below in “Filtering”.
• For manual AEP deletion, select the necessary AEP string and press the Delete
button. For highlighting several lines, you can use the mouse or cursor buttons in
combination with the [Ctrl] and the [Shift] buttons. If you want to save the data file
with changes made, press the Save as button and specify the name of the file for
saving the data in the Save file standard dialog box.
◇ The program provides for possibility of moving the highlighted lines to other Windows
application thru the Clipboard ([Ctrl-C], [Ctrl-V] key combinations).
The file view in the text mode window can be closed by pressing the Close button in
this window.
Filtering
For performing the filtering, press the Filter button in the view window. After that the
Filter Settings dialog box will appear.
User manual — A-Line 32D
Chapter 4. Data processing
39
Fig. 4.3. Filter Settings dialog box
In this dialog box it is necessary to set the filtering conditions.
◇ Set the filtering criteria.
• Select the parameter for performing the filtering in the Parameter list.
• Specify the lower and the upper limit of the filtered parameter range in the Greater
or equal than and Lower or equal than entry fields.
You can set up to three filtering ranges for every parameter.
Simultaneous filtering after several criteria (from one to four), combined by "AND" or
"OR" logical conditions is permitted.
◇ Select the action on AEP records, satisfying the specified criteria in the Action group.
• Set the Delete record(s) that meets criteria switch for deleting the data.
• Set the Keep record(s) that meets criteria switch for saving the data.
◇ When necessary, set the additional filtering parameters.
After selecting all the necessary filtering conditions press the ОК button. Specify the
name of the file for saving the filtered ALD data in the Save File dialog box. After that, a
window displaying the filtering process will appear.
After the end of filtering the program prompts for substituting the data in the view
window by the data obtained in the result of filtering.
User manual — A-Line 32D
Chapter 4. Data processing
40
Fig. 4.4. Data substitution query
After pressing the Yes button, the data will be updated. In case you do not need to
update the data, press the No button.
In case you need to continue the process of data filtering after other parameters, press
the Filter button again. Set the new filtering conditions (or the ones you used before) in
the opened Filter Settings dialog box and perform the filtering.
The program provides for possibility of saving and calling 20 set and used filtering
conditions during the program operation. After performing just a single filtering process
the
button will be available in the Filter Settings dialog box. It allows returning
to previous filtering conditions. After the filtering process was performed several times,
the
button will be available, allowing calling the next filtering conditions relative to
examined conditions. For changing the previously set filtering criteria press the Clear
button, and then enter the new criteria.
Formula filtering
The program provides for possibility of file filtering after the formula reflecting some
functional dependency (linear, logarithmic etc.) of two parameters of every AEP.
In general, the formula for dependency between two AEP parameters has the following
form:
Parameter1 {Relationship} (a±delta а) х Function(Parameter2 ) + (b±delta b)
where:
◇ Parameter1 and Parameter2 are the AEP parameters;
◇ Relationship - ordering relationship (equal, more, less, more or equal, less or equal);
◇ a±delta a and b±delta b - coefficients;
◇ Function – the function (×, /, lg, ln, exp) determining the relationship.
For performing filtering after the formula set the Apply formula filtering switch in the
Filter Settings dialog box, select the "AND" or "OR" logical condition and set the formula,
reflecting the dependency of two AEP parameters in the group of filtering after the formula
parameters.
When setting the formula it is necessary to:
◇ select the AEP parameters in the Parameter lists;
◇ select the ordering relationship in the corresponding list;
◇ - select the function type in the corresponding list;
◇ enter the value coefficients in the a, b, delta a, delta b entry fields.
User manual — A-Line 32D
Chapter 4. Data processing
41
Filtering after region
The program provides for possibility of performing the filtering after a region/polygon
(region – is an area limited not only by straight lines, but also by arbitrary curves). This
filtering type is applicable for correlation plot windows only (creation of correlation plot
windows is described in “Windows manager” on page 72).
Prior to conducting filtering after the region it is necessary to select the region in the
corresponding window graphically by performing the following actions:
◇ activate the window (if it is not active);
◇ press the
("Polygon/Region") button on the Toolbar;
◇ draw a broken line fixing its vertices by clicking the left mouse button or draw an
arbitrary line by moving the mouse with the left button pressed;
◇ enclose the region by placing the last point of the curve about the first point or by
clicking the right mouse button in any place (at that the junction of the first and the last
point will be performed automatically).
After the graphic selection of the region it is necessary to call the Filter Settings dialog
box, set the Apply region filtering switch and select "AND" or "OR" logical condition.
Filtering of synchronous interference
For deleting/saving synchronous interference (inducing) it is necessary to set the
Apply synchronous interference filtering switch in the Filter Settings dialog box, select
the "AND" or "OR" logical condition and enter the maximum difference of the arrival time
in the Arrival time max difference, [mcs] entry field.
Note that usually the synchronous interference (inducing) for linear location type will
be displayed on location diagrams in the form of columns located in the middle between
the sensors. For plane location type they will be displayed either in the form of a point
located in the center of a triangle (when noises arrive at three sensors), or in the form
of a line, perpendicular to a triangle’s side (when noises arrive at two sensors only).
After filtering these columns/points (lines) will disappear. Contrary to similar filtering in the
location filter, this noise is distinguished by the arrival time differences on all channels at
once, irrespective of location groups.
⚐
This filtering type is applicable to data files, containing information on total
number of events (i.e. obtained by version 4.56 or later) only. In case the file
header does not contain this information, it is necessary to perform the preliminary
filtering of this data file after any parameter, actually deleting nothing (e.g., delete
the "Amplitude, dB” from 1 to 2 dB).
Filtering AEP packs
The program provides for possibility of performing the AEP packs filtering (AEP pack
is a sequence of pulses, not less than two, which have arrival time difference that does not
exceed the time interval set). For performing the AEP packs filtering set the Apply AEpulses pack filtering switch in the Filter Settings dialog box; select the "AND" or "OR"
logical condition and set the parameters of the AEP pack. For this, press the Parameters
button. After that, the Parameters of AE-pulses pack dialog box will open.
User manual — A-Line 32D
Chapter 4. Data processing
42
Fig. 4.5. Parameters of AE-pulses pack dialog box
◇
◇
◇
◇
Set the AEP pack parameters in this dialog box.
The Filter action group displays operations with pulses, set in the Filter Settings
dialog box.
Set the criterion for the pack selecting in the Pack selecting parameters group.
• Enter the value of the AEP pack duration in the Duration of AE-pulse pack, [mcs]
entry field.
• Specify the value of dead time in the Dead time, [mcs] entry field (dead time is
counted from the moment of the pack’s duration end).
• Set the amplitude value of the start AEP in the Start pulse amplitude not less
than, [dB] entry field.
Set the criterion for the start pulse channel of the pack in the Start pulse channel
group.
• Use the Anyone switch, or the From the list switch for selecting a channel. When
activating the last switch it is necessary to enter the number and/or channel ranges
in the corresponding entry field.
Set the criterion for pulses forming the pack in the Pulses belonging to pack group.
• In case of pack includes all the AEP, use the All pulses switch.
User manual — A-Line 32D
Chapter 4. Data processing
43
• In case of pack is formed from the first AEP on every channel, activate the The first
pulse in each channel switch.
• In case of pack is formed from the AEP with maximum amplitude on every channel,
use the Pulse with maximum amplitude in each channel switch.
• When filtering a pack of pulses, there is a possibility for leaving only the first
(starting) pulse of the AE pack. For this, use the The first (start) pulse channel
switch. The other pulses of the pack and the pulses not belonging to the packs will
be deleted from the file.
After setting the parameters press the OK button. For canceling the changes, press
the Cancel button.
Filtering of incorrect started pulses
For deleting/saving of incorrect started pulses coming immediately after one finished
by Maximal duration reason and equipped by corresponding optional flag "D" it is
necessary to set the Apply AE-pulses, coming directly after duration exceeded flag,
filtering switch in the Filter Settings dialog box, select the "AND" or "OR" logical
condition.
Additional filtering parameters
You can set the additional filtering parameters in the Filter Settings dialog box of the
Advanced Filtering group.
◇ For deleting the data from parametric channels, contained in a data ALD file, set the
Delete parameter channels' data switch.
◇ For deleting the noise, command and service controller data from the ALD file, set the
Delete noise, command and controller data switch.
In case this window was called for setting the prefiltering parameters, the Pre-filter
action group will become available.
◇ Set the Don't save deleted pulses in data file switch to prohibit saving the AEP, which
did not pass through prefiltering.
◇ Set the Don't paint and process deleted pulses switch, in order not to display the
deleted AEP on the diagrams and exclude them from the data taking part in location.
4.2. Classification
ALine 32D software products allows classification of AE sources after the danger
level on the basis of Russian Government Standards or European Union Standard (only
for amplitude criterion). According to the RS (Russian Standards of GosTechNadzor
PB03-593-03), the discovered and identified AE sources are divided into four classes.
✧ I class source - passive source;
✧ II class source - active source;
✧ III class source – critically active source;
✧ IV class source – catastrophically active source.
According to the EN 14584:2005 standard the discovered and identified AE sources
are divided into three classes.
✧ I class source - minor source. No further action shall be necessary.
User manual — A-Line 32D
Chapter 4. Data processing
44
✧ II class source - active source. Further NDT shall be recommended if the source is
associated with specific parts of the pressure equipment;
✧ III class source – very active source. Further evaluation by other appropriate NDT shall
be carried out before the pressure equipment goes into service;
The program allows using different criteria for dividing sources into classes.
Amplitude criterion
✱
RS amplitude criterion
◇ IV class - A ≥ А critical , NА > А critical ≥ N upper critical
◇ III class - A ≥ А critical , NА > А critical < N upper critical
◇ II class - A < А critical , NА < А critical ≥ N lower critical
◇ I class - A < А critical , NА < А critical < N lower critical
where А is the registered location amplitude of the AE source;
А critical - critical value of the parameter (set by operator);
N upper critical. - upper critical of the parameter value (set by operator);
N lower critical - lower critical of the parameter value (set by operator);
NА > А critical - the number of registered events with location amplitude higher
than the critical value;
NА < А critical - the number of registered events with location amplitude lower
than the critical value;
EN amplitude criterion
◇ III class - A ≥ А 1 , NА ≥ А 1 ≥ N 1
◇ II class - A ≥ А 2 , NА ≥ А 2 ≥ N 2
◇ I class - A ≥ А 2 , NА ≥ А 2 < N 2
where А is the registered location amplitude of the AE source;
А 1 - first critical value of the parameter (set by operator);
А 2 - second critical value of the parameter (set by operator);
N 1 - first critical of the parameter value (set by operator);
N 2 - second critical of the parameter value (set by operator);
NА ≥ А 1 - the number of registered events with location amplitude higher than
the first critical value;
NА ≥ А 2 - the number of registered events with location amplitude lower than
the second critical value;
Prior to using the amplitude criterion for identification of the AE source danger level
the location window should be open. Then select the Classification-Amplitude criterion
main menu option. After that, the Amplitude criterion setup dialog box will open. To
classify AE sources in terms of RS (PB 03-593-03) or EN 14584:2005 standards it is
User manual — A-Line 32D
Chapter 4. Data processing
45
necessary to select PB 03-593-03 or EN 14584:2005 radiobutton accordingly in the
Criterion variant according... group.
Fig. 4.6. Amplitude criterion setup in PB03-593-03 terms dialog box
Fig. 4.7. Amplitude criterion setup in EN 14584:2005 terms dialog box
In this dialog box it is necessary to set the parameters necessary for identification of
the AE source danger level.
◇ Activate the Show classification results switch for displaying the results of the AE
sources classification in the location window.
◇ Enter the corresponding values in the A critical [dB], N lower critical, N upper critical
entry fields in terms of the RS or in the A1 [dB], A2 [dB], N1 and N2 entry fields in
terms of the EN.
User manual — A-Line 32D
Chapter 4. Data processing
46
After setting the parameters press the OK button, for canceling the selected
parameters press the Cancel button. Classification results will be displayed in the location
window.
Locally-dynamic criterion
✱
This criterion characterizes the process of defects development in time
depending on the loading parameter, i.e.
n
N ≃ α p(t)
where N is the number of registered events;
p - loading parameter;
n - exponent.
In this case the danger level of the AE source, according to RS, is classified
in the following way:
◇ 0 > n > 1 - danger source of the I class;
◇ n ≃ 1 - danger source of the II class;
◇ 1 > n > 6 - danger source of the III class;
◇ n ≥ 6 danger source of the IV class.
Note that comparing with the amplitude criterion the locally-dynamic criterion is
not connected with location.
Prior to using the locally-dynamic criterion for identification of the AE source danger
level the ALD data file should be open. Then open the loading file (for this use the WindowAdditional lines main menu option). After that, you can use the locally-dynamic criterion
by selecting the Classification-Locally-dynamic criterion main menu option.
Then the Locally-dynamic criterion power n / Time, [s] window will open, where
time will be laid on the Х-axis, exponent of the locally-dynamic criterion - on the Y-axis (to
the left), loading parameter value – on the Y-axis (to the right). Defects classification will
be performed in the right part of the window.
S-H Diagram
✱
Description and use of this criterion is given in RS (Regulations for organization
and performance of acoustic emission testing of vessels, devices, boilers and
industrial pipelines).
Prior to using the S-H diagram for identification of the AE source danger level the ALD
data file should be open. Then use the Classification – S-H diagram main menu option.
After that, the File Header dialog box will open for reading the data file.
After the end of the data loading, the S-H Diagram window will open, where a
single point, being the result of calculations performed by the program, will be displayed.
Depending on its position classification of the AE source danger level according to RS
will be performed.
User manual — A-Line 32D
Chapter 4. Data processing
47
4.3. Printing
For printing the data use the File-Print main menu option. After that the Print Setup
dialog dialog box will appear.
Fig. 4.8. Print Setup dialog dialog box
◇
◇
◇
◇
◇
Print settings will be set in this dialog box.
Number of diagrams placed on a single page can be selected by 1, 2 and 4 switches
in the Number of graphs per page group for one, two and four diagrams accordingly.
Number of copies will be set by the Number of Copies spinner in the Copies group.
The program allows printing from one to ninety-nine copies.
Prints will be collated by setting the Collate copies switch in the Copies group.
The Header and the Footer entry fields in the Header and Footer group are used for
entering the header and footer values, correspondingly. The use of the Clear button
will lead to header and footer deletion.
You can select the diagrams for printing in the Available Graphs list. For this,
provisions for several methods are made.
• Double-click with the mouse on the name of the necessary diagram.
• Select the necessary diagram by clicking on it with the mouse and press the
button.
• For printing all the diagrams use the
button.
• Deletion from the list of printed diagrams will be performed similarly, i.e. by using the
and
buttons correspondingly, and also by double-clicking in the Graphs
to print list.
User manual — A-Line 32D
Chapter 4. Data processing
48
To start printing press the ОК button, to cancel the selected settings – press the Cancel
button.
Printer setup
Printer setup will be performed by selecting the File-Printer Setup main menu option.
Fig. 4.9. Printer Setup
Then, the following can be selected in the Printer Setup dialog box:
◇ printer type;
◇ paper size and orientation;
◇ other printer-specific parameters.
Making a screen copy
In some cases, it may be necessary to make a screen copy and edit it in some other
application.
For this, perform the following:
◇ activate the window, the image of which you want to obtain;
◇ set the necessary windows parameters (colors, scale, grid, dimensions);
◇ press the Alt-Print Screen key combination;
◇ open the graphics editor (or other application);
◇ use the Edit-Paste option.
4.4. Data export
A-Line32D software product allows converting (exporting) its data and oscillogram files
to the text format, which can be used for working with other applications.
Exporting ALD data files
Data files conversion will be performed in the following way.
◇ Select the File – Export ALD Data main menu option.
User manual — A-Line 32D
Chapter 4. Data processing
49
◇ Select a data file in the opened Open File dialog box and press the Open button.
◇ Specify the name of the file for recording the exported data in the next Save File dialog
box and press the Save button.
The indicator displaying the data conversion process will appear on the screen.
Fig. 4.10. Data conversion process
After the end of conversion this data box will disappear. Conversion time depends on
the data volume in the file, therefore larger files may require more time for this process.
Exporting oscillogram files
Conversion of oscillogram files is similar to conversion of data files.
◇ Select the File – Export OSC Data main menu option.
◇ Select an oscillogram file in the opened Open File dialog box and press the Open
button.
◇ Specify the name of the file for recording the exported oscillograms in the next Save
File dialog box and press the Save button.
The indicator displaying the oscillogram conversion process will appear on the screen.
After the end of conversion this data box will disappear. Conversion time depends on the
number of oscillograms in the file, therefore, for large quantity of oscillograms this process
may require more time.
✶
✶
User manual — A-Line 32D
✶
Chapter 5. System Parameters Setup
50
Chapter 5. System Parameters Setup
✻
Chapter “System Parameters Setup” tells how to configure the system.
5.1. Saving and loading configuration files
For opening a configuration file select the Filе – Ореn Config main menu option.
After that the Open File dialog box will appear, where it is necessary to select the file
configuration and press the Open button.
For saving a configuration file, use the File – Save Config main menu option. In
case the file with the name specified already exists, the system prompts for rewriting the
file. When pressing the Yes button the settings will be saved in the file specified. When
pressing the No button, the system displays the Save File dialog box, where the new
file name should be specified. After that press the Save button. In case the file with the
name specified does not exist, it will be recorded, otherwise the system prompts to confirm
overwriting of the selected file.
Provisions are made for saving the new measurement settings (such as
time parameters, saving parameters, pre-filter parameters, general information) and
postprocessing windows settings in a configuration file. Use the File-Save Config main
menu option for saving these settings, and the File – Open Config main menu option for
calling the previously saved settings.
5.2. General information
The main menu has the following options for setting the channel parameters:
◇ Options – Channels parameters;
◇ Options – OSC parameters;
◇ Options – Time definition;
◇ Options – Calibrator parameters (for DDM systems type only);
◇ Options – Parameters settings.
The Options – Channels parameters and the Options – OSC parameters main
menu options are also duplicated by pictographic menu buttons. After selecting one of
these options the Channels settings dialog box, opened at the corresponding Main
Settings, Oscilloscope, Time Definitions, Calibrators settings (for DDM systems type
only), Additional settings (for PCI systems type only) or Parametric Inputs page will
appear.
The Channels parameters dialog box is multipage. It is used for the main channels
parameters setting for the AEP registration (Main Settings and Time Definitions page),
oscilloscopic channels parameters (Oscilloscope page), calibrators settings(Calibrators
settings page), preamplifier gains settings (Additional settings page) and parametric
channels settings (Parametric Inputs page).
User manual — A-Line 32D
Chapter 5. System Parameters Setup
51
The data on every page is represented in the listview window by a number of lines with
indicating the corresponding line and channel number. In case a window opened contains
a scroll bar, it means, that all the data does not fit the visible part of the screen and when
necessary you should use the scroll bar for selecting the necessary data.
Working with data begins from selecting a line (block or separate lines). For this, it is
necessary to move the pointer to the necessary line and click the mouse button. When
selecting a block, use the Shift button and, by holding it, select the first and the last lines
of the data in the block as described above. In order to select separate lines use the Ctrl
button and the mouse pointer. Move the pointer to a line and click the left mouse button.
After selecting a line the data of parametric channels will be displayed in the corresponding
dialog box elements. When selecting data block or separate lines the parameters values
will also be displayed in the dialog box elements, in case these values are equal for all
the channels. Otherwise, the parameter value will not be available. Note, that it is not
necessarily the case for after selecting a line (block or separate lines) and displaying the
parameter values in the display box elements the display box elements themselves will
be activated (i.e. available for correcting the data).
Data correction on the dialog box page is not available in the file reading mode,
excluding several parameters, related to the results display (e.g., channel color selection).
This procedure is only available during the preparation for data collection mode and in the
data collection mode after the hardware have been powered. The hardware power will be
performed after calling the Measurement details dialog box for the first time (Control –
New measurement option) and after the operator confirms the "Attention! Turn power
on?" command.
After hardware powering and selecting the data (line, block or separate lines) all the
dialog box elements (lists, entry fields, spinners), located in the lower part, will be available
and correction of parameters will be available. For this, it is necessary to select the
necessary value of some parameter in the corresponding dialog box element, after which
it will be assigned to all the similar parameters of the data selected.
Using the spinners for changing the data in the selected line leads to increasing/
decreasing its values within the set limits. Changing data in a block (selected lines)
with different parameter values by using a spinner will be performed in a following way:
increase will be performed from the minimum parameter value in the block (in selected
lines), and the decrease – from the maximum value.
When making corrections in the entry fields in case of erroneous data entry, default
parameter values can be restored. For this, clear the entry field (Del or Back Space keys),
after which the initial value of the given parameter for the data selected will appear in
the data view window. In case after entering the new parameter value the mouse pointer
was moved to any other dialog box element, it will be assigned to the corresponding
parameters in the data selected (in case of allowable value of the parameter entered), or
the Input error will appear (in case of exceeding the allowable value range).
For simultaneous setting of the parameters on all the channels, it is necessary to use
the Select all button, available on every page. Then set the parameters values, which
should be assigned to all the channels.
For switching to other dialog box pages it is necessary to move the mouse pointer to the
corresponding inlay and click the left mouse button (or use the Ctrl+Tab key combination).
Channel (channels) selection will be saved when switching to other pages.
User manual — A-Line 32D
Chapter 5. System Parameters Setup
52
After setting the parameters on all the pages, press the OK button. For canceling,
press the Cancel button. Note that the Cancel button cancels changes on all the pages.
5.3. Setting the main channel parameters
For setting the main channel parameters select the Options – Channel parameters
main menu option or press the button
on the Toolbar. After that the Channels settings
dialog box, open at the Main settings page will appear.
Fig. 5.1. Channels settings dialog box, Main settings page
Main channel parameters will be set at this page.
◇ Switch on/off the channels and display of the data from these channels by On and
Show switches correspondingly.
◇ Frequencies for the high frequency filter (HPF) and the low frequency filter (LPF)
should be selected in the HPF, kHz and the LPF, kHz lists in the Filters group
correspondingly (for DDM systems type only). Frequency belt filter (HPF - LPF) should
be selected in the HPF, kHz LPF, kHz lists in the Filters group correspondingly (for
PCI systems type only).
Note that when selecting the frequencies for the HPF and the LPF it is necessary to
take into consideration the fact that the value of the frequency for the LPF, should be
at least twice more than the frequency value for the HPF. In case this condition is not
met, the program will change the frequency values independently.
◇ Amplification on channels should be set by the К, dB spinner in the Gain group (for
DDM systems type only).
Changing the amplification coefficient values will also lead to changing the threshold
values. This follows from the formula, connecting these values:
Threshold[dB] = 20 lg (Threshold[ADC units]*D/Support) - Gain, dB,
where
User manual — A-Line 32D
Chapter 5. System Parameters Setup
53
D - is the parameter defining the channel’s ADC,
Support - basic scale value for conversion of the obtained values of the AEP amplitude
to dB. The value of this parameter will be set in the General settings dialog box
(Options – Settings).
At that, in case the dB switch the Threshold group is activated, the system will be
trying to select such a value of the ADC units, for which the threshold value in dB would
remain the same as before, as much as possible.
When activating the ADC bits switch, the threshold value in the ADC units will
remain unchanged, and the threshold value in dB will change after the corresponding
recalculation performed by the program.
◇ By using the spinner, set the discrimination threshold in the Threshold group.
When activating the dB switch the change of the threshold value will be represented
by two values – a fractional value and an integer quantity (integer quantity specified
in brackets). Such a representation of the threshold in dB value change will be related
to operation of the program, which will be selecting the value of the threshold in ADC
units in such a way, that the sampling increment would be equal to ~1dB (this value
specified in brackets). The fractional value will display the value, maximally close to the
value in brackets from among those available. When activating the ADC bits switch,
the sampling increment will be equal to 1 ADC unit.
◇ The program provides for possibility of assigning the threshold value automatically.
For setting the autothreshold mode, activate the Auto switch in the Threshold group.
This switch will be available in the On-Line mode only. After that, the threshold value
selected by the program will be automatically assigned to all the channels. The process
of assigning the autothreshold value will be described below. In order to select the
autothreshold mode you can as well use the Control – AutoThreshold main menu
option or the button
on the Toolbar.
After setting the parameters, press the ОК button. From this moment, the values set
will come into force. For canceling the parameters setting, press the Cancel button.
For applying the new parameters without exiting the Channels setting dialog box the
Apply button is used.
◇ For changing the color for displaying the obtained data on channels, use the Color
button.
The color will be selected with the help of the Color standard dialog box.
Setting the autothreshold parameters
For setting the autothreshold value, press the Details button in the Threshold group.
After that the Auto threshold parameters settings dialog box will appear. In this dialog
box set parameters for specifying the autothreshold value.
◇ Use the Noise pack buffer length spinner for setting the noise packs averaging buffer.
◇ Set the threshold value exceeding the average noise level in the Install threshold,
that exceeds averaged noise level by field in dB.
◇ Enter the minimum threshold value in the Minimum threshold level field in ADC bits.
◇ Enter the value of the threshold increase per second under condition of the noise packs
absence in the In case of the noise packs absence increase threshold level by
field in dB.
User manual — A-Line 32D
Chapter 5. System Parameters Setup
54
◇ Enter the value of the new threshold, in case this value differs from the previous in
the Install new threshold level only if it exceeds old one not less than by field
in ADC bits.
After setting the parameters, press the OK button. For canceling the changes made
in the Auto threshold parameters settings dialog box, press the Cancel button.
We recommend keeping the parameter values set in the program, excluding the case
of specific peculiarities of the examined object.
5.4. Channel time parameters setup
Select the Options – Time definitions main menu option for setting the channel time
parameters. After that, the Channels settings dialog box, open at the Time definitions
page will appear.
Fig. 5.2. Channels settings dialog box, Time definitions page
Channel time parameters will be set at this page.
◇ Enter the value of the SCETO parameter in the SCETO entry field in mcs.
◇ Enter the value of the Dead time parameter in the Dead Time entry field in mcs.
◇ Enter the value of the Maximal duration parameter in the Max. Duration entry field
in mcs.
⚐
For all the time constants (SCETO, Dead time, Maximal duration) the value
range changes from 1 to 65535 mcs.
User manual — A-Line 32D
Chapter 5. System Parameters Setup
55
5.5. Oscilloscope channels setup
For setting the Oscilloscope channels (oscilloscope) parameters select the Options –
OSC parameters main menu option or the pictogram
. After that, the Channels
settings dialog box open at the Oscilloscope page will appear.
Fig. 5.3. Channels settings dialog box, Oscilloscope page.
◇
◇
◇
◇
◇
◇
◇
Oscilloscope channels parameters will be set at this page.
For switching selected oscilloscope channel on or off, use the On switch.
For saving the data from selected oscilloscopic channel activate the Save switch.
Select the number of the window for displaying the data from selected oscilloscope
channel in the Window list.
Select the sampling frequency (in kHz) in the Freq.quant, kHz list.
Specify the number of points in the oscillogram in the Number pts list.
Duration of the oscilloscope frame will be calculated by the program and its value will
be displayed in the Durat.,mcs field.
The formula for calculation of the scanning duration is the following:
Duration, mcs = (Number of points / Sampling frequency, kHz) × 1000
Set the number of points in an oscilloscope frame, containing some prehistory of the
AEP by using the Pre-Trig spinner. To switch pre-triggering mode on or off use switch
in this group.
User manual — A-Line 32D
Chapter 5. System Parameters Setup
56
◇ Set the type of oscilloscope channel synchronization by selecting corresponding string
in the Sync listbox (for PCI systems type only).
Available synchronization modes are:
• async - asynchronous mode: all channels start independently;
• master - master mode: selected channel starts by himself and starts all slave
channels synchronously;
• slave - slave mode: selected channel starts only in case of any master channels
starts synchronously;
• master/slave - master/slave mode: selected channel acts as master and slave
simultaneously;
◇ The oscilloscope individual threshold will be specified in the Threshold group.
• Set the value of the oscilloscope threshold by using the spinner in the Threshold
group, similar to as described for the Main Settings page.
• In case the oscilloscopic channel threshold value corresponds to the corresponding
AE data channel value, activate the Channel threshold switch in the Threshold
group.
After that, the threshold value in the Threshold, dB and the Threshold, ADC bits
columns in the view field will be displayed in brackets.
◇ For changing the color for displaying the data obtained on oscilloscopic channels, use
the Color button. The color will be selected by using the Color standard dialog box.
◇ For representing the oscilloscopic channel data in the same channel's color as the data
of the corresponding AE data channel, activate the Channel color switch.
After activating it, it will not be possible to change the color of the selected oscilloscopic
channel on the OSC page by using the Color button. When it is necessary to change
the colors, return to the Main settings page and select the necessary color by using
the Color button, or reset the Channel color switch at the OSC page.
5.6. Setting the parametric channels
For setting the parametric channels select the Options – Parameters settings main
menu option. After that, the Channel settings dialog box, open at the Parametric inputs
page will open.
User manual — A-Line 32D
Chapter 5. System Parameters Setup
57
Fig. 5.4. Channel settings dialog box, Parametric inputs page.
Parametric inputs setup will be performed at this page.
◇ For switching parametric channels use the On switch.
◇ Specify the amplification coefficient value in the Gain list (reserved for future use).
◇ Select the parametric channel frequency values in the Frequency, Hz list (reserved
for future use).
◇ Specify the К1 and К2 coefficients values in the К1 and К2 entry fields.
◇ The parameter value in physical units will be set by К1 and К2 dimension factors after
the following formula:
Parameter (physical units) = K1 × Parameter (ADC units) + К2
◇ Parameter selection and name will be set in the Parameter list and in the Parameter
name entry field, correspondingly. Note that the Parameter list and the Parameter
name entry field will be available after opening the Parametric inputs page. These
parameters are common for the whole system.
For simultaneous parameters setup similar for all the channels use the Select all
button.
5.7. Setting the calibrators parameters
(for DDM systems type only)
For setting the calibrators parameters select the Options – Calibrators parameters
main menu option. After that, the Channel settings dialog box, open at the Calibrators
parameters page will appear.
User manual — A-Line 32D
Chapter 5. System Parameters Setup
58
Fig. 5.5. Channel settings dialog box, Calibrators parameters page
Calibrators parameters will be set at this page.
◇ For switching the calibrators on and off use the On switch.
◇ Select the pulse-repetition frequency of the impulses, emitted by the calibrator in the
Frequency, Hz list.
◇ Set the amplitude of the impulses, emitted by the calibrator with the help of the
Amplitude, V spinner.
⚐
When switching the calibrator on the corresponding AE data channel will be
switched off.
For simultaneous setup of the parameters similar for all the channels, use the Select
all button.
Note that the Simulator page is available for DDM systems type only.
5.8. Additional parameters setting
(for PCI systems type only)
For setting the additional parameters select the Options – Channels parameters
main menu option. After that, the Channel settings dialog box, open at the Main settings
page will appear. Then choose Additional settings page to set additional parameters
User manual — A-Line 32D
Chapter 5. System Parameters Setup
59
Fig. 5.6. Channel settings dialog box, Additional settings page
Additional parameters will be set at this page.
◇ To set connected preamplifier gain in dB use the Gain, dB entry field.
◇ To change ADC '0' shift in ADC units use the Shift '0' entry field.
For simultaneous setup of the parameters similar for all the channels, use the Select
all button.
Note that the Additional settings page is available for PCI systems type only.
5.9. Setting general system parameters
Setting the general system parameters will be performed by selecting the OptionsSettings main menu option. As a result, the General settings dialog box will appear. This
dialog has several pages devoted to the different advanced system setup:
◇ General settings page contains different general settings options.
◇ Network connection page contains network settings for the Enhanced Ethernet Box
system type hardware.
◇ Export parameters page contains settings for the ALD-file export.
◇ Parameters list page contains the lists of the AEP parameters need to presented into
the text view windows.
User manual — A-Line 32D
Chapter 5. System Parameters Setup
60
Fig. 5.7. General settings dialog box. General settings page
In the General settings dialog page the parameters are divided into several groups
as well as represented by a series of switches.
◇ The Constants group represents the assignable values, which are constant for the
whole system:
• basic scale value for calculation of the obtained AEP different amplitude values into
dB, in nano-volts unit in the Base value for dB calculation, [nV] entry field (default
value, 1000 nV).
• Number of strings in the text view page – in the Size of the filter and text window
page entry field.
◇ The Show channels group contains information on channels numbering selection:
User manual — A-Line 32D
Chapter 5. System Parameters Setup
◇
◇
◇
◇
◇
◇
◇
◇
◇
◇
◇
◇
61
• the use of the dual numbering – the ...with dual enumeration switch. (When using
the dual numbering the first digit represents the line/board number and the second
digit represents the number of the channel in this line/board).
• divisor selection (/, \, -, --) when using the dual channels numbering – in the Divisor
list.
• the use of the throughout enumeration for channels display – the ...with
throughout enumeration switch.
• divisor selection for location mirror channels – in the Divisor for mirror channels
in location list. Available only at open location windows.
The Unit of length group contains information about any sizes, lengths and other
geometry parameters unit selection:
• to set all sizes in millimeter unit – the mm switch should be selected.
• to set all sizes in centimeter unit – the cm switch should be selected.
• to set all sizes in decimeter unit – the dm switch should be selected.
• to set all sizes in meter unit – the m switch should be selected.
The program also provides for the following possibilities:
saving a configuration file on exit of the program – the Ask for configuration file
saving on exit switch;
scaling oscilloscope windows on the basis of the maximal waveform amplitude value
automatically – the Oscilloscope scaling on wave maximum;
scaling oscilloscope windows on the basis of the maximal waveform amplitude value
automatically – the Oscilloscope scaling on wave maximum. Otherwise, the scaling
will be performed after the full ADC scale.
to store the service diagnostic data in ALD data file – the Save service diagnostic
data switch.
performing spectral analysis in the data collection mode – the Show spectrum during
on-line mode switch.
calculation of the more precise spectrum in the postprocessing mode – the Calculate
accurate spectrum during off-line mode switch.
When activating this switch, the real taken oscillogram wave will be extended due to
filling the buffer with zero amplitude points and the calculation of such more precise
spectrum will be performed.
setting the default parametric channels coefficients – the Parameter coefficients auto
set switch.
to continue oscilloscope function during system paused period – the Do not stop OSC
during system pause switch.
to remove color legend from the oscilloscope windows and print out – the Do not show
legend in oscilloscope window and print output switch.
to allow warning message output about different channel's broach – the Indicate
different module's broach switch (for DDM type system only).
to keep the history report in file – the Keep the report switch and input filename into
the entry field (default filename: report.txt).
User manual — A-Line 32D
Chapter 5. System Parameters Setup
62
◇ selection of the line color on the total parameters diagrams will be performed with
the help of the Color standard dialog box. For opening it, use the Select button. For
opening it, use the Select button.
◇ to change the data line thickness onto the graphics use spin controls onto Data line's
thickness on diagrams entry field. The minimal thickness is 0 units (default value).
Fig. 5.8. General settings dialog box. Network connections page
In the Network connections dialog page the parameters of the Enhanced Ethernet
Box system hardware are presented. Ethernet Box system differs from the others system
types by availability of the Ethernet network connection between AE data aquisition block
and visualization computer (usually notebook). Enhanced Ethernet Box system differs
from the original Ethernet Box system by availability of individual IP-address box settings
to supply connection of several AE data aquisition blocks to one visualization computer
to increase total channel number.
User manual — A-Line 32D
Chapter 5. System Parameters Setup
63
◇ To activate individual IP-address of the definite AE data acquisition block add
corresponding IP-address string into Network devices address settings control list.
To add new IP-address string into the list use Add button. To remove previously added
and selected IP-address string from the list press Remove button. To edit previously
added IP-address string make double-click of the left mouse button onto selected string
of the list. The individual IP-address can be obtained from the system passport or serial
number.
◇ To set time out interval for start complete confirmation in ms input corresponding value
into Time out interval for start complete confirmation, ms entry field (default value
1000 ms).
◇ To set time out interval for information messages arriving in ms input corresponding
value into Time out interval for information messages arriving, ms entry field
(default value 1000 ms).
◇ To start Ethernet Box hardware inside temperature monitoring set Carry out hardware
temperature monitoring switch. The temperature information string will output into
report file and system log window.
User manual — A-Line 32D
Chapter 5. System Parameters Setup
64
Fig. 5.9. General settings dialog box. Export parameters page
In the Export parameters dialog page the different information parameters previously
saved into ALD file can be selected to be exported into plain text file for future use
and processing. To select any parameter to be exported the corresponding switch within
corresponding tree group should be activated. To cancel export of any parameter this
switch should be deactivated.
User manual — A-Line 32D
Chapter 5. System Parameters Setup
65
Fig. 5.10. General settings dialog box. Parameters list page
In the Parameters list dialog page the different AEP parameters can be selected to
be presented into filter text window and sync view window. To select any parameter to be
presented the corresponding switch within corresponding tree group should be activated.
To cancel present status of any parameter this switch should be deactivated.
After setting the necessary parameters, press the OK button, for canceling, press the
Cancel button. To apply changes without closing dialog box press Apply button.
5.10. Hotkeys setup
For setting the hotkeys system, use the Options – HotKey settings main menu option.
After that the HotKey settings dialog box will appear.
User manual — A-Line 32D
Chapter 5. System Parameters Setup
66
Fig. 5.11. HotKey Settings dialog box
Hotkeys settings will be specified in this dialog box.
◇ Select a main menu option in the Categories list. After that, a submenu of the selected
option will appear in the Commands list.
◇ Select the necessary submenu in the Commands list.
◇ Enter description in the Hotkey entry field by using the Ctrl, Alt or Shift keys.
◇ Press the Assign button.
After that, the corresponding hotkeys combination will appear in the Commands list
opposite to the option selected.
For canceling the set hotkeys combination or changing it, repeat the abovementioned
procedure again. At that, enter the No option in the entry field or any other hotkeys
combination.
After the end of the hotkeys setup, close the dialog box by using the Close button.
✶
✶
User manual — A-Line 32D
✶
Chapter 6. Working with windows
67
Chapter 6. Working with windows
✻
Chapter “Working with windows” describes operations with data representation
windows.
6.1. Context menus
A context menu will be called by clicking the right mouse button in the corresponding
section of the window:
◇ in the diagram display area;
◇ in the Х or Y-axis area.
The context menu for the diagram display area is represented on the diagram:
Fig. 6.1. Popup menu for display area
Option
Properties
Show impulses
X Scale
Y Scale
Z Scale
Second Y Scale
Export
Copy Ctrl+C
Action
Adjusts the window parameters.
Show AEP parameters in the text or graphics format.
Switches the X-axis on and off.
Switches the Y-axis on and off.
Switches the Z-axis on and off.
Switches the auxiliary Y-axis on and off.
Converts the diagram contents into text format (for all real
time, postprocessing and location windows).
Copies the selected diagram to the Windows clipboard in
graphical BMP format.
Context menus for Х and Y-axes are identical for both axes.
Fig. 6.2. Popup menu for axes area
User manual — A-Line 32D
Chapter 6. Working with windows
Option
Properties
Hide Scale
Show other scale
68
Action
Adjusts the axis parameters.
Switches the corresponding axis off.
Switches another axis on (in case the latter one is off).
6.2. Setting the window working field
For setting the working field of the windows select the Options – Current Window
main menu option or right-click in the main field of the window with the mouse. Then select
the Properties option in the context menu open. After that the Graph Setup dialog box
will appear.
Fig. 6.3. Graph Setup dialog box
◇
◇
◇
◇
◇
◇
Window parameters will be set in this dialog box:
For setting the Х, Y or Z (for 3D windows only) coordinate axes press Setup X, Setup
Y or Setup Z buttons in the Scale group correspondingly. Coordinate axes setup will
be described below in “Coordinate axes setup”.
For displaying the scale grid on Х-axis, Y-axis or Z-axis (for 3D windows only), switch
the Grid X, Grid Y or Grid Z switches correspondingly in the Grid group on.
For changing the background color of the selected window press the Background
button. The color selection will be performed with the help of the Color standard dialog
box. The selected background color can be simultaneously set for all the windows by
pressing the Apply to all button.
For diagram representation with the help of lines set the Lines switch in the Picture
param group. For diagram representation with the help of points set the Points switch
in the same group. Note that for some windows only a single representation type is
available.
For changing the additional line parameters press the Line button in the Import group.
Additional line setup will be described in “Additional line setup” on page 74.
For changing the imported graphics parameters press the Picture button in the Import
group. Imported graphics setup will be described in “Imported graphics setup” on
page 76.
Location windows feature
Additional options will appear for location windows in the Graph Setup dialog box.
User manual — A-Line 32D
Chapter 6. Working with windows
69
Fig. 6.4. Graph Setup dialog box for location window
◇ For clearing the location window from the location results press the Clear button in the
Location group, press the Undo button to restore the location results.
Note that location clearing can be performed as during the data collection so during
the postprocessing.
◇ In order to perform the cluster smoothing in the Location/Coordinate, mm and
the Location ampl, [dB] / Size, [mm] windows at linear and plane location types,
set the number of clusters by which you need to perform the smoothing using the
Param.smooth spinner and press the Smooth button. Use the Undo button in the
Clusterization group for returning to the location picture.
The smoothing procedure allows separating the location events, scattered chaotically
in the location field and unite the areas with big number of events. For this, the color
palette of the clusterization events number is used. Note, that the smoothing procedure
is not available during the data collection.
◇ For switching on the clusterization grid in the plane type location windows, switch the
Grid switch in the Clusterization group on. After changing the necessary parameters,
press the ОК button. For canceling the applied changes, press the Cancel button.
◇ Use Object color button to change color for the 3D location model in the corresponding
windows. The color selection will be performed with the help of the Color standard
dialog box.
6.3. Coordinate axes setup
For setting the Х and Y coordinate axes it is necessary to press the Setup X or the
Setup Y button in the Graph Setup dialog box correspondingly, or click the right mouse
button in the axes field. Select the Properties option in the context menu open. After that
the Axis Setup Dialog dialog box will appear.
User manual — A-Line 32D
Chapter 6. Working with windows
70
Fig. 6.5. Axis Setup Dialog dialog box
Axes coordinates settings will be specified in this dialog box:
◇ In the Type group:
• For selecting the linear type scale on the Y-axis use the Linear switch.
• For selecting the logarithmic type scale on the Y-axis activate the Log switch.
Note that this group is not available for those windows, where the results have already
been presented on the logarithmic scale.
◇ In the General Setup group:
• Set the initial and the final parameter values for the selected axis in the Min
and Мах, entry fields correspondingly. Use the Auto switch for automatic range
selection.
• Set the number of points on the scale for the range examined in the Marks entry
field.
• For convenient viewing and moving the viewing area on the time scale, use the
scrolling function, by activating the Scroll axis switch.
This switch will be available for time scale only (X-scale). Description of the
synchronous view results in all the windows with time dependency is given on on
page 71.
• Set the temporal window viewing value in seconds in the s entry field.
• The Apply to all button is available for all time scales. Pressing this button will
allow to specify the set values of the temporal range and use the scrolling in all the
windows where the dependencies between the parameters and time are presented.
◇ In the View Setup group:
• For changing the scale background color, press the Background button. Select the
color by using the Color standard dialog box.
• For changing the parameter values color, press the Text color button. Select the
color by using the Color standard dialog box.
User manual — A-Line 32D
Chapter 6. Working with windows
71
• Selected scale background color and the parameter values color can be set
simultaneously in all the windows by pressing the Apply to all button.
• For displaying the coordinate axis, switch the Show axis switch on. Reset this
switch for removing the coordinate axis.
◇ In the Units group, you can change the parameter values display method for some
axis types.
• For temporal axes, select the time unit used for displaying by using the sec, min,
hour switches.
• Select the amplitude measurement unit for the Y-axis in the OSC window by using
the ADC, mcV switches.
• The OSC window makes possible display of the signal threshold level values, set
on every channel for the Y-axis. For this, activate the Show threshold switch. In
order to remove the threshold values diagram this switch should be reset.
• The program makes available the normalization procedure for histogram
postprocessing. For this, activate the Axis Setup Dialog dialog box (for the Y-axis)
and set the Normalization switch in it. The normalization results can be used for
conducting further comparative analysis of the distribution forms on every channel.
After setting the parameters, press the ОК button. For canceling the changes made,
press the Cancel button.
Scrolling
For convenient viewing and moving the windows with time dependencies and the
viewing area on the time scale the program incorporates the scrolling function. For
switching it on, activate the Scroll axis switch and set the temporal window viewing
interval value in seconds in the Axis Setup Dialog dialog box.
After that, a scroll bar will appear in the lower part of the window with the selected
viewing area width. The use of the scroll bar makes it convenient to move the viewing
area within the whole range. At that, its width will remain unchanged, but the viewing area
will change every time.
For simultaneous data viewing in all the temporal windows the program incorporates
the synchronous scrolling function, described below.
Synchronous scrolling
For simultaneous viewing and moving the viewing area on the time scale in all the
temporal window the program incorporates the synchronous scrolling mode for real time
mode windows and postprocessing windows.
For activating this mode, use the View-Sync Scroll main menu option. Then call the
Axis Setup Dialog dialog box for the time scale, use the Scroll axis switch there and
specify the temporal window viewing interval in the s field. After that, a scroll bar will
appear in the lower part of the window with temporal dependence, which makes it more
convenient to move a part of the viewing area and change the viewing area.
In order to apply scrolling to all the windows with temporal dependency, use the Apply
to all button in the General setup group and press the OK button. In case you need to
apply scrolling not to all the windows with temporal dependency, activate it only in those
windows, every time using a corresponding Axis Setup Dialog dialog box. Then use the
scroll bar in one of the windows for time dependencies parameters. Viewing by time will
User manual — A-Line 32D
Chapter 6. Working with windows
72
be observed in all the selected windows. In case there is no necessity for simultaneous
viewing of processes in temporal windows, use the View-Sync Scroll main menu option
again. After that, the area scrolling function will be executed for every temporal window
separately.
6.4. Windows manager
Except the standard windows presented in “Results display windows ” on page 9, the
program allows creating the following additional windows:
◇ Max. amplitude, [dB] / Time, [s];
◇ Max. counts / Max. amplitude, [dB];
◇ unlimited number of windows, displaying the dependency of any parameter from any
other parameter;
◇ unlimited number of windows, displaying the events number distribution after any
parameter.
◇ up to 50 pairs of windows, displaying AEP waveforms and spectra.
To manage windows, select the Window – Windows Manager main menu option.
After that the Windows manager dialog box will appear.
Fig. 6.6. Windows manager dialog box
Parameters of additional windows will be set in this dialog box:
◇ In order to create the any window from the general set described in “Results display
windows ” on page 9 the corresponding Show switch should be turn on from the
General purpose real-time windows selected to use group.
◇ In order to create the Max. amplitude, [dB] / Time, [s] and the Max. counts / Max.
amplitude, [dB] windows turn the corresponding Show switches in the Additional
real-time windows selected to use group on. Maximal amplitude and count number
will be performed after every averaging interval.
◇ In order to create new "any from any" dependence window, push button Add new in
the Dependence windows created group. Then, select definite parameters in the ZAxis, Y-Axis and X-Axis drop lists made available. It is possible to form 2D or 3D
dependence windows. Previously formed windows are displayed into Dependence
User manual — A-Line 32D
Chapter 6. Working with windows
73
windows created list. To remove and close any selected dependence windows press
button Remove in this group.
◇ In order to create the distribution windows, push button Add new in the Afterwork
histograms created group. Then, select definite parameters in the Distribution type,
Y-Axis and X-Axis drop lists made available and specify the partitioning interval value
in the Step Y and Step X spin group. It is possible to form 2D or 3D windows for
differential or cumulative distribution. Previously formed windows are displayed into
Afterwork histograms created list. To remove and close any selected distribution
windows press button Remove in this group.
◇ To specify definite number of AEP waveform and spectrum windows pairs use Number
of oscillographic and spectrum windows spin control.
After setting the parameters of the new window's set press the ОК button, after which
the new window's set will be applied. To cancel made changes press the Cancel button.
In case the additional windows have already been created, when opening the
Windows manager dialog box, the features of the existing windows will be specified in
the corresponding groups.
6.5. Page manager
The program provides for possibility of arranging the OWIW windows on several pages
and performing operations (deletion, adding, renaming) with them. At that, the number
of pages is not limited. For calling the dialog for controlling the program windows display
pages, it is necessary to select the Window-Page Manager main menu option, after which
the Page Manager dialog box will appear.
Fig. 6.7. Page Manager dialog box
When working with pages this window provides for following possibilities:
User manual — A-Line 32D
Chapter 6. Working with windows
74
◇ new page creation – use the Page-Add main menu option, then enter the new page
name and press the OK;
◇ page deletion – select the page name in the pages list (by using the mouse or the Shift
key), then use the Page-Delete main menu option;
◇ renaming a page - select the page name in the pages list (by using the mouse or the
Shift key), then use the Page-Rename main menu option and enter the new page
name;
◇ deleting all the windows from the selected page - select the page name in the pages list
(by using the mouse and the Shift key), then use the Page-Clear main menu option;
◇ adding all the windows from the left-hand list to the selected page - select the page
name in the pages list (by using the mouse or the Shift key), then use the Page-Fill
main menu option;
◇ adding one or several windows to the page selected - select the page name in the
pages list (by using the mouse or the Shift key), select the window (windows) in the
right-hand list of the window; then use the Window-Add main menu option;
Adding a window to the selected page can also be performed by using the mouse. For
this move the mouse pointer and double-click with the left button on the name of the
necessary window in the right-hand field of the dialog box. Note that the program does
not allow adding the identical widows to one page.
◇ deleting a window from the selected page - select the page name in the pages list (by
using the mouse or the Shift key), select the window (windows) in the left-hand list of
the window; then use the Window-Delete main menu option;
Deleting a window from the selected page can also be performed by using the mouse.
For this move the mouse pointer and double-click with the left button on the name of
the necessary window in the left-hand field of the dialog box.
After creating the necessary pages filled with the corresponding windows, use the OK
button, otherwise, use the Cancel button.
6.6. Imposing additional lines and diagrams
Additional line setup
For setting an additional line, press the Line button in the Import group of the Graph
Setup dialog box. After that the Import line from a file or parameter dialog box will
appear.
User manual — A-Line 32D
Chapter 6. Working with windows
75
Fig. 6.8. Import line from a file or parameter dialog box
Additional line settings will be specified in this dialog box:
◇ For imposing an additional line activate the Enable additional line switch.
◇ Select the data source for an additional line in the Line info group.
• For using the data from a file, switch the Import from the file switch on. Then,
specify the file name in the File name entry field or press the Browse button and
select the necessary file with the help of the Open file standard dialog box.
When imposing a line from the file you can specify its name by entering into a
loading file a line, beginning with "!" symbol, after which the parameter name
follows.
• For using the data from a parametric channels switch the Parameter channel
switch on and select channel number from the corresponding list. The name of this
parametric channel will be used as a name of this parameter.
Note, that when imposing a line from a parametric channel on any window of time
dependence, the name of this parameter will be displayed in the header of this
window in the following way: "Name of the Y-axis'/ "Name of the Y2-axis"/"Name
of the X-axis".
◇ Set the line display parameters in the Line attributes group.
• For changing the line color press the Color button. After that, select the necessary
color by using the Color standard dialog box.
• Specify the line thickness in the Thickness entry field.
◇ In case when creating an additional line in the window with time selected on the Х-axis,
you switch the Apply to all time dependences switch on, the additional line settings
will be applied to all the temporal dependency windows.
After setting the necessary parameters, press the ОК button. For canceling the
changes made, press the Cancel button.
User manual — A-Line 32D
Chapter 6. Working with windows
76
Imported graphics setup
For setting the imported graphics, press the Picture button in the Import group of the
Graph Setup dialog box. After that the Import picture setting dialog box will appear.
Fig. 6.9. Import picture setting dialog box
Imported graphics settings will be specified in this dialog box:
◇ For imposing the imported graphics activate the Enable additional picture switch.
◇ Specify the file name in the entry field of the Picture file name or press the Browse
button and select the necessary file with the help of the Open file standard dialog box.
◇ Set the imported graphics display parameters in the Coordinate info group.
• Enter coordinates of the point to where you need to place the graphic picture in the
X axis and the Y axis entry fields of the Shift group.
• Specify the image size in the Horizontal and the Vertical entry fields of the Sizes
group.
• For automatic size selection throughout the vertical line at fixed size proportionally
to the dimensions of the original graphics file, switch the proportional size switch
on.
After setting the necessary parameters, press the ОК button. For canceling the
changes made, press the Cancel button.
Creating a loading line
In order to create and impose a loading line on all the windows of temporal dependence
(excluding parametric), select the Window-Additional lines main menu option. After that
the Additional lines dialog box will appear.
When creating an additional line this window provides for following possibilities:
◇ Assigning a table of any size for data input.
• Set the number of lines for data input with the help of the Number of rows spinner.
• For inserting an additional line before a selected line use the Insert button.
User manual — A-Line 32D
Chapter 6. Working with windows
77
• For deleting the selected data (the whole line / all lines will be deleted) use the
Delete button.
• For adding a line at the end of the grid, use the Add button.
◇ Input of the additional line values.
• Enter the values of the loading line on the Х-axis and the Y-axis, as well as the
necessary comments.
For entering the data, move the mouse pointer to the corresponding cell, activate
it and enter the parameter value in the Text for selected cell entry field.
• For deleting the data from the selected cell (cells), use the Clear button.
• For deleting all the data from the grid and corresponding diagrams, use the Clear
all button.
◇ Setting the additional line parameters.
• Enter the parameter name (pressure, temperature etc.) in the Name of parameter
entry field.
• Set the imposition thickness with the help of the Thickness spinner in the
Parameters of line group.
• Select the line color with the help of the Color standard dialog box, pressing the
Color button prior to it.
• For sorting events by time activate the Sort by X switch.
◇ For calling an additional line from the text file, use the Open button. Then select the
necessary file in the Open file standard dialog box.
◇ For saving the input data press the Save button. Then in the Save as standard dialog
box specify the file name (with the .txt or .nag extension), where the loading line
parameters will be saved.
After setting the parameters press the Apply button. The loading line will be displayed
on all the time-dependent diagrams. When pressing the Close button, all the data entered
will remain in the dialog box.
Recommendations on creating the joints map
In order to create a joints map and impose it on the location window perform the
following:
◇ open the location file, select the necessary location window and "stretch" it to fit the
screen size;
◇ copy the screen image to the clipboard (Print Screen button);
◇ run some vector graphics editor (e.g., CorelDraw or Visio);
◇ create a new image in the graphics editor;
◇ paste the image of the location window (Edit-Paste option);
◇ draw a rectangle around the border (without the axis field) and the joints map on the
location object;
◇ delete the image of the location window (activate the image of the location window and
press the Del. button), after which a rectangle with a joints map drawn should remain;
◇ export this image into the Windows metafile format (files with the .wmf extension) or
Enhanced Metafile (files with the .emf extension);
User manual — A-Line 32D
Chapter 6. Working with windows
78
◇ return to the Aline32D program to the location window and impose the file with the
joints map image, obtained in the graphics editor (Options-Current window option).
✶
✶
User manual — A-Line 32D
✶
Chapter 7. Location
79
Chapter 7. Location
✻
Chapter “Location” is all about location.
7.1. Intro
The program incorporates a special location function for determining the whereabouts
of the AEP sources. Depending on the whereabouts the following location types may be
applied:
◇ linear location;
◇ plane location;
◇ vessels location (cylindrical vessels);
◇ sphere location (spherical vessels);
◇ cone location (conic vessels);
◇ bottom plate location (for reservoirs);
◇ volume location (3D);
◇ zone location.
◇ constant picture (to visualize the result of another location group).
Note that the different location types may be applied simultaneously even for the similar
sensors.
7.2. Determining the AEP propagation
velocity and the distance between sensors
Determining the AEP propagation velocity.
For correct estimation of the defect’s whereabouts, it is necessary to know the velocity
of AEP propagation into material. The program provides for automatic determination of
this velocity. For this, it is necessary to select the Location – New Velocity main menu
option. After that, the Velocity/distance measurement scheme dialog box will open.
User manual — A-Line 32D
Chapter 7. Location
80
Fig. 7.1. Veloсity/distance measurement scheme dialog box
In this dialog box, activate the Velocity measurement switch in the Action group.
Then, specify the parameters, necessary for automatic determination of the AEP
propagation velocity.
◇ In the Channel select group:
• select the numbers of the channels participating in velocity determination from
the First (closest) channel (for the nearest sensor to the AEP imitator) and the
Second (most remote) channel (for the remotest sensor) group;
• specify the distance between the sensors in the Distance, [mm] entry field.
◇ In the Options group:
• enter the range of the allowable velocities in the Min velocity, m/s and the Max
velocity, m/s entry fields;
• specify the number of columns on the measured velocities histogram in the Num
bars entry field;
• switch the Enable attenuate window switch on, for creating the window for
determining the attenuation value.
◇ Select the calculation method In the Use to calculate velocity group:
• after the time of the first crossing of the threshold level by the AEP - activate the
Start time switch.
• after the time of reaching the maximum AEP amplitude value - activate the Time
of maximal amplitude switch.
The Start time switch is set in the program as default.
◇ When necessary, the additional criteria for automatic selection of the couples of
events, selected for the velocity and attenuation calculation, will be set in the Events
parameters group.
• Amplitude criterion..
For applying this criterion by which the amplitude of the AEP (in dB), arriving at the
nearest sensor, should be not less than the amplitude of the signal at the remote
User manual — A-Line 32D
Chapter 7. Location
81
sensor, switch the Have to meet the amplitude criterion with appropriate range
switch on. The difference between two AEP amplitude, obtained by two sensors,
should be more than value, specified in the corresponding entry field.
• Dead time criterion..
For applying this criterion by which the difference of both signals arrival at both
sensors should differ from the arrival times of the previously used couple not
less then by the value of the dead time set, switch the Dead time for velocity
measurement switch. Then enter the dead time value in the [mcs] entry field.
To create window for determining the AEP propagation velocity it is necessary to press
the OK button, after which the Velocity Measurement Histogram N / Velocity, [m/s]
window will be created. For canceling, select the Cancel button.
⚐
After creating the velocity measurement window it is necessary to perform an
experiment with imitation of AEP.
Determining the distance between sensors.
In order to determine the distance between the sensors, it is necessary to repeat the
procedure for calling the Velocity/distance measurement scheme dialog box. Then, in
the dialog box open, activate the Distance measurement switch in the Action group
and set the parameters for determining the distance between sensors. Note, that most
parameters will be the same as for velocity determination.
◇ In the Channel select group:
• numbers of channels participating in velocity determination between the sensors,
will be selected the same way as for AEP velocity determination;
• specify the AEP propagation velocity in the Velocity, [m/s] entry field.
◇ In the Options group:
• enter the range of the allowable distances in the Min distance, [mm] and the Мах
distance, [mm] entry fields;
• specify the number of columns on the distance distribution histogram in the Num
bars entry field.
◇ The calculation method in the Use to calculate velocity/distance group will be the
same as for velocity determination.
◇ In the Events parameters group the additional criteria will be selected in the same
way as when determining the velocity.
In order to create a window for determination of the distance between the sensors
press the OK button, after which the Distance Measurement Histogram N / Distance,
mm window will be created. For canceling, select the Cancel button.
⚐
After creating the distance measurement window it is necessary to perform an
experiment with imitation of AEP.
Operations with sensors arrangement scheme.
In case the parameters entered in the Velocity/distance measurement scheme
dialog box will be necessary in the future, they can be saved by pressing the Save button.
User manual — A-Line 32D
Chapter 7. Location
82
Then, the Save file standard dialog box will appear, where it is necessary to specify a file
name for saving the settings with the cfg. extension and press the Save button.
When necessary to perform a repeated velocity measurement using the previously
saved sensors arrangement scheme, use the Location – Open velocity main menu
option. Then, select the file containing the necessary sensors arrangement scheme in the
Open File standard dialog box and press the Open button.
In order to correct the sensors arrangement scheme select the Location – Edit
current velocity main menu option. Then, change the necessary parameter in the opened
Velocity/distance measurement scheme dialog box.
You can close the velocity determination window by selecting the Location – Close
velocity main menu option.
7.3. Forming location groups
For forming the location groups, select the Location – New location main menu
option. Then, the Location Scheme settings dialog box will appear.
Fig. 7.2. Location Scheme settings dialog box
Location groups parameters should be set in this dialog box.
◇ To create the location group use button Add New in the Loc. group frame. To delete
any of previously created location group select corresponding string in the group list
control and push button Remove within the same frame. Also there is possibility to
copy selected location group content to the newly created one. To do this operation
select group number to copy from the drop list and push button << within the same
group frame.
◇ To change any location group settings select corresponding string in the group list
control, then provide changes in the control string made available in the bottom part
User manual — A-Line 32D
Chapter 7. Location
83
of the dialog box. Enter the group name in the Group Name entry field. Select the
location type in the Location Type drop list. The following location types are available:
• Linear;
• Plane;
• Cylinder;
• Sphere;
• Bottom;
• 3D;
• Zonary.
• Picture.
• Cone.
◇ To select the numbers of sensors, included in this group, and the shape of the location
antenna type – triangular or rectangular (for all plane location types) press Select near
the Channels in group entry field. Selection of sensors, included in the location group,
and shapes of the location zones will be described below, in the chapters dedicated to
different location types. After the end of selection, control will return to the Location
Scheme Settings dialog box, and the number of sensors included in the given group
will be specified in the Channels in group field.
◇ Enter the size of the location area in the Length, [mm], Width, [mm] or Diameter,
[mm] and Height, [mm] entry fields. The geometrical features of different location
types will be described in the chapters dedicated to corresponding location types.
◇ To select the window page to position current location group windows use drop list
Page.
◇ Sensors arrangement scheme will be set by pressing the Details button. Then,
depending on the location scheme selected, one of the location scheme parameters
setup dialog boxes will open. Operations with these dialog boxes will be described
in “Sensors arrangement scheme setup”on page 84 Chapter. The features of the
scheme parameters setup at different location types will be described in the chapters
dedicated to corresponding location types.
◇ The Clusterization legend group represents the color palette, used for displaying
the number of located events and location amplitudes on the examined surface
area, divided into conventional rectangles of the specified size. For changing the
clusterization parameters press the Change settings button in this group. More
detailed description of this operation will be given in “Clusterization” on page 106
Chapter.
Then press the ОК button in the Location Scheme Settings window. After that the
correspondence check of the cluster sizes and corresponding location groups size will
be performed. For linear, plane and 3D volume location types, the correspondence of the
lengths, widths and heights is direct. For vessel, sphere and bottom the correspondence
check will be performed by scanning. In case the number of clusters per corresponding
location group size will be less than five, inquiry for ignoring this situation will be made.
When selecting the No button the Clusterization settings dialog box will appear, where
it is necessary to change the cluster size. After that, the new location windows for every
location group will be created. When selecting the Yes button, the new location windows
User manual — A-Line 32D
Chapter 7. Location
84
for every location group will be created at once, at any correspondence of the cluster size
and location group size.
For canceling the changes made press the Cancel button in the Location Scheme
Settings dialog box.
Additional features
After setting all the location groups parameters you can press the Save Loc Cfg button
for saving the entered parameters. At that, the Save as standard dialog box will open,
where it is necessary to specify the file name, where the location groups settings will be
saved and press the Save button.
In case the location groups settings were saved before, they can be loaded by using
the Location – Open location main menu option or pressing the Load Loc Cfg button.
After that, select the necessary file in the Open File standard dialog box and press the
Open button. Then the Location Scheme settings window will appear, which shows the
settings, contained in the file. In case of selecting the wrong file press the Cancel button
or press the ОК button for accepting the scheme offered.
To change the current location groups set use the Location – Edit current location
main menu option. After that you can set the necessary changes to the location groups
parameters, add new or delete the existing location groups opened Location Scheme
settings dialog box.
For clearing the location windows from the location results, you can use the Location –
Clear Locations main menu option, or
button on the Toolbar. For restoring the
location windows, use the Location – Restore Locations main menu option, or press the
button on the Toolbar. The procedure for clearing and restoring the location windows
is also possible through the Properties context menu.
7.4. Sensors arrangement scheme setup
Sensors arrangement scheme setup consists in setting the sensors coordinates, used
in location, parameters setting and forming the location zones.
◇ Sensors arrangement scheme setup will begin with setting the sensors coordinates in
the corresponding dialog boxes for location schemes setup. Sensor coordinates can
be set either relatively to zero or relatively to other sensors position. More detailed
description of this operation is given below in “Setting sensors coordinates”.
◇ Set the additional parameters in the Optional constants group.
• Enter the AE wave propagation velocity in the Velocity [m/sec] entry field.
• Set the sensor image size on the diagrams in the Image Diameter entry field.
• By linear location, specify the number of columns in the location histogram in the
Num Local Bars entry field.
• By plane location schemes, specify the value of the location zone around the
sensors in the Bound region entry field. When exiting the dialog boxes of the
location scheme parameters setup a check for the adequacy of the "cut-off zone"
will be performed. The sources of AEP, located outside the boundaries of this zone
will be eliminated.
User manual — A-Line 32D
Chapter 7. Location
85
◇ For all the plane location types (plane, cylinder, sphere, cone, bottom) the Edit Zones
button is available in the Location zones group, allowing to distribute the sensors in
zones. Note that the program makes possible automatic partitioning of the area into
triangular and rectangular zones after the previously set sensors coordinates. At that,
the zones will be formed from sensors with different numbers in such a way that they
intersect with each other and are nondegenerate (i.e. the triangle or rectangle area
differs from zero). More detailed description of this operation is given below in “Sensors
distribution in zones” on page 87.
◇ For using the additional location options press the Advanced button. After that, the
Advanced location options dialog box will open. Operations with this window will be
described in “Additional location options” on page 102.
◇ In order to perform filtering after location press the Filter button. After that, the
Location filter dialog dialog box will open, where it is necessary to set the filtering
parameters. Operations with this window will be described in “ Filtering after location”
on page 104.
After setting the sensors arrangement scheme press the ОК button, after that control
will return to the Location scheme settings dialog box.
7.5. Setting sensors coordinates
It was noted in the previous Chapter that coordinates can be set relatively to reference
points or relatively to other sensors. For different location types there are following
reference points:
◇ For linear location - zero, left-hand end, right-hand end.
◇ For plane location and picture - zero, left-hand lower corner, left-hand upper corner,
right-hand lower corner, right-hand upper corner.
◇ For vessels and cone location (cylindrical vessels) - zero.
◇ For sphere location (spherical vessels) - none.
◇ For bottom location - Bottom, 3 hours.
◇ For 3D volume location - none.
◇ For zone location – coordinates will not be set.
Start the sensors arrangement scheme with setting the sensors coordinates. Position
of the reference points will be examined in the corresponding location chapters.
◇ For setting the sensors coordinates, perform the following operations in the Manual
setup group (or in the Three-Dimensional details setup dialog group in case of 3D
volume location):
• Select the sensor number in the Channels drop list.
• Select the reference point of the sensor’s position (relatively to zero or to another
sensor) in the Relatively drop list.
• Set the sensor’s shift relatively to the selected reference point in the Shift along
X[mm], Shift along Y[mm] and the Shift along Z[mm] entry fields.
• Press the Apply button.
User manual — A-Line 32D
Chapter 7. Location
86
Note that the absolute value of the coordinates relatively to zero will be specified in the
Coordinate group in the X[mm], Y[mm] fields. Note also that both coordinates are
not used for all location types (e.g., by linear location only one coordinate is used).
◇ Sensors coordinates setup can be performed with the help of the mouse.
Except entering the sensor coordinates directly from the keyboard, you can also set the
sensors coordinates with the help of the mouse. For this, left-click with the mouse on
the sensor image and by holding the button down, move the sensor to the necessary
position. The abovementioned operation should be repeated for every sensor. At that,
the channel number and the sensor coordinate will be displayed in the Coordinates
group, as well as in the Manual Setup group.
Note that in case of the 3D volume location the option of setting the sensors coordinates
with the help of the mouse is not available. At zone location sensors, coordinates are
not set at all.
The program also provides for possibility of automation of the coordinates setting
process.
◇ For forming the location scheme during the linear location (as well as during other
location types) it is convenient to use the following method for setting the sensors
coordinates:
• Activate the Auto switch in the Manual setup group.
• Select the 01 channel number in the Channels list.
• Select Zero in the Relatively list.
• Set the position of the 01 sensor in the Shift along X[mm] entry field (when
necessary, also set the Shift along Y[mm] and the Shift along Z[mm]).
• Press the Apply button.
• Select the next channels (02 and 01, correspondingly) in the Channels and
Relatively list.
• Set the position of the 02 sensor relatively to 01.
• Press the Apply button.
The channel numbers in the Channels and the Relatively lists will increase
automatically.
Set the coordinates of the remained sensors in the same way.
◇ Set the coordinates of the remained sensors in the same way:
• Select the necessary channel numbers in the Channels and the Relatively lists.
• After that the necessary value will appear in the Shift along X[mm] (or Shift along
Y[mm] and Shift along Z[mm]) field.
◇ For moving the zero, press the Shift button in the Coordinates group. After that the
Coordinate origin shift dialog box will appear.
User manual — A-Line 32D
Chapter 7. Location
87
Fig. 7.3. Coordinate origin shift dialog box
Zero shift is possible for all location types, except the bottom location, 3D volume and
zone location.
Set the shift value in the X-scale shift, mm and the Y-scale shift, mm entry fields.
For setting the shift press the ОК button. For canceling the changes applied, press
the Cancel button.
7.6. Sensors distribution in zones
Press the Edit Zones button for distributing the sensors in location zones in dialog
boxes for plane location schemes parameters setup. After that, it will be possible to change
the sensors distribution in zones.
User manual — A-Line 32D
Chapter 7. Location
88
Fig. 7.4. Plane Triangle Scheme Settings
dialog box in location zones determination mode
◇ For selecting a zone, use the
and the
buttons in the Location Zones
group. The zone selected will be highlighted with a white outline.
◇ For adding a zone, press the Add button in the Location Zones group.
After pressing the Add button, the Adding or Deleting Location Zones dialog box
will appear.
User manual — A-Line 32D
Chapter 7. Location
89
Fig. 7.5. Adding or Deleting Location Zones dialog box
In this dialog box, you can add or remove the location zones, formed by three or four
sensors. The already existing zones are listed in the Zones Presented list, and the
zones, which can be added, are listed in the Zones Available list. There are following
options for moving a zone from one list to another:
• double-click with the mouse on the necessary zone in the corresponding list;
• select the necessary zone by a single mouse click and press the
or the
button.
After finishing forming the location zones in the Adding or Deleting Location Zones
dialog box press the ОК button. For canceling the changes applied, press the Cancel
button.
◇ For deleting the selected zone press the Delete button in the Location Zones group.
◇ For changing the selected zone configuration click the mouse on the zone vertex, and
while holding it, move the mouse pointer to the new zone vertex and only then release
the mouse button.
After correct setting of all the zones press the Apply button in the Location Zones
group. Then the plane location schemes parameters dialog boxes mode returns to the
sensors coordinates setup mode.
7.7. Linear location
When using the linear location type the examined area is characterized by one
dimension (length). This location type is used as a rule for examination of the lengthy
objects (i.e. when one of the dimensions is much higher than the others), such as industrial
pipe-lines, beams, elements constructional elements of hoisting cranes, bridges etc.
Including sensors into a location group
In order to include the sensors into a location group, press the Select button in the
Location Scheme Settings dialog box. After that the Including or Excluding sensors
from group dialog box will appear.
User manual — A-Line 32D
Chapter 7. Location
90
Fig. 7.6. Including or Excluding sensors from group dialog box
In this dialog box it is possible to increase and decrease the number of sensors,
included into a location group.
◇ For including a sensor into a group, provisions are made for the following options:
• double-click with the mouse on the number of the necessary sensor in the Sensors
available list;
• select the necessary channel number by a single mouse click and press the
button.
◇ For deleting a sensor from the group perform the similar operations in the Sensors
selected list, by using the
button.
◇ In order to include or delete all the sensors from a group simultaneously, press the
or the
button.
After finishing the channels selectionб press the ОК button, for canceling selection use
the Cancel button. For sensors selection during other location types the Select channels
dialog box, similar to the Including or Excluding Sensors from group dialog box is used.
Sensors arrangement scheme setup
For setting the sensors arrangement schemeб press the Details button in the
Location Scheme Settings dialog box. After that the Linear Scheme Settings dialog
box will appear.
User manual — A-Line 32D
Chapter 7. Location
91
Fig. 7.7. Linear Scheme Settings dialog box
Operations with this dialog box are described in the Chapter “Sensors arrangement
scheme setup” on page 84. Among the features of this location type, it is worth noting
just one coordinate and the absence of location zones. The reference points for the linear
location are the Zero, Left-hand edge and Right-hand edge points. If you do not use the
coordinates shift, position of the Zero reference point coincides with position of the Lefthand edge point. Otherwise, there are three independent points.
7.8. Plane location
When using location of the plane type the examined area is characterized by two
dimensions (length and width). This location type is applicable for control of the flat (sheet)
constructions, certain areas of adjacent constructions.
Including sensors into location group
In order to include the sensors into a location group, press the Select button in the
Location Scheme Settings dialog box. After that, as in the case of linear location, the
Including or Excluding sensors from group dialog box will appear. Operations with this
dialog box are described on on page 89. There is also a possibility for using the location
zones of different shapes. For this, activate whether the Triangular switch – for triangular
zones, or the Rectangular switch for quadrangular zones in the Zone type group.
Sensors arrangement scheme setup
For setting the sensors arrangement scheme, press the Details button in the Location
Scheme Settings dialog box. After that, the Plane Triangle Scheme Settings will appear
dialog box.
User manual — A-Line 32D
Chapter 7. Location
92
Fig. 7.8. Plane Triangle Scheme Settings dialog box
Operations with this dialog box are described in the Chapter “Sensors arrangement
scheme setup” on page 84. For this location type the reference points are the Zero,
Left-hand Lower Corner, Left-hand Upper Corner, Right-hand Lower Corner, Righthand Upper Corner. By analogy with the linear location, position of the Zero point may
change. In case of no shift, its position will correspond with the Left-hand Lower Corner
point.
7.9. Cylinder location (cylinder vessels)
When using the cylinder location the examined area is characterized by two
dimensions (length and bottom radius). This location type is applied for controlling cylinder
vessels.
User manual — A-Line 32D
Chapter 7. Location
93
Including sensors into location group
In order to include the sensors into a location group, press the Select button in the
Location Scheme Settings dialog box. After that the Select channels for 3D scheme
dialog box will appear.
Fig. 7.9. Select channels for 3D scheme dialog box
◇
◇
◇
◇
◇
Sensors distribution in vessel’s section will be set in this dialog box:
in the center of the dialog box – on the ring;
in the right-hand and left-hand parts – on bottoms.
For including the right and/or left bottom, set the Include in location switches in the
corresponding part of the dialog box. After that, it will be possible to determine the
parameters of this part.
For selecting the sensors, participating in ring and bottoms location, press the Change
button in the corresponding group. After that, the Select channels dialog box, similar to
the Including or Excluding Sensors from group dialog box will appear, the operations
with which are described on page 89. After closing the Select channels window,
the number of the selected channels is specified in the Total channels used fields
and these channels are listed in the Channels selected lists.
In the Medium cylinder group, it is necessary to set the parameters of sensors
arrangement on the ring.
• The number of location belts (the number of sensor rows on the object) will be
specified in the Number of belts to use entry field.
• The method for sensors arrangement will be selected with the help of the Place
sensors on board switch. In case the switch is set, the utmost location belts will
User manual — A-Line 32D
Chapter 7. Location
94
be placed on the border of the ring and bottoms. Otherwise, the location belts will
be evenly arranged on the ring.
◇ Set the parameters of sensors arrangement on bottoms in the Left round cover and
Right round cover groups.
• Number of the sensor, located in the center of the bottom will be selected from the
Centered channel list.
• Bottom height (bottom embedding value) will be set in the Thickness [mm] entry
field.
◇ In order to select the shape of the location zone, activate the corresponding switch in
the Zone type group.
• Zones of triangular shape will be selected with the help of the Triangular switch.
• Zones of quadrangular shape will be selected with the help of the Rectangular
switch.
After setting all the parameters, press the ОК button. For canceling the changes
applied, press the Cancel button.
Sensors arrangement scheme setup
For setting the sensors arrangement scheme, press the Details button in the Location
Scheme Settings dialog box. After that the 3D-Volume details setup dialog dialog box
will appear.
Fig. 7.10. 3D-Volume details setup dialog dialog box
Operations with this dialog box are described in the Chapter “Sensors arrangement
scheme setup” on page 84. For this location type the reference point is the Zero. In
User manual — A-Line 32D
Chapter 7. Location
95
case the coordinates shift is not applies, the Zero point is located in the point of contact
of the Bottom 1 and the left edge of the Medium cylinder, as shown on the diagram.
7.10. Sphere location (spherical vessels)
When using this location type the examined area will be set by one parameter (sphere
radius). This location type is used for controlling the spherical vessels.
Including sensors into location group
In order to include the sensors into a location group, press the Select button in the
Location Scheme Settings dialog box. After that the Select channels for 3D sphere
dialog box will appear.
Fig. 7.11. Select channels for 3D sphere dialog box
This dialog box sets sensors distribution in a sphere’s sections.
◇ For selecting the sensors, participating in location, press the Change button. After that,
the Select channels dialog box, similar to the Including or Excluding Sensors from
group dialog box will appear, the operations with which are described on page 89.
After closing the Select channels window the number of the selected channels will
be specified in the Num channels used field, and these channels will be listed in the
Selected Channels list.
◇ After selecting the channels, it is necessary to specify the sphere location method. For
this activate the corresponding switch in the Involute method group.
• In case of sector sphere location, set the Sectorial switch.
• In case of cubic sphere location, set the Cube switch.
Note that when selecting the cubic type of the sphere location, default arrangement of
the sensors first will be performed on the corners of the cube inscribed into a sphere.
Then – thru the centers of faces and edges. Such sensor arrangement assumes the
use of at least eight sensors. Sensors coordinates and location results display result
in the coordinate system "Length"(Х) - "Width"(Y).
◇ In case of selecting the sector method of sphere location the Sectorial involute group
becomes available. It is necessary to specify the additional parameters in it.
User manual — A-Line 32D
Chapter 7. Location
96
• The number of location belts (the number of sensor rows on the object) will be
specified in the entry Number channels' belts field.
• The number of a sensor located on top will be selected from the Тор channel
• The number of a sensor located below will be selected from the Bottom channel
list.
◇ In case of selecting the cubic method of sphere location, the Cube involute group
becomes available, where it is necessary to select the location zone type.
• Location zones of triangular shape will be set by using the Triangular zone switch.
• Location zones of quadrangular shape will be set by using the Rectangular zone
switch.
After setting all the parameters, press the OK button. For canceling, the changes
applied press the Cancel button.
Sensors arrangement scheme setup
For setting the sensors arrangement scheme, press the Details button in the Location
Scheme Settings dialog box. After that the 3D-Sphere details setup dialog dialog box
will appear.
Fig. 7.12. 3D-Sphere details setup dialog dialog box
Operations with this dialog box are described in the Chapter “Sensors arrangement
scheme setup” on page 84. From among the features of this location type it is worth
noting, that when using the sector method of sphere location, there is a possibility
of manually changing only one coordinate (calculation of the second coordinate will
User manual — A-Line 32D
Chapter 7. Location
97
be performed automatically), as well as different graphic representation of a sphere
(depending on the scanning method selection).
7.11. Bottom location
When using the bottom location, the examined area is characterized by two different
dimensions: bottom radius (radius) and the embedding value (height). This location type
is used for controlling the bottoms of reservoirs, including buried reservoirs (inaccessible
for sensors arrangement).
Including sensors into location group
For setting the sensors arrangement scheme, press the Select button in the Location
Scheme Settings dialog box. After that the Select channels for bottom location
scheme dialog box will appear.
Fig. 7.13. Select channels for bottom location scheme dialog box
This dialog box sets sensors distribution on sectors of the bottom.
For selecting the sensors, participating in location, press the Change button. After that,
the Select channels dialog box, similar to the Including or Excluding Sensors from
group dialog box will appear, the operations with which are described on page 89.
After closing the Select channels window the number of the selected channels will
be specified in the Num channels used field, and these channels will be listed in the
Selected Channels list.
User manual — A-Line 32D
Chapter 7. Location
98
Then specify the number of a sensor (if exists) located in the middle of the sphere
(within the environment) in the Center channel list. In case such sensor does not exist,
select No.
In order to select the shape of the location zone activate either the Triangular switch
for zones of triangular shape, or the Rectangular switch for zones of quadrangular shape
in the Zone type group.
After setting all the parameters press the OK button. For canceling the changes
applied, press the Cancel button.
Sensors arrangement scheme setup
For setting the sensors arrangement scheme, press the Details button in the Location
Scheme Settings dialog box. After that the Bottom details setup dialog dialog box will
appear.
Fig. 7.14. Bottom details setup dialog dialog box
Operations with this dialog box are described in the Chapter “Sensors arrangement
scheme setup” on page 84. Among the features of this location type it is worth
mentioning the following points:
◇ During the bottom location the arc length (Arc distance entry field) and the height of
sensor placing (Height entry field) are entered in the Bottom details setup dialog
dialog box instead of the X and Y coordinates. Arc length is the distance on the arc
of the bottom’s circumference, counted from the extreme right-hand position (to where
the 1st sensor is set by default) counter-clockwise.
◇ Relation of Х and Y coordinates to the arc length is determined by the formulae:
X = R cos( L / 2πR ) and Y = R sin( L / 2πR ), where
User manual — A-Line 32D
Chapter 7. Location
99
R is the bottom radius, L - arc length counted from the extreme right-hand position
counter-clockwise to the place of installing the selected sensor.
For this location type, the reference points are the Bottom, 3 hours, which correspond
to 01 sensor position in the figure.
7.12. 3D volume Location
When using the 3D volume location type the examined area is characterized by three
dimensions (length, width and height). This location type is used for filled 3D-objects (e.g.
- bridge pillars; pressure reservoirs, filled with liquid).
Including sensors into location group
In order to include the sensors into a location group, press the Select button in the
Location Scheme Settings dialog box. After that, the Select channels dialog box, similar
to the Including or Excluding sensors from group dialog box will appear, operations
with which are described on page 89.
Note that when using the 3D volume location it is necessary to use not less than five
sensors.
After setting all the parameters, press the OK button. For canceling the changes
applied, press the Cancel button.
Sensors arrangement scheme setup
For setting the sensors arrangement scheme press the Details button in the Location
Scheme Settings dialog box. After that the Three-Dimensional details setup dialog
dialog box will appear.
User manual — A-Line 32D
Chapter 7. Location
100
Fig. 7.15. Three-dimensional details setup dialog dialog box
Operations with this dialog box are described in the Chapter “Sensors arrangement
scheme setup” on page 84on page.
Among the features of this location type the following should be noted:
◇ availability of three coordinates;
◇ absence of location zones.
Availability of three coordinates in this location model provides for obtaining a threedimensional rotating image in this dialog box. At that, there is no possibility for setting
coordinates from the dialog box with the help of the mouse. When working with a threedimensional image the following options are available:
◇ To stop rotation press the < button located in the lower right-hand corner of the dialog
box.
◇ For rotating the image around the horizontal axis, use the horizontal scroll bar.
◇ For rotating the image around the vertical axis, use the vertical scroll bar.
User manual — A-Line 32D
Chapter 7. Location
101
7.13. Zone location
Zone location is used mainly for vessels diagnostics:
◇ in especially difficult cases, when there is practically no access to the examined section
of the object;
◇ when the AE pulse propulsion speed is unknown;
◇ when other location types provide no information on the defect present.
In such cases zone location serves as rapid analysis for detection of the AE sources
availability without determining their coordinates. With its help you can specify just
approximately between which sensors the defect is located.
Including sensors into location group
In order to include the sensors into a location group, press the Select button in the
Location Scheme Settings dialog box. After that the Select channels dialog box, similar
to the dialog box Including or Excluding sensors from group dialog box will appear,
operations with which are described on page 89.
After finishing the channels selection press the OK button, for canceling selection use
the Cancel button.
Zone location scheme parameters
For setting the zone location scheme, press the Details button in the Location
Scheme Settings dialog box. After that the Zonary Detailes Setup Dialog dialog box
will appear.
Fig. 7.16. Zonary Details Setup Dialog dialog box
Operations with this dialog box are described in Chapter “Sensors arrangement
scheme setup” on page 84.
Among the features of this location type it is worth noting the absence of coordinates
and location zones, as well as availability of the additional Arrival time for location
group in the Zonary details setup dialog dialog box. In this group select the mode for
performing location:
User manual — A-Line 32D
Chapter 7. Location
102
◇ After the event beginning time - with the help of the Start time switch;
◇ After the maximum amplitude time - with the help of the Time of maximal amplitude
switch.
Displaying results
After setting all the parameters of the zone location scheme press the OK button in the
Location Scheme Settings dialog box. Then the window for displaying the zone location
results in a list-form will appear. The result of this location type is selection of groups
of events (packs), arriving in series to several different sensors (not less than two) with
common arrival interval not exceeding the value set (this interval’s value will be set in the
Zonary details setup dialog dialog box by determining the cut-off zone and velocity).
In the table of the zone location results display window the figures are listed,
representing the number of the packs selected, sorted after the first three (two) sensors
of the pack. The sensors registering events in the pack will be set in the following way:
the first sensor will be selected in the upper line and will set the table page; the second
sensor will be selected from the table columns, the third sensor – from the table lines. The
column with the largest number of the packs selected in comparison to other, identifies
the possibility of a defect present between three selected sensors. Note that the possible
defect will be located closer to the sensor, which number corresponds to the table page
number. In case of a pack, consisting of two events, the line and column number coincide.
In a data file, filtered after zone location, the "N of the pack" parameter will appear
(similar to source coordinates for other location types), which unites the AE events of one
pack by its common sequence number.
7.14. Additional location options
For setting the additional location functions press the Advanced button in the location
scheme parameters setup. After that the Advanced location options dialog box will
appear.
User manual — A-Line 32D
Chapter 7. Location
103
Fig. 7.17. Advanced Location Options dialog box
◇ Enter the attenuation parameter value for selected location group in the Amplitude
attenuation, [dB/m] field.
◇ For viewing the 3D-models of cylindrical and spherical vessels localization, activate
the Display 3D location window switch.
◇ In order to create the location amplitude window, switch the Display amplitude
location window switch on. Then, set the switch in the Show amplitude location
options group made available, corresponding to the selected action:
• for displaying in the location amplitude window the average amplitude in cluster,
use the Show cluster averaged amplitude switch;
• for displaying in the location amplitude window the maximum amplitude in cluster,
activate the Show maximum amplitude in cluster switch.
◇ In order to select the method for location coordinates determination activate the
corresponding switch in the Use to calculate location group:
• for determining the coordinates after time differences of the AE signal arrival to
sensor set the ...start time of AE events switch;
User manual — A-Line 32D
Chapter 7. Location
104
• or determining the coordinates after time differences of the reaching the amplitude
maximum by the AE events, use the ...time of maximal amplitude of AE events
switch.
(These switches are available for all location types, except the zone location.)
◇ In order to check the truth of the obtained source coordinates values set the
quadrangular zone type in the corresponding channel selection dialog. Then in the
Rectangular location options group made available:
• activate the Coordinate verification switch;
• enter the permissible error value in the Error value [mm] entry field.
Note that this check can be performed based on possibility of the location coordinates
determination algorithm after four sensors. The accuracy of the obtained values will be
2
2
2
2
2
determined with the help of the correlation ("truth criterion ") | X + Y - V T | ≤ ε , where
X и Y are the source coordinates, V - AE signal velocity, T - signal propagation time, ε the settable error value (residual).
In case of non-fulfillment of the "truth criterion" at the V0 velocity set in location, it is
possible to match it within the limits specified in order to provide the possible equality with
ε precision selected. For this:
◇ activate the Variate velocity [m/s] switch;
◇ specify the bearable interval of speed matching in the from…to entry fields, including
the initial velocity value V0 .
After setting all the parameters, press the OK button. For canceling the changes
applied, press the Cancel button. Note that the 3D location window and the location
amplitude window will be created together with other location windows.
⚐
We do not recommend keeping the windows of 3D location models open during
the data collection because of the significant computer resources consumption for
displaying them.
Controlling a 3D location model window
The 3D location model window is used for viewing the 3D models of cylindrical and
spherical vessels location. After obtaining the images of 3D objects with the sensor
arrangement scheme specified, the following actions are possible:
◇ For rotating the vessel around the horizontal axis, use the horizontal scroll bar;
◇ For rotating the vessel around the vertical axis, use the vertical scroll bar.
◇ For animation (simultaneous rotation of the vessel around both coordinate axes,
passing thru the center of the vessel), press the < button. To stop rotation, depress
the < button.
7.15. Filtering after location
For selecting the located events and performing the filtering, press the Filter button
in the location schemes parameters setup window. After that the Location Filter Dialog
dialog box will appear. Set the filtering after location parameters in the dialog box open.
User manual — A-Line 32D
Chapter 7. Location
105
Fig. 7.18. Location Filter Dialog dialog box
◇ In the Kept located events parameters group select, when necessary, the criterion/
criteria of the automatic located events screening, using the corresponding switch.
• Amplitude criterion..
This criterion satisfies the events with the amplitude of the signal (in dB), arriving
at the nearest sensor, not less than the signal amplitude at the distant sensor. For
using this criterion switch the Have to meet the amplitude criterion switch on.
• Criterion of the location amplitudes discrepancy values..
This criterion satisfies the events with the location amplitudes discrepancy values
in the location of the defect for the events, forming a location couple (for linear
location) or three (for plane location types), recalculated by the program considering
the attenuation parameter and the distance from defect to sensor, does not
exceed the specified value. For using this criterion, switch the Location amplitude
difference have to be more switch on and specify the location amplitudes
discrepancy value in the [dB] entry field.
• Criterion of the AE pulse arrival time discrepancy..
This criterion satisfies the events with the AE pulse arrival at sensors time
discrepancies, forming a location couple (for linear location) or three (for plane
location types), not less than the value specified. For using this criterion, switch the
Time arrival difference have to be no less than switch on and specify the arrival
time discrepancy in the [mcs] entry field.
• Criterion of the location dead time.
According to this criterion an event will be located, in case its arrival time to all the
sensors, forming a location couple (for linear location) or three (for plane location
types) will differ from the arrival times of the previous located event by not less,
than the dead time value specified. For using this criterion switch the Dead time
for location switch on and specify the dead time value in the [mcs] entry field.
User manual — A-Line 32D
Chapter 7. Location
106
◇ In the Coordinate intervals group set the coordinates of the area, where the AE pulse
source is located.
• Set the X-coordinate switch, (and the Y-coordinate switch at plane location
scheme; and the Z-coordinate switch at the 3D volume location scheme).
• Enter the corresponding coordinates in the Lower limit and the Upper limit fields.
In case the X-coordinate switch and the Y-coordinate switch, or both switches
together are not activated, the whole coordinates range will be examined.
◇ In the Filter action group set the switch, corresponding to the necessary action on
events:
• for excluding the events which got into the selected zone, set the Delete event
record(s) switch;
• for excluding the events which did not get into the selected zone, set the Keep
event record(s) switch.
For saving the filtering results, activate the Save it in file switch in the Saving options
group. Then, specify the file name in the File name .aid entry field, or press the Browse
button and select the necessary file with the help of the Open file standard dialog box.
For saving all the events (and not only the located events) into a file, activate the Do
not delete unlocated events switch.
After setting all the parameters, press the OK button. For canceling the changes
applied, press the Cancel button.
7.16. Clusterization
The program provides for possibility of displaying the number of located events and
location amplitude. For this press the Change settings button in the Clusterization
legend group in the Location scheme settings dialog box. After that the Clusterization
settings dialog box will appear.
User manual — A-Line 32D
Chapter 7. Location
107
Fig. 7.19. Clusterization settings dialog box
In the dialog box open set the following
◇ In the Location events clusters group with the help of Num events spinners set
the ranges of all the registered events on every interval. Besides, in this group you
can select the display color for every interval. Setting the color will be performed by
pressing the Set color button in the corresponding subgroup and selecting the color
in the Color standard dialog box.
◇ In the same way, the location amplitudes intervals and their corresponding colors will
be selected in the Location amplitude clusters group.
◇ In the Cluster size group in the Length, mm, Width, mm and the Height, mm entry
fields the cluster size will be set.
After setting the clusterization parameters, press the OK button. Control will return
to the Location Scheme Settings dialog box. In the Clusterization legend group, the
selected colors corresponding to different ranges of the registered events and location
amplitude number will be displayed. The selected cluster size will as well be specified
there.
✶
✶
User manual — A-Line 32D
✶