1
DELTA Family
Handheld XRF Analyzer
User Interface Guide
International edition
103202-01EN — Revision A
December 2012
Olympus NDT, 48 Woerd Avenue, Waltham, MA 02453, USA
© 2012 Olympus NDT, Inc. All rights reserved. No part of this publication may be
reproduced, translated, or distributed without the express written permission of
Olympus NDT, Inc.
This document was prepared with particular attention to usage to ensure the accuracy of
the information contained therein, and corresponds to the version of the product
manufactured prior to the date appearing on the title page. There could, however, be some
differences between the manual and the product if the product was modified thereafter.
The information contained in this document is subject to change without notice.
International edition
Part number: 103202-01EN
Revision A
December 2012
Printed in the United States of America
All brands are trademarks or registered trademarks of their respective owners and third
party entities. The Bluetooth® word mark and logos are registered trademarks owned by
Bluetooth SIG, Inc. and any use of such marks by OLYMPUS Corporation is under license.
103202-01EN, Rev. A, December 2012
Table of Contents
List of Abbreviations .............................................................................................................. vii
Important Information — Please Read Before Use ............................................................. 1
Intended Use ....................................................................................................................................... 1
Instruction Manual ............................................................................................................................. 1
Safety Symbols .................................................................................................................................... 1
Safety Signal Words ............................................................................................................................ 2
Note Signal Words .............................................................................................................................. 2
Warranty Information ........................................................................................................................ 3
Technical Support ............................................................................................................................... 3
1. Home Screen and System Setup ....................................................................................... 5
1.1
1.2
1.3
Home Screen .............................................................................................................................. 5
System Setup ............................................................................................................................. 6
Trigger Hardware ..................................................................................................................... 7
1.3.1 Viewing the hardware status ......................................................................................... 7
1.3.2 Working with trigger settings ....................................................................................... 8
1.3.3 Changing the barometer settings ................................................................................ 10
1.3.4 Viewing the Error Log .................................................................................................. 11
1.3.5 Setting the Regulatory Level ....................................................................................... 11
1.4 Bluetooth GPS .......................................................................................................................... 12
1.5 Admin Prefs ............................................................................................................................. 13
1.6 Factory Settings ....................................................................................................................... 14
1.7 Date and Time ......................................................................................................................... 14
1.8 Printer ....................................................................................................................................... 15
1.9 Users ......................................................................................................................................... 17
1.10 Exit ............................................................................................................................................ 18
2. Alloy, Alloy Plus, and Precious Metals Modes ............................................................ 21
2.1
2.2
2.3
2.4
2.5
2.6
2.7
2.8
About Alloy Analysis Modes ................................................................................................ 21
Test Setup ................................................................................................................................. 21
End Time Type ........................................................................................................................ 23
Alloy Options .......................................................................................................................... 24
Alloy Plus Options .................................................................................................................. 25
Al Mode .................................................................................................................................... 26
Au Karating ............................................................................................................................. 26
Library Manager ..................................................................................................................... 27
2.8.1 Configuring Match Settings ......................................................................................... 28
2.8.2 Loading Grade Libraries .............................................................................................. 31
2.8.3 Editing Grade Libraries ................................................................................................ 32
2.8.4 Creating a Pass/Fail Operation .................................................................................... 38
Table of Contents
iii
103202-01EN, Rev. A, December 2012
3. Soil, Mining, and Geochem Modes ................................................................................ 43
3.1
3.2
3.3
3.4
Test Setup ................................................................................................................................. 43
End Time Type ........................................................................................................................ 44
User Factors ............................................................................................................................. 45
Packaging Directive (Optional Configuration) ................................................................... 46
4. Consumer Safety and RoHS/WEEE Modes .................................................................. 49
4.1
4.2
4.3
Test Setup ................................................................................................................................. 49
End Time Type ........................................................................................................................ 50
RoHS Mode Settings ............................................................................................................... 51
4.3.1 Action Level ................................................................................................................... 51
4.3.1.1 Viewing IEC Setting ............................................................................................ 52
4.3.1.2 Editing User Defined Settings ........................................................................... 53
4.3.2 Set End Condition ......................................................................................................... 56
4.3.3 Surface Pb ....................................................................................................................... 56
4.4 Force Classification ................................................................................................................. 57
4.5 User Factor (RoHS/WEEE Specific) ...................................................................................... 58
5. Thin Modes ......................................................................................................................... 61
5.1
5.2
5.3
5.4
Test Setup ................................................................................................................................. 61
End Time Type ........................................................................................................................ 62
User Factors ............................................................................................................................. 63
Lead Paint (Test End Condition) ........................................................................................... 64
6. Universal Mode Settings .................................................................................................. 67
6.1
6.2
Reset Test Conditions ............................................................................................................. 67
Test Labeling ............................................................................................................................ 69
6.2.1 Setting Up Text Style ..................................................................................................... 71
6.2.2 Setting Up Fixed List Style ........................................................................................... 71
6.2.3 Setting Up the Auto Incrementing Style .................................................................... 72
6.2.4 Viewing Test Labels in the Test or Results Screen .................................................... 73
6.2.5 Test label editing options ............................................................................................. 74
6.3 Customize Display Function ................................................................................................. 75
6.3.1 Selecting the Check Box, LOD NSigma, and Compound Options ........................ 75
6.3.2 Element Display Order Options ................................................................................. 78
6.4 Element Suite Screen .............................................................................................................. 78
7. Test ........................................................................................................................................ 81
7.1
7.2
Before you begin ..................................................................................................................... 81
Turning the Analyzer On and Off ........................................................................................ 81
7.2.1 Calibration Check .......................................................................................................... 83
7.2.1.1 General Facts About Cal Check ......................................................................... 83
7.2.1.2 Conducting a Cal Check ..................................................................................... 83
7.2.1.3 Troubleshooting a Cal Check ............................................................................. 86
7.2.2 Conducting a sample test ............................................................................................. 86
7.3 Testing Best Practices .............................................................................................................. 88
7.3.1 Alloy Mode .................................................................................................................... 88
7.3.2 Mining and Soil Modes ................................................................................................ 88
7.3.3 Consumer Mode (RoHS) .............................................................................................. 89
8. Results .................................................................................................................................. 91
8.1
iv
Using the Results Screen ........................................................................................................ 91
Table of Contents
103202-01EN, Rev. A, December 2012
8.2
Exporting Results Information .............................................................................................. 94
8.2.1 Export options ............................................................................................................... 95
8.3 Trending ................................................................................................................................... 99
8.3.1 Setting up trending ....................................................................................................... 99
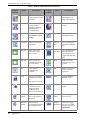
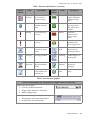
Appendix A: Graphic Elements .......................................................................................... 103
A.1 Home ...................................................................................................................................... 103
A.2 Graphic Elements .................................................................................................................. 103
Appendix B: Camera and Collimator ................................................................................. 107
B.1
B.2
Camera ................................................................................................................................... 107
Collimator .............................................................................................................................. 109
Appendix C: Averaging Test Results .................................................................................. 115
C.1
C.2
C.3
Live Averaging ...................................................................................................................... 115
Historical Averaging ............................................................................................................. 119
Repeated Tests With Averaging .......................................................................................... 123
Appendix D: Trending Example ......................................................................................... 125
Appendix E: User Factors ..................................................................................................... 129
E.1
E.2
E.3
E.4
E.5
E.6
Definition ............................................................................................................................... 129
Purpose ................................................................................................................................... 129
Applicable Modes ................................................................................................................. 129
Calculating New RoHS/WEEE Factors and Offsets ......................................................... 129
Software Operation ............................................................................................................... 131
Determining Correction Factors ......................................................................................... 133
Appendix F: RoHS/WEEE Analysis .................................................................................... 135
F.1
F.2
F.3
F.4
F.5
Background ............................................................................................................................ 135
Software Overview ............................................................................................................... 136
IEC Quantitative Screening Requirements ....................................................................... 136
Grade Definitions for Screening ......................................................................................... 137
Screening Limits for RoHS/WEEE Compliance ............................................................... 138
Appendix G: Test Time Notes ............................................................................................. 139
G.1 Background ............................................................................................................................ 139
G.2 Testing Time Issues — All Modes ...................................................................................... 139
G.3 Alloy Analysis Goals ............................................................................................................ 140
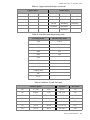
Appendix H: Alloy Grade Libraries ................................................................................... 141
H.1
H.2
H.3
H.4
Tramp Library ....................................................................................................................... 141
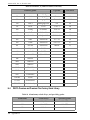
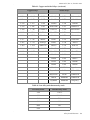
DELTA Classic, Classic Plus, and Inspector Factory Grade Library ............................. 142
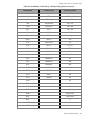
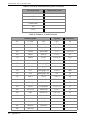
DELTA Standard and Professional Factory Grade Library ............................................ 146
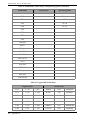
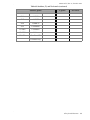
DELTA Premium and Premium Plus Factory Grade Library ........................................ 150
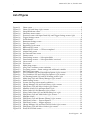
List of Figures ......................................................................................................................... 157
List of Tables ........................................................................................................................... 161
Index ......................................................................................................................................... 163
Table of Contents
v
103202-01EN, Rev. A, December 2012
vi
Table of Contents
103202-01EN, Rev. A, December 2012
List of Abbreviations
ACEA
IEC
LOD
MN
ND
OS
Advisory Committee on Environmental Aspects
International Electro-technical Commission
limit of detection
match number
non-detect
operating system
PD
PMI
RoHS
SDD
UI
WEEE
packaging directive
positive materials identification
Restriction of Hazardous Substances
silicon drift detector
user interface
Waste Electrical and Electronic Equipment
List of Abbreviations
vii
103202-01EN, Rev. A, December 2012
viii
List of Abbreviations
103202-01EN, Rev. A, December 2012
Important Information — Please Read Before Use
Intended Use
The DELTA family of handheld XRF analyzers is designed to perform identification and
analysis of elements contained within test samples, from magnesium to uranium (Mg to U),
depending on the selected model.
Do not use the DELTA for any purpose other than its intended use.
Instruction Manual
This instruction manual contains essential information on how to use this Olympus product
safely and effectively. Before using this product, thoroughly review this instruction manual.
Use the product as instructed.
Keep this instruction manual in a safe, accessible location.
Safety Symbols
The following safety symbols might appear on the instrument and in the instruction manual:
General warning symbol
This symbol is used to alert the user to potential hazards. All safety messages that follow
this symbol shall be obeyed to avoid possible harm or material damage.
High voltage warning symbol
This symbol is used to alert the user to potential electric shock hazards greater than
1000 volts. All safety messages that follow this symbol shall be obeyed to avoid possible
harm.
Important Information — Please Read Before Use
1
103202-01EN, Rev. A, December 2012
Safety Signal Words
The following safety symbols might appear in the documentation of the instrument:
The DANGER signal word indicates an imminently hazardous situation. It calls attention to
a procedure, practice, or the like, which, if not correctly performed or adhered to, could
result in death or serious personal injury. Do not proceed beyond a DANGER signal word
until the indicated conditions are fully understood and met.
The WARNING signal word indicates a potentially hazardous situation. It calls attention to a
procedure, practice, or the like, which, if not correctly performed or adhered to, could result
in death or serious personal injury. Do not proceed beyond a WARNING signal word until
the indicated conditions are fully understood and met.
The CAUTION signal word indicates a potentially hazardous situation. It calls attention to
an operating procedure, practice, or the like, which, if not correctly performed or adhered to,
could result in minor or moderate personal injury, material damage, particularly to the
product, destruction of part or all of the product, or loss of data. Do not proceed beyond a
CAUTION signal word until the indicated conditions are fully understood and met.
Note Signal Words
The following safety symbols could appear in the documentation of the instrument:
The IMPORTANT signal word calls attention to a note that provides important information,
or information essential to the completion of a task.
The NOTE signal word calls attention to an operating procedure, practice, or the like, which
requires special attention. A note also denotes related parenthetical information that is
useful, but not imperative.
The TIP signal word calls attention to a type of note that helps you apply the techniques and
procedures described in the manual to your specific needs, or provides hints on how to
effectively use the capabilities of the product.
2
Important Information — Please Read Before Use
103202-01EN, Rev. A, December 2012
Warranty Information
Olympus guarantees your Olympus product to be free from defects in materials and
workmanship for a specific period, and in accordance with conditions specified in the
Olympus NDT Terms and Conditions available at http://www.olympus-ims.com/en/terms/.
The Olympus warranty only covers equipment that has been used in a proper manner, as
described in this instruction manual, and that has not been subjected to excessive abuse,
attempted unauthorized repair, or modification.
Inspect materials thoroughly on receipt for evidence of external or internal damage that
might have occurred during shipment. Immediately notify the carrier making the delivery of
any damage, because the carrier is normally liable for damage during shipment. Retain
packing materials, waybills, and other shipping documentation needed in order to file a
damage claim. After notifying the carrier, contact Olympus for assistance with the damage
claim and equipment replacement, if necessary.
This instruction manual explains the proper operation of your Olympus product. The
information contained herein is intended solely as a teaching aid, and shall not be used in
any particular application without independent testing and/or verification by the operator or
the supervisor. Such independent verification of procedures becomes increasingly important
as the criticality of the application increases. For this reason, Olympus makes no warranty,
expressed or implied, that the techniques, examples, or procedures described herein are
consistent with industry standards, nor that they meet the requirements of any particular
application.
Olympus reserves the right to modify any product without incurring the responsibility for
modifying previously manufactured products.
Technical Support
Olympus is firmly committed to providing the highest level of customer service and product
support. If you experience any difficulties when using our product, or if it fails to operate as
described in the documentation, first consult the user’s manual, and then, if you are still in
need of assistance, contact our After-Sales Service. To locate the nearest service center, visit
the Service Centers page at: http://www.olympus-ims.com.
Important Information — Please Read Before Use
3
103202-01EN, Rev. A, December 2012
4
Important Information — Please Read Before Use
103202-01EN, Rev. A, December 2012
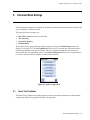
1. Home Screen and System Setup
1.1
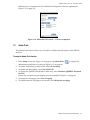
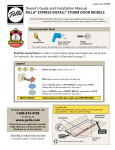
Home Screen
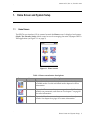
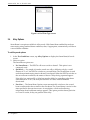
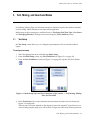
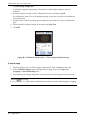
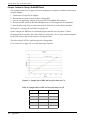
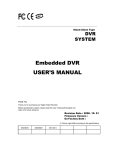
The DELTA user interface (UI) is centered around the Home screen. It displays four buttons
(Mode, Test, Results, Setup) which control access for managing the entire Olympus DELTA
XRF application (see Figure 1-1 on page 5).
Figure 1-1 Home screen
Table 1 Home screen button descriptions
Button
Name
Description
Mode
Opens the mode screen, where you can select and configure
available modes. See the individual mode chapters for more
information.
Test
Opens the Test screen, where you can perform a Cal Check,
modify test parameters, and run tests. See chapter 7 on page 81
for more information.
Results
Opens the Results screen, where you can view and analyze test
results. See chapter 8 on page 91 for more information.
Home Screen and System Setup
5
103202-01EN, Rev. A, December 2012
Table 1 Home screen button descriptions (continued)
Button
Name
Setup
1.2
Description
Opens the Setup screen, where you can configure system-wide
setup options. See section 1.2 on page 6 for more information.
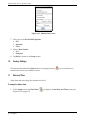
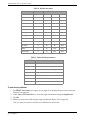
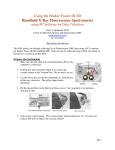
System Setup
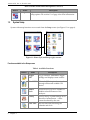
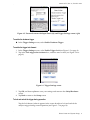
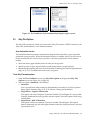
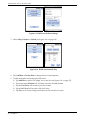
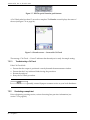
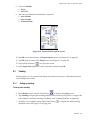
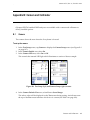
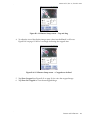
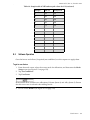
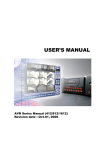
System-wide setup functions are accessed from the Setup screen (see Figure 1-2 on page 6).
Figure 1-2 Home (left) and Setup (right) screens
Functions available in the Setup screen
Table 2 Available Functions
Button
6
Chapter 1
Name
Description
Trigger
HW
Trigger hardware. Determines trigger
settings and displays status screens.
Blue T GPS
Bluetooth® GPS. Acquires location data
through a Bluetooth enabled GPS
device.
Admin
Prefs
Administrative preferences. Enables or
disables selected features of the
analyzer.
Factory
Factory settings. System settings set at
the time of manufacture — these
cannot be altered by the user.
Date Time
Sets the date and time using the
calendar and clock.
103202-01EN, Rev. A, December 2012
Table 2 Available Functions (continued)
1.3
Printer
Connects the analyzer to selected
Bluetooth enabled printers.
Users
Applies administrator and operator
user privileges.
Exit
Restart or shut down the analyzer.
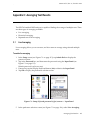
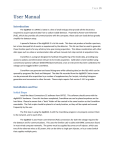
Trigger Hardware
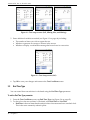
The Trigger HW (trigger hardware) function allows you to access information and
configuration screens.
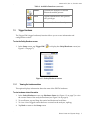
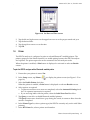
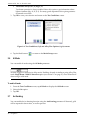
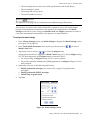
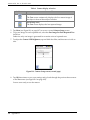
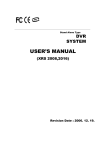
To view the Safety/Hardware screen
1. In the Setup screen, tap Trigger HW (
Figure 1-3 on page 7).
) to display the Safety/Hardware screen (see
Figure 1-3 Safety/Hardware screen
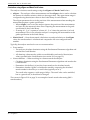
1.3.1
Viewing the hardware status
This option displays information about the state of the DELTA hardware.
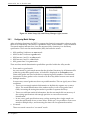
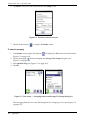
To view hardware status information
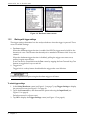
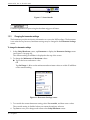
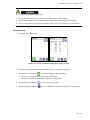
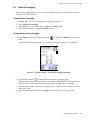
1. In the Safety/Hardware screen, tap Hardware Status (see Figure 1-3 on page 7) to view
the current status of the analyzer hardware (see Figure 1-4 on page 8).
2. To see all items, tap and drag the vertical and horizontal scroll bars.
3. To view a list of logged events that have occurred on the analyzer, tap Log.
4. Tap Back to return to the Setup screen.
Home Screen and System Setup
7
103202-01EN, Rev. A, December 2012
Figure 1-4 Hardware status screens
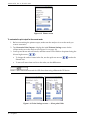
1.3.2
Working with trigger settings
The trigger settings determine how the analyzer behaves when the trigger is pressed. There
are two available settings:
•
•
Deadman trigger
When the deadman trigger function is enabled, the DELTA trigger must be held for the
duration of a test. This ensures that the analyzer is attended at all times while X-rays are
emitted.
When the deadman trigger function is disabled, pulling the trigger once starts a test,
pulling it again stops the test.
A test can also be controlled from the Test screen by tapping the Start Test and Stop Test
buttons to toggle the X-rays on and off.
Trigger lock
Trigger lock is a safety feature that disables the trigger after a set idle time.
Canadian regulations require using the deadman trigger at all times.
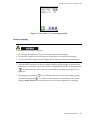
To select trigger settings
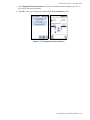
1. In the Safety/Hardware screen (see Figure 1-3 on page 7), tap Trigger Settings to display
the password screen (see Figure 1-5 on page 9).
2. Tap in the Password box, and then enter the password using the Input Panel (see
Figure 1-5 on page 9).
Default password is z (lower case).
3. Tap OK to display the Trigger Settings screen (see Figure 1-5 on page 9).
8
Chapter 1
103202-01EN, Rev. A, December 2012
Figure 1-5 Password screen with Input Panel (left) and Trigger Settings screen (right)
To enable the deadman trigger
In the Trigger Settings screen, select Enable Deadman Trigger.
To enable the trigger lock timeout
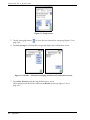
1. In the Trigger Settings screen, select Enable Trigger Lock (see Figure 1-5 on page 9).
2. Tap in the Lock trigger after n minutes box, and then enter a value (see Figure 1-6 on
page 9).
Figure 1-6 Trigger Settings screen
3. Tap OK, and then tap Save to save your settings and return to the Safety/Hardware
screen.
4. Tap Back to return to the Setup screen.
To lock and unlock the trigger during operation
Tap the Lock button (when it appears in the screen header) to lock and unlock the
analyzer trigger during normal operation (see Figure 1-7 on page 10).
Home Screen and System Setup
9
103202-01EN, Rev. A, December 2012
Lock button
Figure 1-7 Screen header
Canadian regulations require using the deadman trigger at all times.
1.3.3
Changing the barometer settings
The barometer provides air density information to correct the XRF readings. The barometer
is set at the factory, however, barometer settings may be changed in the Barometer Settings
screen.
To change the barometer settings
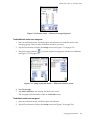
1. In the Safety/Hardware screen, tap Barometer to display the Barometer Settings screen
(see Figure 1-8 on page 10).
The current reading in millibars is displayed at the top of the screen.
2. To change the Minimum and Maximum values:
Tap on the boxes and enter a value
OR
Tap Set Range +/– 50 to set the minimum and maximum values to within 50 millibars
of the current reading.
Figure 1-8 Barometer Settings screen
3. To override the current barometer setting, select Use override, and then enter a value.
The override setting is disabled when you restart the analyzer software.
4. Tap Save to save your changes and return to the Safety/Hardware screen.
10
Chapter 1
103202-01EN, Rev. A, December 2012
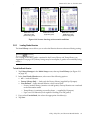
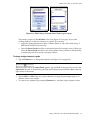
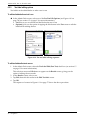
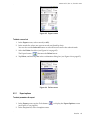
1.3.4
Viewing the Error Log
To view the error log information
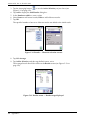
1. In the Safety/Hardware screen (see Figure 1-3 on page 7), tap Error Log to view a list of
logged events that have occurred on the analyzer (see Figure 1-9 on page 11).
2. To see all items, tap and drag the vertical and horizontal scroll bars.
3. To view the current status of the analyzer hardware, tap Info.
4. Tap Back to return to the Setup screen.
Figure 1-9 Error log screens
1.3.5
Setting the Regulatory Level
When 50 kV monitoring is enabled, you can set the maximum annual dose limit so that
warnings are displayed when that limit is approached and reached. You can also view the
Regulatory Level screen to track the annual totals.
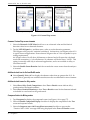
To set the regulatory level
1. In the Safety/Hardware screen, tap Regulatory Level (see Figure 1-3 on page 7) to
display the password screen.
2. Tap in the Password box, and then enter the password using the Input Panel.
Default password is z (lower case).
3. Tap OK to display the Regulatory Level screen (see Figure 1-10 on page 12).
4. Enter a value for maximum annual regulatory dose.
5. Tap Save.
Home Screen and System Setup
11
103202-01EN, Rev. A, December 2012
Figure 1-10 Regulatory Level screen
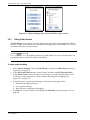
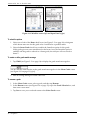
1.4
Bluetooth GPS
The Bluetooth® GPS function allows you to acquire GPS location data through a Bluetooth
enabled GPS device.
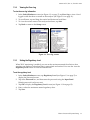
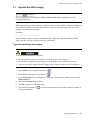
To configure the Bluetooth GPS function on the DELTA analyzer
1. Ensure that you have the Bluetooth device turned on.
2. In the Setup screen, tap BlueT GPS (
) to display the Bluetooth GPS screen (see
Figure 1-11 on page 12).
3. Select the Enable GPS check box.
4. Tap Query to begin the search for a compatible Bluetooth enabled device.
The Query button turns gray during the search. It changes back to blue when the search
is finished.
5. In the Bluetooth GPS list, select a device.
Figure 1-11 Bluetooth GPS screen
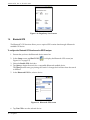
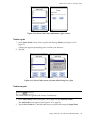
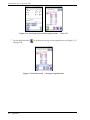
6. Tap Test GPS to test the selected device.
12
Chapter 1
103202-01EN, Rev. A, December 2012
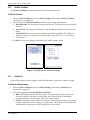
When the test is completed, the local latitude and longitude values are updated (see
Figure 1-12 on page 13).
Figure 1-12 Bluetooth GPS screen — GPS test completed
1.5
Admin Prefs
The Admin Prefs function allows you to enable or disable selected features of the DELTA
analyzer.
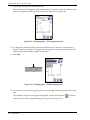
To setup the Admin Prefs function
1. In the Setup screen (see Figure 1-2 on page 6), tap Admin Prefs (
) to display the
administrative preferences screen (see Figure 1-13 on page 14).
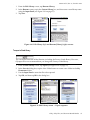
2. To enable AU karating in Alloy mode, select AU Karating.
3. To enable test label editing, select Test Label Edit.
4. To display the QWERTY keyboard for data entry, select Default to QWERTY Keyboard
For Text.
Otherwise, a numeric keypad displays (see the example in Figure 1-6 on page 9).
5. To enable live averaging, select Live averaging.
6. To enable historical averaging in test results, select Historical averaging.
Home Screen and System Setup
13
103202-01EN, Rev. A, December 2012
Figure 1-13 Admin Prefs screen
7. Select one of the Pre-Test Edit Options:
• Off
• Optional
• Force
8. Select a Date Format:
• U.S.
• European
9. Tap Back to return to the Setup screen.
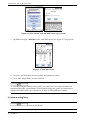
1.6
Factory Settings
The functionality behind the Factory (factory settings) button (
manufacture and is not available to users.
1.7
) is set at the time of
Date and Time
Setup date and time using the calendar and clock.
To change the date or time
1. In the Setup screen, tap Date Time (
Figure 1-14 on page 15).
14
Chapter 1
) to display the Set Date and Time screen (see
103202-01EN, Rev. A, December 2012
Figure 1-14 Set Date and Time screen
2.
3.
4.
5.
1.8
Tap the left and right arrows on the upper bar to move to the proper month and year.
Tap the desired date.
Tap the up/down arrows to set the time.
Tap OK.
Printer
The DELTA analyzer is configured to print to selected Bluetooth® enabled printers. The
primary purpose of the Printer function is to enable pairing between the DELTA analyzer
and a printer. The print output also can be customized for each analyzer mode.
When the printer is enabled, a Print button is displayed or activated on relevant Results
screens.
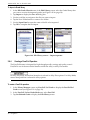
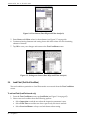
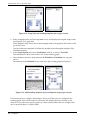
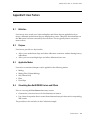
To pair the DELTA analyzer with a Bluetooth enabled printer
1. Ensure that your printer is turned On.
2. In the Setup screen, tap Printer (
) to display the printer screen (see Figure 1-15 on
page 16).
3. Select the Enable Printer check box.
When the printer is enabled, a Print button is displayed on relevant Results screens.
4. Select options as required:
• To print test results as soon tests are completed, select the Automatic Printing check
box. No operator intervention is required.
• If you are using labels with the printer, select the Label Form Feed check box.
5. Tap Query to search for available Bluetooth enabled printers.
The Query button turns from blue to gray during the search; it returns to blue when the
search is completed.
6. In the Printer Type list, select a printer type (the DELTA currently only works with Zebra
printers).
7. In the BT Printer list, select a printer serial number.
Home Screen and System Setup
15
103202-01EN, Rev. A, December 2012
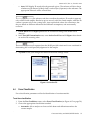
Figure 1-15 Printer screen
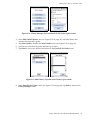
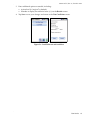
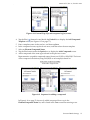
To customize the print output for the current mode
1. Before customizing the printer output, make sure the analyzer is set to the mode you
want to customize.
2. Tap Customize Print Output to display the initial Printout Settings screen for the
current mode set on the analyzer (see Figure 1-16 on page 16).
3. Scroll up and down and select items, and then create a list of fields to be printed using the
left and right arrows (
•
•
/
).
To change the order of items in the list, use the up/down arrows (
Printed area.
To move all items from one list to the other, use the All buttons.
/
) under the
Fields 7 and 8 should be reserved for GPS data when using a Bluetooth GPS device.
Figure 1-16 Print Settings screens — Select print fields
16
Chapter 1
103202-01EN, Rev. A, December 2012
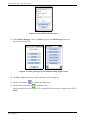
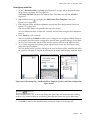
4. Tap Set Chemistry to display the next Printout Settings screen (see Figure 1-17 on
page 17).
5. Scroll up and down and select items, then create a list of elements to print using the left
and right arrows:
• To change the order of items in the list, use the up/down arrows under the Printed
area.
• To move all items from one list to the other, use the All buttons.
6. To print by descending order of concentration, select the Order by Value check box.
7. To print the entire element suite of the selected mode, select the Show All check box.
Figure 1-17 Print Settings screens — Select print fields (continued)
8. Tap OK to save your changes and return to the previous Print Settings screen.
9. Tap OK again to return to the printer screen.
10. Tap OK a final time to save changes, exit the Print function, and return to the Setup
screen.
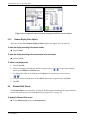
1.9
Users
Applying user (administrator and operator) privileges permits supervisory management to
maintain control over sorting activities.
•
•
Administrators can set (and modify):
— Trigger hardware options
— Mode test conditions
— Display parameters
— Library Manager functions.
Operators can view most options and parameters, but cannot make changes.
To set user privileges
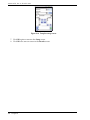
1. In the Setup screen, tap Users (
page 18).
) to display the users screen (see Figure 1-18 on
Home Screen and System Setup
17
103202-01EN, Rev. A, December 2012
2. In the Administrator area, tap in the Password box, and then enter the administrator
password.
3. Tap in the Verify box, and then enter the password again.
4. In the Operator area, tap in the Password box, and then enter the operator password.
5. Tap in the Verify box, and then enter the password again.
6. When completed, tap the Display Keyboard button (abc) to close the Input Panel.
7. Tap Save to save your changes and return to the Setup screen.
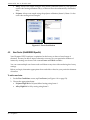
Figure 1-18 Users screen
1.10 Exit
1. In the Setup screen, tap Exit to display the exit screen (see Figure 1-19 on page 18).
Figure 1-19 Exit screen
The exit screen displays three options (see Table 3 on page 19).
18
Chapter 1
103202-01EN, Rev. A, December 2012
Table 3 Exit screen options
Restart the operating system (OS) and
restart the analyzer software.
Restart the analyzer software.
Shuts the system software down and
powers the analyzer off (confirmation
required).
Home Screen and System Setup
19
103202-01EN, Rev. A, December 2012
20
Chapter 1
103202-01EN, Rev. A, December 2012
2. Alloy, Alloy Plus, and Precious Metals Modes
Alloy, Alloy Plus, and Precious Metals modes are similar in operation, though the end-user
objectives are different, and the modes use a different number of X-ray beams. Alloy Plus
mode uses two beams, and its second beam is able to detect lighter elements such as
magnesium (Mg) and aluminum (Al). Alloy mode also uses two beams, though its second
beam is used to improve precision on titanium (Ti) and vanadium (V) measurement.
Precious Metals mode uses one beam.
Mode setup involves setting test conditions such as Test Setup, End Time Type, and various
Alloy Options. Settings are accessed using the Test Conditions screen.
2.1
About Alloy Analysis Modes
When the DELTA analyzer is in an alloy analysis mode, it calculates elemental chemistry
from the spectral data. The analyzer then compares chemical composition values to Factory
Grade library grade tables, and generates grade ID and chemistry values in as little as one
second.
The Precious Metals mode includes a Plate Alert feature that alerts you to the possibility that
the object being analyzed is gold-plated. Plate Alert works by analyzing spectra to determine
whether or not the object has a thin coating or plating of gold. If the analysis is affirmative,
the message, “Gold Coating Possible - Investigate” is displayed with the test results. Also, if a
gold content is detected, but measures less than 8 karat, the plate alert message is displayed.
Absence of the Plate Alert warning means that there is not enough information to conclude if
the sample has a gold coating or is solid.
2.2
Test Setup
The Test Setup screen allows you configure test parameters such as test time and test repeat.
To configure test setup
1. Select the appropriate mode, and then tap Mode Setup.
2. From the Mode Setup screen, tap Test Conditions (see Figure 2-1 on page 22).
Alloy, Alloy Plus, and Precious Metals Modes
21
103202-01EN, Rev. A, December 2012
Figure 2-1 Mode Setup screen
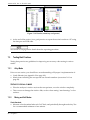
3. From the Test Conditions screen (see Figure 2-2 on page 22), tap the Test/Tools button
(
).
Figure 2-2 Alloy Test Conditions screen variations
In the Beams area, only one beam is available in Alloy and Precious Metals modes, while
two beams are available in Alloy Plus mode.
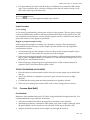
4. In the Test Setup screen, enter minimum and maximum test times for each beam (see
Figure 2-3 on page 23).
• Min is the minimum testing time before test results are actually calculated and
displayed. This value can be set to zero.
• Max is the total length of time a test runs. If the time is configured too short, the test
can fail or imprecisely calculate results.
5. Enter additional variables as needed (see Figure 2-3 on page 23), including:
• The number of times you want to repeat the test.
• Whether to display a confirmation message before each test.
• Whether to generate an average of all tests in a test set.
22
Chapter 2
103202-01EN, Rev. A, December 2012
Beam settings
Additional variables
Figure 2-3 Test Setup screens — Beam settings and additional variables
If the Generate Avg check box is selected, spectrum results (plots) are NOT available for the
average result.
6. Tap OK to save your changes and return to the Test Conditions screen.
2.3
End Time Type
You can control how test end time is calculated using the End Time Type parameter.
To change the end time type:
1. From the Test Condition screen, tap End Time Type to display the End Time Type screen
(see Figure 2-4 on page 24).
2. In the Test End area, select the RealTime or LiveTime check box.
• RealTime is the total interval that the analysis takes when measured on a standard
clock. This is the most commonly selected option.
• LiveTime is the interval in which the detector of the analyzer actually collects data.
Since the analyzer does not always collect data throughout a measurement, LiveTime
is less than the RealTime interval. LiveTime is selected primarily for laboratory
calibration applications that require precise and repeatable results.
3. Tap Save to save your changes and return to the Test Conditions screen.
Alloy, Alloy Plus, and Precious Metals Modes
23
103202-01EN, Rev. A, December 2012
Figure 2-4 End Time Type screen
2.4
Alloy Options
Smart Beam is an option available in Alloy mode. With Smart Beam enabled the analyzer
starts testing using standard beam conditions, then, if appropriate, automatically switches to
a second beam condition.
To set Alloy mode options
1. In the Test Conditions screen, tap Alloy Options to display the Smart Beam/Al mode
screen.
2. Select an option.
The Smart Beam options are:
• No Smart Beam — The DELTA will never switch to beam 2. This option is not
commonly used.
• QuickSort — If a sample is found to match two alloys, differing only by a small
amount of Ti or V, the DELTA switches to a second beam. The second beam is used
until the maximum testing time for beam 2 has elapsed. When the DELTA switches to
the second beam conditions, the names of the two alloys being separated appear.
If the alloy has a unique ID or if the best matches differ by something other than a
small amount of Ti or V, the analyzer functions as it does with Smart Beam
deactivated.
• Precision — The Smart Beam Option screen automatically switches to the second
beam condition after the set time for the first beam. The second beam is active for the
time specified in the test time screen. At completion, a final result reflecting
information from both beam settings appears. This option provides better precision
on Ti and V results, if they are present in the alloy.
24
Chapter 2
103202-01EN, Rev. A, December 2012
Figure 2-5 Test Conditions (left) and Smart Beam Option (right) screens
2.5
Alloy Plus Options
The Alloy Plus options are found only when in the Alloy Plus mode. A DELTA analyzer with
Alloy Plus mode enabled is a two beam instrument.
About the SmartSort function
The SmartSort function promotes automated sorting decisions that allow you to maximize
speed and sorting accuracy. When the SmartSort function is enabled, Alloy Plus will switch
to the second beam if it is necessary to provide a conclusive grade match. Some features
include:
•
•
•
Short test times (approximately three seconds) for most grades.
Specific grades set up to automatically extend testing time for proper analysis.
Maximum speed testing efficiency by automatically extending test time for light elements
(Mg, Al, Si, P, S). This eliminates unnecessary long tests.
To set Alloy Plus mode options
1. From the Test Conditions screen, tap Alloy Plus Options to display the Alloy Plus
Options screen (see Figure 2-6 on page 26).
2. Select an option (SmartSort is the default).
• SmartSort
Uses a second beam when needed as determined by the analyzer. Use this option to
detect lighter elements (Mg, Al, Si, P, S) without creating unwanted data.
• Single Beam - Suppress LE detection
This option will test for elements Ti (Atomic Number 22) and higher. It is not possible
to match aluminum-base alloy grades with this option. Select this option when using
a Weld Mask.
• Single Beam - With LE detection
This option will test for elements Ti (atomic number 22) and higher. This option
detects aluminum (Al) and other light elements indirectly during the beam 1 test and
reports them as LE.
Alloy, Alloy Plus, and Precious Metals Modes
25
103202-01EN, Rev. A, December 2012
•
Two Beams Always (Al, Si, Mg, S, P)
Two beam operation is always enabled. Select this option to get information about
lighter elements (Mg, Al, Si, P, S). For many grade separations this option generates
unwanted excess data.
3. Tap OK to save your selection and return to the Test Conditions screen.
Figure 2-6 Test Conditions (left) and Alloy Plus Options (right) screens
4. Tap the Back button (
2.6
) to return to the Mode Setup screen.
Al Mode
You can enable Al mode using the Al Mode parameter.
Al mode toggles LE detection in Alloy mode. Enabling Al mode is similar to using Alloy Plus
mode Single Beam - With LE detection option (see section 2.5 on page 25). Turn Al mode off
when using a weld mask.
To enable Al mode
1. From the Test Conditions screen, tap Al Mode to display the Al Mode screen.
2. Select the On option.
3. Tap OK.
2.7
Au Karating
You can enable the Au karating function using the Au Karating parameter. If detected, gold
will be reported in karat value, as well as percent.
26
Chapter 2
103202-01EN, Rev. A, December 2012
To configure Au karating
1. If the Au karating function is enabled, tap Au Karating to display the Au Karating screen
(see Figure 2-7 on page 27).
Figure 2-7 AU Karating button (left) and AU Karating screen (right)
2.
3.
4.
5.
2.8
In the Au Karat Display area, select On.
In the Chemistry Display area, select On or Off.
Make a selection in the Decimal Place Option area.
Tap Save.
Library Manager
The Library Manager is available only in the Alloy and Alloy Plus modes.
You can edit all libraries, including the Factory Grade library. However, Olympus does not
recommend that you edit the Factory Grade library. Instead, Olympus suggests that you copy
the Factory Grade library to a user library, then make any edits on the newly created user
library.
There are four segments to the Library Manager:
•
•
•
•
Match Settings
Load Library
Edit Library
Pass-Fail / Select Grade
To open the Library Manager
•
In the Mode Setup screen, tap Library Manager to display the Library Manager screen
(see Figure 2-8 on page 28).
Alloy, Alloy Plus, and Precious Metals Modes
27
103202-01EN, Rev. A, December 2012
Figure 2-8 Mode Setup (left) and Library Manager (right) screens
2.8.1
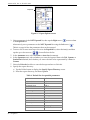
Configuring Match Settings
After calculating chemistry, the DELTA compares the chemical composition values to grade
tables in a Grade library. The value for a parameter called “match number” is then calculated.
The match number indicates how close the measured alloy chemistry is to the library
specification. The lower the match number (MN), the better the match:
•
•
•
•
•
MN equalling 0 indicates an exact match.
MN less than 1 indicates a good match.
MN between 1 and 2 is an okay match.
MN between 2 and 3 is a fair match.
MN greater than 3 is a poor match.
There are three match determination possibilities provided within the Alloy modes:
•
•
•
28
Exact match or good match
An exact match or good match means that the calculated chemistry for all elements falls
within the grade table specifications. A Grade ID is displayed on the Results screen.
Often other grades are listed with their accompanying match numbers. The elemental
chemistries of those grades can be viewed to see how they differ from an exact match.
Multiple matches
In some cases, several grades are shown as possible matches. This can signify one of three
conditions:
— There was not enough statistical information to definitively separate two or more
alloys. The actual identification of the unknown alloy is one of the grades listed.
Often, increasing the testing time makes it possible to separate the alloys.
— There was sufficient statistical information, but the test sample did not meet any of
the existing specifications with enough precision to cause an exact match
identification.
— In rare cases, grade specifications may overlap, meaning that a single sample can
meet the specification of two or more alloys. In this case, it is possible to see an exact
match to multiple alloys, and increasing test time will not separate the matches.
No match
There are several causes for a “no match” result:
Chapter 2
103202-01EN, Rev. A, December 2012
—
—
—
—
The test sample does not meet any of the specifications in the Grade library.
The test sample is coated.
The testing time was too short.
The match number is too low.
See Appendix H on page 141 for information on troubleshooting valid matches.
There may be occasions when valid matches fail to register as exact. This could happen
because of measurement uncertainties or the presence of tramp elements. The Match
Settings screen allows you to change the Match Cutoff and nSigma parameters in order to
correct for measurement uncertainties or the presence of tramp elements.
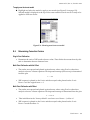
To configure the match settings
1. In the Library Manager screen, tap Match Settings to display the Match Settings screen
(see Figure 2-9 on page 29).
2. In the Grade Match Parameters area, tap the up or down arrows (
Match Cutoff value.
3. Tap the up or down arrows (
/
/
) to select a
) to select the nSigma value.
Sorting professionals have suggested a Match Cutoff setting of 5, and an nSigma setting
of 2. The most frequently used nSigma setting is between 0 and 2:
• For scrap sorting, an nSigma setting of 0 or 1 is most common.
• For positive materials identification (PMI) applications, an nSigma setting of 1 or 2 is
most common.
4. Optionally select any of the following check boxes:
• Enable grade match messages (see section 2.8.3 on page 32 on grade match
messages)
• Enable grade match POPUP messages
• Enable Beep on grade match
5. Tap Save.
Figure 2-9 Match Settings screen
Alloy, Alloy Plus, and Precious Metals Modes
29
103202-01EN, Rev. A, December 2012
Calculations using nSigma and Match Cutoff values
The analyzer calculates match settings using the nSigma and Match Cutoff values.
•
•
nSigma —The analyzer collects measurements and the nSigma value is used to calculate
the amount of tolerable variation, relative to the target value. This approximate range is
configured using the min/max values in the Grade library for each element.
The nSigma parameter factors in the precision of the measurement when matching the
measurement against a grade specification:
— When nSigma is set to zero the analyzer ignores the precision of the measurement
and uses only the measured value when comparing the measurement to the grade
specification in the Grade library.
— A setting of 1, 2, or 3, equates to a factor of 1, 2, or 3 times the precision (±) of each
measurement. This occurs when the analyzer is comparing the measurement to the
grade specification in the Grade library.
Match Cutoff — Once the measured calculations are analyzed relative to the nSigma
value, the match number is calculated and compared to the user-configured match
number.
Typically, the analyzer searches for exact or nearest matches:
•
•
Exact matches
— The analyzer calculates chemistries using the Fundamental Parameters algorithm and
searches the Grade libraries.
— All chemistry values must be within a user-definable error band of the min/max
values specified in the Grade libraries (see section 2.8.3 on page 32).
Nearest Matches — When searching for a nearest match the analyzer:
— Calculates chemistries using the Fundamental Parameters algorithm and searches the
Grade libraries
— Determines which alloy(s) is (are) the closest match to the calculated results
— Determines whether a grade is considered a match by comparing the calculated
match number for that alloy to a cutoff value (typically set at 3).
The cutoff value supports a wide range of alloys. The cutoff value can be modified,
but as a general rule, it should not be changed.
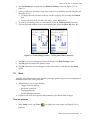
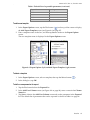
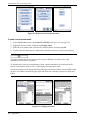
The screens in Figure 2-10 on page 31 are examples of match results after testing (MN =
match number).
30
Chapter 2
103202-01EN, Rev. A, December 2012
Good match for 5052
Fair match for 5454
(Aluminum Alloy grades)
Exact match for C623
(Copper Alloy grade)
Exact match for 5052-plus
Good match for 6061
(Aluminum Alloy grades)
Figure 2-10 Screens showing various match conditions
2.8.2
Loading Grade Libraries
The Load Library screen allows you to select the libraries that are referenced during testing.
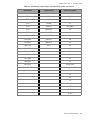
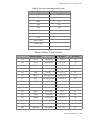
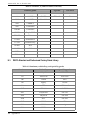
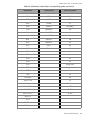
For a listing of the Alloy grades contained in the Factory library and Tramp library, see
Appendix H on page 141. (Library listings may be incomplete, a grades are continually being
added.)
To load the Grade libraries
1. Tap Library Manager in the Mode Setup screen, then tap Load Library (see Figure 2-11
on page 32).
2. In the Load Grade Libraries area, select one of the following options:
• All — loads all libraries.
• Factory Library Only — loads only the Factory library (supplied by Olympus).
• User-defined — loads selected libraries, which can include
— Factory {model} library (contains over 400 grades). Factory libraries are correlated
to the instrument model
— Tramp library, (containing seven alloy bases — supplied by Olympus).
— Up to two User libraries (each capable of holding over 500 grades)
3. If you select User-defined, also select the appropriate checkbox(es).
4. Tap Save.
Alloy, Alloy Plus, and Precious Metals Modes
31
103202-01EN, Rev. A, December 2012
Figure 2-11 Library Manager (left) and Load Library (right) screens
2.8.3
Editing Grade Libraries
The Edit Library screen allows several configuration options that can be applied to DELTA
libraries. Grades can be added to any library and existing grades can be edited. Also, the two
user-defined libraries can be renamed.
You can edit all libraries, including the Factory Grade library. However, Olympus does not
recommend that you edit the Factory Grade library.
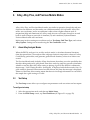
To select a grade for editing
1. In the Library Manager screen, tap Edit Library to display the Edit Library screen (see
Figure 2-12 on page 33).
2. In the Edit Grade Libraries area, select a library, and then tap Edit Existing Grades.
3. In the Select Grade screen (see Figure 2-12 on page 33), use the up/down arrows and
scroll bar to locate the grade you want, and then tap the grade to highlight (see
Figure 2-12 on page 33).
4. Optionally create a grade match message. Grade match messaging offers:
• Immediate sorting instructions
• Less operator training
• More efficiency and higher throughput.
5. Tap Select to save your selection and display the Min/Max screen (see Figure 2-13 on
page 34).
32
Chapter 2
103202-01EN, Rev. A, December 2012
Figure 2-12 Edit Library (left) and Select Grade (right) screens
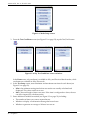
The primary purpose of the Min/Max screen (see Figure 2-13 on page 34) is to edit
existing elements, or add new elements to a grade. You can also:
• Apply the grade parameters to Beam 1, Beam 2 (Beam 2; Alloy Plus mode only), or
both beams (Alloy Plus mode only).
• Select the Smart Grade check box to maximize speed and sorting accuracy. When you
select the Smart Grade check box, the current grade is then selected to automatically
extend testing time if necessary for proper analysis.
To change existing elements in a grade
1. Tap an Elements box to change that element (see Figure 2-13 on page 34).
When you tap in a box, the Input Panel appears. Tap and hold on the gray area to move the
Input Panel around. To dismiss the panel, tap the Display Keyboard button (abc) at the top
right corner of the screen.
2. Tap the Min% or Max% box for a given element to change the percentage range of an
element within a test sample.
3. To create a new element, tap an empty Elements box, and then assign min/max values.
Alloy, Alloy Plus, and Precious Metals Modes
33
103202-01EN, Rev. A, December 2012
Figure 2-13 Min/Max screen (left) and Input Panel (right)
To select the options
1. Select one or both of the Beam check boxes (see Figure 2-13 on page 34) to designate
which beams must run for this grade to be considered as a possible match.
2. Select the Smart Grade check box to enable the SmartSort option for this grade.
If this grade gives an exact match based on the beam 1 test, the SmartSort option is
enabled, and the grade is selected as a Smart grade, the analyzer will not switch to
beam 2.
To create or edit a grade match message
1. Tap GMM (see Figure 2-13 on page 34) to display the grade match message box.
This box has the same function as the grade match message box in the Select Grade screen
(see Figure 2-12 on page 33 [right]).
2. Edit an existing message or create a new one.
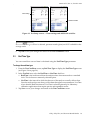
To rename a grade
1. In the Select Grade screen, select a grade, and then tap Rename.
2. In the Rename screen (see Figure 2-14 on page 35), tap in the Grade Libraries box, and
then enter a new name.
3. Tap Save to save your work and return to the Select Grade screen.
34
Chapter 2
103202-01EN, Rev. A, December 2012
Figure 2-14 Select Grade (left) and Rename (right) screens
To delete a grade
1. In the Select Grade screen, select a grade, and then tap Delete (see Figure 2-15 on
page 35).
A dialog box appears prompting you to confirm your selection.
2. Tap Yes.
Figure 2-15 Select Grade screen (left) and delete dialog box (right)
To add a new grade
You cannot add a new grade to the Factory Grade library.
1. In the Edit Library screen (see Figure 2-16 on page 36), tap Add New Grade.
The Add Grade screen appears (see Figure 2-16 on page 36).
2. Tap the New Grade box, and then enter the new grade name using the Input Panel.
Alloy, Alloy Plus, and Precious Metals Modes
35
103202-01EN, Rev. A, December 2012
Figure 2-16 Edit Library (left) and Add Grade (right) screens
3. Tap Save to display a Min/Max screen with blank boxes (see Figure 2-17 on page 36).
Figure 2-17 Min/Max screen
4. Tap a box, and then enter element symbols and parameter values.
5. To see more empty fields, use the scroll bar.
To accurately complete adding a new grade, you must have a list of the minimum and
maximum allowable concentrations of each element in the new grade. It is important to
include all elements that may be present in an alloy, including balance elements.
To rename an existing library
You cannot rename the Factory Grade library.
36
Chapter 2
103202-01EN, Rev. A, December 2012
1. From the Edit Library screen, tap Rename Library.
2. In the Rename screen, tap in the Custom Library box, and then enter a new library name
using the Input Panel (see Figure 2-18 on page 37).
3. Tap Save.
Figure 2-18 Edit Library (left) and Rename [library] (right) screens
To export a Grade library
You can import data into all the libraries, including the Factory Grade library. However,
Olympus does not recommend that you change the Factory Grade library.
1. From the Edit Library screen, tap Export (see Figure 2-19 on page 37).
2. In the Save As dialog box, tap the New Folder button to create a new folder in the My
Documents folder.
3. Use the Input Panel to enter the file to be exported.
4. Tap OK, and then tap OK in the dialog box.
Figure 2-19 Edit Library screen — Export sequence
Alloy, Alloy Plus, and Precious Metals Modes
37
103202-01EN, Rev. A, December 2012
To import a Grade library
1. In the Edit Grade Libraries area of the Edit Library screen, select the Grade library that
you want to receive the imported grades (see Figure 2-20 on page 38).
2. Tap Import to display the Save As dialog box.
3. Use the scroll bar to navigate to the file you want to import.
4. Tap the New Folder button to create a new folder.
5. Use the Input Panel to enter the name of the file to be imported.
6. Tap OK to complete the file import.
Figure 2-20 Edit Library screen — Import sequence
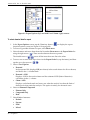
2.8.4
Creating a Pass/Fail Operation
The Pass/Fail feature is designed for high-throughput alloy sorting and quality control.
Pass/Fail is one of the most useful features within the Alloy or Alloy Plus modes.
In Alloy Plus mode, ensure that SmartSort is selected in Alloy Plus options. For Alloy Mode,
ensure that QuickSort is selected in Alloy options.
To create a Pass/Fail operation
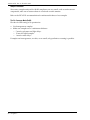
1. In the Library Manager screen, tap Pass-Fail / Sel Grade to display the Pass/Fail Sel
Grade screen (see Figure 2-21 on page 39).
2. In the Pass Fail / Select Grade Mode area, select Pass/Fail.
3. Tap Set Selected Grade to display the Edit Library screen.
38
Chapter 2
103202-01EN, Rev. A, December 2012
Figure 2-21 Library Manager (left) and Pass/Fail Sel Grade (right) screens
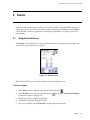
4. In the Edit Grade Libraries area (see Figure 2-22 on page 39), select the library that
contains the target alloy grade.
5. Tap Select Grade to display the Select Grade screen (see Figure 2-22 on page 39).
6. Scroll down to the desired grade, and then tap to select.
7. Tap Select to save your selection and return to the Pass/Fail Sel Grade screen.
Figure 2-22 Edit Library (left) and Select Grade (right) screens
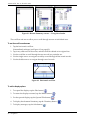
8. In the Pass/Fail Sel Grade screen (see Figure 2-23 on page 40), tap Back to return to the
Library Manager screen.
Alloy, Alloy Plus, and Precious Metals Modes
39
103202-01EN, Rev. A, December 2012
Figure 2-23 Pass/Fail Sel Grade screen
9. In the Library Manager screen, tap Back to display the Mode Setup screen (see
Figure 2-24 on page 40).
Figure 2-24 Library Manager (left) and Mode Setup (right) screens
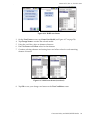
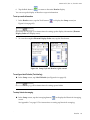
10. Tap OK to display the mode screen (see Figure 2-25 on page 41).
11. Tap the Test button (
12. Tap the Start Test button (
) to display the Test screen.
) to initiate a test.
In the example screen (see Figure 2-25 on page 41), the test result for copper alloy C623 is
PASS.
40
Chapter 2
103202-01EN, Rev. A, December 2012
Figure 2-25 Mode (left) and Test (right) screens — Test result
Alloy, Alloy Plus, and Precious Metals Modes
41
103202-01EN, Rev. A, December 2012
42
Chapter 2
103202-01EN, Rev. A, December 2012
3. Soil, Mining, and Geochem Modes
Soil, Mining, Mining Plus, and Geochem modes are similar except for the number of beams
used in testing. Other differences are noted when applicable.
Mode setup involves setting test conditions such as Test Setup, End Time Type, User Factor
and Packaging Directive. Settings are accessed using the Test Conditions screen.
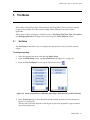
3.1
Test Setup
the Test Setup screen allows you to configure test parameters such as test time and test
repeat.
To configure test setup
1. Select the appropriate mode, and then tap Mode Setup.
2. From the Mode Setup screen, tap Test Conditions (see Figure 3-1 on page 43).
3. From the Test Conditions screen (see Figure 3-1 on page 43), tap the Test/Tools button
(
).
Figure 3-1 Mode Setup (left) and Test Conditions (right) screens — Soil, Mining, Mining
Plus, and Geochem
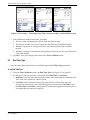
4. In the Test Setup screen, enter minimum and maximum test times for each beam (see
Figure 3-2 on page 44).
The test times you enter depend on the degree of precision required. Typical times for a
soil or mining sample range up to 120 seconds. Longer test times may increase precision.
Soil, Mining, and Geochem Modes
43
103202-01EN, Rev. A, December 2012
Figure 3-2 Test setup screens (Soil, Mining Plus, and Mining)
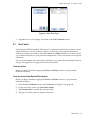
5. Enter additional variables as needed (see Figure 3-3 on page 44), including:
• The number of times you wish to repeat the test.
• Whether to generate an average of all tests in the test set.
• Whether to display a confirmation message before each test in a test series.
Figure 3-3 Test Setup screen (Soil)
6. Tap OK to save your changes and return to the Test Conditions screen.
3.2
End Time Type
You can control how test end time is calculated using the End Time Type parameter.
To set the End Time Type parameter
1. From the Test Conditions screen, tap End Time Type (see Figure 3-4 on page 45).
2. To choose how the test end time is calculated, select RealTime or LiveTime.
• RealTime is the total time that the analysis takes when measured on a standard clock.
This is the most commonly selected option.
44
Chapter 3
103202-01EN, Rev. A, December 2012
•
LiveTime is the actual time during which the analyzer collects data. Since the
analyzer does not always collect data throughout a measurement, LiveTime is less
than RealTime. (LiveTime is used primarily in laboratory applications where precise
and repeatable test times are required).
Figure 3-4 End Time Type parameter
3. Tap Save to save your changes and return to the Test Conditions screen.
3.3
User Factors
Your Olympus DELTA handheld XRF analyzer is optimized at the factory to detect a broad
range of elements. You may be able to improve accuracy for your particular elements of
interest by creating user factors with custom Factor and Offset variables. User factors allow
you to adjust the results for your particular sample matrix. This is also known as site specific
calibration.
You can create multiple user factors and recall them at any time without altering the factory
settings. See Appendix E on page 129 for more information.
To set user factors
Before you begin, determine appropriate Factor and Offset values for your particular
elements of interest.
1.
2.
3.
4.
From the Test Conditions screen, tap User Factor (see Figure 3-5 on page 46).
On the User Factors screen, tap Create New Model.
Tap Change Name to rename the selected model.
Using the scroll box, select an element of interest.
Soil, Mining, and Geochem Modes
45
103202-01EN, Rev. A, December 2012
Figure 3-5 User factors (Soil, Mining, Mining Plus, and Geochem)
5. Enter Factor and Offset values for that element (see Figure 3-6 on page 46).
6. Continue selecting elements and setting factor and offset values for each remaining
element of interest.
7. Tap OK to save your changes and return to the Test Conditions screen.
Figure 3-6 Setting user factors (Soil, Mining, Mining Plus, and Geochem)
3.4
Packaging Directive (Optional Configuration)
Packaging Directive (PD) is a factory option available for order on Olympus DELTA
handheld XRF analyzers. It provides a method for checking samples for compliance with
European Union Packaging Directive regulations. The Packaging Directive requires that
combined quantities of Cd, Cr, Hg, and Pb be less than 100 ppm. The sum of these element
concentrations is calculated as the “PD value”. When configured, the PD value is displayed
on the Results screen.
To set Packaging Directive (if configured)
1. From the Test Conditions screen, tap Packaging Directive (see Figure 3-7 on page 47).
2. Enter Action Level (100 ppm by default) and N Sigma (3 by default) for the elements of
interest.
46
Chapter 3
103202-01EN, Rev. A, December 2012
3. Select Package Directive Elements to include or exclude from the element list (Cd, Cr,
Hg, and Pb selected by default).
4. Tap OK to save your changes and return to the Test Conditions screen.
Figure 3-7 Packaging Directive parameter
Soil, Mining, and Geochem Modes
47
103202-01EN, Rev. A, December 2012
48
Chapter 3
103202-01EN, Rev. A, December 2012
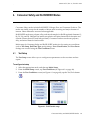
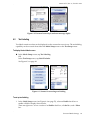
4. Consumer Safety and RoHS/WEEE Modes
Consumer Safety modes include RoHS/WEEE, Halogen Free, and Consumer Products. The
modes are similar except for the number of beams used in testing and major elements of
interest. Other differences are noted when applicable.
RoHS/WEEE mode tests polymer, alloy, and mixed samples for RoHS regulated elements Cr,
Br, Cd, Hg, and Pb. Halogen Free mode tests plastics and mixed materials for bromine and
chlorine content (based on total halogen limit). Consumer Products mode tests polymer,
alloy, and mixed items for lead content.
Mode setup for Consumer Safety and RoHS /WEEE modes involve setting test conditions
such as Test Setup, End Time Type, mode settings, Force Classification, and User Factor.
Settings are accessed using the Test Conditions screen.
4.1
Test Setup
The Test Setup screen allows you to configure test parameters such as test time and test
repeat.
To configure test setup
1. Select the appropriate mode, and then tap Mode Setup.
2. From the Mode Setup screen, tap Test Conditions (see Figure 4-1 on page 49).
3. From the Test Conditions screen (see Figure 4-1 on page 49), tap the Test/Tools button
(
).
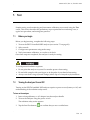
Figure 4-1 RoHS mode setup
Consumer Safety and RoHS/WEEE Modes
49
103202-01EN, Rev. A, December 2012
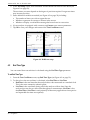
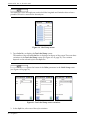
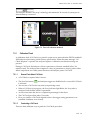
4. In the Test Setup screen, enter minimum and maximum test times for each beam (see
Figure 4-2 on page 50).
The test times you enter depend on the degree of precision required. Longer test times
may increase precision.
5. Enter additional variables as needed (see Figure 4-2 on page 50), including:
• The number of times you wish to repeat the test.
• Whether to generate an average of all tests in the test set.
• Whether to display a confirmation message before each test in a test series.
6. If your analyzer is equipped with a camera, tap Camera to set camera parameters.
7. Tap OK to save your changes and return to the Test Conditions screen.
Figure 4-2 RoHS test setup
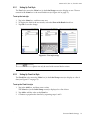
4.2
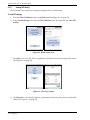
End Time Type
You can control how test end time is calculated using the End Time Type parameter.
To set End Time Type
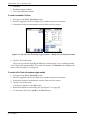
1. From the Test Conditions screen, tap End Time Type (see Figure 4-3 on page 51).
2. To choose how the test end time is calculated, select RealTime or LiveTime.
• RealTime is the total time that the analysis takes when measured on a standard clock
This is the most commonly selected option.
• LiveTime is the actual time during which the analyzer collects data. Since the
analyzer does not always collect data throughout a measurement, LiveTime is less
than RealTime. (LiveTime is used primarily in laboratory applications where precise
and repeatable test times are required).
50
Chapter 4
103202-01EN, Rev. A, December 2012
Figure 4-3 End Time Type
3. Tap Save to save your changes and return to the Test Conditions screen.
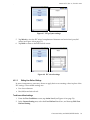
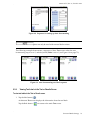
4.3
RoHS Mode Settings
Settings available in RoHS mode include Action Level and Set End Condition and Surface
Pb.
4.3.1
Action Level
To set the action level
1. From the Test Conditions screen, tap RoHS Mode Settings, followed by Action Level
(see Figure 4-4 on page 51).
2. Select the IEC Guideline or User Defined check box, and then enter a User Defined
nSigma value (default is 3.0).
3. Tap Back to return to the Test Conditions screen.
Figure 4-4 Action level settings
Consumer Safety and RoHS/WEEE Modes
51
103202-01EN, Rev. A, December 2012
4.3.1.1
Viewing IEC Setting
IEC Guidelines are commonly accepted screening values for XRF testing.
To view IEC settings
1. From the Test Conditions screen, tap Action Level (see Figure 4-5 on page 52).
2. In the Current Setting area, select the IEC Guideline check box, and then tap View IEC
Setting.
Figure 4-5 RoHS action level
3. Tap Alloy to view the IEC alloy complement of elements and action level pass/fail values
(see Figure 4-6 on page 52).
Figure 4-6 IEC alloy settings
4. Tap Polymer to view the IEC polymer complement of elements and action level pass/fail
values (see Figure 4-7 on page 53).
52
Chapter 4
103202-01EN, Rev. A, December 2012
Figure 4-7 IEC polymer settings
5. Tap Mixed to view the IEC mixed complement of elements and action level pass/fail
values (see Figure 4-8 on page 53).
6. Tap Back to return to the RoHS mode screen.
Figure 4-8 IEC mixed settings
4.3.1.2
Editing User Defined Settings
In some circumstances, users may choose to apply their own screening values in place of the
IEC settings. The available settings are:
•
•
List of test elements
Pass/fail/inconclusive levels
To edit user defined settings
1. From the Test Conditions screen, tap Action Level (see Figure 4-9 on page 54).
2. In the Current Setting area, select the User Defined check box, and then tap Edit User
Defined Setting.
Consumer Safety and RoHS/WEEE Modes
53
103202-01EN, Rev. A, December 2012
Figure 4-9 RoHS user defined settings
3. Select Alloy, Polymer, or Mixed (see Figure 4-10 on page 54).
Figure 4-10 RoHS user defined alloy
4. Tap Add Row or Delete Row to change the list of test elements.
5. To add an element and change pass/fail levels:
a) Tap Add Row to add a new empty row to the list (see Figure 4-11 on page 55).
b) Tap in the empty Element cell, and then select the desired element.
c) Tap the Pass Level cell to enter a pass level value.
d) Tap the Fail Level cell to enter a fail level value.
e) Tap Save to save your changes and return to the action level screen.
54
Chapter 4
103202-01EN, Rev. A, December 2012
Figure 4-11 RoHS user defined settings (adding)
•
•
Setting pass and fail action levels equal to each other, and setting nsigma to 0.1 effectively
eliminates the inconclusive range, giving only a pass/fail result. To use this option, make
sure that the test time is long enough for each element’s LOD to drop below the action
level for typical samples, and long enough to make a clear pass/fail determination.
Additionally, each classification (Polymer/Mixed/Alloy) has its own set of action levels.
For example, changing Polymer settings will not affect Mixed settings.
6. To delete a row from the element list:
a) Select Alloy, Polymer or Mixed (see Figure 4-12 on page 55).
b) Tap and drag to highlight the row you wish to delete.
c) Tap Delete Row to remove it.
Figure 4-12 RoHS user defined settings (deleting)
7. Tap Save to save your changes and return to the action level screen.
8. Tap Back to return to the mode settings screen without saving your changes.
Consumer Safety and RoHS/WEEE Modes
55
103202-01EN, Rev. A, December 2012
4.3.2
Set End Condition
The Set End Condition parameter controls when a test is terminated.
To Set End Condition
1. From the Test Conditions screen, tap Mode Settings, followed by Set End Condition
(see Figure 4-13 on page 56).
2. Choose a type of Test End Condition that meets your testing requirements.
• Maximum time: Test continues for maximum time set. This option is most commonly
selected.
• Action Level: Test continues until pass or fail determination based on action level is
made.
• Classification: Test continues until sample is classified as Polymer, PVC, Mixed, or
Alloy. This option is commonly used for quickly sorting PVC (Cl >> 1 %) and nonPVC plastics.
3. Tap Back to save your changes and return to the mode settings screen.
Figure 4-13 RoHS set end condition settings
4.3.3
Surface Pb
Surface Pb parameters aid in testing for lead (Pb) that may be present in a surface coating.
To set Surface Pb parameters
1. From the Test Conditions screen, tap Mode Settings, followed by Surface Pb (see
Figure 4-14 on page 57).
2. Choose the appropriate Surface/Bulk Classification:
• Bulk: Will display detected Pb only in ppm. Select this option when testing most
uncoated samples. The analyzer will assume that all detected Pb is distributed
homogeneously in a bulk material. This is the default option.
• Surface: Will display detected Pb only in ug/cm2. Select this option when only testing
samples with some surface coating, e.g. a paint layer. The analyzer will assume that
all detected Pb is present in a thin coating layer on the surface.
56
Chapter 4
103202-01EN, Rev. A, December 2012
•
Auto: Will display Pb results in both ppm and ug/cm2. The software will also choose
whether any Pb detected is likely from a surface layer (if present) or the substrate. The
appropriate Pb result will be colored blue.
The Auto option is only for reference and does not affect the analysis. Pb results in ppm are
only valid for bulk samples. Results in ug/cm2 are only valid for coated samples when the Pb
content is present only in the coating layer. Auto reports both values for convenience, but
they are based on different calibrations and different assumptions, and are mutually
exclusive.
3. Cutoff Ration and N Sigma parameters are instrument settings and should not be
changed.
4. In the Pass/fail Determination area, enter Action Level Pass and N Sigma values based
on surface Pb screening value.
The Surface Pb pass/fail is separate from the RoHS pass/fail criteria and is not considered in
determining the overall pass/fail judgement for the sample.
5. Tap Back to save your changes and return to the mode settings screen.
Figure 4-14 Surface Pb
4.4
Force Classification
Force classification parameters aid in the identification of certain materials.
To set force classification
1. From the Test Conditions screen, select Force Classification (see Figure 4-15 on page 58).
2. Choose the appropriate classification method:
• Automatic: Allow analyzer to choose which beam and calibration matches the
current sample.
Consumer Safety and RoHS/WEEE Modes
57
103202-01EN, Rev. A, December 2012
•
•
Alloy: Always test sample using the alloy/metals calibration (beam 2). This option is
useful when testing aluminum alloys, as these will not be automatically classified as
alloy.
Polymer: Always test sample using the polymer calibration (beam 1). Beam 1 is also
used when testing mixed samples.
Figure 4-15 Force classification
4.5
User Factor (RoHS/WEEE Specific)
Your Olympus DELTA analyzer is optimized at the factory to detect a broad range of
elements. You may be able to improve detection accuracy for your particular elements of
interest by creating user factors with custom Factor and Offset variables.
You can create multiple user factors and recall them at any time without altering the factory
settings.
Before you begin, determine appropriate factor and offset values for your particular elements
of interest.
To set the user factor
1. On the Test Conditions screen, tap User Factor (see Figure 4-16 on page 59).
2. Choose the appropriate beam:
• Polymer High-B1 for Polymer/Mixed testing using beam 1.
• Alloy High-B2 for Alloy testing using beam 2.
58
Chapter 4
103202-01EN, Rev. A, December 2012
Figure 4-16 RoHS user factors
3.
4.
5.
6.
7.
On the User Factors screen, tap Create New Model (see Figure 4-17 on page 59).
Tap Change Name to rename the selected model.
Using the scroll box, select an element of interest.
Enter the Factor and Offset values for that element.
Continue selecting elements and setting factor and offset values for each remaining
element of interest.
Figure 4-17 RoHS user factors (continued)
8. Tap OK to save your changes and return to the Test Conditions screen.
Consumer Safety and RoHS/WEEE Modes
59
103202-01EN, Rev. A, December 2012
60
Chapter 4
103202-01EN, Rev. A, December 2012
5. Thin Modes
Thin modes include Dust Wipe, Filter Analysis, and Lead Paint. These modes are similar
except for the number of beams used in testing. Other differences are noted where
applicable.
Mode setup involves setting test conditions such as Test Setup, End Time Type, User Factor
and Packaging Directive. Settings are accessed using the Test Conditions screen.
5.1
Test Setup
The Test Setup screen allows you to configure test parameters such as test time and test
repeat.
To configure test setup
1. Select the appropriate mode, and then tap Mode Setup.
2. From the Mode Setup screen, tap Test Conditions (see Figure 5-1 on page 61).
3. From the Test Conditions screen, tap the Test/Tools button (
).
Figure 5-1 Mode setup and test conditions (Dust Wipe, Filter Analysis, and Lead Paint)
4. In the Test Setup screen, enter minimum and maximum test times for each beam (see
Figure 5-2 on page 62).
The test times you enter depend on the degree of precision required. Longer test times
may increase precision.
Thin Modes
61
103202-01EN, Rev. A, December 2012
Figure 5-2 Test setup — Dust Wipe (left), Filter Analysis (middle), and Lead Paint (right)
5. Enter additional variables as needed, including:
• The size of the area being tested (Dust Wipe and Filter modes).
• The number of times you wish to repeat the test (Filter and Lead Paint modes).
• Whether to generate an average of all tests in the test set (Dust Wipe and Filter
modes).
• Whether to display a confirmation message before each test in a test series (Filter and
Lead Paint modes).
6. Tap OK to save your changes and return to the Test Conditions screen.
5.2
End Time Type
You can control how test end time is calculated using the End Time Type parameter.
To set End Time Type
1. From the Test Conditions screen, tap End Time Type (see Figure 5-3 on page 63).
2. To choose how the test end time is calculated, select RealTime or LiveTime.
• RealTime is the total time that the analysis takes when measured on a standard clock
This is the most commonly selected option.
• LiveTime is the actual time during which the analyzer collects data. Since the
analyzer does not always collect data throughout a measurement, LiveTime is less
than RealTime. (LiveTime is used primarily in laboratory applications where precise
and repeatable test times are required).
62
Chapter 5
103202-01EN, Rev. A, December 2012
Figure 5-3 End Time Type
3. Tap Save to save your changes and return to the Test Conditions screen.
5.3
User Factors
Your Olympus DELTA handheld XRF analyzer is optimized at the factory to detect a broad
range of elements. You may be able to improve accuracy for your particular elements of
interest by creating user factors with custom Factor and Offset variables. User factors allow
you to adjust the results for your particular sample matrix. This is also known as site specific
calibration.
You can create multiple user factors and recall them at any time without altering the factory
settings. See Appendix E on page 129 for more information.
To set user factors
Before you begin, determine appropriate Factor and Offset values for your particular
elements of interest.
To set user factors (Dust Wipe and Filter Analysis)
Before you begin, determine appropriate Factor and Offset values for your particular
elements of interest.
1.
2.
3.
4.
From the Test Conditions screen, tap User Factor (see Figure 5-4 on page 64).
On the user factor screen, tap Create New Model.
Tap Change Name to rename the selected model.
Using the scroll box, select an element of interest.
Thin Modes
63
103202-01EN, Rev. A, December 2012
Figure 5-4 User factors (Dust Wipe and Filter Analysis)
5. Enter Factor and Offset values for that element (see Figure 5-5 on page 64).
6. Continue selecting elements and setting factor and offset values for each remaining
element of interest.
7. Tap OK to save your changes and return to the Test Conditions screen.
Figure 5-5 Setting user factors (Dust Wipe and Filter Analysis)
5.4
Lead Paint (Test End Condition)
Test end conditions particular to Lead Paint mode are accessed from the Test Conditions
screen.
To set Lead Paint (Lead Paint mode only)
1. From the Test Conditions screen, tap Lead Paint (see Figure 5-6 on page 65).
2. Select a test end condition from the following options:
• Select Inspection to end the test when the inspection parameter is met.
• Select Fixed Time to end the test when a previously set time is reached.
• Select Force 2nd Beam to always use both beams when testing.
64
Chapter 5
103202-01EN, Rev. A, December 2012
3. Enter additional options as needed, including:
• Action level (1.0 mg/cm2 by default).
• Whether to display the statistical error (+/-) on the Results screen.
4. Tap Save to save your changes and return to the Test Conditions screen.
Figure 5-6 Lead Paint test end condition
Thin Modes
65
103202-01EN, Rev. A, December 2012
66
Chapter 5
103202-01EN, Rev. A, December 2012
6. Universal Mode Settings
Universal mode settings are available in all modes and are identical from mode to mode with
some exceptions, which are noted.
The Universal mode settings are:
•
•
•
•
Reset Test Cond’s (reset test conditions)
Test Labeling
Customize Display
Element Suite.
The primary access point for these mode settings is through the Mode Setup screen (see
Figure 6-1 on page 67). The Test Conditions button is not covered in this section because it
has settings tailored to the selected mode. The test condition settings for each mode are
discussed in the corresponding section. The Library Manager button is not covered because
it is for the Alloy modes only, and is covered in that section.
Figure 6-1 Mode Setup screen
6.1
Reset Test Conditions
The Reset Test Conditions function returns test times and other parameters to their default
settings (see Table 4 on page 68 and Table 5 on page 68).
Universal Mode Settings
67
103202-01EN, Rev. A, December 2012
Table 4 Default test times
Min. time
Modes
All Beams
Default max. time
Beam 1
Beam 2
Beam 3
Alloy
0
5
30
N/A
Alloy Plus
0
5
30
N/A
Fast ID
0
5
n/a
N/A
Geochem
0
30
30
N/A
Halogen Free
0
30
90
N/A
Mining
0
30
N/A
N/A
Mining Plus
0
30
30
N/A
RoHS
0
30
120
N/A
Soil
0
30
30
30
Pb Paint
0
30
20
N/A
Filter
0
30
N/A
N/A
Dust Wipe
0
30
N/A
N/A
Table 5 Other default parameters
MODE
Parameter
Alloy
Quicksort
Alloy
Al Mode = On
Alloy Plus
Two Beams Always Al, Si, Mg, S, P
RoHS
End of Test = Max. Time
RoHS
Classification = Auto
RoHS
Action Level = IEC Guideline
SmartBeam
Quicksort
To reset the test conditions
1. Tap RESET Test Cond’s (see Figure 6-1 on page 67) to display the password screen (see
Figure 6-2 on page 69).
2. In the User and Password boxes, enter the logon information using the Input Panel.
3. Tap OK.
4. When you receive the following message, tap Yes (see Figure 6-2 on page 69).
“Are you sure you want to reset the test conditions for all modes.”
68
Chapter 6
103202-01EN, Rev. A, December 2012
Figure 6-2 Password screen (left) and reset message (right)
6.2
Test Labeling
Test labels contain text that can be displayed on the screen after a test is run. The test labeling
capability can be accessed from either the Mode Setup screen or the Test Setup screen.
To display the test labels screen
In the Mode Setup screen, tap Test Labeling.
OR
In the Test Setup screen, tap Label Defaults.
See Figure 6-3 on page 69.
Figure 6-3 Screens for accessing test labeling
To set up test labeling
1. In the Label Setup screen (see Figure 6-4 on page 70), select an Enable check box to
enable a field for display in test results.
There are eight rows. A row consists of an Enable check box, a Label box, and a Value
box.
Universal Mode Settings
69
103202-01EN, Rev. A, December 2012
Test label rows seven and eight are used to hold the longitude and latitude values when a
portable GPS unit is connected to the analyzer.
Figure 6-4 Label Setup screen
2. Tap a Label box to display the Test Label Setup screen.
The number of the selected Label box is displayed at the top of the screen. There are three
variations of the Test Label Setup screen (see Figure 6-5 on page 70). The variation
depends on the selected style in the Style list.
The selected style determines the format of the Value parameter in the Label Setup screen
(see Figure 6-4 on page 70).
Figure 6-5 Test Label Setup screen variations
3. In the Style list, select one of the style variations.
70
Chapter 6
103202-01EN, Rev. A, December 2012
6.2.1
Setting Up Text Style
The Text Style causes the Value box (in the Label Setup screen) to display as text. The text
entered in the Name box is the actual label text (see Figure 6-6 on page 71).
To set up the text style
1. Tap in the Name box, and then enter text.
2. To display the field in the test results, select the Show with Result check box.
3. Tap OK to save the change.
Figure 6-6 Text style setup
The Show with Result option can only be used with one test label at a time.
6.2.2
Setting Up Fixed List Style
The Fixed List style causes the Value box (in the Label Setup screen) to display as a list of
data (see Figure 6-7 on page 72).
To set up the Fixed List style
1. Tap in the Add box, and then enter a value.
The Value box (in the Label Setup screen) is displayed as a list of data.
2. Tap Add to add the value to the Data list.
3. Continue to populate the data list by repeating steps 1 and 2.
Universal Mode Settings
71
103202-01EN, Rev. A, December 2012
Figure 6-7 Test Label Setup screen — Populating the Fixed List
4.
5.
6.
7.
To delete a data value, select the value, and then tap Delete.
Enter the Label text in the Name field.
To display the field in the test results, select the Show with Result check box.
Tap OK.
The Show with Result option can only be used with one test label at a time.
6.2.3
Setting Up the Auto Incrementing Style
The Auto Incrementing style causes the Value box (in the Label Setup screen) to increment
by the number entered in the Step box. For example, if the value entered in the Step box is 1,
then the value (entered in the Value box) in the Label Setup screen increments by one after
each test. So the tests will be numbered: 1, 2, 3, 4, etc. If the value in the Step box is 4, then the
tests will be numbered 1, 5, 9, 13, etc.
To set up Auto Incrementing
1.
2.
3.
4.
5.
72
In the Step box, enter a number to set the incremental value (see Figure 6-8 on page 73).
To display the box in the test results, select the Show with Result check box.
Tap OK.
In the Value box, enter a number to set the first test number.
Tap OK.
Chapter 6
103202-01EN, Rev. A, December 2012
Figure 6-8 Sequence for setting up Auto Incrementing
The Show with Result option can only be used with one test label at a time.
The following example demonstrates a sequence of three Test screens when the auto
incrementing step is set to 3, and the (initial) Value is set to 1 (see Figure 6-9 on page 73).
Figure 6-9 Auto Incrementing test label sequence
6.2.4
Viewing Test Labels in the Test or Results Screen
To view test labels in the Test or Result screen
1. Tap the Info button (
).
An alternate Test screen displays the information from the test labels.
Tap the Back button (
) to return to the main Test screen.
Universal Mode Settings
73
103202-01EN, Rev. A, December 2012
6.2.5
Test label editing options
Test labels can be edited before or after a test is run.
To edit test labels before a test is run
In the Admin Prefs screen, select one of the Pre-Test Edit Options (see Figure 6-10 on
page 74) [see section 1.5 on page 13 for more information].
• Force forces you to edit the test label before the test is run.
• Optional gives you the option of tapping the Info button in the Test screen to edit the
label before running the test.
Figure 6-10 Pre-test label editing sequence
To edit test labels after tests are run
1. In the Admin Prefs screen, select the Test Label Edit (Post Test) check box (see section 1.5
on page 13 for more information).
This selection causes an Edit button to appear on the Results screen, giving you the
option of editing the test results.
2. In the Results screen, select a test.
3. Tap Edit, then edit the results in the Edit Test Info screen.
4. Tap OK.
The sequence of screens in Figure 6-11 on page 75 shows the above procedure.
74
Chapter 6
103202-01EN, Rev. A, December 2012
Figure 6-11 Post test label editing sequence
6.3
Customize Display Function
The Customize Display function sets the display parameters and screen behavior for the
selected mode. There are two entry points to display the Custom Disp screen.
To access the Customize Display function
In the Mode Setup screen, tap Customize Display (see Figure 6-12 on page 75 [left]).
OR
In the Test Setup screen, tap Customize Display (see Figure 6-12 on page 75 [right]).
Figure 6-12 Screens for accessing Customize Disp screens
6.3.1
Selecting the Check Box, LOD NSigma, and Compound Options
There are three variations of the Customize Disp screen (see Figure 6-13 on page 76):
Universal Mode Settings
75
103202-01EN, Rev. A, December 2012
Mining Plus & Mining
Soil & RoHS/WEEE
Alloy & Alloy Plus
Figure 6-13 Custom Disp screens
Common Custom Disp screen elements
1. Select the Detected + LOD Value check box to see a detected value and the limit of
detection value for non detected elements.
2. Tap the LOD NSigma box, and then enter a value to set the detection parameter.
The NSigma value gives the “statistical confidence” for detection. An NSigma value of 3.0
is typical for most applications. Ensure that an NSigma value of 3.0 is acceptable for your
testing requirements.
An NSigma value of 0 will show all elements as detected and will report the calculated
result and uncertainty (+/-) for all elements. No elements will be shown as “<LOD.” This
option is normally used only in advanced applications, and is not available in Alloy or
Lead Paint modes.
3. Select the Enable Screen Rotation check box to make the screen rotate when the analyzer
is inverted.
Additional check box for Soil and RoHS modes
Select Quantify Vals > 10% to display the element values that are greater that 10 %. In
practice this is generally not useful because these modes are calibrated for trace elements.
Additional check boxes for Alloy modes
1. Select Show Alloy Grade Comparison to have Test or Result screens indicate alloy
grades matched and match numbers.
2. Select Show Nominal Chemistry to have Test or Result screens list the elements inferred
as included in a test based on the grade match.
Compound button for Mining modes
1. Tap Compound to display the compound screen (see Figure 6-14 on page 77).
2. Select the Enable Compound Display check box to display the compounds in the Test
screen and exported results
3. Select the Suppress sum > 100% msg (Reset on restart) check box to prevent the
“Caution: Sum > 100%” message from being displayed in the Test and Results screens.
76
Chapter 6
103202-01EN, Rev. A, December 2012
Figure 6-14 Custom Disp (left) and compound (right) screens
4. Tap the Plus ( ) button located beside the Default list to display the Add Compound
Template screen (see Figure 6-15 on page 77).
5. Enter a template name in the text box, and then tap Save.
6. In the compound screen, tap the down arrow, and then select the new template.
7. Select an Element/Compound Name.
8. Tap the Plus button under the Option box to display the Add Compound screen.
9. Add a compound of the same type selected in the previous screen.
Representative acceptable compound names (forms) are Fe3O2 or Fe2(OH)2. The factor
of the compound calculation (using Fe2(OH)2 as an example) is based on:
Total
atomic weight for Fe2(OH)2---------------------------------------------------------------------------------Total atomic weight for Fe2
Figure 6-15 Sequence for adding a compound
In Figure 6-16 on page 78, the newly added compound shows up in the
Element/Compound Name list, and is listed in the Test screen after running a test.
Universal Mode Settings
77
103202-01EN, Rev. A, December 2012
Figure 6-16 Compound screen with new compound and Test screen analysis
6.3.2
Element Display Order Options
Select one of the three Element Display Order options (see Figure 6-13 on page 76).
To order the display according to the atomic number
Select Z-num.
To order the display according to the concentration in the test sample
Select Concen.
To define a new display order
1. Select User Def.
2. Select an element, and then tap the left or right arrows (
/
) to move the element
between the Hidden and Shown lists.
3. To change the order of an element in the Shown list, tap the up or down arrows
(
/
).
4. To move all the elements back to the Shown list in their original order, tap Reset.
5. Tap OK.
6.4
Element Suite Screen
The Element Suite screen displays a listing of all the analysis elements that are provided by
the chosen mode and its associated beam(s) [see Figure 6-17 on page 79].
To display the Element Suite screen
In the Mode Setup screen, tap Element Suite.
78
Chapter 6
103202-01EN, Rev. A, December 2012
Figure 6-17 Element Suite screen
Universal Mode Settings
79
103202-01EN, Rev. A, December 2012
80
Chapter 6
103202-01EN, Rev. A, December 2012
7. Test
Sample testing, result monitoring and instrument calibration are accessed using the Test
screen. This section describes the preliminary steps required before conducting a test, a
typical test procedure, and testing best practices.
7.1
Before you begin
Before you begin testing, complete the following steps:
1.
2.
3.
4.
Turn on the DELTA handheld XRF analyzer (see section 7.2 on page 81).
Select a mode.
Configure test parameters using mode setup.
Verify instrument calibration, or conduct a cal check.
Once these steps are completed, the analyzer is ready for testing.
To avoid potential radiation exposure:
•
•
•
7.2
Do not point the analyzer at yourself or another person when testing.
Do not hold a sample with your fingers or in the palm of your hand when testing.
Always wear both a ring-style and a badge (either clip-on or lanyard-style) dosimeter.
Turning the Analyzer On and Off
Turning on the DELTA handheld XRF analyzer requires a power source (battery or AC) and
understanding of the radiation safety notice.
To turn on the analyzer
1. Insert a charged battery or AC adaptor into the analyzer handle.
2. Turn on the analyzer using the power switch.
The radiation safety notice appears.
3. Tap the Start Test button (
) to confirm that you are a certified user.
Test
81
103202-01EN, Rev. A, December 2012
Figure 7-1 Radiation safety notice
System initialization begins. The analyzer launches a Test screen for the last selected
mode (seeFigure 7-2 on page 82).
Figure 7-2 System initialization (left) and Test (right) screens
To turn off the analyzer
•
•
•
82
There are several equally effective ways to turn off the analyzer.
Hardware method:
Press and hold the analyzer power switch until the green ON/OFF light is off.
Software method:
a) From the Home screen, tap Setup.
b) Tap Exit.
c) On the exit screen, tap the Power Off button (
).
d) Tap Yes to confirm that you want to shut down the analyzer (see Figure 7-3 on
page 83).
Emergency method:
Open the analyzer battery cover, and then remove the battery or AC adaptor.
Chapter 7
103202-01EN, Rev. A, December 2012
The analyzer includes “hot swap” technology that maintains 30 seconds of system power
after the battery is removed.
Figure 7-3 Turn off (software method)
7.2.1
Calibration Check
A calibration check (Cal Check) is a periodic system test to ensure that the DELTA handheld
XRF analyzer is functioning within factory specifications. When the status message “Cal
Check Required” is present, the analyzer requires a calibration check before testing can
proceed.
During a Cal Check, the analyzer collects a spectrum on a known standard (Alloy 316
stainless steel). The analyzer then compares a variety of parameters to factory preset values.
When comparisons are within preset tolerances, the analyzer passes Cal Check.
7.2.1.1
General Facts About Cal Check
•
A Cal Check is required after 10 hours.
•
The Start Test button (
) and analyzer trigger are disabled until a successful Cal Check
is achieved.
You can run a Cal Check at any time (except during a test).
When a Cal Check is in progress, the X-ray indicator light blinks, the X-ray tube is
energized, and the filter wheel is operational.
An on-screen status bar shows a completion percentage for the check.
The Cal Check procedure takes 15 seconds.
How you conduct a Cal Check depends on how the trigger setting parameter is set
(standard, deadman, or two-hand).
•
•
•
•
•
7.2.1.2
Conducting a Cal Check
There are three different ways to perform a Cal Check procedure:
Test
83
103202-01EN, Rev. A, December 2012
•
•
•
Standard
Deadman trigger enabled
Two-hand operation enabled
To conduct a standard Cal Check
1. Navigate to the Test or Test Setup screen.
2. Place the supplied Cal Check coupon (316 stainless steel) on a flat surface.
3. Position the analyzer measurement window flush over the coupon.
Figure 7-4 Test (left) and Test Setup (right) screens — Ready for Cal Check procedure
4. Tap the Cal Check button.
The red X-ray indicator light begins blinking to indicate that X-rays are being emitted.
A Cal Check takes approximately 15 seconds to complete. The Results screen displays the
status of the test Figure 7-8 on page 86.
To conduct a Cal Check with deadman trigger enabled
1.
2.
3.
4.
Navigate to the Test or Test Setup screen.
Place the supplied Cal Check coupon (316 stainless steel) on a flat surface.
Position the analyzer measurement window flush over the coupon.
Tap the Cal Check button.
A dialog box appears on the Test screen
5. Read the instructions in the dialog box (see Figure 7-5 on page 85).
6. To cancel the Cal Check, tap OK or the Close button.
84
Chapter 7
103202-01EN, Rev. A, December 2012
Figure 7-5 Dialog box with instructions for deadman trigger Cal Check operation
7. Pull and hold the trigger for the duration of the test.
The red X-ray indicator light begins blinking to indicate that X-rays are being emitted.
A Cal Check takes less than 15 seconds to complete. The Results screen displays the status of
the test Figure 7-8 on page 86.
To conduct a Cal CHeck with two-hand operation enabled
1.
2.
3.
4.
Navigate to the Test or Test Setup screen.
Place the supplied Cal Check coupon (316 stainless steel) on a flat surface.
Position the analyzer measurement window flush over the coupon.
Tap the Cal Check button.
A dialog box appears on the Test screen
5. Read the instructions in the dialog box (see Figure 7-6 on page 85).
6. To cancel the Cal Check, tap OK or the Close button.
Figure 7-6 Dialog box with instructions for two-hand operation Cal Check procedure
7. Press and hold both the center push button and the trigger for the duration of the test (see
Figure 7-7 on page 86).
The red X-ray indicator light begins blinking indicating that X-rays are being emitted.
Test
85
103202-01EN, Rev. A, December 2012
Figure 7-7 DELTA special function push buttons
A Cal Check takes less than 15 seconds to complete. The Results screen displays the status of
the test (seeFigure 7-8 on page 86).
.
Figure 7-8 Results screen — Successful Cal Check
The message “Cal Check — Passed” indicates that the analyzer is ready for sample testing.
7.2.1.3
Troubleshooting a Cal Check
If the Cal Check fails:
•
•
•
•
Ensure that the coupon is positioned correctly beneath the measurement window.
Ensure that the X-ray indicator blinks during the procedure.
Restart the analyzer
Retry the Cal Check procedure.
If the Cal Check fails repeatedly, contact Olympus customer service or your local distributor.
7.2.2
Conducting a sample test
Prior to beginning a testing session, review the testing best practices information (see
section 7.3 on page 88).
86
Chapter 7
103202-01EN, Rev. A, December 2012
To avoid potential radiation exposure:
•
•
•
Do not point the analyzer at yourself or another person when testing.
Do not hold a sample with your fingers or in the palm of your hand when testing.
Always wear both a ring-style and a badge (either clip-on or lanyard-style) dosimeter.
To conduct a test
1. Navigate to the Test screen.
Figure 7-9 Test (left) and test in-progress (right) screens
2. Position the analyzer measurement window of the over the test sample.
3. Tap the Start Test button (
•
•
), or pull the trigger to begin testing:
The lower status bar shows the progress of the test.
Results are displayed immediately upon test completion.
4. Tap the Spectrum button (
5. Tap the Chemistry button (
) to view spectrum results.
) to view chemistry results (see Figure 7-10 on page 88).
Test
87
103202-01EN, Rev. A, December 2012
Figure 7-10 Results (chemistry and spectra)
6. At the end of the session, it is a good practice to export the session’s results to a PC using
the data port and USB cable.
See section 8.2 on page 94 for details about the exporting procedure.
7.3
Testing Best Practices
Testing best practices are guidelines for improving test accuracy when testing in various
modes.
7.3.1
Alloy Mode
Prior to a test session, you should have an understanding of Olympus‘s implementation of:
•
•
Grade libraries (see Appendix H on page 141).
Match issues including the concept and use of match numbers (see section 2.8.1 on
page 28).
TESTING TIPS FOR ALLOY MODE
•
•
7.3.2
Place the analyzer’s window on/over the test specimen, cover the window completely.
Take care not to damage the window film, such as when testing “metal turnings” or hot
surfaces.
Mining and Soil Modes
Check Standards
•
88
Measure a check standard after each Cal Check, and periodically throughout the day. Test
for a recommended minimum of one minute.
Chapter 7
103202-01EN, Rev. A, December 2012
•
Use the standards provided with the analyzer. Standards are contained in XRF sample
cups. These containers have a window (through which the soil can be viewed) on one
side, and a solid cap on the other side.
Always measure samples through the sample cup’s window.
Sample Presentation
In situ testing
In situ testing is performed by pointing the analyzer at the ground. Clear any grass or large
rocks away and hold the analyzer with the probe head front flush to the ground. Since dirt
can accumulate on the analyzer window, gently wipe the window clean after each analysis.
Ensure the window is not ripped or punctured.
Bagged or prepared sample testing
Analyze prepared samples in a sample cup, through its window. Place the analyzer’s
measurement window directly over the sample cup with the film side up. Preparation
considerations include:
•
•
•
Avoid measuring very thin samples, as this can affect results. Prepare samples cups to
contain at least 15 mm (usually 4 to 8 grams) of packed samples.
When analyzing bagged samples, make sure that there is sufficient sample material in the
bag to create a sample thickness of a minimum of 15 mm and that the sample area covers
the analyzer’s measurement window.
When using bags, cheaper bags (having thinner plastic walls) are better than more
expensive ones (which have thicker plastic walls).
TESTING TIPS FOR MINING AND SOIL MODES
•
•
•
•
7.3.3
Place the analyzer’s measurement window directly over the sample cup with the film
side up.
Specify the altitude or atmospheric pressure to gain increased accuracy for light
elements.
Confirm that the testing time and other parameters are properly selected.
Take care not to damage the window film, such as when testing uneven surfaces.
Consumer Mode (RoHS)
Check Standards
Measure a check standard after each Cal Check, and periodically throughout the day. Two
certified standards are provided for verification.
•
•
•
At least one standard should be measured for a minimum of two minutes.
Standards provided are contained in XRF sample cups with a window (through which
the plastic pellets can be viewed) on one side, and a solid cap on the other side.
Samples should be measured in the sample cup, through the window.
Test
89
103202-01EN, Rev. A, December 2012
Sample Presentation
Since many samples analyzed for RoHS compliance are very small, such as surface mount
components, take care to measure them in a safe and accurate manner.
Refer to the IEC 62321 recommendation for minimum thickness of test samples.
Tips For Consumer Mode (RoHS)
In order for XRF testing to be quantitative:
•
•
Use homogeneous samples.
Make sure samples are of a minimum thickness:
— 5 mm for polymers and light alloys.
— 15 mm for liquid samples.
— 1 mm for other alloys.
If samples are heterogeneous, too thin, or too small, only qualitative screening is possible.
90
Chapter 7
103202-01EN, Rev. A, December 2012
8. Results
Each test result is individually stored as a record in the DELTA handheld XRF analyzer. A
single result or set of results can be easily found, formatted, and displayed in the Results
screen. Results can also be exported or averaged (see Appendix C on page 115 for more
information).
8.1
Using the Results Screen
The Results screen allows you to view current test results, navigate to stored results, and
export results (see Figure 8-1 on page 91).
Figure 8-1 Results screen
The calendar allows you to quickly navigate by date through test sets.
To use the calendar
1. In the Home screen or Test screen, tap the Results button (
).
2. In the Results screen, tap the Calendar button (
) to display the Results Summary
screen (see Figure 8-2 on page 92).
3. Double-tap a year to display the months.
4. Double-tap a month to display the days.
5. Tap a day, and then tap Go To Result to display the selected result.
Results
91
103202-01EN, Rev. A, December 2012
Figure 8-2 Results Summary screens — Using the calendar
The scroll bar and arrows allow you to scroll through test sets or individual tests.
To use the scroll bar and arrows
1. Tap the horizontal scroll bar.
It immediately enlarges (see Figure 8-3 on page 92).
2. Tap in any other area of the screen, and the scroll bar shrinks to its original size.
3. Use the scroll bar to scroll through the test records in a particular set.
4. Use the single arrows to navigate record-by-record through all the stored records.
5. Use the double arrows to navigate through sets of records.
Figure 8-3 Horizontal scroll bar
To set the display options
1. To expand the display. tap the Plus button (
).
2. To return the display to normal, tap the Minus button (
3. For the spectral display, tap the Spectral Plot button (
).
).
4. To display the elemental chemistry, tap the Chemistry button (
5. To display messages, tap the Info button (
92
Chapter 8
).
).
103202-01EN, Rev. A, December 2012
6. Tap the Back button (
) to return to the main Results display.
You can set up the display of Results or export information.
To set up results information
1. In the Results screen, tap the Tools button (
) to display the Setup screen (see
Figure 8-4 on page 93).
See section 6.3 on page 75 for instructions for setting up the display information (Element
Display Order and display areas).
2. To view the complete Element Display Order area, tap the Plus button.
Figure 8-4 Setup (left) and Results (right) screens
To configure Label Defaults (Test labeling)
In the Setup screen, tap Label Defaults (see Figure 8-4 on page 93).
See section 6.2 on page 69 for instructions for setting up test labels.
To setup historical averaging
In the Setup screen, tap the Averaging button (
) to display the Historical Averaging
screen.
See Appendix C on page 115 for instructions on setting up historical averaging.
Results
93
103202-01EN, Rev. A, December 2012
To print the results information
In the Setup screen, tap the Printer button (
) to print to a Bluetooth® enabled printer.
The DELTA analyzer must be paired with a Bluetooth enabled printer (see section 1.8 on
page 15).
8.2
Exporting Results Information
Results records are grouped by date. An individual result recorded on a particular day
cannot be exported to a file or deleted. Only results for an entire day, multiple days, or for a
selected mode can be exported or deleted.
To export results
1. In the Setup screen, tap Export.
2. In the Export screen, select Results or Spectra as the default result display (see Figure 8-5
on page 95).
3. In the Filter list, select a mode.
The results list displays only records (grouped by date) which were created in the
selected mode.
4. To further select records by date for export, tap on that date.
All the records for that date are exported. You can also use the Select All or Select None
button.
5. Select the Include Image check box to include any associated images.
6. Select Autoname or Prompt to determine how the exported file is named.
If you select Prompt, you will be prompted for a file name at the time the file is exported.
7. Select the Use SN in file name check box to include the analyzer serial number in the file
name.
8. Select the Auto Export check box to automatically export each result recorded.
9. Tap the Export button (
94
Chapter 8
) to export the results (see Figure 8-5 on page 95).
103202-01EN, Rev. A, December 2012
Figure 8-5 Export screen
To delete a record set
1. In the Export screen, select a mode (or All).
2. In the results list, select one or more record sets (listed by date).
You can also use the Select All button to select all record sets for the selected mode.
3. Select the Delete check box (see Figure 8-6 on page 95).
The Export button (
) becomes the Delete button.
4. Tap Delete, and then tap Yes in the confirmation dialog box (see Figure 8-6 on page 95).
Figure 8-6 Delete screen
8.2.1
Export options
To select parameters for export
1. In the Export screen, tap the Tools button (
(see Figure 8-7 on page 96).
2. In the template list, select a template name.
) to display the Export Options screen
Results
95
103202-01EN, Rev. A, December 2012
Template list
Figure 8-7 Export Options screen
3. Select parameters in the NOT Exported list, then tap the Right arrow (
to the Exported list.
) to move them
Alternatively, move parameters to the NOT Exported list using the Left arrow (
).
Table 6 on page 96 lists the parameters that can be exported.
4. To move one or more items up or down in the Exported list, select the item(s) and then
tap the up or down arrow (
/
) located below the list.
5. In the Autoname area, select Use Date or Auto Inc (increment).
6. In the Separators area, select whether you want the exported data to be Tab, Comma, or
Semicolon delimited; and whether you want a decimal to be represented by a Dot or a
Comma.
7. Select the Unicode check box to encode the exported text as Unicode.
8. Specify the export directory:
a) Tap the Folder button to display the Specify Export Directory screen.
b) Enter the export directory, and then tap Save.
Table 6 Default list of exportable parameters
96
Chapter 8
2nd Match
Field 5
2nd Match Num
Field 6
3rd Match
Field 7
3rd Match Num
Field 8
Ambient Pressure
Hal Free Sum
Au Coating
Instrument Info
Au Karat
Live Time
Best Match
LOD Sigma
Best Match Num
Method name
Cal Check info
Mode
Chemistry
Pass/Fail
Collimated
Packaging Dir
Date
Pb Paint Result
103202-01EN, Rev. A, December 2012
Table 6 Default list of exportable parameters (continued)
Elapsed Time
Reading
Field 1
RoHS Sur Pb
Field 2
Time
Field 3
Unit
Field 4
User Factor Name
To add a new template
1. In the Export Options screen, tap the Plus button (
) at the top of the screen to display
the Add Export Template screen (see Figure 8-8 on page 97).
2. Enter a template name in the box, and then tap Save to return to the Export Options
screen.
The new template name is displayed in the Export Options screen.
Figure 8-8 Export Options (left) and Add Export Template (right) screens
To delete a template
1. In the Export Options screen, select a template, then tap the Minus button (
2. In the dialog box, tap OK.
).
To define a new parameter for export
1. Tap the Plus button below the Exported list.
2. In the Add User Column screen (see Figure 8-9 on page 98), enter a name in the Column
Name box.
3. Tap Save to dismiss the Add User Column screen and see the parameter in the Exported
list. The default list of parameters that can be exported is shown in Table 6 on page 96.
Results
97
103202-01EN, Rev. A, December 2012
Figure 8-9 Export Options (left) and Add User Column (right) screens
To select chemical data for export
1. In the Export Options screen, tap the Chemistry button (
) to display the export
chemical options screen (see Figure 8-10 on page 99).
2. To list every possible element to export, select Show more.
3. Select elements and move them from the list under Show more to the Export Order list
using the right arrow (
The double arrows (
). These are the elements that are exported.
/
) move all the items from one list to the other.
4. To move one or more items up or down in the Export Order list, tap the item(s) and then
tap the up or down arrow (
/
).
5. Select a Level Option:
• Detected
In the exported file, displays ND (non-detect) in the result column for all non-detects,
and leaves the +/- column blank.
• Detected + LOD
Displays <LOD in the result column and the estimated LOD (limit of detection)
calculation in the +/- column.
• Chem < LOD
Displays a calculated result and error even when the result is less than the limit of
detection for that particular analysis. This option is mainly for advanced users.
6. Select an Element/Compound:
• Element Only
• Compound Only
• Both.
7. Select Units of measure:
• Default
• Percent
• PPM
• Mixed.
98
Chapter 8
103202-01EN, Rev. A, December 2012
8. Choose to Include:
• Errors
• Pass/Fail.
9. Select how the elemental information is exported:
• Auto Include
• Auto Exclude
• Nominal Chem.
Figure 8-10 Export chemical options screen
10. Tap OK to save and return to the Export Options screen (see Figure 8-7 on page 96).
11. Tap OK again to return to the Export screen (see Figure 8-5 on page 95).
12. Tap the Export button (
) to export the results.
13. In the Export Data dialog box, enter a file name, and then tap OK.
8.3
Trending
Trending allows you to compare and display the analytical accuracy of individual elements
across multiple test results.
8.3.1
Setting up trending
To set up basic trending
1. In the Results screen, tap the Tools button (
) to display the Setup screen.
2. Tap Trending to display the trending template select screen (see Figure 8-11 on page 100).
If no template is defined, trending is disabled, and “Trending Disabled” is displayed.
3. To define a new template name, tap the Plus button (
Template screen (see Figure 8-12 on page 100).
) to display the Add Trending
Results
99
103202-01EN, Rev. A, December 2012
Figure 8-11 Setup (left) and trending template select (right) screens
4. Enter a template name, and then tap Save to save and display the template setup screen
(see Figure 8-12 on page 100).
In the template setup screen, the current template name is displayed in the list box at the
top of the screen.
You can define new templates or delete the currently selected template using the Plus
and Minus buttons.
5. In the Graph Option area, leave Test Number selected, or select a Test Label.
This information will be used as the X-axis of the trending graph.
6. Select elements and move them between the Excluded and Included lists using the
arrows.
The elements in the Included list are used when the trending graph is displayed.
Figure 8-12 Add Trending Template (left) and template setup (right) screens
It is not necessary to configure results filters. However, if filters are not configured, the
trending graph will contain results for all modes and all dates that are currently on the
analyzer. To provide more specific graphs, it is best to define filters that use a single mode,
one or more test labels, or specific dates.
100
Chapter 8
103202-01EN, Rev. A, December 2012
To configure a results filter
1. To add a Result Set Filter, tap Setup (see Figure 8-12 on page 100) to display the filter
setup screen (see Figure 8-13 on page 101).
The Result Set Filter list shows the current filter. If no filters are selected, NONE is
displayed.
2. Tap the Plus button (
) to display the Add Result Filter Template screen (see
Figure 8-13 on page 101).
3. Enter the filter name, and then tap Save to display the filter configuration screen (see
Figure 8-13 on page 101).
The current filter name is displayed at the top of the screen.
You can define new filter or delete the currently selected filter using the Plus and Minus
buttons.
4. In the Mode list, select a mode.
The two lists below the Mode list allow you to configure one of eight test labels. These are
not normally used, but can be configured to provide more granular filtering. If test labels
are used, the value of the selected label must be must be entered in the adjacent field.
5. To set a date range for the trending graph, tap the down arrow, and then enter a date
using the pop-up calendar.
You can quickly select a year by clicking on the year (at the top of the calendar) and using
the spin box. Navigate to a month by clicking on the month and selecting from the menu.
Figure 8-13 Filter setup (left), Add Result Filter Template (middle), and filter configuration
(right) screens
When the date filter is set, all tests run during that date range are included in the trending
analysis. You cannot include or exclude any particular test results for a given date range.
6. Click OK to return to the template setup screen (see Figure 8-14 on page 102).
Results
101
103202-01EN, Rev. A, December 2012
Figure 8-14 Template setup screen
7. Click OK again to return to the Setup screen.
8. Click OK once more to return to the Results screen.
102
Chapter 8
103202-01EN, Rev. A, December 2012
Appendix A: Graphic Elements
A.1
Home
The DELTA user interface is centered around the Home screen. It displays four buttons
(Mode, Test, Results, Setup) which control access for managing the entire Olympus DELTA
XRF application (see Figure A-1 on page 103).
Figure A-1 Home screen
A.2
Graphic Elements
The graphic elements of the user interface are presented in Table 7 on page 103 and Table 8
on page 105.
Table 7 Buttons and indicators
Graphic
element
Name
Home
Description
Return to UI main
screen. Then direct
access to Setup,
Mode, Test, and
Results buttons.
Graphic
element
Name
Setup
Description
System-wide setup
including Trigger
Hardware, Printer,
BT GPS, Users,
Date-Time, Exit.
Graphic Elements
103
103202-01EN, Rev. A, December 2012
Table 7 Buttons and indicators (continued)
Graphic
element
104
Appendix A
Name
Description
Graphic
element
Name
Description
Mode
Shows available
modes; allows mode
selection.
Test
Go to Test screen
(see chapter 3 on
page 43 for details).
Tools
Go to Test Setup; set
testing times;
repeats, Cal Check,
label defaults;
custom display.
Results
Go to the Results
screen.
Test/Tools
Shortcut from Test
Conditions to Test
Setup.
Calendar
Access to result
navigation facility.
Cal Check
Perform Cal Check
procedure.
Spectral
Plot
Go to spectral plot
of current elemental
test.
Start Test
Start a test; clear
previous screen;
show status.
Chemistr
y
Go to elemental list
from the current
spectral plot view; A
toggle with Spectral
plot.
Stop Test
Stop current test
immediately; return
to ready status.
Back
Return (without
saving) to previous
screen.
Exit
Leave DELTA
software with
confirm
OK
Return to previous
screen; save any
new data.
Lock
Trigger is locked by:
(a) software control
or
(b) manual override.
Print
Used on Test and
Results screens.
Unlock
Trigger is not
currently locked.
Trigger may be
pulled to allow
X-rays to be emitted.
Camera
Display of last saved
image.
Maximize
Display
Expands either the
list or spectral plot
displays.
Live
Video
Real-time display
from camera.
Minimize
Display
Returns list or
spectral plot displays
to original layout.
Display
Keyboard
Data entry toggle
function; provides
access to or removes
Input Panel.
103202-01EN, Rev. A, December 2012
Table 7 Buttons and indicators (continued)
Graphic
element
Name
Description
Graphic
element
Name
Description
Zoom/
Unzoom
Used with spectral
plots to focus on
narrower ranges.
Battery
Black bars give
graphic indication
of battery charge
status.
Info
Provides access to
test label data and
entry.
Restart
Restarts the
operating system
(OS) and analyzer
software.
Message
System message in
error log.
Battery
Solid red is
indicator of low
battery charge
status.
Message
Error message in
error log.
Battery
AC power is
installed and its
power supply is on.
Export
Send the chosen set
of results to output
device.
Admin
Prefs
Enables users with a
password to set
certain preferences.
Averaging
Averaging enabled.
Trending
Enables display of
trending data.
Print to
Bluetooth®
Prints results to a
Bluetooth-enabled
printer.
Test
Selected
Indicates test is
selected for
averaging.
Select Test
Indicates current test
can be added to the
averaging set.
Power
OFF
Shuts the analyzer
down
Table 8 User interface graphics
DELTA screen displays key information via upper and lower status bars
Upper status bar displays:
• Current operation and mode
• Trigger status (locked or unlocked)
• Battery charge status
Lower status and message bar displays:
• Test progress and system information
• System status and system time
Graphic Elements
105
103202-01EN, Rev. A, December 2012
106
Appendix A
103202-01EN, Rev. A, December 2012
Appendix B: Camera and Collimator
Olympus DELTA handheld XRF analyzers are available with a camera and collimator as
factory installed options.
B.1
Camera
The camera shows the area where the X-ray beam is focused.
To set up the camera
1. In the Test Setup screen, tap Camera to display the Camera Setup screen (see Figure B-1
on page 107).
2. In the Camera Enable area, select On.
3. In the Camera LED area, select On or Off.
This controls the internal LED light which illuminates a section of the test sample.
Figure B-1 Test Setup (left) and Camera Setup (right) screens
4. In the Camera Default View area, select Live or Saved Image.
This selects what will be displayed on the Test screen during testing. An indicator near
the top of the Test screen indicates which view is current (see Table 9 on page 108).
Camera and Collimator
107
103202-01EN, Rev. A, December 2012
Table 9 Camera display selection
Indicator
Camera View
Live View
The Test screen continuously displays the live camera image of
the object in front of the analyzer window.
Saved Image View
The Test screen displays the last captured image.
5. Tap More (see Figure B-1 on page 107) to access a second Camera Setup screen.
6. To get one image for each repeated test, select the One Image Per Each Repeated Test
check box.
Otherwise only one image is generated for an entire series of repeated tests.
7. To adjust the Camera LED Brightness, tap and hold the slider, and then move it side to
side.
Figure B-2 Camera Setup screen (second page)
8. Tap OK three times to save your settings and go back through the previous three screens
to the Test screen (see Figure B-3 on page 109).
You are now ready to use the camera.
108
Appendix B
103202-01EN, Rev. A, December 2012
Figure B-3 Test screen — Camera enabled
B.2
Collimator
The collimator focuses the normal 10 millimeter beam spot diameter down to 3 millimeters.
This enables you to target a smaller area of a sample for testing.
The collimator is a factory option available on DELTA handheld XRF analyzers equipped
with a camera. Collimation is not available in Filter, Lead Paint, Dust Wipe, and Halogen
Free modes.
Collimator Set Up
Setting up the collimator includes setting the cursor position, then cropping the image.
Setting the cursor position aligns the camera cursor with the collimated X-ray beam spot.
Cropping refers to the removal of the outer parts of an image. This has the effect of zooming
in on a particular area. When a test is run using the collimator, the cropped image is always
shown on the screen.
Olympus provides a two-sided collimation test coin (P/N: 103281 [U8996829]) as a check
sample with all collimated DELTA analyzers:
•
Side 1 has phosphor paper embedded and is used to set the cursor position (see
Figure B-4 on page 110).
Camera and Collimator
109
103202-01EN, Rev. A, December 2012
Figure B-4 Collimation test coin — Side 1
•
Side 2 has varying sizes of copper (Cu) circles containing solder in a field of
bromine-containing plastic (Br). It is used to verify the X-ray beam spot location (see
Figure B-5 on page 110).
Figure B-5 Collimation test coin — Side 2
Since collimated beams have a spot diameter of approximately 3 mm, the test coin is used to
verify collimation of the beam. This is done by using side 1 of the test coin to set the cursor
position, then using side 2 to test and compare the ratio of Cu to Br.
For example, a properly positioned collimated beam focused on the 4 mm test sample should
test 100 % Cu. The same collimated beam focused on the 1.5 mm test sample should test 50 %
Cu and 50 % Br.
To display the Collimator Setup screen
1. In the Test Setup screen, tap Camera/Collim.
110
Appendix B
103202-01EN, Rev. A, December 2012
Figure B-6 Test Setup (left) and Camera Setup (right) screens
2. In the Camera Setup screen (see Figure B-6 on page 111), tap Collimator to display the
Collimator Setup screen (see Figure B-7 on page 111).
Figure B-7 Collimator Setup screen
To set the cursor position
To avoid potential radiation exposure:
•
•
•
Do not point the analyzer at yourself or another person when testing.
Do not hold a sample with your fingers or in the palm of your hand when testing.
Always wear both a ring-style and a badge (either clip-on or lanyard-style) dosimeter.
1. In the Collimator Setup screen, select the Enable Collimator check box (see Figure B-7
on page 111).
2. In the Cropping / Cursor Positioning area, select Cursor.
Camera and Collimator
111
103202-01EN, Rev. A, December 2012
3. Tap Start Align Sample Test.
A dialog box appears, requesting: “Please put X-ray Phosphor sample in front of
window.”
4. Place the analyzer on side 1 of the collimation test coin, and then tap OK.
As the analyzer emits X-rays, the phosphor paper on the test coin glows to indicate the
X-ray beam spot.
5. Tap the center of the X-ray beam spot to align the cursor (the red circle) with the beam
spot.
6. When satisfied with the position of the cursor, tap Stop Test.
7. Click OK.
Figure B-8 Collimator Setup screen — Cursor aligned with beam spot
To crop the image
1. Place the analyzer on one of the copper circles (side 2 of the collimation test coin).
2. In the Collimator Setup screen (see Figure B-9 on page 113), select Crop in the
Cropping / Cursor Positioning area.
3. Tap and drag your finger diagonally across the portion of the image you want to keep.
The screen takes several seconds to update after you select an area of the image for cropping.
112
Appendix B
103202-01EN, Rev. A, December 2012
Figure B-9 Collimator Setup screen — Tap and drag
4. To adjust the size of the display image, enter values into the Size, X, or Y boxes.
Figure B-10 on page 113 shows a rectangle indicating the cropped area.
Figure B-10 Collimator Setup screen — Cropped area defined
5. Tap Show Cropped (see Figure B-11 on page 114) to view the cropped image.
6. Tap Show Un-Cropped to view the uncropped image.
Camera and Collimator
113
103202-01EN, Rev. A, December 2012
Figure B-11 Collimator Setup screen — Cropped/Uncropped views
When a test is run using the collimator, the cropped image is the default display.
114
Appendix B
103202-01EN, Rev. A, December 2012
Appendix C: Averaging Test Results
The DELTA handheld XRF analyzer is capable of finding the average of multiple tests. There
are three types of averaging available:
•
•
•
C.1
Live averaging
Historical averaging.
Repeated tests with averaging
Live Averaging
Live averaging allows you to run tests, and also create an average using selected multiple
tests.
To enable live averaging
1. In the Setup screen (see Figure C-1 on page 115), tap Admin Prefs to display the
password screen.
2. Tap in the Password box, and then enter the password using the Input Panel (see
Figure C-1 on page 115).
Default password is z (lower case).
3. If necessary, tap the Display Keyboard button (abc) to dismiss the Input Panel.
4. Tap OK to display the preference selection screen.
Figure C-1 Setup (left) and password (right) screens — Input Panel
5. In the preference selection screen (see Figure C-2 on page 116), select Live Averaging.
Averaging Test Results
115
103202-01EN, Rev. A, December 2012
6. Tap Back to save your choice and return to the Setup screen.
Figure C-2 Preference selection screen
7. Tap the Home button (
) to display the Home screen.
To setup live averaging
1. In the Home screen, tap the Test button (
Figure C-3 on page 116).
) to display the Test screen for the mode (see
2. Tap the Averaging ( ) button to display the Average Live Setup dialog box (see
Figure C-3 on page 116).
3. Select Manual Stop (see Figure C-3 on page 116).
4. Tap OK.
Figure C-3 Test screen — Averaging button and Average Live Setup dialog box
The Averaging button is now red, indicating that live averaging is active (see Figure C-4
on page 117).
116
Appendix C
103202-01EN, Rev. A, December 2012
Figure C-4 Test screen — Live Averaging enabled
To use live averaging
To avoid potential radiation exposure:
•
•
•
Do not point the analyzer at yourself or another person when testing.
Do not hold a sample with your fingers or in the palm of your hand when testing.
Always wear both a ring-style and a badge (either clip-on or lanyard-style) dosimeter.
1. Place the DELTA analyzer on the test sample, and then pull the trigger to initiate a test.
When the test is finished, a gray check button is displayed (beside the Averaging button
(
) to indicate that the most recent test is available for averaging (see Figure C-5 on
page 118).
2. Tap the gray check button (
) to include the most recent test in the averaging group.
The check turns green (
) to confirm, and the status bar at the bottom of the screen
displays Ready-mark (1) to indicate that one test has been designated for averaging.
Averaging Test Results
117
103202-01EN, Rev. A, December 2012
Figure C-5 Test screen — Current test selected
3. Pull the trigger again to initiate another test.
When the test is finished, the green check button indicates that the most recent test has
been designated for the averaging group. The status bar at the bottom of the screen
displays Ready-mark (2) to indicate that two tests has been designated for averaging
4. Pull the trigger again to initiate a third test.
5. When the test is finished, tap the green check button to deselect.
The check turns gray, the most recent test is not designated for the averaging group, and
the status bar displays Ready-mark (2).
6. Pull the trigger again to initiate a fourth test.
At the end of the test, the check button is green, and the status bar displays
Ready-mark (3).
7. Tap the Averaging button (
on page 118).
) to create the average and display the data (see Figure C-6
Figure C-6 Test screen — Live averaging results
118
Appendix C
103202-01EN, Rev. A, December 2012
C.2
Historical Averaging
Historical averaging allows you to select from a list of previous test results, then create an
average from your selections.
To enable historical averaging
1.
2.
3.
4.
Perform steps 1 to 3 in “To enable live averaging” on page 115.
Select Historical averaging.
Tap Back to save your choice and go back to the Setup screen.
Tap the Home button to display the Home screen.
To setup and use historical averaging
1. In the Home screen, tap the Results button (
) to display the Results screen for the
mode.
A gray check button appears for every valid test result (see Figure C-7 on page 119).
Figure C-7 Results screen — Historical averaging available
2. Tap the check button (
) to include the result in the averaging group.
The check turns green to confirm the test is included. Ready (1) in the status bar at the
bottom of the screen indicates that one test has been designated for averaging.
3. Select as many results as necessary. Use the arrows, scroll bar, and calendar to locate a
particular result.
4. Tap the Tools button to display the Setup screen (see Figure C-8 on page 120).
Averaging Test Results
119
103202-01EN, Rev. A, December 2012
Figure C-8 Setup screen
5. Tap the Averaging button (
) to view the tests selected for averaging (Figure C-9 on
page 120).
6. Tap Calc Average to calculate the average and display the confirmation screen.
Figure C-9 Results — Historical averaging selection and confirmation screens
7. Tap Add to Selection, and then tap the Back arrow twice.
The averaged result should be visible on the Results screen (see Figure C-10 on
page 121).
120
Appendix C
103202-01EN, Rev. A, December 2012
Figure C-10 Results screen — Historical average displayed
To add additional results to an average set
1. Select an individual result, and then tap the check button to include the result in the
averaging group. Select as many individual results as you want.
2. Tap the Tools button to display the Setup screen (see Figure C-11 on page 121).
3. Tap the Averaging button (
) to see the original averaging set with the new additions
(see Figure C-11 on page 121).
Figure C-11 Setup screen and results — Historical selection screen
4. Tap Calc Average.
5. Tap Add to Selection, and then tap the Back arrow twice.
The averaged result should be visible on the Results screen.
To add batch results to an average set
1. Select an individual result, and then tap the check button.
2. Tap the Tools button to display the Setup screen (see Figure C-8 on page 120).
Averaging Test Results
121
103202-01EN, Rev. A, December 2012
3. Tap the Averaging button (
) to see the Active Selection you just chose (see
Figure C-12 on page 122).
4. Tap Add to display the Add Results dialog box.
5. In the Number to add box, enter a value.
6. Select Newer to add newer results, Older to add older test results.
7. Tap OK.
The specified number of newer or older test results are added to the initial result.
Figure C-12 Results — Historical selection screens
8. Tap Calc Average.
9. Tap Add to Selection, and then tap the Back arrow twice.
The averaged result should be visible on the Results screen (see Figure C-13 on
page 122).
Figure C-13 Results screen — Batch average displayed
122
Appendix C
103202-01EN, Rev. A, December 2012
C.3
Repeated Tests With Averaging
Live averaging must be disabled in Setup > Admin Prefs before repeated tests with
averaging can be run.
When repeated tests with averaging is enabled, the test is repeated the configured number of
times. Then the DELTA software automatically creates an average using every test in the
sequence to calculate the average.
Example:
2-1, 2-2, 2-3, 2-4, 2-5, 2-Ave
In the example sequence above, test number 2 (first digit) was repeated 5 times (second
digit), then the average of the five tests was calculated.
To generate repeated tests with averaging
To avoid potential radiation exposure:
•
•
•
Do not point the analyzer at yourself or another person when testing.
Do not hold a sample with your fingers or in the palm of your hand when testing.
Always wear both a ring-style and a badge (either clip-on or lanyard-style) dosimeter.
1. In the Home screen, tap the Test button (
2. In the Test screen, tap the Tools button (
).
).
3. In the Test Setup screen (see Figure C-14 on page 124), enter the number of tests in the
Repeat Test box.
4. Select the Generate Avg check box.
5. Tap OK to go back to the Test screen.
6. Tap the Start Test button (
tests are completed.
) to initiate and repeat a test until the specified number of
Averaging Test Results
123
103202-01EN, Rev. A, December 2012
Figure C-14 Test Setup (left) and Test (right) screens — Test 5 of 5
7. Tap the Results button (
on page 124).
) to display the average of the repeated tests (see Figure C-15
Figure C-15 Results screen — Average of repeated tests
124
Appendix C
103202-01EN, Rev. A, December 2012
Appendix D: Trending Example
Trending allows you to compare and display the analytical accuracy of individual elements
across multiple test results.
Trending always uses existing results, and can be set up before or after the test results have
been created. The trending graph is viewed in the Results screen. A typical use of trending is
described in this section. Note that this is only one example out of a wide range of
possibilities:
To perform trending
1. In the mode screen, select a mode (in this example, Soil is selected).
2. Go to the Test screen (tap the Test button) and run five tests, preferably on varying
concentrations of the target trending element(s).
(In this example, Ti and Mn are the target elements.)
3. Go to the Trending Template Setup screen, and then create a template.
4. Go to the Filter Configuration screen, and then create a filter. Select Soil, and then use
the current day to set the From and To dates.
5. Select the elements Ti and Mn.
6. Return to the Results screen.
7. Tap the display mode buttons until you get to the Trending button (
).
8. Tap the Trending button to display the trending graph (see Figure D-1 on page 125).
The graph shows the legend of the two configured elements, Mn and Ti, on the right. The
currently selected element, Mn, is identified in the upper left corner of the graph.
Figure D-1 Trending graph
Trending Example
125
103202-01EN, Rev. A, December 2012
9. Tap on one of the plots to select that section.
The selected section disappears, and the detected level, test date, and test number for the
section are displayed at the top of the screen, (see Figure D-2 on page 126).
Figure D-2 Trending graph — Plot segment selected
10. To change the selected element, press the middle button on the rear of the analyzer to
display a menu (see Figure D-3 on page 126) showing the currently selected element (Ti)
and the other element (Mn) available for selection.
11. Select Mn.
Figure D-3 Trending graph — Middle button menu
12. To zoom in on a sector of the graph, press at a starting point and drag to define the zoom
area.
The magnified segment of the graph is displayed, and the Zoom button (
that you are viewing a magnified image (see Figure D-4 on page 127).
126
Appendix D
) indicates
103202-01EN, Rev. A, December 2012
Figure D-4 Trending graph — Magnified view
If using test label filters to create a trending graph of specific tests, you can change the test
labels template after gathering the required trending test results for a specific date. The
trending data is not altered when additional tests are run.
Trending Example
127
103202-01EN, Rev. A, December 2012
128
Appendix D
103202-01EN, Rev. A, December 2012
Appendix E: User Factors
E.1
Definition
User factors are a stored set of scalar multipliers and offsets that are applied directly to
factory calibrated results before they are displayed on screen. Therefore, the information on
the Test screen has been corrected by the user factor. This is typically done to correct for
matrix effects.
E.2
Purpose
User factors provide two key benefits:
•
•
E.3
Allow you to make linear slope and offset calibration corrections without altering factory
calibrations.
Allow you to store multiple slope and offset calibration factor sets.
Applicable Modes
User factor correction techniques can be applied for the following modes:
•
•
•
•
•
E.4
Mining
Mining Plus (2-Beam Mining)
Soil (3-Beam Soil)
Filter
Dust Wipe
Calculating New RoHS/WEEE Factors and Offsets
Prior to accessing the User Factors data entry screens:
•
•
Generate the correction factors for the element(s) of interest.
Use a linear fit equation that is created from elemental assayed values and corresponding
XRF results.
The procedure is shown below in the Cadmium example.
User Factors
129
103202-01EN, Rev. A, December 2012
Example: Cadmium for Testing in RoHS/WEEE mode
This example shows how to apply user factor techniques to adjust for cadmium in laboratory
assayed samples.
1.
2.
3.
4.
5.
Gather known assayed Cd samples.
Record their assayed values in a three column table
Test the corresponding samples with your DELTA handheld XRF analyzer.
Record the XRF results in the table. Multiple tests of each sample are recommended.
Plot the data using Excel or other data analysis software to create a linear trendline.
See Figure E-1 on page 130 and Table 10 on page 130.
In this example, the XRF data is consistently higher than the assay by about 1.7 times.
From the linear fit equation, the value 0.5888 (say 0.59) is the “factor” that can be multiplied
by the XRF result to get a close match to the assayed value.
The offset value (0.1055) is small enough to be disregarded.
Go to section E.5 on page 131 to see the data entry sequence.
Figure E-1 Sample plot of XRF and assayed values for Cd
Table 10 Sample table of XRF and assayed values for Cd
130
Appendix E
Sample #
XRF Cd
Assayed Cd
1
31
19.6
1
35
19.6
1
36
19.6
2
236
137
2
235
137
103202-01EN, Rev. A, December 2012
Table 10 Sample table of XRF and assayed values for Cd (continued)
E.5
Sample #
XRF Cd
Assayed Cd
2
234
137
3
504
300
3
504
300
3
506
300
4
175
100
4
174
100
4
176
100
5
510
301
5
526
301
5
509
301
6
162
100
6
161
100
6
162
100
Software Operation
Once the factors and offsets (if required) are established, use this sequence to apply them.
To get to user factors
1. From the mode screen, select the correct mode for calibration, and then enter the Mode
Setup screen (see Figure E-2 on page 132).
2. Tap Test Conditions.
3. Tap User Factor.
RoHS/WEEE mode contains two calibrations, Polymer (beam 1) and Alloy (beam 2). Ensure
that the correct one is selected when adding factors.
4. For Cd choose Beam 2 (see Figure E-2 on page 132).
User Factors
131
103202-01EN, Rev. A, December 2012
Figure E-2 RoHS mode Select Beam screen
To create a new user factor model
1.
2.
3.
4.
In the User Factors screen, tap Create New Model (see Figure E-3 on page 132).
Highlight the new model, and then tap Change Name.
Enter the new model name with the on-screen keyboard, and then tap OK.
Scroll to find the element(s) for adjustment, and then enter new factor(s) and offset(s).
Consider whether offsets are necessary for a given calibration. In many cases, only
adjustment of user factor is needed.
To determine an offset, use a minimum of three separate standards, and ensure that the
lowest concentration value is <20 % of the highest concentration value.
A user factor plot can also be produced by placing assay results on the X-axis and XRF results
on the Y-axis. Make sure that the plot slope and offset are correctly converted to Slope and
Offset.
Figure E-3 Setting user factors
132
Appendix E
103202-01EN, Rev. A, December 2012
To apply user factor set model
Highlight and select the model to apply to test results (see Figure E-4 on page 133).
Selected model is displayed at the top of the screen and this user factor set is ready to be
applied to XRF test results.
Figure E-4 Selecting user factor set model
E.6
Determining Correction Factors
Single Point Calibration
•
Determine the ratio of XRF result to known value. Then divide the current factor by this
ratio to determine the new element factor.
Multi-Point Calibration with No Offset
•
The results are exported and plotted against known values using Excel or other data
analysis software. A linear equation with slope and intercept (if necessary) is determined
from the plot.
Y = mX
•
XRF response is plotted on the X-axis and the assayed value plotted on the Y-axis.
Factor = m if the original factor = –1.
Multi-Point Calibration with Offset
•
The results are exported and plotted against known values using Excel or other data
analysis software. A linear equation with slope and intercept is determined from the plot.
Y = mX + b
•
•
Take initial data in the “factory-default” user factor set of factor = 1, offset = 0.
XRF response is plotted on the X-axis and the assayed value plotted on the Y-axis.
Factor = m and the offset = b.
User Factors
133
103202-01EN, Rev. A, December 2012
134
Appendix E
103202-01EN, Rev. A, December 2012
Appendix F: RoHS/WEEE Analysis
F.1
Background
Toxic metals in consumer electronics are the focus of EU regulations that have worldwide
ramifications. These new directives currently include:
•
•
Restriction of Hazardous Substances (RoHS)
— Designates maximum allowable levels of Pb, Cd, Cr6+, Hg, and certain Br-containing
flame retardants (PBB and PBDE) in new electrical and electronic equipment sold into
the EU.
Waste Electrical/Electronic Equipment (WEEE)
— Requires separate collection and recycling of WEEE, some of which may contain
hazardous substances.
The limits for RoHS elements are:
•
•
•
<0. 1 % Pb, Cr6+, Hg, Br (as flame retardants, PBB and PBDE)
<0.01 % Cd
Additionally, many other regulations and voluntary standards have been enacted
worldwide that restrict elemental content in consumer products
The Olympus analyzer is a screening tool for RoHS Compliance. It is used to:
•
•
Directly analyze the amount of toxic metals in electronics,
Identify quickly whether a plastic is made of or contains:
— PVC
— A brominated flame retardant.
XRF measures total elemental composition, regardless of speciation of the element.
Therefore, it reports:
•
•
Total chromium including the concentration of hexavalent chromium plus any other
forms of Cr.
Total bromine, however XRF cannot distinguish the type of brominated flame retardant
present in analyzed materials.
In order for XRF to be quantitative, samples must:
•
•
•
Be homogeneous
Match the matrix type of the calibration used (e.g. polymer, alloy, etc.)
Have a certain minimum sample thickness
— 5 mm for polymers and light alloys
RoHS/WEEE Analysis
135
103202-01EN, Rev. A, December 2012
— 15 mm for liquid samples
— 1 mm for other alloys
If samples are heterogeneous, too thin, or too small, only qualitative screening is possible.
The IEC-ACEA (International Electro-technical Commission — Advisory Committee on
Environmental Aspects) and many regulatory bodies recommend XRF screening.
F.2
Software Overview
The DELTA handheld XRF analyzer in RoHS/WEEE mode automatically executes a test
sequence to determine:
•
•
Whether a sample is an alloy, polymer, or mixed sample.
— Mixed indicates heterogeneous samples consisting of both polymer and alloy, such as
wires or circuit boards.
Whether each RoHS element passes, fails, or is inconclusive when compared to a set of
stored criteria.
— These criteria are either those recommended by the IEC, or ones added by the user.
The sequence begins with the instrument utilizing settings appropriate for analyzing a
polymer sample. The following logic applies:
•
•
If the sample is determined to be a polymer or mixed, the test continues, and a calibration
based on a polymer matrix is used.
If the sample is found to be a metal alloy, the analyzer switches to a secondary test, using
an alloy matrix calibration, in order to determine correct alloy concentrations.
Sample Presentation
Since many pieces of plastic analyzed for RoHS/WEEE compliance are very small, take care
to measure them in a safe and accurate manner. Refer to the IEC-ACEA recommendations for
minimum thickness of test samples.
When minimum thickness cannot be met with a single sample, multiple identical samples
can be stacked or layered to increase effective thickness. XRF sample cups (commonly used
for soil testing) can be useful for testing many small samples together, such as surface mount
components.
F.3
IEC Quantitative Screening Requirements
RoHS screening requirements are derived from the Directive 2011/65/EU of the European
Parliament and of the Council on the restriction of the use of certain hazardous substances in electrical
and electronic equipment Dated 8 June 2011. This document is a recast of the original directive
2002/95/EC Dated 27 January 2003.
IEC Screening Guidelines below are adapted from an example screening scheme in IEC
62321 – Electrotechnical products – Determination of levels of six regulated substances (lead,
mercury, cadmium, hexavalent chromium, polybrominated biphenyls, polybrominated diphenyl
ethers) Ed. 1.0, Dated December 2008.
136
Appendix F
103202-01EN, Rev. A, December 2012
Important Current Issues
Screening guidelines are given as an example scheme based on RoHS action levels. The
inconclusive band around the action level is based on risk assessment, and is an example of
an “uncertainty budget”.
Screening guidelines may vary based on sample types tested and user’s tolerance for risk.
Following these screening guidelines alone may not be sufficient to ensure that a proper
compliance determination is made.
Olympus strongly advises users to have their own compliance departments determine
appropriate screening guidelines, test methodology, standard operating procedure, and the
current status of the requirements that they must meet.
F.4
Grade Definitions for Screening
Table 11 Grade definitions
Grade
Proposed screening criteria
Pass
Results for ALL elements are lower than the lower limits shown
(see Table 12 on page 138).
Fail
Result for ANY element higher than the higher limits shown (see
Table 12 on page 138).
Inconclusive
Result of the quantitative analysis, for any of the elements Hg, Pb,
or Cd, is in the region defined as intermediate, OR if the result of
the elements BR and Cr is higher than the higher limits shown (see
Table 12 on page 138), the analysis is inconclusive. Additional
investigation must be performed.
RoHS/WEEE Analysis
137
103202-01EN, Rev. A, December 2012
F.5
Screening Limits for RoHS/WEEE Compliance
Table 12 Example of screening limits for RoHS elements
RoHS
elements
Pass
Lower limit
Inconclusive
Upper limit
Fail
Cd
P
<(70 – 3σ)
<X<
(130 + 3σ)<
F
Pb
P
<(700 – 3σ)
<X<
(1300 + 3σ)<
F
Hg
P
<(700 – 3σ)
<X<
(1300 + 3σ)<
F
Br
P
<(300 – 3σ)<
X
Cr
P
<(700 – 3σ)<
X
Metallic materials
Cd
P
<(70 – 3σ)
<X<
(130 + 3σ)<
F
Pb
P
<(700 – 3σ)
<X<
(1300 + 3σ)<
F
Hg
P
<(700 – 3σ)
<X<
(1300 + 3σ)<
F
Br
Cr
N/A
P
<(700 – 3σ)<
X
Electronics
138
Cd
P
LOD
<X<
(150 + 3σ)<
F
Pb
P
<(500 – 3σ)
<X<
(1500 + 3σ)<
F
Hg
P
<(500 – 3σ)
<X<
(1500 + 3σ)<
F
Br
P
<(250 – 3σ)<
X
Cr
P
<(500 – 3σ)<
X
Appendix F
103202-01EN, Rev. A, December 2012
Appendix G: Test Time Notes
G.1
Background
Test times for DELTA handheld XRF analyzers are a function of several items, including:
•
•
•
User chosen mode
Desired precision
Desired result speed or throughput time (a trade-off with precision)
Other technical design factors can include:
•
•
X-ray producing hardware/electronics including type of detector.
Software and processor sophistication
A key difference for DELTA instrument models is the type of detector
•
•
Classic and Classic Plus — PIN diode
Standard, Professional, Premium, and Premium Plus — Silicon Drift Detector (SDD)
SDD-based units have much faster processing response times as compared to the PIN units.
G.2
•
•
•
Testing Time Issues — All Modes
Min. testing time is the interval that must elapse before results are calculated.
— Results do not appear until the min. testing time has elapsed.
If a test is stopped before the min. testing time has elapsed, the test is aborted.
— No results are calculated.
— No information related to the test is saved.
Max. testing time automatically ends the test at a preset testing interval.
— It may be two minutes (or more) depending on detection limits and desired precision.
Alloy Comments
For most alloys, to obtain a unique grade ID and good alloy chemistry, the recommended
testing time is 5 to 10 seconds.
For some alloys that only differ by small amounts of one or two elements, it may be necessary
to perform longer tests. Examples include low alloy steels 4140 and 4340, and aluminum
alloys 6063 and 1100.
Test Time Notes
139
103202-01EN, Rev. A, December 2012
In Alloy mode, for separation of alloys which differ by less than 1 % of Ti or V, QuickSort is
recommended as the SmartBeam option.
In Alloy Plus mode, for separation of alloys which differ by presence or concentration of light
elements, SmartSort is recommended as the Alloy Plus option.
The maximum testing time determines the length of a test. The analysis automatically stops if
the maximum testing time is reached. Normal maximum testing times range from 5 to
20 seconds, though longer times may be needed for beam 2 of Alloy Plus mode.
G.3
Alloy Analysis Goals
Use shorter analysis times if goal is primarily grade identification.
Use longer test times if greater precision is required in the calculation of chemistry or if an
alloy separation is particularly difficult.
140
Appendix G
103202-01EN, Rev. A, December 2012
Appendix H: Alloy Grade Libraries
Every DELTA handheld XRF analyzer is supplied with four libraries:
•
•
•
•
The Factory library unique to every model (see the following pages for tables showing
model/factory grade names).
The Tramp library.
User library #1 (the user can store over 500 grade names).
User library #2 (the user can store over 500 grade names).
Libraries are editable. However, Olympus does not recommend that users edit the Factory
Grade library.
H.1
Tramp Library
Every analyzer is shipped with a Tramp library comprised of seven base alloys (see Table 13
on page 142). The Tramp library supports other grade libraries.
Tramp limits can be set, element by element, alloy base by alloy base, to meet specific
requirements.
A single click can globally select/deselect the Tramp features.
How the Tramp library works
1. Tramp grades are matched to alloy bases rather than specific grades.
• Each sample is determined to be one of seven possible base alloys (see Table 13 on
page 142).
• The analyzer applies the Tramp grade/base-specific tramp limits from the matching
Tramp grade.
2. These Tramp or “alloy-base-specific” limits are applied when an element is detected in a
specific grade, and:
• The nearest grade match has no specification for that element.
• The concentration of the sample is less than the max limit specified by the matching
Tramp grade.
3. Once the conditions for step 2 are met, the element reported on the user interface screen:
• Is displayed in blue.
• Is labeled as a Tramp material in the grade comparison table.
Alloy Grade Libraries
141
103202-01EN, Rev. A, December 2012
•
The grade match, however, is not penalized.
Practical Advantages of the Tramp Element Approach
•
•
•
•
Faster sorting
Fewer ambiguous or incorrect matches
Improved grade library integrity
Prominent labeling of tramp elements
Table 13 Tramp library base alloys
Base alloys
H.2
Common Tramp elements
_AlAlloyBase
Pb, Bi, Sn, Fe, Cu, and Zn.
_CoAlloyBase
Al, Ti, V, Cu, Nb, Ta, and Zr.
_CuAlloyBase
S, As, Ag, Sb, and Sn; not as common Pb, Co, and Ni.
_FeAlloyBase
V, Co, Cu, Ni, and As; sometimes Si, W, and Nb.
_GenericAlloyBase
V, Co, Cu, Ni, and As; sometimes Si, W, and Nb.
_NiAlloyBase
V, Co, W, Zr, and Nb; sometimes Ta, Mo, Cr, and Cu.
_TiAlloyBase
Fe is common; Cu and Si show up at low levels.
DELTA Classic, Classic Plus, and Inspector Factory Grade Library
Table 14 Aluminum, cobalt alloys, and speciality grades
142
Aluminum
Cobalt alloys
Speciality grades
2007
Alloy 686
60Sn-40Pb
2011
AlnicoVIII
63Sn-37Pb
2018
Cobalt
96-4
2117
Elgiloy
AZ31B
2618
F75
AZ91A or C
4032
FSX-414
SAC 300
5454
Haynes188
SAC 305
6040
Haynes36
SAC 400
6061
HS-1
SAC 405
6070
HS-12
97-3
6253
HS-19
Ag
6262
HS-21
Au
Appendix H
103202-01EN, Rev. A, December 2012
Table 14 Aluminum, cobalt alloys, and speciality grades (continued)
Aluminum
Cobalt alloys
Speciality grades
7005
HS-25-L605
Bi
7016
HS-31
Cb 103
7019
HS-4
CP Ta
7039
HS-6B
Cr
7050
Jetalloy
Densalloy
7072
MarM302
Hf
7075
MarM509
Mn
7104
MarM905
Mo
1100-plus
MP35N
Nb
2024-plus
MPN159
Ni
2098-2195
Star J
Pb
2219-2519
Ultimet
Pd
3003 or 4 or 5
Re
355-2
Sb
5052-plus
Se
5086-plus
Sn
6063-plus
TungCarb C
7049-149-249
TungCarb S
V
W
Zn
Zr
Zr 2 or 4
Zr 702
Zr 704
Zr 705
Alloy Grade Libraries
143
103202-01EN, Rev. A, December 2012
Table 15 Copper and nickel alloys
Copper alloys
Nickel alloys
C 110
C 510
C 864
B 1900
I-617
MarM421
C 172
C 524
C 867
B-1900 Hf
I-625
Monel400
C 194
C 534
C 868
C-1023
I-690
Monel411
C 210
C 544
C 875
GMR235
I-700
MonelK500
C 220
C 623
C 8932
GTD222
I-702
MuMetal
C 260
C 630
C 903
Hast BC1
I-706
Ni 200
C 270
C 655
C 922
HastB
I-713
NichromeV
C 310
C 667
C 932
HastB2
I-718
Nim101
C 314
C 673
C 937
HastB3
I-720
Nim263
C 330
C 675
C 955
HastC2000
I-722
Nimonic75
C 332
C 706
C194HiCu
HastC22
I-725
Nimonic80A
C 340
C 710
C197HiCu
HastC276
I-738
Nimonic90
C 342
C 715
Elec Cu
HastC4
I-750
PWA1480
C 360
C 745
Muntz
HastF
I-792
PWA1484
C 377
C 752
NarloyZ
HastG
I-800
RA333
C 425
C 814
SeBiLOYI
HastG2
I-801
Rene125
C 443
C 836
SeBiLOYII
HastG3
I-825
Rene142
C 464
C 857
SeBiLOYIII
HastG30
I-901
Rene220
C 482
HastN
I-903
Rene41
C 485
HastR
I-907-909
Rene77
HastS
I-939
Rene80
HastW
IN100Mar
Rene95
HastX
M002
Supertherm
Haynes230
MarM200
Udimet500
HR160
MarM246
Udimet520
HyMu80
MarM247
Udimet700
I-102I-49
I-600
I-601
144
Appendix H
Waspaloy
103202-01EN, Rev. A, December 2012
Table 16 Low-alloy and chrome-moly steels
Low-alloy steels
Chrome-moly steels
3310
1 1-4 Cr
4130
2 1-4 Cr
4140
5 Cr
4340
9 Cr
8620
P91
9310
12L14
A10
Carb 1-2 Moly
Carbon Steel
20Mo4
Table 17 Stainless, Ti, and Tool steels
Stainless grades
Ti grades
Tool steels
201
21-6-9
Haynes556
Cp Ti
A2
203
25-4-4
Incoloy840
Cp Ti Pd
A6
304
254SMO
Invar 36
Ti 12
A7
309
26-1
Kovar
Ti 17
D2 or D4
310
29-4
M152
Ti 3 2-5
D7
316
29-4-2
Maraging350
Ti 6-22-22
H-11
317
29-4C
MaragingC200
Ti 6-2-4-2
M1
321
302HQ
MaragingC250
Ti 6-2-4-6
M2
329
410 Cb
MaragingC300
Ti 6-4
M4
330
410-16-20
N-155
Ti 6-6-2
M42
347
904L
Ni-hard#1
Ti 8
O1
422
A-286
Ni-hard#4
Ti 8-1-1
O2
430
AL6XN
Ni-Span902
Ti 10-2-3
O6
431
Alloy42
Nitronic40
Ti 15-3-3-3
S1
434
AlnicoII
Nitronic50
Ti 3-11-13
S5
440
AlnicoIII
Nitronic60
Ti 5 - 2-5
S6
Alloy Grade Libraries
145
103202-01EN, Rev. A, December 2012
Table 17 Stainless, Ti, and Tool steels (continued)
Stainless grades
Ti grades
Tool steels
441
AlnicoV
RA330
Ti 6-2-1-1
S7
446
AMS350
RA85H
TiBetaC
T1
2003
AMS355
Zeron100
2101
CD4MCU
2507
Custom450
13-8 Mo
Custom455
15-5 PH
Duplex2205
15Mn7Cr
E-bite
17-4 PH
Ferallium255
17-7 PH
GreekAscoloy
19-9DL
H12
19-9DX
H13
20Cb3
20Mo6
H.3
DELTA Standard and Professional Factory Grade Library
Table 18 Aluminum, cobalt alloys, and speciality grades
146
Aluminum
Cobalt alloys
Speciality grades
319
Alloy 686
60Sn-40Pb
333
AlnicoVIII
63Sn-37Pb
380
Cobalt
96-4
383
Elgiloy
AZ31B
384
F75
AZ91A or C
2007
FSX-414
SAC 300
2011
Haynes188
SAC 305
2018
Haynes36
SAC 400
2024
HS-1
SAC 405
2117
HS-12
97-3
2618
HS-19
Ag
3004
HS-21
Au
Appendix H
103202-01EN, Rev. A, December 2012
Table 18 Aluminum, cobalt alloys, and speciality grades (continued)
Aluminum
Cobalt alloys
Speciality grades
4032
HS25-L605
Bi
5042
HS-31
Cb 103
5052
HS-4
CP Ta
5083
HS-6B
Cr
5086
Jetalloy
Densalloy
5154
MarM302
Hf
5454
MarM509
Mn
6040
MarM905
Mo
6061
MP35N
Nb
6070
MPN159
Ni
6253
Star J
Pb
6262
Ultimet
Pd
7005
Re
7016
Sb
7019
Se
7039
Sn
7050
TungCarb C
7072
TungCarb S
7075
V
7104
W
1100-plus
Zn
2014-17 std
Zr
2024-plus
Zr 2 or 4
2098-2195
Zr 702
2219-2519
Zr 704
3003 or 4 or 5
Zr 705
3003 or 5
355-2
356-57-std
5052-plus
Alloy Grade Libraries
147
103202-01EN, Rev. A, December 2012
Table 18 Aluminum, cobalt alloys, and speciality grades (continued)
Aluminum
Cobalt alloys
Speciality grades
5056-82
5086-plus
6063-plus
7049-149-249
Table 19 Copper and nickel alloys
Copper alloys
148
Nickel alloys
C 110
C 510
C 864
20Mo4
I-102
MarM247
C 172
C 524
C 867
B 1900
I-49
MarM421
C 194
C 534
C 868
B-1900 Hf
I-600
Monel400
C 210
C 544
C 875
C-1023
I-601
Monel411
C 220
C 623
C 8932
Colmonoy 6
I-602
MonelK500
C 260
C 630
C 903
GMR235
I-617
MuMetal
C 270
C 655
C 922
GTD222
I-625
Ni 200
C 310
C 667
C 932
Hast BC1
I-690
NichromeV
C 314
C 673
C 937
HastB
I-700
Nim101
C 330
C 675
C 955
HastB2
I-702
Nim263
C 332
C 706
C194HiCu
HastB3
I-706
Nimonic75
C 340
C 710
C197HiCu
HastC2000
I-713
Nimonic80A
C 342
C 715
Elec Cu
HastC22
I-718
Nimonic90
C 360
C 745
Muntz
HastC276
I-720
PWA1480
C 377
C 752
NarloyZ
HastC4
I-722
PWA1484
C 425
C 814
SeBiLOYI
HastF
I-725
RA333
C 443
C 836
SeBiLOYII
HastG
I-738
Rene125
C 464
C 857
SeBiLOYIII
HastG2
I-750
Rene142
C 482
HastG3
I-792
Rene220
C 485
HastG30
I-800
Rene41
HastN
I-801
Rene77
HastR
I-825
Rene80
HastS
I-901
Rene95
HastW
I-903
Supertherm
Appendix H
103202-01EN, Rev. A, December 2012
Table 19 Copper and nickel alloys (continued)
Copper alloys
Nickel alloys
HastX
I-907-909
Udimet500
Haynes214
I-939
Udimet520
Haynes230
IN100
Udimet700
HR160
MarM002
Waspaloy
HyMu80
MarM200
MarM246
Table 20 Low-alloy and chrome-moly steels
Low-alloy steels
Chrome-moly steels
3310
1 1-4 Cr
4130
2 1-4 Cr
4140
5 Cr
4340
9 Cr
8620
P91
9310
12L14
A10
Carb 1-2 Moly
Carbon Steel
P20
135 N
Table 21 Stainless, Ti, and Tool steels
Stainless grades
Ti grades
Tool steels
201
17-7 PH
H12
Cp Ti
A2
203
19-9DL
H13
Cp Ti Pd
A6
303
19-9DX
Haynes556
Ti 12
A7
304
20Cb3
Incoloy840
Ti 17
D2 or D4
309
20Mo6
Invar 36
Ti 3 2-5
D7
310
21-6-9
Kovar
Ti 6-22-22
H-11
316
25-4-4
M152
Ti 6-2-4-2
M1
Alloy Grade Libraries
149
103202-01EN, Rev. A, December 2012
Table 21 Stainless, Ti, and Tool steels (continued)
Stainless grades
H.4
Ti grades
Tool steels
317
254SMO
Maraging350
Ti 6-2-4-6
M2
321
26-1
MaragingC200
Ti 6-4
M4
329
29-4
MaragingC250
Ti 6-6-2
M42
330
29-4-2
MaragingC300
Ti 8
O1
347
29-4C
N-155
Ti 8-1-1
O2
410
302HQ
Ni-hard#1
Ti 10-2-3
O6
416
410 Cb
Ni-hard#4
Ti 15-3-3-3
S1
420
410-16-20
Ni-Span902
Ti 3-11-13
S5
422
904L
Nitronic40
Ti 5 - 2-5
S6
430
A-286
Nitronic50
Ti 6-2-1-1
S7
431
AL6XN
Nitronic60
TiBetaC
T1
434
Alloy42
RA330
440
AlnicoII
RA85H
441
AlnicoIII
Zeron100
446
AlnicoV
2003
AMS350
2101
AMS355
2205
CD4MCU
2205
Custom450
2507
Custom455
13-8 Mo
E-bite
15-5 PH
Ferallium255
15Mn7Cr
GreekAscoloy
DELTA Premium and Premium Plus Factory Grade Library
Table 22 Aluminums, cobalt alloys, and speciality grades
150
Aluminums
Cobalt alloys
Speciality grades
319
Alloy 686
60Sn-40Pb
333
AlnicoVIII
63Sn-37Pb
356
Cobalt
96-4
Appendix H
103202-01EN, Rev. A, December 2012
Table 22 Aluminums, cobalt alloys, and speciality grades (continued)
Aluminums
Cobalt alloys
Speciality grades
357
Elgiloy
AZ31B
380
F75
AZ91A or C
383
FSX-414
SAC 300
384
Haynes188
SAC 305
1100
Haynes36
SAC 400
2007
HS-1
SAC 405
2011
HS-12
97-3
2018
HS-19
Ag
2024
HS-21
Au
2117
HS25-L605
Bi
2618
HS-31
Cb 103
3002
HS-4
CP Ta
3003
HS-6B
Cr
3004
Jetalloy
Densalloy
3005
MarM302
Hf
3105
MarM509
Mn
4032
MarM905
Mo
5005
MP35N
Nb
5042
MPN159
Ni
5052
Star J
Pb
5083
Ultimet
Pd
5086
Re
5154
Sb
5454
Se
5657
Sn
6040
TungCarb C
6061
TungCarb S
6063
V
6070
W
6253
Zn
Alloy Grade Libraries
151
103202-01EN, Rev. A, December 2012
Table 22 Aluminums, cobalt alloys, and speciality grades (continued)
Aluminums
Cobalt alloys
Speciality grades
6262
Zr
7005
Zr 2 or 4
7016
Zr 702
7019
Zr 704
7039
Zr 705
7050
7072
7075
7104
1100-plus
2014-17
2024-plus
2098-2195
2219-2519
3003 or 4 or 5
355-2
5052-plus
5056-82
5086-plus
6063-plus
7049-149-249
Table 23 Copper and nickel alloys
Copper alloys
152
Nickel alloys
C 110
C 510
C863
20Mo4
I-102
MarM246
C 172
C 524
C 864
B 1900
I-49
MarM247
C 194
C 534
C 867
B-1900 Hf
I-600
MarM421
C 210
C 544
C 868
C-1023
I-601
Monel400
C 220
C 623
C 875
Colmonoy 6
I-602
Monel411
C 240
C 630
C 8932
GMR235
I-617
MonelK500
C 260
C642
C 903
GTD222
I-625
MuMetal
Appendix H
103202-01EN, Rev. A, December 2012
Table 23 Copper and nickel alloys (continued)
Copper alloys
Nickel alloys
C 270
C 655
C 922
Hast BC1
I-690
Ni 200
C 310
C 667
C 932
HastB
I-700
NichromeV
C 314
C 673
C 937
HastB2
I-702
Nim101
C 330
C 675
C 954
HastB3
I-706
Nim263
C 332
C 687
C 955
HastC2000
I-713
Nimonic75
C 340
C 706
C194HiCu
HastC22
I-718
Nimonic80A
C 342
C 710
C197HiCu
HastC276
I-720
Nimonic90
C 360
C 715
Elec Cu
HastC4
I-722
PWA1480
C 377
C 745
Muntz
HastF
I-725
PWA1484
C 425
C 752
NarloyZ
HastG
I-738
RA333
C 443
C 814
SeBiLOYI
HastG2
I-750
Rene125
C 464
C 836
SeBiLOYII
HastG3
I-792
Rene142
C 482
C 857
SeBiLOYIII
HastG30
I-800
Rene220
C 485
C 861
HastN
I-801
Rene41
HastR
I-825
Rene77
HastS
I-901
Rene80
HastW
I-903
Rene95
HastX
I-907-909
Supertherm
Haynes214
I-939
Udimet500
Haynes230
IN100
Udimet520
HR160
MarM002
Udimet700
HyMu80
MarM200
Waspaloy
Table 24 Low-alloy and chrome-moly steels
Low-alloy steels
Chrome-moly steels
3310
1 1-4 Cr
4130
2 1-4 Cr
4140
5 Cr
4340
9 Cr
8620
P91
9310
Alloy Grade Libraries
153
103202-01EN, Rev. A, December 2012
Table 24 Low-alloy and chrome-moly steels (continued)
Low-alloy steels
Chrome-moly steels
12L14
A10
Carb 1-2 Moly
Carbon Steel
P20
135 N
Table 25 Stainless, Ti, and Tool steels
Stainless grades
154
Ti grades
Tool steels
201
17-4 PH
H12
Cp Ti
A2
203
17-7 PH
H13
Cp Ti Pd
A6
303
19-9DL
Haynes556
Ti 12
A7
304
19-9DX
Incoloy840
Ti 17
D2 or D4
309
20Cb3
Invar 36
Ti 3 2-5
D7
310
20Mo6
Kovar
Ti 6-22-22
H-11
316
21-6-9
M152
Ti 6-2-4-2
M1
317
25-4-4
Maraging350
Ti 6-2-4-6
M2
321
254SMO
MaragingC200
Ti 6-4
M4
329
26-1
MaragingC250
Ti 6-6-2
M42
330
29-4
MaragingC300
Ti 8
O1
347
29-4-2
N-155
Ti 8-1-1
O2
410
29-4C
Ni-hard#1
Ti 10-2-3
O6
416
302HQ
Ni-hard#4
Ti 15-3-3-3
O7
420
410 Cb
Ni-Span902
Ti 3-11-13
S1
422
410-16-20
Nitronic40
Ti 5-2-5
S5
430
904L
Nitronic50
Ti 6-2-1-1
S6
431
A-286
Nitronic60
TiBetaC
S7
434
AL6XN
RA330
440
Alloy42
RA85H
441
AlnicoII
Zeron100
446
AlnicoIII
Appendix H
T1
103202-01EN, Rev. A, December 2012
Table 25 Stainless, Ti, and Tool steels (continued)
Stainless grades
2003
AlnicoV
2101
AMS350
2205
AMS355
2205
CD4MCU
2507
Custom450
13-8 Mo
Custom455
15-5 PH
E-bite
15Mn7Cr
Ferallium255
Ti grades
Tool steels
GreekAscoloy
Alloy Grade Libraries
155
103202-01EN, Rev. A, December 2012
156
Appendix H
103202-01EN, Rev. A, December 2012
List of Figures
Figure 1-1
Figure 1-2
Figure 1-3
Figure 1-4
Figure 1-5
Figure 1-6
Figure 1-7
Figure 1-8
Figure 1-9
Figure 1-10
Figure 1-11
Figure 1-12
Figure 1-13
Figure 1-14
Figure 1-15
Figure 1-16
Figure 1-17
Figure 1-18
Figure 1-19
Figure 2-1
Figure 2-2
Figure 2-3
Figure 2-4
Figure 2-5
Figure 2-6
Figure 2-7
Figure 2-8
Figure 2-9
Figure 2-10
Figure 2-11
Figure 2-12
Figure 2-13
Figure 2-14
Figure 2-15
Figure 2-16
Figure 2-17
Figure 2-18
Figure 2-19
Figure 2-20
Figure 2-21
Figure 2-22
Figure 2-23
Home screen ...................................................................................................................... 5
Home (left) and Setup (right) screens ............................................................................. 6
Safety/Hardware screen ................................................................................................... 7
Hardware status screens .................................................................................................. 8
Password screen with Input Panel (left) and Trigger Settings screen (right) ............ 9
Trigger Settings screen ..................................................................................................... 9
Screen header ................................................................................................................... 10
Barometer Settings screen .............................................................................................. 10
Error log screens .............................................................................................................. 11
Regulatory Level screen ................................................................................................. 12
Bluetooth GPS screen ..................................................................................................... 12
Bluetooth GPS screen — GPS test completed ............................................................. 13
Admin Prefs screen ......................................................................................................... 14
Set Date and Time screen ............................................................................................... 15
Printer screen ................................................................................................................... 16
Print Settings screens — Select print fields ................................................................. 16
Print Settings screens — Select print fields (continued) ............................................. 17
Users screen ..................................................................................................................... 18
Exit screen ........................................................................................................................ 18
Mode Setup screen .......................................................................................................... 22
Alloy Test Conditions screen variations ...................................................................... 22
Test Setup screens — Beam settings and additional variables ................................. 23
End Time Type screen .................................................................................................... 24
Test Conditions (left) and Smart Beam Option (right) screens .................................. 25
Test Conditions (left) and Alloy Plus Options (right) screens ................................... 26
AU Karating button (left) and AU Karating screen (right) ........................................ 27
Mode Setup (left) and Library Manager (right) screens ............................................. 28
Match Settings screen ..................................................................................................... 29
Screens showing various match conditions ................................................................ 31
Library Manager (left) and Load Library (right) screens ........................................... 32
Edit Library (left) and Select Grade (right) screens ..................................................... 33
Min/Max screen (left) and Input Panel (right) ............................................................. 34
Select Grade (left) and Rename (right) screens ............................................................ 35
Select Grade screen (left) and delete dialog box (right) .............................................. 35
Edit Library (left) and Add Grade (right) screens ....................................................... 36
Min/Max screen ............................................................................................................... 36
Edit Library (left) and Rename [library] (right) screens ............................................. 37
Edit Library screen — Export sequence ....................................................................... 37
Edit Library screen — Import sequence ...................................................................... 38
Library Manager (left) and Pass/Fail Sel Grade (right) screens ................................. 39
Edit Library (left) and Select Grade (right) screens ..................................................... 39
Pass/Fail Sel Grade screen .............................................................................................. 40
List of Figures
157
103202-01EN, Rev. A, December 2012
Figure 2-24
Figure 2-25
Figure 3-1
Figure 3-2
Figure 3-3
Figure 3-4
Figure 3-5
Figure 3-6
Figure 3-7
Figure 4-1
Figure 4-2
Figure 4-3
Figure 4-4
Figure 4-5
Figure 4-6
Figure 4-7
Figure 4-8
Figure 4-9
Figure 4-10
Figure 4-11
Figure 4-12
Figure 4-13
Figure 4-14
Figure 4-15
Figure 4-16
Figure 4-17
Figure 5-1
Figure 5-2
Figure 5-3
Figure 5-4
Figure 5-5
Figure 5-6
Figure 6-1
Figure 6-2
Figure 6-3
Figure 6-4
Figure 6-5
Figure 6-6
Figure 6-7
Figure 6-8
Figure 6-9
Figure 6-10
Figure 6-11
Figure 6-12
Figure 6-13
Figure 6-14
Figure 6-15
Figure 6-16
Figure 6-17
Figure 7-1
Figure 7-2
158
Library Manager (left) and Mode Setup (right) screens ............................................ 40
Mode (left) and Test (right) screens — Test result ....................................................... 41
Mode Setup (left) and Test Conditions (right) screens — Soil, Mining,
Mining Plus, and Geochem ........................................................................................... 43
Test setup screens (Soil, Mining Plus, and Mining) ................................................... 44
Test Setup screen (Soil) ................................................................................................... 44
End Time Type parameter ............................................................................................. 45
User factors (Soil, Mining, Mining Plus, and Geochem) ........................................... 46
Setting user factors (Soil, Mining, Mining Plus, and Geochem) .............................. 46
Packaging Directive parameter ..................................................................................... 47
RoHS mode setup ........................................................................................................... 49
RoHS test setup ............................................................................................................... 50
End Time Type ................................................................................................................. 51
Action level settings ........................................................................................................ 51
RoHS action level ............................................................................................................ 52
IEC alloy settings ............................................................................................................. 52
IEC polymer settings ...................................................................................................... 53
IEC mixed settings .......................................................................................................... 53
RoHS user defined settings ............................................................................................ 54
RoHS user defined alloy ................................................................................................ 54
RoHS user defined settings (adding) ........................................................................... 55
RoHS user defined settings (deleting) ......................................................................... 55
RoHS set end condition settings ................................................................................... 56
Surface Pb ......................................................................................................................... 57
Force classification .......................................................................................................... 58
RoHS user factors ............................................................................................................ 59
RoHS user factors (continued) ........................................................................................ 59
Mode setup and test conditions (Dust Wipe, Filter Analysis, and Lead Paint) ..... 61
Test setup — Dust Wipe (left), Filter Analysis (middle), and Lead Paint (right) ..... 62
End Time Type ................................................................................................................. 63
User factors (Dust Wipe and Filter Analysis) ............................................................. 64
Setting user factors (Dust Wipe and Filter Analysis) ................................................. 64
Lead Paint test end condition ........................................................................................ 65
Mode Setup screen .......................................................................................................... 67
Password screen (left) and reset message (right) ........................................................ 69
Screens for accessing test labeling ................................................................................ 69
Label Setup screen ........................................................................................................... 70
Test Label Setup screen variations ................................................................................ 70
Text style setup ................................................................................................................ 71
Test Label Setup screen — Populating the Fixed List ................................................ 72
Sequence for setting up Auto Incrementing ............................................................... 73
Auto Incrementing test label sequence ........................................................................ 73
Pre-test label editing sequence ...................................................................................... 74
Post test label editing sequence ..................................................................................... 75
Screens for accessing Customize Disp screens ........................................................... 75
Custom Disp screens ...................................................................................................... 76
Custom Disp (left) and compound (right) screens ...................................................... 77
Sequence for adding a compound ................................................................................ 77
Compound screen with new compound and Test screen analysis .......................... 78
Element Suite screen ....................................................................................................... 79
Radiation safety notice ................................................................................................... 82
System initialization (left) and Test (right) screens ..................................................... 82
List of Figures
103202-01EN, Rev. A, December 2012
Figure 7-3
Figure 7-4
Figure 7-5
Figure 7-6
Figure 7-7
Figure 7-8
Figure 7-9
Figure 7-10
Figure 8-1
Figure 8-2
Figure 8-3
Figure 8-4
Figure 8-5
Figure 8-6
Figure 8-7
Figure 8-8
Figure 8-9
Figure 8-10
Figure 8-11
Figure 8-12
Figure 8-13
Figure 8-14
Figure A-1
Figure B-1
Figure B-2
Figure B-3
Figure B-4
Figure B-5
Figure B-6
Figure B-7
Figure B-8
Figure B-9
Figure B-10
Figure B-11
Figure C-1
Figure C-2
Figure C-3
Figure C-4
Figure C-5
Figure C-6
Figure C-7
Figure C-8
Figure C-9
Figure C-10
Figure C-11
Figure C-12
Figure C-13
Figure C-14
Figure C-15
Figure D-1
Figure D-2
Turn off (software method) ............................................................................................ 83
Test (left) and Test Setup (right) screens — Ready for Cal Check procedure ......... 84
Dialog box with instructions for deadman trigger Cal Check operation ............... 85
Dialog box with instructions for two-hand operation Cal Check procedure ........ 85
DELTA special function push buttons ......................................................................... 86
Results screen — Successful Cal Check ....................................................................... 86
Test (left) and test in-progress (right) screens .............................................................. 87
Results (chemistry and spectra) .................................................................................... 88
Results screen .................................................................................................................. 91
Results Summary screens — Using the calendar ....................................................... 92
Horizontal scroll bar ....................................................................................................... 92
Setup (left) and Results (right) screens ......................................................................... 93
Export screen ................................................................................................................... 95
Delete screen .................................................................................................................... 95
Export Options screen .................................................................................................... 96
Export Options (left) and Add Export Template (right) screens ............................... 97
Export Options (left) and Add User Column (right) screens .................................... 98
Export chemical options screen .................................................................................... 99
Setup (left) and trending template select (right) screens .......................................... 100
Add Trending Template (left) and template setup (right) screens .......................... 100
Filter setup (left), Add Result Filter Template (middle), and filter configuration
(right) screens ................................................................................................................. 101
Template setup screen .................................................................................................. 102
Home screen .................................................................................................................. 103
Test Setup (left) and Camera Setup (right) screens ................................................... 107
Camera Setup screen (second page) ........................................................................... 108
Test screen — Camera enabled ................................................................................... 109
Collimation test coin — Side 1 .................................................................................... 110
Collimation test coin — Side 2 .................................................................................... 110
Test Setup (left) and Camera Setup (right) screens ................................................... 111
Collimator Setup screen ............................................................................................... 111
Collimator Setup screen — Cursor aligned with beam spot .................................. 112
Collimator Setup screen — Tap and drag ................................................................. 113
Collimator Setup screen — Cropped area defined .................................................. 113
Collimator Setup screen — Cropped/Uncropped views ........................................ 114
Setup (left) and password (right) screens — Input Panel ........................................ 115
Preference selection screen .......................................................................................... 116
Test screen — Averaging button and Average Live Setup dialog box .................. 116
Test screen — Live Averaging enabled ...................................................................... 117
Test screen — Current test selected ............................................................................ 118
Test screen — Live averaging results ......................................................................... 118
Results screen — Historical averaging available ...................................................... 119
Setup screen ................................................................................................................... 120
Results — Historical averaging selection and confirmation screens ..................... 120
Results screen — Historical average displayed ........................................................ 121
Setup screen and results — Historical selection screen ........................................... 121
Results — Historical selection screens ....................................................................... 122
Results screen — Batch average displayed ............................................................... 122
Test Setup (left) and Test (right) screens — Test 5 of 5 ............................................. 124
Results screen — Average of repeated tests .............................................................. 124
Trending graph .............................................................................................................. 125
Trending graph — Plot segment selected .................................................................. 126
List of Figures
159
103202-01EN, Rev. A, December 2012
Figure D-3
Figure D-4
Figure E-1
Figure E-2
Figure E-3
Figure E-4
160
Trending graph — Middle button menu ................................................................... 126
Trending graph — Magnified view ............................................................................ 127
Sample plot of XRF and assayed values for Cd ........................................................ 130
RoHS mode Select Beam screen .................................................................................. 132
Setting user factors ........................................................................................................ 132
Selecting user factor set model .................................................................................... 133
List of Figures
103202-01EN, Rev. A, December 2012
List of Tables
Table 1
Table 2
Table 3
Table 4
Table 5
Table 6
Table 7
Table 8
Table 9
Table 10
Table 11
Table 12
Table 13
Table 14
Table 15
Table 16
Table 17
Table 18
Table 19
Table 20
Table 21
Table 22
Table 23
Table 24
Table 25
Home screen button descriptions ....................................................................................... 5
Available Functions ............................................................................................................... 6
Exit screen options ............................................................................................................... 19
Default test times ................................................................................................................. 68
Other default parameters ................................................................................................... 68
Default list of exportable parameters ............................................................................... 96
Buttons and indicators ...................................................................................................... 103
User interface graphics ..................................................................................................... 105
Camera display selection .................................................................................................. 108
Sample table of XRF and assayed values for Cd ........................................................... 130
Grade definitions ............................................................................................................... 137
Example of screening limits for RoHS elements ........................................................... 138
Tramp library base alloys ................................................................................................. 142
Aluminum, cobalt alloys, and speciality grades ........................................................... 142
Copper and nickel alloys .................................................................................................. 144
Low-alloy and chrome-moly steels ................................................................................. 145
Stainless, Ti, and Tool steels ............................................................................................. 145
Aluminum, cobalt alloys, and speciality grades ........................................................... 146
Copper and nickel alloys .................................................................................................. 148
Low-alloy and chrome-moly steels ................................................................................. 149
Stainless, Ti, and Tool steels ............................................................................................. 149
Aluminums, cobalt alloys, and speciality grades ......................................................... 150
Copper and nickel alloys .................................................................................................. 152
Low-alloy and chrome-moly steels ................................................................................. 153
Stainless, Ti, and Tool steels ............................................................................................. 154
List of Tables
161
103202-01EN, Rev. A, December 2012
162
List of Tables
103202-01EN, Rev. A, December 2012
Index
A
abc button 104
action level, RoHS/WEEE mode 51
Admin Prefs function 6, 13, 105
Alloy Grade libraries 141
Factory Grade library
DELTA Classic, Classic Plus, and Inspector 142
DELTA Premium and Premium Plus 150
DELTA Standard and Professional 146
Tramp library 141
Alloy modes
Al mode 26
Alloy mode 21
Alloy Plus mode 21, 25
Au Karating 27
End Time Type 23
Mode Setup 21
Precious Metals mode 21
Smart Beam 24
SmartSort 25
test conditions 22
Test Setup screen 22
analyzer
calibration check 83
turning off 82
turning on 19, 81
averaging
historical averaging 119– 122
batch results 121
live averaging 115– 118
repeated tests with averaging 123
Averaging button 105
B
Back button 104
barometer 10
battery status indicator 105
Bluetooth® enabled printer 7, 15
Bluetooth® GPS 6
buttons, control
OK 104
Power OFF 19, 105
Restart 19, 105
buttons, display
abc 104
Back 104
Camera 104
Display Keyboard 104
Info 105
Live Video 104
Maximize Display 104
Minimize Display 104
Spectral Plot 92, 104
Trending 105
Zoom/Unzoom 105
buttons, function
Admin Prefs (administrative preferences) 6, 105
Blue T GPS (Bluetooth GPS) 6
Date Time 6
Exit 7, 104
Factory (factory settings) 6
Printer 7
Trigger HW (trigger hardware) 6, 7
Users 7
buttons, Home screen
Home 103
Mode 5, 104
Results 5, 104
Setup 6, 103
Test 5
buttons, printing
Print 104
Print to Bluetooth 105
Printer 94
buttons, results
Averaging 105
Calendar 104
Chemistry 104
Export 94, 105
Results 5, 104
buttons, setup
Cal Check 104
Setup 6, 103
Tools 104
buttons, testing
Select Test 105
Start Test 104
Stop Test 104
Test 5, 104
Test Selected 105
Index
163
103202-01EN, Rev. A, December 2012
Test/Tools 104
C
Cal Check button 104
Calendar button 104
calibration check (Cal Check)
conducting 84
Troubleshooting 86
camera
live view 108
saved image view 108
setup 107
Camera button 104
check, calibration See calibration check (Cal Check)
Chemistry button 104
collimator 109
beam spot diameter 110
collimation test coin 109
cropping 112
set up 109
Consumer mode, sample presentation 90
Consumer Safety mode
End Time Type 50
force classification 57
test setup 49
customize display 75
D
date and time 6
deadman trigger 9
Display Keyboard button 104
dose limit 11
Dust Wipe mode
End Time Type 62
test setup 61
user factors 63
E
element suite display 78
End Time Type
Alloy modes 23
Consumer Safety and RoHS/WEEE modes 50
Soil, Mining, and Geochem modes 44
Thin modes 62
Exit button 7, 104
exit screen 18
Export button 94, 105
F
factory settings 6
Filter Analysis mode
End Time Type 62
test setup 61
user factors 63
force classification
Consumer Safety mode 57
Hal Free mode 57
RoHS/WEEE mode 57
164
Index
function buttons
Admin Prefs (administrative preferences) 6, 105
Blue T GPS (Bluetooth GPS) 6
Date Time 6
Exit 7, 104
Factory (factory settings) 6
Printer 7
Trigger HW (trigger hardware) 6, 7
Users 7
G
Geochem
End Time Type 44
Packaging Directive 46
test setup 43
user factors 45
GPS location data 12
GPS, Bluetooth 6
Grade libraries, Alloy 141
Factory Grade library
DELTA Classic, Classic Plus, and Inspector 142
DELTA Premium and Premium Plus 150
DELTA Standard and Professional 146
Tramp library 141
graphic elements
buttons 103
Home screen 103
indicators 103
H
Hal Free mode
End Time Type 50
force classification 57
test setup 49
hardware, trigger 6, 7
historical averaging 119– 122
batch results 121
Home button 103
Home screen 5
I
IEC settings, RoHS/WEEE mode 52
indicators
battery status 105
error message 105
Lock 104
system message 105
Unlock 104
Info button 105
L
Lead Paint mode
End Time Type 62
Lead Paint (test end condition) 64
test setup 61
user factors 63
libraries, Alloy Grade 141
Factory Grade library
103202-01EN, Rev. A, December 2012
DELTA Classic, Classic Plus, and Inspector 142
DELTA Premium and Premium Plus 150
DELTA Standard and Professional 146
Tramp library 141
Library Manager 27– 40
Edit Library screen 32
Factory Grade library 27
fundamental parameters algorithm 30
grade libraries 31, 32– 38
grade match message 32, 34
match number 30
match settings 28– 31
Min/Max screen 33
nSigma value 30
Pass/Fail Sel Grade screen 38
Select Grade screen 32, 34
Smart Grade 33
Live Video button 104
Lock indicator 104
M
Mining mode
End Time Type 44
Packaging Directive 46
sample presentation 89
test setup 43
user factors 45
Mining Plus mode
End Time Type 44
Packaging Directive 46
test setup 43
user factors 45
Mode button 5, 104
Mode Setup screen 67
Alloy modes 21
modes
Alloy 21
Alloy Plus 21
Consumer Safety 49
Dust Wipe 61
Filter Analysis 61
Geochem 43
Hal Free 49
Lead Paint 61
Mining 43
Mining Plus 43
Precious Metals 21
RoHS/WEEE 49
Soil 43
N
notes
Cal Check fails repeatedly 86
editable libraries 141
sample measurement through the window 89
notices, safety
warnings 111, 117, 123
avoid potential radiation exposure 81, 87
O
Olympus technical support 3
P
Packaging Directive
Geochem mode 46
Mining Mode 46
Mining Plus mode 46
Soil mode 46
plate alert 21
power off 82
Power OFF button 19, 105
power on 19, 81
Precious Metals mode, plate alert 21
preferences, administrative 6, 105
Print button 104
printer
Bluetooth enabled 7, 15
pairing 15
Printer button 7, 94
R
reset test conditions 67
Restart button 19, 105
Results
calendar 91
exporting 94– 99
horizontal scroll bar 92
results filters 100
scroll bar 92
trending 99– 127
trending graph 125, 126, 127
Results button 5, 104
RoHS/WEEE mode
background 135
element range/limits 138
End Time Type 50
force classification 57
grade definitions for screening 137
IEC requirements 136
important issues 137
RoHS Mode Settings 51
set end condition 56
software overview 136
Surface Pb parameters 56
test setup 49
user factors 58
S
safety
signal words 2
symbols 1
sample presentation
Consumer mode 90
Mining mode 89
scroll bar, horizontal 92
Index
165
103202-01EN, Rev. A, December 2012
Select Test button 105
settings, factory 6
Setup button 6, 103
Smart Beam 24
Soil mode
End Time Type 44
Packaging Directive 46
test setup 43
user factors 45
Start Test button 104
status bars 105
Stop Test button 104
support information 3
system-wide setup 6
T
technical support 3
test 81
best practices 88
conducting 86
tips 88
Test button 5, 104
test conditions
Alloy modes 22
Consumer Safety and RoHS/WEEE modes 49
reset test conditions 67
Soil, Mining, and Geochem modes 43
test labels 69
Test Selected button 105
test setup
Alloy modes 21
Consumer Safety and RoHS/WEEE modes 49
Dust Wipe mode 61
Filter Analysis mode 61
Geochem mode 43
Hal Free mode 49
Lead Paint mode 61
Mining mode 43
Mining Plus mode 43
RoHS/WEEE mode 49
Soil mode 43
Soil, Mining, and Geochem modes 43
Thin mode 61
test time
166
Index
analysis goals 140
background 139
issues 139
Test/Tools button 104
Thin modes, test setup 61
time and date 6
Tools button 104
Trending button 105
trigger hardware 6, 7
trigger settings 8
turn off 82
turn on 19
U
universal mode settings 67
Unlock indicator 104
user defined settings, RoHS/WEEE mode 53
user factors
applicable modes 129
applying user factor set model 133
Consumer Safety and RoHS/WEEE modes 58
creating 132
definition 129
determining correction factors 133
Dust Wipe mode 63
example 130
factors and offsets 129
Filter Analysis mode 63
Geochem mode 45
Lead Paint mode 63
Mining Plus mode 45
purpose 129
RoHS/WEEE mode 58
Soil mode 45
thin modes 63
user privileges 17
Users button 7
W
warranty information 3
Z
Zoom/Unzoom button 105