1
Software
PHOTOMOD 4.4
Module
PHOTOMOD GeoMosaic
USER
MANUAL
Racurs, Moscow, 2009
1. General info........................................................................................................................................ 4
2. Installation, starting and uninstall of PHOTOMOD GeoMosaic .................................................... 4
3. Operating systems ............................................................................................................................ 5
4. Protection........................................................................................................................................... 5
5. Recommended procedure of mosaic building ............................................................................... 5
6. Main program menu .......................................................................................................................... 7
6.1. Project........................................................................................................................................... 7
6.2. Images .......................................................................................................................................... 8
6.3. View .............................................................................................................................................. 9
6.4. Regions of Interest ....................................................................................................................... 9
6.5. Mosaic ........................................................................................................................................ 10
6.6. Service........................................................................................................................................ 10
6.7. Block scheme ............................................................................................................................. 13
6.8. Window ....................................................................................................................................... 13
6.9. Help ............................................................................................................................................ 13
7. Working with a single image .......................................................................................................... 13
7.1. Loading images .......................................................................................................................... 13
7.1.1. Space borne images adding................................................................................................................ 14
7.1.1.1. Image radiometric correction ........................................................................................................................ 17
7.1.1.2. Scanner imagery formats .............................................................................................................................. 22
7.2. Creating Regions of Interest....................................................................................................... 24
7.2.1. Regions of Interest by default ............................................................................................................. 24
7.2.2. Cutlines creating rules ....................................................................................................................... 25
7.2.3. Creating and editing Regions of Interest............................................................................................ 25
7.2.4. Tie points search and edit .................................................................................................................. 27
7.2.5. Regions of Interest import and export ................................................................................................ 30
7.3. Single image window.................................................................................................................. 32
7.4. Raster image georeferencing ..................................................................................................... 33
7.5. Images referencing..................................................................................................................... 36
8. Parameters and preferences .......................................................................................................... 39
8.1. Mosaic ........................................................................................................................................ 39
8.2. Brightness adjustment ................................................................................................................ 41
8.2.1. Global brightness adjustment............................................................................................................. 41
8.2.2. Local brightness adjustment............................................................................................................... 42
8.2.3. Building strips .................................................................................................................................... 45
8.2.4. Additional recommendations.............................................................................................................. 45
8.3. Splitting into sheets .................................................................................................................... 47
8.4. Preferences ................................................................................................................................ 48
9. Mosaic preview ................................................................................................................................ 50
10. Splitting mosaic into map sheets ................................................................................................ 52
10.1. Splitting parameters.................................................................................................................. 54
10.2. Splitting preview ....................................................................................................................... 56
10.3. Sheet file names....................................................................................................................... 58
10.4. Loading sheet coordinates from the text file ............................................................................ 58
11. Building mosaic............................................................................................................................. 60
11.1. Building and viewing mosaic .................................................................................................... 60
11.2. Building mosaic for the block fragment .................................................................................... 63
11.3. Mosaic editing in Dust Correct application ............................................................................... 63
11.4. Measurements over mosaic ..................................................................................................... 66
11.5. Loading mosaic ........................................................................................................................ 66
11.6. Creating marginalia for mosaic................................................................................................. 66
PHOTOMOD GeoMosaic 4.4
12. Export of mosaic to PHOTOMOD VectOr.................................................................................... 67
13. Pan sharpening operation ............................................................................................................ 67
13.1. Color balancing of output image............................................................................................... 70
14. Coordinate system transformation.............................................................................................. 77
15. Georeference file ........................................................................................................................... 78
15.1. PHOTOMOD Geo file ............................................................................................................... 79
15.2. Arc World file ............................................................................................................................ 79
15.3. MapInfo file ............................................................................................................................... 79
16. Coordinate systems ...................................................................................................................... 80
16.1. Selecting coordinate system .................................................................................................... 80
16.2. Coordinate system database.................................................................................................... 80
16.3. Types of coordinate systems.................................................................................................... 81
16.4. Coordinate system editing........................................................................................................ 82
16.5. Coordinate system creating...................................................................................................... 82
17. Geodetic calculator ....................................................................................................................... 85
18. PHOTOMOD MSTiff Maker utility ................................................................................................. 89
19. PHOTOMOD ImageProcessor ...................................................................................................... 90
19.1. Menu commands ...................................................................................................................... 90
19.2. Image zooming tools ................................................................................................................ 91
19.3. Work in application ................................................................................................................... 92
19.3.1. Radiometric correction..................................................................................................................... 92
19.3.2. Geometric transformations............................................................................................................... 92
19.3.3. Batch processing .............................................................................................................................. 94
19.3.3.1. Batch processing setup................................................................................................................................ 95
19.3.4. Operations with image fragment ...................................................................................................... 96
19.3.5. Image printing .................................................................................................................................. 97
19.3.6. Image saving .................................................................................................................................... 97
3
RACURS Co., Ul. Yaroslavskaya, 13-A, office 15, 129366, Moscow, Russia
July 2009
1. General info
Program PHOTOMOD GeoMosaic is used for creating mosaic from initial images. Images to
be included into mosaic must be georeferenced. Nevertheless you can merge nongeoreferenced images using ground control points' coordinates if necessary. The output
mosaic may be also split into quadrangle sheets specified by user.
Created mosaic is referenced to selected coordinate system and has a cell size defined by
user. Tools of brightness adjustment and creation of regions of interest (ROI) – fragments
of each source image included to the output mosaic, are also available. Borders of regions of
interest are named cutlines.
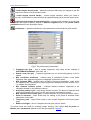
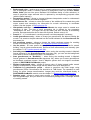
2. Installation, starting and uninstall of PHOTOMOD GeoMosaic
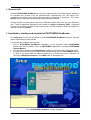
Use setup.exe file from the CD-ROM to install PHOTOMOD GeoMosaic module. The disk
space requirement is about 50 MB.
You should also consider the following:
• prior to PHOTOMOD GeoMosaic installation on the computer where PHOTOMOD
system has been installed, close all PHOTOMOD applications including PHOTOMOD
System Monitor
• you should be registered as Administrator if working in Windows NT or Windows 2000
• the hard lock key drivers are installed automatically along with the PHOTOMOD system.
In case of any errors with the system protection try to install key drivers “manually” by
running of HASPUsersetup.exe from HASP folder in distribution kit.
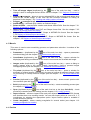
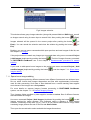
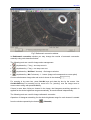
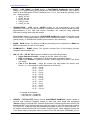
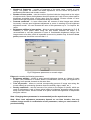
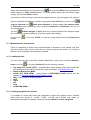
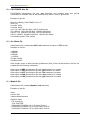
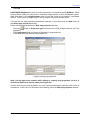
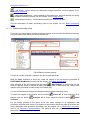
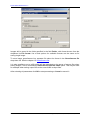
Fig.1 PHOTOMOD GeoMosaic system installation
©2009
4
PHOTOMOD GeoMosaic 4.4
All setup stages are indicating in left (deep blue) small window with brief instructions in
yellow window Installation help (Fig.1). You should follow the instructions and pass through
all the stages.
PHOTOMOD GeoMosaic is standalone program and is launched from menu Start |
Programs | PHOTOMOD GeoMosaic or by pushing the icon
on Windows Desktop.
, created after installation
To uninstall PHOTOMOD GeoMosaic system from your computer, use the command Start |
Programs | PHOTOMOD GeoMosaic | Uninstall or the standard remove programs
procedure from OS Windows Control Panel.
3. Operating systems
PHOTOMOD system works under OS Windows 2000 and OS Windows XP operating
systems.
4. Protection
PHOTOMOD GeoMosaic system is protected by HASP hard lock key from Aladdin Co. The
hard lock key drivers are installed automatically along with PHOTOMOD GeoMosaic
module. In case of any errors with the system protection try to install key drivers “manually”
by running HASPUsersetup.exe from HASP folder in distribution kit.
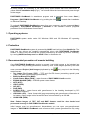
5. Recommended procedure of mosaic building
Once PHOTOMOD GeoMosaic module is opened, load initial images to be included into
output mosaic using building parameters, chosen by user. Initial images opened by the main
menu command Project | Add images (duplicated by the
icon), may be in the following
raster formats:
• Tag Image File Format (TIFF) – TIFF and GeoTiff format (containing special parts
(“tags”) for raster georeferencing information)
• Windows Bitmap File (BMP)
• VectOr Raster Maps (RSW) – raster formats of PHOTOMOD VectOr module
• ERDAS IMAGINE (IMG) – ERDAS system raster format
• NITF (NITF)
• JPEG (JPEG)
• GIF (GIF)
• PNG (PNG)
• PCIDSK (PIX) – raster format with georeference in the heading developed by PCI
Geomatics company
• JPEG2000 (JP2) – raster format with jpeg-compressing and georeference information in
its header, output image in this format will have volume limited up to 500 Mb
• USGS DEM (DEM).
Note. Palette images of TIFF, GIF and BMP formats could be also loaded and
processed correctly in PHOTOMOD GeoMosaic module
Initial images must be georeferenced. Nevertheless you can open non-georeferenced
images in PHOTOMOD GeoMosaic and reference them (create georeference file) using
5
RACURS Co., Ul. Yaroslavskaya, 13-A, office 15, 129366, Moscow, Russia
July 2009
ground control points, in image georeference window, see the chapter 7.4 Raster image
georeferencing.
Prior to mosaic creation you should specify mosaicking parameters in Parameters window
or selecting menu command Mosaic | Parameters, see the
opened by pushing the icon
chapter 8 Parameters and preferences.
In the same window (opened by menu command Mosaic | Parameters) on Mosaic tab you
can set the parameters of the mosaic file compression (if necessary), as well as background
color and georeference file type. After pushing the Scale button, an additional panel is
opened allowing you to input the scale of resulting mosaic (by filling in the Scale field) and
also to recalculate its size and resolution (see the chapter 8.1 Mosaic).
Since the initial images of the block have considerable brightness and color differences, an
additional processing is required to obtain visually continual mosaic. Set global and local
brightness adjustment parameters on Brightness adjustment tabbed page in Parameters
window to perform such processing. If the neighbor images of the block differ in brightness
and color, use the option By average brightness for global adjustment.
The local adjustment improves the brightness inside each image. In most cases it is also
recommended to use the option Seams feathering for brightness differences adjustment on
merging edges of the images (see the chapter 8.2 Brightness adjustment).
Create regions of interest (ROI) on the initial images, according to the rules described in the
chapter 7.2.2 Cutlines creating rules. On this stage you can also set the order (“upper-lower”)
of images supposed to be included to the resulting mosaic.
Build mosaic preview (see the chapter 9 Mosaic preview) to estimate resulting image quality,
correct building parameters if necessary.
If brightness and color differences are not properly adjusted and are visible on preview, you
have to change local adjustment parameters and global adjustment type. You can also
change cutlines close to unsatisfactory parts of image to improve the local adjustment. All
these efforts lead to the required brightness quality.
If you would like to split the resulting mosaic into sheets, check the option Regular splitting
on Split into sheets tab and set sheets boundaries (south and west) and size in Splitting
parameters window opened by pushing the Parameters button on the same tab (see the
chapter 10 Splitting mosaic into map sheets). After pushing the Apply button sheets number
is calculated automatically. You can correct this number if needed and close Splitting
parameters window and also Parameters window by OK button.
After that start mosaic creation with preset parameters. See the chapter 11 Building mosaic.
©2009
6
PHOTOMOD GeoMosaic 4.4
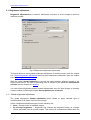
6. Main program menu
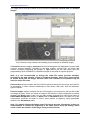
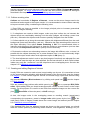
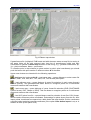
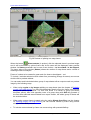
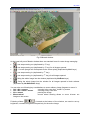
After starting, PHOTOMOD GeoMosaic opens a window (Fig.2) with a main menu in its
upper part.
Fig.2 PHOTOMOD GeoMosaic user interface
The main PHOTOMOD GeoMosaic menu consists of the following items:
6.1. Project
This menu is used to work with Mosaic project, which stores all settings such as brightness,
contrast and gamma of images, regions of interest and parameter values. Project menu
consists of the following options:
• New – allows to restore all preview and mosaic building settings into initial ones without
module exit, that allows to create new Mosaic project
•
Open (duplicated by the
icon of the main icon bar) – opens a window for selecting
file (with MOS extension) with mosaic project for loading
•
Save (duplicated by the
icon of the main icon bar) – saves mosaic project with the
same name and MOS extension
Save as – opens a window for selecting file name (with MOS extension) for mosaic
project saving with name different from initial
•
•
icon of the main icon bar) – opens a window for
Add images (duplicated by the
selecting source images to be included to the mosaic project, see the chapter 7 Working
with a single image). Use standard OS Windows tools (Shift and Ctrl keys) in this
7
RACURS Co., Ul. Yaroslavskaya, 13-A, office 15, 129366, Moscow, Russia
July 2009
window for group selection of images to be added. The list of images formats processed
in PHOTOMOD GeoMosaic module see in the chapter 5 Recommended procedure of
mosaic building
•
Add satellite images (duplicated by the
icon of the main icon bar) – allows to
select the initial space borne images to be added to PHOTOMOD GeoMosaic project.
See the chapter 7.1.1 Satellite images adding
•
Remove images (duplicated by the
icon of the main icon bar) – opens a window
with list of the current project images, to remove selected images from the project. Use
standard OS Windows tools (Shift and Ctrl keys) in this window for group selection of
images to be removed. Search of the image in the list by its name is also available
Import vectors – allows to select and import vector objects in DXF, DGN and Shape
formats to GeoMosaic project
•
•
Exit (duplicated by the
PHOTOMOD GeoMosaic.
icon of the main icon bar or hot keys Ctrl-X) – exits
6.2. Images
Images menu is used to load source images to PHOTOMOD GeoMosaic and includes the
following options:
•
Open (duplicated by the
icon of the main icon bar or hot keys Ctrl-O) – opens a
window of the source rasters for selection and loading a single image which is already
existing in the list of images of the current project (see the chapter 7 Working with a
single image). While loading rasters (basically for ROI creation and editing) you can open
unlimited number of windows. Use standard OS Windows tools (pressed Shift or Ctrl
keys) for the group selection of source image files
•
icon of the main icon bar or hot keys Ctrl-N) – loads
Next image (duplicated by the
the next image of the source block to the current window
•
Previous image (duplicated by the
icon of the main icon bar or hot keys Ctrl-P) –
loads the previous image of the source block to the current window
Background color option - allows you to set the background color of the original images,
containing non-informative data like the background with a constant value of brightness
and color. To manually set the background color for these images, you should select
Images | background color | Set color, which opens the Background color window.
•
In case a window with one of the source images is open, it is possible to set the color for that
image only. Also it is possible to set the background color for all images in the mosaic
project.
In case the background is concentrated at the edges of images (for example, due to rotated
raster), it possible to automatically define it for each of the images. In order to do it, you
should check the Images |Background color | Automatically option.
©2009
8
PHOTOMOD GeoMosaic 4.4
If it is necessary to cancel selection of background for one or all images it is necessary to
check the Images |Background color | None option, which opens the Background color
window.
In order to make the specified background color transparent, you should use menu command
Images | Background color| Transparent background when building mosaic
6.3. View
This menu is intended to setup the image view in active window or in all windows. At that
there are the following options:
• Hide all – un-visualize all objects
•
•
•
•
•
•
•
or Alt-Z hot keys) – turns on/off regions of interest
ROIs (duplicated by the icon
(ROI’s): all or user defined
Cutlines – turns on/off cutlines on the image (ROI’s borders) to be merged into resulting
mosaic (see the chapter 7.2.2 Cutlines creating rules)
Tie points (duplicated by the icon
) – hides/shows tie points on images and on
preview and resulting mosaic, if ties were created in appropriate window, see the chapter
7.2.4 Tie points search and edit
Local adjustment – in preview or mosaic window turns on/off small rectangles marking
the places for local brightness adjustment statistics (see the chapter 8.2.2 Local
brightness adjustment)
) – turns on/off borders of sheets in preview
Sheets extents (duplicated by the icon
or mosaic window, if output mosaic is divided into map sheets, and the appropriate option
is marked in Preferences window (see the chapter 8.3 Splitting into sheets)
Vectors - turns on/off the display of vector objects
Show in all windows – turns on/off all abovementioned objects in all windows: source
images, preview and mosaic.
6.4. Regions of Interest
This menu is used to create regions of interest (ROI) – see the chapter 7.2 Creating regions
of interest. ROIs are fragments of each source image to be included to the output mosaic.
The menu includes the following items:
•
icon of the main icon bar) – opens an additional
ROIs editor (duplicated by the
button bar, intended for creating and editing of Regions of interest. See the chapter
7.2.3 Creating and editing regions of interest
9
RACURS Co., Ul. Yaroslavskaya, 13-A, office 15, 129366, Moscow, Russia
July 2009
•
•
•
•
•
•
•
•
Trim off images edges (duplicated by the
icon of the main icon bar) – used to
change a size of rectangular default ROIs. See the chapter 7.2.1 Regions of interest by
default.
Polygon ⇔ rectangle – allows to convert selected ROI to the rectangle and delete other
ROIs on the current image. In this case the ROI becomes available for editing as
described in the chapter 7.2.3 Creating and editing regions of interest
Polygon ⇔ rectangle for all – the same operation for all images
Autobuilding – automatic ROI creation on selected image
Delete all ROIs – cancels ROIs creation and shows default ROIs. See the chapter 7.2.1
Regions of interest by default.
Import ROIs – ROIs import from DXF and Shape format files. See the chapter 7.2.5
Regions of interest import and export
Export ROIs – ROIs export into DXF, Shape or MIF/MID file format. See the chapter
7.2.5 Regions of interest import and export
Export cutlines – cutlines export into DXF, Shape or MIF/MID file format. See the
chapter 7.2.5 Regions of interest import and export.
6.5. Mosaic
This menu is used to start mosaicking process and parameters selection. It consists of the
following options:
•
icon of the main icon bar) – opens a parameters
Parameters… (duplicated by the
selection dialog (see the chapter 8 Parameters and preferences)
•
icon of the main icon bar) – opens a window for
Coordinates (duplicated by the
displaying and editing coordinates of the mosaic corners and also its width and length
•
icon of the main icon bar) – opens a dialog to
Images order (duplicated by the
specify images order in the output mosaic (upper-lower). Used to process images
overlapping areas (see the chapter 8.2.4 Additional recommendations)
•
icon of the main icon bar) – opens a window for
Tie points (duplicated by the
automatic or manual search of tie points in the area of cutlines on adjacent images. Used
for processing of overlap areas on images (see the chapter 7.2.4 Tie points search and
edit)
•
icon of the main icon bar) – shows mosaic preview with
Preview (duplicated by the
low resolution (see the chapter 9 Mosaic preview)
•
icon of the main icon bar) – starts mosaicking process (see
Build (duplicated by the
the chapter 11 Building mosaic)
•
Open (duplicated by the
icon of the main icon bar or hot keys Ctrl-Alt-O) – loads
previously created mosaic for viewing (see the chapter 11.5 Loading mosaic).
Import vectors – allows to import linear and point objects from DXF and ASCII formats
and visualize them over resulting mosaic. You can also import points as a set of X, Y, Z
coordinates, by selecting the appropriate option. Import vectors option is available if
mosaic window is opened.
Create marginalia - allows creating marginalia for several scales (see chapter 11.6
Creating marginalia for mosaic)
•
•
6.6. Service
©2009
10
PHOTOMOD GeoMosaic 4.4
Service menu consists of the following items:
•
icon of the main icon bar). Used to set colors for
Colors (duplicated by the
displaying such objects as cutlines, selected ROI, and other objects.
•
icon of the main icon bar). Opens system
Preferences (duplicated by the
preferences dialog (see the chapter 8.4 System preferences).
•
icon of the main icon bar or hot keys
Show regulation panel (duplicated by the
Ctrl-T) – shows/hides lower panel with sliders for brightness/contrast/gamma corrections.
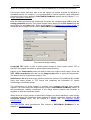
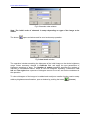
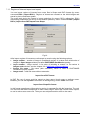
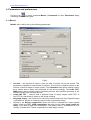
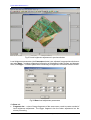
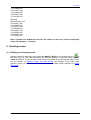
Print window – allows to print any active module window with pre-setting of print options:
•
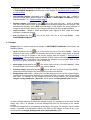
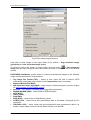
Fig.3 Printing options setting
•
Left part of this window allows to set up printing options: paper sheet fields, printer
selecting and its settings (using the Options button), and also input the title of printed
image in the appropriate field. You can preview all these settings in preview window in
the right part of the window.
Print map – allows to print any active window of the module with pre-setting of print
options and splitting the image into sheets.
•
Execute PHOTOMOD Dust Correct (duplicated by the
icon of the main icon bar) –
opens a window intended for cleaning mosaic image from artifacts, see the chapter 11.3
Mosaic editing in Dust Correct application.
•
Raster georeference (duplicated by the
icon of the main icon bar) – opens a
window used for raster image georeferencing, see the chapter 7.4 Raster image
georeferencing.
•
Images referencing (duplicated by the
icon of the main icon bar) – opens a window
used to link raster images to each other, see the chapter 7.5 Images referencing.
Delete multiscale images – deletes pyramidal images (files with *.pyr extension) from
folder containing mosaic project, if they were created during images opening or later by
the command Create multiscale images.
Create multiscale images – creates pyramidal images (files with *.pyr extension), which
are used to speed up the project load. The target folder where the pyramided images are
saved, is indicated on Images tab in Preferences window, see the chapter 8.4
Preferences.
Pan sharpening – opens a window used for merging of two images, one of which is
black-and-white with high resolution and another one – color with less resolution. The
•
•
•
11
RACURS Co., Ul. Yaroslavskaya, 13-A, office 15, 129366, Moscow, Russia
July 2009
•
•
resulting image is color with high resolution, see the chapter 13 Pan sharpening
operation.
Image processor – opens a window used for radiometric correction and geometric
transformations of raster images or their fragments, and also includes saving and printing
options, see the chapter 19 PHOTOMOD ImageProcessor.
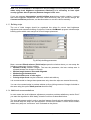
Sheet list – opens a window used for creation of list of map sheets the scanned
topographic map to be split to. To get started, open a scanned georefereced image
containing sheet borders as raster images. Then use Service | Sheet list to set sheet
sizes.
To add another sheet to the list, you must double-click the left mouse button in the center of
the sheet alleged. A window will appear to specify sheet title.
After setting name and clicking OK, sheet will be added to the end of the list.
To remove the sheet should select any cell in line with the sheet and click Delete sheet. For
the complete list of clean sheets, click Clear and confirm clean-up in a warning dialog.
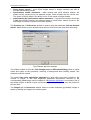
To save sheets as CSV click Save button. If X <-> Y option is enabled, X and Y coordinates
of sheet edges are swapped. You may wish to generate a list of pages in leftist coordinate
systems (such as CS-42).
Add button - is intended to add pieces from CSV-file without removing existing ones.
Open button preliminarily removes existing sheets and then loads the contents of this file.
With X <-> Y option enabled the coordinates of X, Y of sheet borders are swapped while
loading.
Quite often the scheme of dividing into sheets of larger scale contains sheets of smaller
scale, divided into four parts. Used as a root of name is the name of a sheet with smaller
scale with additional suffix. For example, sheet "623-A" of scale 1:5000 is divided into four
sheets of scale 1:2000: "623-A-a", "623-A-b", "623-A-c", "623-A-d". To automate such
©2009
12
PHOTOMOD GeoMosaic 4.4
division use button Split into 4 sheets. After clicking it you are prompted to select a file to
use for saving sheets of larger scale into and then - to save a new list.
Also implemented is operation of merging four sheets for moving to smaller scale (button
Merge 4 sheets). By doing so, four neighbouring sheets are merged to one, and the title is
cut to remove the last nomenclature letter.
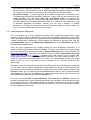
6.7. Block scheme
•
•
•
Show (duplicated by the
icon of the main icon bar) – opens a block scheme on the
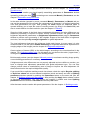
screen (see the Fig.2). The number of images to be displayed is defined in Service |
Preferences | Windows panel (see the chapter 8.4 Preferences). The block scheme is
used for adding regions of interest (see the chapter 7.2 Creating regions of interest) since
it is convenient to see the ROI not only on the current image but also on its neighbors.
Build strips – allows to arrange a set of initial images into strips, see the chapter 8.2.3
Building strips
Up (Ctrl-Alt-Up hot keys), down (Ctrl-Alt-Down hot keys), left (Ctrl-Alt-Left hot keys),
right (Ctrl-Alt-Right hot keys) – used to load corresponding adjacent scheme portions.
The overlap of the current and loading portions of the block scheme is setup in the
Service | Preferences | Windows dialog (see the chapter 8.4 Preferences).
6.8. Window
Window menu is used to locate windows on the screen and includes the following options:
• Cascade
• Tile vertically
• Tile horizontally
• Minimize all
• Close – closes active window with current image
• Close all – closes all windows.
6.9. Help
Includes the following items:
• Contents (or F1 key) – runs Help system for PHOTOMOD GeoMosaic module.
• About program… – opens a window with information related to version number, serial
number, date of version compiling, etc.
7. Working with a single image
7.1. Loading images
The initial images are added to the current project using menu command Images | Open
icon of the main icon bar or by Ctrl-O shortcut), which opens a
(duplicated by the
window for images selection:
13
RACURS Co., Ul. Yaroslavskaya, 13-A, office 15, 129366, Moscow, Russia
July 2009
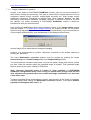
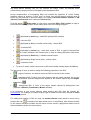
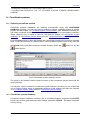
Fig.4 Images selection
This window allows group images selection (along with pressed Ctrl and Shift keys), as well
as images search using its name input to search field, after pushing the button
(Find).
Images selected will be opened in the current project after pushing the button
(or
Enter). You can cancel the selection and close the window by pushing the button
Esc).
(or
Besides, you can use menu commands which open previous and next images of this list, see
the chapter 6.2 Images.
If the project does not contain any images you must add them using menu command Project
| Add images (duplicated by pushing the button
). The list of images formats, processed
in PHOTOMOD GeoMosaic see in the chapter 5 Recommended procedure of mosaic
building.
If you need to add space borne images to the project use menu command Project | Add
satellite images (duplicated by pushing the button
images adding.
), see the chapter 7.1.1 Space borne
7.1.1. Space borne images adding
Scanner images acquired by different sensors have different formats and are delivered as a
file set, which include both images themselves and files with supplementary information,
used for their processing. Such sets of files obtained from a remote sensing data supplier
and relevant to the images are called product.
For more details on scanner imagery formats processing in PHOTOMOD GeoMosaic
system, see the chapter 7.1.1.2 Scanner imagery formats.
Thus, imagery folder provided by data supplier contains metadata files of different formats,
associated with the images.
) to add
Use menu command Project | Add images (duplicated by pushing the button
images acquired by space sensors. The command opens a dialogue of initial images
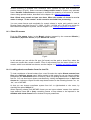
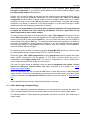
selection, consisting of two tabs (Fig.5). First of all you should select source image folder
containing image product files set on the first tab Select folder.
Then open the second tab to select and add the images themselves.
©2009
14
PHOTOMOD GeoMosaic 4.4
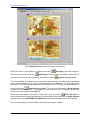
The upper part of this tab consists of three windows: Products, Product files and Product
images.
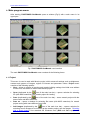
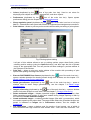
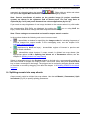
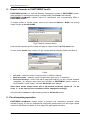
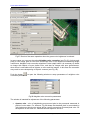
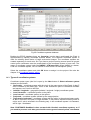
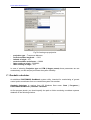
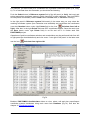
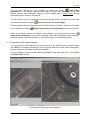
Fig.5 Scanner image selection and adding (by the example of IKONOS image)
In Products window imagery products and their following data are displayed in proper table
columns: product identifier, provided by the data supplier, product type, its format and
number of images composing the product. In Type column you can see sensor type and
preprocessing level of IKONOS or QuickBird images for any kind of scanner projects.
Note. It is not recommended to change the initial file names (product identifier,
provided by the data supplier, shown in Products window), since it may cause failure
of further work with the image, because other files relevant to this product may be
linked to initial file name
Product files window contains the list of all files delivered along with the image and used for
its processing. In table columns additionally to files names, their path, size and extension
type are shown.
Product images window contains the list of all images in the product as well as their width
and height in pixels. When you select an image in this window, it will be displayed in preview
window if the Show option is on. You can also change selected file’s name (inner name in
PHOTOMOD GeoMosaic module) in Name field of Parameters panel, and also set up the
compression coefficient for raster or invert it (from positive to negative), using appropriate
options in the Parameters panel.
Note. You should change the image name if its length exceeds 32 symbols, at that it is
recommended to remove the beginning of the name and to leave the ending, which
could contain the number of the image in the product files set
15
RACURS Co., Ul. Yaroslavskaya, 13-A, office 15, 129366, Moscow, Russia
July 2009
When all necessary images are selected, push the Add button to complete the procedure.
If the source raster has more than 8 bits per sample (in images acquired by IKONOS or
QuickBird sensors for instance), it is recommended to perform dynamic range adjustment
procedure before image adding to PHOTOMOD GeoMosaic project (see the chapter 7.1.1.1
Image radiometric correction).
After the adding procedure and radiometric correction are completed push OK to open the
Saving parameters window. Then select images saving format (in the File format field) and
target folder (in the Folder field). Refer to the chapter 11.1 Building and viewing mosaic for
the details about images formats used in PHOTOMOD GeoMosaic.
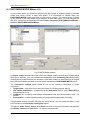
Fig.6 Scanner images adding
Create MS TIFF option is used to build pyramid image of output mosaic inside TIFF or
GeoTIFF file created, that allows to speed up the image zooming.
Options in the Compression panel are used to reduce the output mosaic image. Check the
TIFF, JPEG compression box and use the Image quality slider to apply the compression.
The default value of compression quality is 75%.
Georeference file drop-down menu allows to select the format of the additional file created
along with output mosaic in TIFF format and containing the information for mosaic
referencing to coordinate system.
The georeference of space images is acquired from metadata delivered from product
supplier. It is saved along with added scanner image in PHOTOMOD GeoMosaic format. At
that georeference contains coordinates of the image corners (latitude and longitude in
degrees) in WGS-84 coordinate system.
When saving an output mosaic of space borne images you should transform it from lat/long
coordinate system into coordinate system selected in mosaic parameters window in the Set
coordinate system panel, see the chapter 8.1 Mosaic and 14 Coordinate system
transformation.
See more details about georeference files formats in PHOTOMOD GeoMosaic in the
chapter 15 Georeference file.
©2009
16
PHOTOMOD GeoMosaic 4.4
7.1.1.1. Image radiometric correction
Images, to be added to PHOTOMOD GeoMosaic module, often are not tuned enough for
their comfort viewing and processing. This may be caused by the optical features of survey
equipment, radiant energy converter, analog-digital converter, etc. Such images require
preliminary radiometric processing to improve their visual features. Besides, the data
acquired by some sensors (IKONOS, QuickBird, Cartosat), is supplied in format of 10-12-bit
per channel. For further processing in PHOTOMOD GeoMosaic module it should be
transferred to 8-bit per channel format.
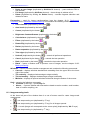
After pushing the Add button while image selection process in the Image adding window
(see the chapter 7.1.1 Space borne images adding), the system will ask you to perform
dynamic range adjustment procedure of selected image automatically. If you would not like to
correct images radiometrically, push the No button in the dialogue shown below:
and the image will be added without histogram changing.
However it is recommended to perform radiometric correction in the window opened by
pushing the Yes button.
The same Radiometric correction window could be opened by pushing the button
Preprocessing in the Product images field in the Images adding window.
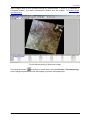
The window title bar contains image name, its pixel size (width, height) and number of bites
per pixel. While the window opens the pyramidal image is building. That pyramidal image
helps to speed up the raster viewing in 2D window.
Note. Temporal pyramidal image is created in Temp subfolder of PHOTOMOD
GeoMosaic configuration folder. That is why you should have enough room on hard
disk, otherwise the pyramid will be not created and image visualization at 2 and more
zoom will be slow
Temporal pyramidal image and histogram used for preprocessing of the image to be added,
could be deleted after closing the Radiometric correction window, if the option Remove
pyramid and histogram after close is on.
17
RACURS Co., Ul. Yaroslavskaya, 13-A, office 15, 129366, Moscow, Russia
July 2009
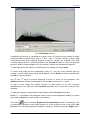
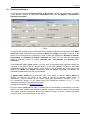
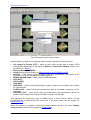
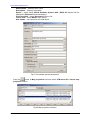
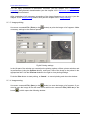
Fig.7 Radiometric correction window
In Radiometric correction window you may change the results of automatic conversion
manually using tools described below.
The following tools are used for image scale management:
•
(duplicated by “*” key) - one step zoom in
•
(duplicated by “/” key) - one step zoom out
•
(duplicated by “Alt-Enter” shortcut) - fits image to window
•
(duplicated by “Alt-1” shortcut) - 1:1 zoom (image cell corresponds to screen pixel)
Current ratio between image size and scale is shown in the window
.
For zooming in by zoom box, press Ctrl-Alt keys and draw the box by the mouse. Use
Ctrl-Alt-Shift keys for zooming out by zoom box. For “panning” over the image move a
mouse cursor along with pressed Alt key.
If there is more than 8 bits per channel in the image, the histogram stretching operation is
applied for the whole brightness range automatically, for each channel independently.
The following tools are used for image radiometric correction:
Operation of histogram stretching for the whole brightness range for each channel is started
from the window opened by the button
©2009
(Channels).
18
PHOTOMOD GeoMosaic 4.4
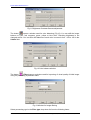
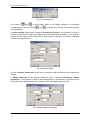
Fig.8 Channels order window
Note. The initial order of channels is setup depending on type of the image to be
added
The button
opens a window used for auto levels setup operation.
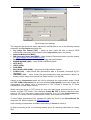
Fig.9 Auto levels window
The operation includes stretching the histogram of the initial image on the whole brightness
range. Select necessary channel in Channels field, and apply the next parameters of
histogram stretching to them. The Number of nodes parameter specifies the number of
intervals of intermediate feature, which is used for histogram stretching. Parameters Trim
left and Trim right show a percent of histogram area to be cut off, and not be considered in
the operation.
To view a histogram of the image to be added and to adjust a transfer function used to setup
arbitrary brightness transformation, open a window by pushing the button
19
(Curves).
RACURS Co., Ul. Yaroslavskaya, 13-A, office 15, 129366, Moscow, Russia
July 2009
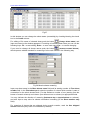
Fig.10 Histogram window
Graphically the function is visualized as a green curve. In X axis there are values of image
brightness before transformation, and in Y axis – after it. Transfer function is setup using
node points (small green squares). Between nodes the function line is Bezier curve with
curvature degree from 0% (leftmost position of the Curvature slider) to 100% (its rightmost
position). When curvature degree is 0% the function is shown as a broken line segment.
To add node point place marker to needed point of a window and press Insert.
To select node point just click somewhere close to it. You can move selected point by
moving a mouse cursor along with pressed Ctrl key. Press Delete to delete selected point
and Esc to cancel selection.
Use "/" and "*" keys on numeric keyboard to zoom in/ zoom out the histogram. Use
Alt-Enter shortcut to show the histogram in full and Alt-1 to show it in 1:1 scale.
In case of color image the transfer function is setup either for all color channels
simultaneously or for each one. Use Channels drop-down list to select color channel to be
adjusted.
To apply all changes in image window immediately mark the Preview check box.
Marker X, Y coordinates and histogram value for the current brightness reading in percent
are shown in Status line in the bottom of the window.
The button
opens a window Brightness-Contrast-Gamma used for adjusting of the
corresponding features for each image channel, or for all of them at once. If the option Live
preview is on, the image changes are applied “on-the-fly”, without pushing the Apply button.
©2009
20
PHOTOMOD GeoMosaic 4.4
Fig.11 Brightness-Contrast-Gamma adjustment
The button
opens a window used for color balancing (Fig.12). You can shift the image
balance to cyan, red, magenta, green, yellow or blue color. Resulting brightness is not
changed at that. You can also shift balance of each color in numeric form –100 to 100 in the
Values field.
Fig.12 Color balance window
The button
(Filters) opens a window used for improving of visual quality of initial image
using it's processing by different filters.
Fig.13 Window for image filtering
Select processing type in the Filter type drop-down list from the following items:
21
RACURS Co., Ul. Yaroslavskaya, 13-A, office 15, 129366, Moscow, Russia
July 2009
•
•
•
•
•
•
Blur – intended for dithering of initial image details
Gaussian blur – kind of smoothing filter, where transfer value is not a linear function
(as in Blur function), but a section of Gaussian function ("bell curve");
Sharpen – allows to highlight and intensify a differences between image's details
Sharpen edges – alike a Sharpen filter but performs filtering only when brightness
differences between details are exceeding some threshold. Suits very well for
identifying and highlighting of objects borders which are homogeneous insight (fields,
for instance), at that inner part of objects remains unchanged
Median – non-linear filter intended mainly for impulse noises filtration (single pixels
with unnatural brightness)
Sobel – non-linear differential filter, which is the first derivative of the initial raster.
Used for acquisition of contour borders on raster image.
To apply all changes in image window immediately mark the Preview check box.
The button
(undo) cancels the last action,
action. The button
10 actions.
(redo) – redoes the last cancelled
cancels all actions performed, and undo-redo operations list depth is
Note. All operations are applied to the current image state
When you get an acceptable correction result in the preview window push the Close button
and go back to Adding images dialogue – see the chapter 7.1.1 Space borne images
adding.
The procedure is not the only image enhancement/adjustment operation; other modules of
PHOTOMOD system include brightness-contrast-gamma and color balancing procedures;
the Mosaic module has advanced possibilities to adjust radiometry as well.
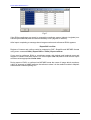
7.1.1.2. Scanner imagery formats
Note. While adding scanner image to the project, just select the path to the target
folder with imagery and product metadata files obtained from the data supplier.
PHOTOMOD GeoMosaic system will recognize needed format and the image will be
opened automatically
Satellites/Sensors
SPOT 1-4/HRV, HRVIR
SPOT 5/HRG, HRS
TERRA/ASTER
EROS A1/NA 30
FORMOSAT-2
LandSat
IRS
SPOT 1B
ASTER 1B
…
IKONOS, Quick Bird
OrbView-3, CARTOSAT-1
Formats
SISA, CAP
DIMAP
HDF
RAW, TIFF
DIMAP
TIFF/GeoTIFF, HDF
Super Structured, HDF,
Fast C
TIFF/GeoTIFF (+RPC)
Any scanner images preliminary converted into TIFF or JPEG format could be processed in
PHOTOMOD GeoMosaic (see the chapter 7.1.1 Space borne images adding). Besides, the
following formats of scanner images are supported:
©2009
22
PHOTOMOD GeoMosaic 4.4
•
SPOT – CAP, DIMAP and SISA format. In PHOTOMOD GeoMosaic system SPOT
images of 1A preprocessing level (radiometric correction) are processed. This format is
used for all modifications of SPOT satellites (from 1 to 5). You need the following 5 files
(XY – arbitrary digits).
IMAG_XY.dat
LEAD_XY.dat
NULL_XY.dat
TRAI_XY.dat
VOLD_XY.dat
•
TERRA/ASTER – HDF format. ASTER images of 1A preprocessing level (with
radiometric correction only) are processed. Geometrical model of sensor as well as initial
approximations of the orbit and sensor orientation are restored using additional
information coming alone with the images.
While adding images to the project, PHOTOMOD GeoMosaic allows to input file format
ASTER HDF. It is recommended to choose from the delivery set VNIR 1 or VNIR 2 bands
(optical range), or VNIR3B and VNIR3N (close infrared, 15m resolution).
•
EROS – RAW format. The product of 1А pre-processing level is supported in RAW and
TIFF formats either in 8-bit or 16-bit types.
•
FORMOSAT-2 – DIMAP format. The product contains files of the following formats:
Images.tif and metadata.dim.
•
IRS (1C, 1D) – IRS P5, P6 images are loaded from the following formats:
Super Structured format – imagery X.pan file, where X is a digit
HDF from Scanex – processing of 1B-level images (overlapped strips);
Fast C from Scanex – header file <name>.fst and image file <name>.X.fst, where
X is a digit.
Fast C from Euromap – image file <name>.xyA and header file <name>.xyB,
where x,y – some symbols, and B depends on A like this:
A= '0': → B='a';
A= '1': → B='b';
A= '2': → B='c';
A= '3': → B='d';
A= '4': → B='e';
A= '5': → B='f';
A= '6': → B='g';
A= '7': → B='h';
A= '8': → B='i';
A= '9': → B='j';
A= 'n': → B='k';
A= 'o': → B='l';
A= 'p': → B='m';
A sample of file names:
- e1q11b4j.1eo – image file
- e1q11b4j.1el – header file
•
23
IKONOS – TIFF/GeoTIFF format. Current PHOTOMOD GeoMosaic version allows to
process high resolution IKONOS images of Geo level, both single and stereopairs
(Stereo product); both with RPC (Rational Polynomial Coefficients) and without them (file
containing RPC could be delivered along with the image or not). The supported format is
TIFF/GeoTIFF, at that the tags with georeferencing data in GeoTIFF file are ignored. 11bit images are transforming into 8-bit rasters during the input. When adding the image file
in the same folder the program starts to search for the file with name FILENAME_rpc.txt,
RACURS Co., Ul. Yaroslavskaya, 13-A, office 15, 129366, Moscow, Russia
July 2009
where FILENAME.tif is the image name. If the file is found, the RPC available in it are
input; otherwise the image is processed using generic (DLT) algorithm.
•
Quick Bird – (61cm resolution for pan-chromatic imagery and 2.44m for multispectral).
The system allows to process Basic, Standard Ortho Ready and Standard levels of
imagery in TIFF or GeoTIFF formats. See the chapter 7.1.1 Space borne images adding.
7.1.1.3. Working with images larger than 4GB
In many cases raster files created when adding scanner images may become larger
than 4 GB in size. Special file format - PRF (PHOTOMOD Raster File) - was developed to
store and process such rasters. This format may be chosen in the dialog for saving scanner
images being added. Choosing this format makes enabled the Parameters button, pushing
which bring up the following dialog:
Maximal size of raster files - this parameter sets the maximum size of fragments
into which the raster over 4 GB is split.
Use LZW compression - this option enables lossless compression (LZW) for the
raster. It is recommended to turn this option on especially when the image contains
(background) areas with constant brightness and color (usually black).
Pyramid part of original image - to speedup display in small zoom, along with the
fragments, a general pyramid image is saved starting with the given zoom level. This option
allows changing the starting zoom level of the pyramid.
7.2. Creating Regions of Interest
7.2.1. Regions of Interest by default
Mosaic is build by transformation of initial images. Image area, which is supposed to be
included into mosaic, is called region of interest (ROI) and its boundary – cutline.
Each source image has a rectangular region of interest (ROI) by default. This area excludes
10% of the image from each side just to make sure to avoid areas with fiducial marks from
the output mosaic. Use the option Trim off images edges on General tab of Preferences
window to setup the area to be cut off, see the chapter 6.5 Preferences. You can change the
size of this rectangular ROI by using menu command ROI’s | Trim off images edges or by
(Trim off images edges) or by drag-and-drop the green cutline on the
pushing the icon
image.
If you are not going to create more complex cutlines (for example based on the rules of the
classic photogrammetry) you can just start mosaic or preview building using these default
ROIs. The images order in the output mosaic (which image is lower or upper in the
overlapping area) is defined by the order selected in the window opened by the icon
(Images order) (see the chapter 8.2.4 Additional recommendations). The source rectangles
©2009
24
PHOTOMOD GeoMosaic 4.4
may be converted to 4-corner polygons using menu command ROIs | Polygon ⇔ rectangle
(see the chapter 7.3 Single image window). After that ROI become available for editing as
described in the chapter 7.2.3 Creating and editing regions of interest.
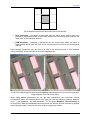
7.2.2. Cutlines creating rules
Cutlines are boundaries of Regions of interest – areas on the source images used to be
transformed and merged to the output mosaic. It is recommended to draw cutlines manually
to improve mosaic quality, considering the following rules.
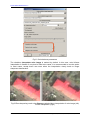
1. Draw ROIs as close as possible to the image principal point to increase geometrical
accuracy of images matching.
2. If orthophotos are used as initial images, make sure that cutlines do not intersect the
objects which are considerably towering over the relief (bridges, tall buildings, power lines
piers etc.). Otherwise the objects could furcate or partially disappear from the mosaic.
3. Cutlines should not go along the extended objects with brightness different from the main
background (forest area boundary, road etc.). Otherwise the edge smearing effect occurs on
the object boundary if the option Seams feathering is ON. It is recommended either to
intersect such objects on the right angle or draw the cutline on some distance (not less than
one and a half interpolation cell size, in pixels) from the boundary.
4. Re-draw the cutlines over alternating areas on the image with different color, or draw it in
parallel with the objects boundary but on some distance from it, to avoid abnormally bright
areas on the output mosaic when local adjustment option is ON (see p.3).
5. The local adjustment works in such a way that images of each strip are adjusted first, and
on the second step the strips are inter-adjusted. So the best situation is when ROIs borders
inside every strip are “continuous” and the strips have some overlapping area. See also the
chapter 8.2.4 Additional recommendations.
7.2.3. Creating and editing Regions of Interest
Usually ROIs are created on each source image loading one by one. It is convenient to have
on the screen two-three windows with adjacent images of the source block (see the chapter
6.2 Images). To view a block fragment “around” the current image, open block scheme using
the command Window | Block scheme or by clicking main panel icon
6.7 Block scheme).
(see the chapter
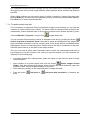
icon or command ROI | ROIs
ROIs are created using cutlines editor which opens by the
editor. While adding ROIs you should create them with overlap to avoid “holes” on the output
mosaic. For this purpose it is useful to see ROIs from adjacent images on the current one
(icon
Show ROIs of the main panel, or Alt-Z hot keys).
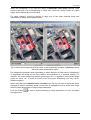
At that, the images order in the overlapping areas on resulting mosaic (upper-lower)
corresponds to the sequence, preset in Images order table (opens by the icon
of the
main panel). ROIs of images, located above the current image, are hatched (see the chapter
8.2.4 Additional recommendations).
If the hatched ROIs from the adjacent images are shown on the current image, you should
draw the cutlines precisely (considering terrain features, local brightness, buildings, etc.) on
25
RACURS Co., Ul. Yaroslavskaya, 13-A, office 15, 129366, Moscow, Russia
July 2009
the areas without hatching. But you can continue the cutline “under” the hatched areas
schematically, keeping only the overlapping with the adjacent ROI.
During transformation of overlapping ROIs into cutlines the algorithm of “holes” finding
between cutlines is working. If such “hole” is found, you get the warning and this area is
shown by red hatching on preview image if the option Fill holes between cutlines is ON
(Service | Preferences menu command, General tab).
Push the button
ROIs editor (or click menu command ROIs | ROI’s editor) to open a
panel with the following simple vector editing tools used for creating polygons:
•
(duplicated by Insert key) - adds ROI (starting ROI creation)
•
- removes ROI
•
(duplicated by S key or double mouse click) - selects ROI
•
- unselects ROI
•
(duplicated by Insert key) - adds new vertex to ROI. In case of selected ROI
inserts a vertex “between” two closest ones. In case of creating ROI add a new vertex
•
(duplicated by Delete key) - deletes selected vertex
•
(duplicated by single mouse click) - selects vertex
•
- unselects vertex
•
To move a vertex, select it and move by left mouse button holding down the Ctrl key.
The last group of icons is used to assign the following properties to the ROI:
•
•
- region of interest - the default mode: the ROI is included to the mosaic
- transparent ROI. Portions from other images, that are visible “through” the current
one in accordance with the images order defined in the window opened by the Images
order icon (
•
)
- background ROI. A “hole” in the output mosaic colored by background color
(selected in Mosaic | Parameters | Mosaic window).
It is convenient to use mouse settings when working with ROI (see the chapter 8.4
Preferences). For example it is easier to push right or middle mouse button instead of Insert
key on the keyboard.
For editing and creating of ROI you may use marker=mouse mode (which is turned on by
pushing the icon
, located on the upper button menu, or by F4 key). After that the marker
on the screen becomes invisible and all mouse moves result in appropriate marker moves
without additional clicks of mouse buttons.
©2009
26
PHOTOMOD GeoMosaic 4.4
For convenient work during ROI’s creating you can use context menu commands (appeared
after right mouse click over the image window), which duplicate above mentioned procedures
with ROI.
When editing cutlines you may select group of cutline’s vertices by mouse drag along with
pressed Shift key, and also move the selected group by mouse along with pressed Ctrl key.
Press Esc key to cancel vertices selection.
7.2.4. Tie points search and edit
If it is necessary to superpose ROI’s from adjacent images more precisely you can find and
measure tie points located near cutlines. Tie points could be measured both manually and
automatically. Search and edit tools for tie points are located in the window opened by menu
command Mosaic | Tie points, or by the icon
in upper button bar.
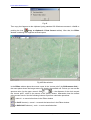
You can measure tie points along cutlines in automatic mode first, by pushing the button
Search tie points in automatic mode. After that tie points are displayed on the images and
their coordinates are shown in the list. Click tie point on the image and its coordinates will be
highlighted in the list of measured points. Double click on the raw of coordinates of the point
selected, places marker on this point in the image window.
Then you can view tie points and if automatic search results are unacceptable and there is
big divergence of terrain contours near cutlines in preview window, you may measure ties
manually in the following way:
In preview window with cutlines shown, place the marker on the cutline in area of terrain
lines divergence.
Open window of tie points search and push the button
Center images around
marker. After that windows with images, where the point should be measured, open and
markers in them are placed approximately on the point.
Place markers precisely on the measured point in images windows.
27
Push the button
point.
Add point or
Add point with correlation, to measure the
RACURS Co., Ul. Yaroslavskaya, 13-A, office 15, 129366, Moscow, Russia
July 2009
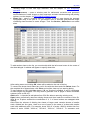
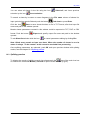
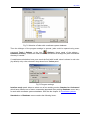
Fig.14 Tie points search results
Tie points search on the images is provided, using the following options of upper button bar:
- delete all points – deletes all tie points from images and their measurements from the
list
- add point – when tie point is indicated on pair of images manually, it will be measured
and added to the list after pushing this button
- add point with correlation – when measuring tie points on overlapped pair of
images, the point is measured and added to the list if the correlation between two points is
acceptable, i.e. suits the value indicated in Min. correlation coefficient field in Tie points
search parameters window
- delete point – deletes tie point from the list and images
- search tie points in automatic mode – starts tie points search on overlapped
images
- re-measure all – re-measure coordinates of existing tie point on all images, where it is
already measured
- re-measure all with correlation – re-measure coordinates of existing tie point on all
images, where it is already measured, more precisely using correlation algorithm. Its
parameters are indicated in Min. correlation coefficient field in Tie points search
parameters window
- re-measure in active window – re-measure coordinates of existing tie point just on
the active image
©2009
28
PHOTOMOD GeoMosaic 4.4
- center images around point – places the window with image (or images) to put the
point, selected in the list, into the window center
- center images around marker – opens images windows, where you need to
measure point, and markers in these windows are approximately placed into the point’s area
- build mosaic fragment around active point – creates small fragment of mosaic with
size (width and height in pixels), defined in Mosaic fragment panel in Tie points search
parameters window, see description below
- parameters – opens the window for setup parameters of automatic tie point search:
Fig.15 Tie points search parameters
•
•
•
•
•
•
•
•
•
•
Fragment size (pix) – size of mosaic fragments, built using current settings of
PHOTOMOD GeoMosaic (pixel size, etc.)
Search area size (pix) – maximal supposed size of mutual discrepancy used for
search.
Min. correlation coefficient – minimal value of correlation function, under which
fragments from adjacent images are considered of the same name.
Min. fragment RMS – minimal value of RMS of fragments brightness, under which
the fragments are considered as nonhomogeneous background (water surface, etc.),
i.e. suitable for comparison.
Min. distance between points – minimal distance between fragments to be
compared located on the adjacent cutlines.
Step along cutlines (pix) – step along cutlines in pixels. The less the value the more
points are included to the report, but the more time is consumed for search.
Max. deviation from cutline (pix) – maximal deviation of tie point found from cutline.
Zoom in windows – zoom scale used for viewing of tie points in windows when
select them in the table.
Temporary path – target folder used to save mosaic fragment built around given
point.
Width and Height – size of a fragment around given point in pixels.
Tie points found are used for resulting mosaic building if the option Use tie points on
Mosaic tab in Parameters window is on, see the chapter 8.1 Mosaic.
29
RACURS Co., Ul. Yaroslavskaya, 13-A, office 15, 129366, Moscow, Russia
July 2009
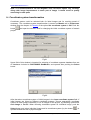
7.2.5. Regions of Interest import and export
You can import regions of interest from vector files in Shape and DXF formats (by menu
command ROIs | Import ROI’s). Regions of interest are created on the initial images and
stored in pixel coordinates system.
The main task during the import is image selecting for correct ROI’s referencing. ROI’s
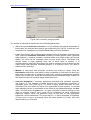
referencing parameters are set up in the window opened by menu command ROIs | Import
ROI’s | Import from DXF/Import from Shape.
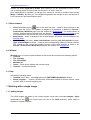
Fig.16
After import regions of interest are referenced to mosaic using the following options:
• Image number – number of image in GeoMosaic project. It is taken from initial order of
images in Open images window just after PHOTOMOD GeoMosaic opening.
• Layer number – image number, in its order of including to mosaic i.e. its number in
Images order window, see the chapter 8.2.4 Additional recommendations.
• Source file name – file name (with extension), which is used at PHOTOMOD
GeoMosaic project creation.
• Image name – initial file name without extension.
Import from DXF format
In DXF file root of name could be stored as layer name, block name or attribute name.
Besides, you can add a prefix to this name in the beginning, and/or suffix in the end.
Import from Shapefile format
In this format georeference information is storing in separate file with dbf extension. The only
one raw from dbf table corresponds to each vector object. Select the column before import,
to use its values as a name root. Then you can add prefix and/or suffix to the name.
©2009
30
PHOTOMOD GeoMosaic 4.4
Fig.17
If the ROIs coordinates are stored in geographic coordinate system (latitude, longitude) turn
ON the option Use Lat, Lon and select necessary units (degrees or radians).
After import completing a message about images number and referenced ROI's appears.
Export ROI’s to files
Regions of interest and cutlines could be exported to DXF, Shapefile and MIF/MID formats
using menu command ROIs | Export ROI’s or ROIs | Export cutlines.
If you need to reference ROI’s to coordinate system with latitude and longitude axes and
degrees or radians units after export, turn on the option Use Lat, Lon for their correct export
and then select appropriate Linear units.
During export of ROI’s or cutlines into MIF/MID format the name of image which contains a
cutline is exported to NAME attribute, that allows to show it in the attribute’s table in MapInfo
software after cutlines opening in it.
31
RACURS Co., Ul. Yaroslavskaya, 13-A, office 15, 129366, Moscow, Russia
July 2009
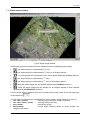
7.3. Single image window
Fig.18 Single image window
At the lower part of the window there are standard icons for displaying raster image:
•
- one step zooming out (duplicated by “/” key)
•
- one step zooming out (duplicated by “/” key) for all images opened
•
- 1:1 mode (image cell corresponds to the screen pixel) (duplicated by Alt-1 shortcut)
•
- one step zooming in (duplicated by “*” key)
•
- one step zooming in (duplicated by “*” key) for all images opened
•
- fitting the whole image into the window (duplicated by Alt-Enter shortcut)
•
- fitting the whole image into the window for all images opened in block scheme
(duplicated by Alt-Shift-Enter shortcut)
Current image zoom is shown in title bar in brackets after image name and in the lower part
of the window as
.
You can also use following key combinations to zoom arbitrary image fragment or move it:
• Ctrl + Alt + mouse
zooming in by zoom box, “drawn” by mouse
• Ctrl + Alt + Shift + mouse
zooming out by zoom box
• Alt + mouse
panning the image
• Mouse wheel
mouse wheel steering allows to zoom in/zoom out
image on the screen
©2009
32
PHOTOMOD GeoMosaic 4.4
Following sliders (
,
,
), located at the bottom of the window, are used to set up
brightness, contrast and gamma respectively for the active image. When working with color
images there is a possibility to adjust these radiometric parameters separately by channels
(using the buttons
). Right click any slider and select the option Set original
BCG correction to restore BCG settings by default.
Note. These settings are memorized and used for output mosaic creation
When you create ROI (see the chapter 7.2.3 Creating and editing ROI) you can use the icon
(duplicated by Alt-Z hot keys) to show/hide cutlines from the adjacent images on/from
the current one. Each cutline is displayed by different color and is labeled by the
corresponding image number. ROI’s on images which are “above” the current image are
shown by hatch.
The lower string of image window consists of three parts with information helpful to estimate
the following values of resulting mosaic:
▪
▪
▪
▪
▪
▪
Number of map sheets of resulting mosaic according to the selected parameters (see the
chapter 10 Splitting mosaic into map sheets)
Raster size of resulting mosaic in pixels (height and width)
The last multiplier in this section is number of bits per pixel of mosaic to be created, 8
means that resulting image will be black and white (8-bit), number 24 shows that the
mosaic will be color – 24-bit
Mosaic volume in kilobytes, example on Fig.8 shows that mosaic will be approximately 10
Mb of volume
XY coordinates of current cursor position on active image in pixel coordinates
XY coordinates of current cursor position on active image in user (terrain) coordinates –
you may copy these coordinates to the clipboard (by Ctrl-C) and paste them into selected
application (by Ctrl-V).
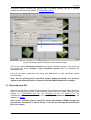
7.4. Raster image georeferencing
Initial raster image (in TIFF, BMP, JPG, IMG, NTF, GIF, PNG, PIX, JP2 formats) could be
georeferenced using ground control points coordinates in the following window opened by
menu command Service | Raster georeferencing… or by pushing the button
georeference) in upper button bar.
33
(raster
RACURS Co., Ul. Yaroslavskaya, 13-A, office 15, 129366, Moscow, Russia
July 2009
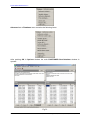
Fig.19 Raster map window
If georeference file (in MapInfo TAB format and with the same name as map file) is storing in
the same folder as file with scanned map, then list of georeference points and their
coordinates is opened in Raster map window. In this list Xg, Yg – geodetic coordinates, Xp,
Yp – pixel coordinates, Name – point name.
To visualize point in map window (to place marker in point’s pixel coordinates) you should
push the button with point number in leftmost column N of the table.
Upper menu buttons are intended for the following operations:
(duplicated by hot keys Ctrl-O) - load raster map – opens dialogue to select raster file
(in TIFF, BMP, JPG, IMG, NTF, GIF, PNG, PIX, JP2 formats) and open it
- load reference map – opens dialogue of raster file selection (in main raster formats)
and its opening. This georeferenced raster allows to recognize points on un-referenced
raster and measure their coordinates.
- load vector map – opens dialogue of vector format file selection (PHR (PHOTOMOD
system format), DXF, Shape or DGN). This file allows to recognize points on un-referenced
raster and measure their coordinates.
- load XYZ points from file – opens dialogue used for selection of text file of CSV format,
which contains reference points coordinates, and settings for points import from the file. After
import points' coordinates are opened as a table below the map window. Point’s coordinates
could be loaded replacing opened coordinates (if the option Clear before import is on) or in
addition to them (if the option is off).
©2009
34
PHOTOMOD GeoMosaic 4.4
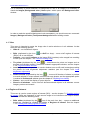
Fig.20 Settings of import of reference points coordinates from CSV file
- allows to manage the scale of vectors in the window
- show vectors – hides/shows vector objects over raster map if vector file is opened
- show vertices – hides/shows vertices of vector objects if vector file is opened
- save – saves georeferencing file in MapInfo TAB format, with the same file name as
map file name, but with TAB extension.
,
,
,
- zoom management, duplicated by hot keys - /, Alt-1, *, Alt-Enter
- shows zoom scale in raster map window
- map displaying in grayscale or color mode.
For more convenient work the map could be rotated in the following ways:
- without
rotation,
- turn at 90 degrees,
- turn at 180 degrees and
- turn at 270
degrees. At that raster file is not changed and the rotation is executed “on fly”.
- clear – deletes all points (list cleanup)
- add point – measures new point coordinates on the map and adds them to the end of
list. At that marker pixel coordinates will be assigned to point and to geodetic coordinates will
be assigned 0 value (you can input them manually in appropriate cell)
(duplicated by hot keys Ctrl-Del) - delete point – deletes the point selected in list
- re-measure – replaces pixel coordinates of selected point. At that current pixel
coordinates of marker are assigned to point and saved in the list
- Auto-place – places marker to coordinates of point selected in list
- copy coordinates to clipboard – copies coordinates of selected point to clipboard.
Coordinates are in the following format "Xp Yp Xg Yg"
- paste coordinates from clipboard – pastes selected point coordinates from the
clipboard in following possible formats: "Xg Yg", "Xg Yg Zg", "Xp Yp Xg Yg", "Xp Yp Zp Xg
Yg Zg", where Zp equals 0.
- select color – opens standard OS Windows palette to choose point’s symbol color on
the map
35
RACURS Co., Ul. Yaroslavskaya, 13-A, office 15, 129366, Moscow, Russia
July 2009
- decimal places – allows to input number of decimal places in coordinates of
reference points
- coordinate system – shows current coordinate system, and the left button
opens a window used for coordinate system change, see the chapter 16 Coordinate
systems.
For map georeferencing you should recognize on the map points with known geodetic
coordinates. Map could be referenced using only one point (in that case it is considered that
measurement unit is 1 pixel and axes coincide. If there are two points, then map will be
scaled and rotated, in case of three points affine transformation will be applied), but for
accuracy control you should measure not less then 4 points.
To measure point put marker on point’s place on the map and push button
(add point).
After that point’s name and pixel coordinates will be added to the list. Input geodetic
coordinates of the point to appropriate cells manually. When fifth point is measured,
coordinates measurement errors EХ and EУ are automatically calculated and saved to the
last columns.
To place marker on the measured point on the image, click the table cell with point number
(in leftmost column).
To edit coordinate value in table cell, select the cell and press F2. To end editing and save
coordinate press Enter, to exit from editing without coordinate saving press Esc.
When raster image referencing is completed, push the button
in MapInfo format.
to save georeference file
7.5. Images referencing
For more accurate linking of initial images during mosaicking use images referencing
(images referencing) in upper
operation in the window, opened by pushing the button
button bar or by the command Service | Images referencing.
The window allows to associate images, which are not referenced to coordinate system and
may be linked only to each other (unlike to rasters georeferencing, performed in the
appropriate window, see the chapter 7.4 Raster image georeferencing) manually by
identifying the same points on the adjacent images. The images located “upper-lower” to
each other should be placed to the “strips” and linked to each other either.
©2009
36
PHOTOMOD GeoMosaic 4.4
Fig.21 Block scheme window for images referencing
Open new strip in this window (by pushing the button
this strip (by pushing the button
add strip), then add images to
add image). Add all strips and images, place them in
needed order using moving tools along with pushed button
(images moving mode).
Then it is possible to reference them manually in the following way: indicate the appropriate
points on the images by the mouse cursor and press the Insert key. To place the cursor
accurately on the well-recognized points of the image use mouse along with pressed Ctrl key
and pushed button
vertices moving mode. To zoom in/out the image in Block scheme
window use hot keys / and * on keypad (or mouse wheel turn). For image panning use
mouse move along with pressed Alt key.
When strips and images are linked to each other, push the button
save reference, to
save the links into files with tab extension for each image. After that close the Block scheme
window and in main PHOTOMOD GeoMosaic window add the images into mosaic project.
Then you can perform usual procedure of preview and mosaic creation.
37
RACURS Co., Ul. Yaroslavskaya, 13-A, office 15, 129366, Moscow, Russia
July 2009
Fig.22 Image, merged using manual links created in Block scheme window
Note. If sheets of images to be merged have no overlap (adjacent sheets of
topographic maps, for instance), you should link them to each other just in one point
that can be, for instance, common node of grid
Set of files with manual reference could be saved into Block scheme project (file with *.sch
extension) by pushing the button
button
new one.
©2009
(save project) or
(open project) to open the project or the button
(save project as). Push the
(new project) to create a
38
PHOTOMOD GeoMosaic 4.4
8. Parameters and preferences
or menu command Mosaic | Parameters to open Parameters dialog
Use the icon
consisting of the following tabs:
8.1. Mosaic
Mosaic tab is used to set up the following parameters:
Fig.23
•
•
•
•
39
Cell size – this text field is used to enter the size of mosaic cell on the ground. This
parameter is specified in units shown in brackets. The cell size by default is equal to the
cell size of the first image of mosaic project. The Calculate button opens a dialog used to
set a mosaic size in pixels and recalculate its cell size accordingly. The Scale (TIFF,
BMP) button opens a dialog used to calculate print size and resolution according to the
resulting mosaic scale input by the user.
Create MS TIFF – used to build a pyramid image of output mosaic inside TIFF or
GeoTIFF file, that allows to speed up the image zooming.
Grayscale output – this check box is active only when at least one of the original images
is an RGB one. Mark it to create the output mosaic as grayscale image.
Options in the Mosaic compression panel are used to compress the output mosaic
image. Check the TIFF, JPEG compression box and use the slider Image quality (0100%) if you want to apply the compression. The default value of compression is 75%
(usually it causes the 5-7 times compression of initial image volume).
RACURS Co., Ul. Yaroslavskaya, 13-A, office 15, 129366, Moscow, Russia
July 2009
•
•
•
•
•
•
•
•
•
•
•
•
•
Background color – used to set a color for mosaic background (since it always inscribes
into a rectangular raster). Following options of background color are provided: Black,
White, Other (the last one opens standard OS Windows dialog of color selection). In
case of grayscale output selected color is replaced by corresponding grayscale value
(with the same intensity).
Resampling method – allows to choose brightness interpolation mode for orthomosaic
creation: bilinear, cubic and nearest neighbor.
Georeference file – allows to select the format of the additional file created along with
output mosaic and containing the information for mosaic referencing to coordinate
system. See the chapter 15 Georeference file.
Interpolation cell size – in PHOTOMOD GeoMosaic the output raster is created as a
sequence of tiles. The size of each processing tile is defined by the parameter
“interpolation cell size”. The larger the tile the faster and less accurate is mosaicking
process. Recommended tile size is about 20-40 pixels. Default value is 32.
Swap X, Y – Х,Y coordinates in resulting mosaic could be swapped if necessary
Create georeference only – allows to create just georeference file without building the
mosaic. It is saved to the path selected into file format indicated in the Georeference file
drop-down list.
Set coordinate system – allows to change the initial coordinate system for resulting
mosaic if necessary (see the chapter 14 Coordinate system transformation).
Use tie points – for more precise images (ROI’s) superposition on cutlines for mosaic
building, use tie points measurements, performed both automatically and manually (see
the chapter 7.2.4 Tie points search and edit).
Set background color as “transparent” – when saving the resulting mosaic in MapInfo
format (selected in the Georeference file drop-down list), you can set the background
color which is shown in MapInfo system, as transparent
Save georeference as "NonEarth" – when saving the resulting mosaic in MapInfo
format (selected in Georeference file drop-down list), allows you to save georeference
as NonEarth coordinate system. Used if MapInfo system does not support coordinate
system of PHOTOMOD GeoMosaic project.
Replace background color – allows to change color of pixels located inside mosaic
image to avoid pixels on output image with the same color as its background
Transform by georeference points – allows to transform the initial image using
georeference points. Georeference file should be in TAB format. The operation is used
mainly for space images transformation. Images also could be referenced directly in
PHOTOMOD GeoMosaic module, see the chapter 7.4 Raster image georeferencing
Rotation angle – allows to rotate output mosaic. It is helpful when initial images block
has elongated shape, and you need to cut unnecessary background in rectangle window
of resulting mosaic.
©2009
40
PHOTOMOD GeoMosaic 4.4
8.2. Brightness adjustment
Brightness adjustment tab is used for radiometric correction of source images to produce
seamless mosaic.
Fig.24 Brightness adjustment parameters
This panel allows to setup global brightness adjustment of resulting mosaic (see the chapter
8.2.1 Global brightness adjustment) and also local adjustment parameters (see the chapter
8.2.2 Local brightness adjustment).
Mark the option Seams feathering to smooth the seam between adjacent images in the
narrow zone around. The size of smoothing zone is defined by the parameter Interpolation
cell size (see the chapter 8.1 Mosaic).
You can include brightness-gamma-contrast adjustments done for initial images to resulting
mosaic creation by marking the option Use brightness pre-correction.
8.2.1. Global brightness adjustment
The global adjustment (Global adjustment panel) allows to apply selected type of
transformation to all pixels of each source image.
Select a brightness adjustment type from the following list:
• None – allows to use un-adjusted images
• By average brightness – brightness and contrast are adjusted basing on average
values calculated over all mosaic images. This method is recommended when there are
41
RACURS Co., Ul. Yaroslavskaya, 13-A, office 15, 129366, Moscow, Russia
July 2009
•
big differences between brightness’ of images, but each of them contains relatively
smooth scenes. Thus in cases of scenes with sharp different brightness within one image
(for example the sea and the coast) this method may produce incorrect results.
By selected image – mosaic brightness and contrast are adjusted in accordance with
corresponding parameters of selected (“reference”) image. Use red arrow buttons for the
image selection. Use the option Use only overlapping areas to consider only
overlapping image areas for the brightness adjustment. In this case it is recommended to
select an image from the middle part of the block as a “reference” one. However in case
of abnormal brightness fluctuations (“trends”) you can face a problem of smooth
increasing, or reducing of the brightness from the reference image to the block edges. So
it’s not a recommended option for such kind of data.
8.2.2. Local brightness adjustment
The local adjustment of image brightness applies some brightness transformation along
cutlines of images that are merged into mosaic with a smoothing going down to the image
central point and mosaic edges. During this process the brightness (additive component) and
contrast (multiplicative component) of initial images are changed at the same time. Use the
Local adjustment panel on the Brightness adjustment tab on the Parameters window to
setup the process parameters.
There are some suggestions for creating cutlines for local brightness adjustment. It is
recommended to draw cutlines along the borders of uniform color objects but at some offset
from it to avoid border blurring when using the Seams feathering option (see the chapter 8.2
Brightness adjustment). The offset size should be about one-two Interpolation cell sizes
values (see the chapter 8.1 Mosaic), considering the ratio between source images and
output mosaic scales. For example, interpolation cell size = 32, source image cell size = 0.17
m and the required mosaic cell size is 0.5 meters. The ratio between source and output
scales is about 3, so you can draw a cutline at distance 3*32 = 100-200 pixels from the
object edge.
Sometimes the local adjustment produces bad looking seams or small abnormal brightness
or color spots close to seams. Change the cutline position to resolve the first problem. The
color spots can be removed by adding “pins” inside them, while working with the image in the
Preview window. So you should open the Preview window and put “pins” inside spot areas
using Insert key. The pins are displayed by yellow circles and may be selected by mouse
click, deselected by Esc key and deleted by Delete key.
Use menu command View | Local adjustment when Preview and Mosaic windows are
opened to display areas, where statistical parameters are calculated. Areas between images
of one strip are green, areas between images of separate strips are blue and areas inside
single images are yellow. This information would help you to view and understand the reason
of local brightness unevenness.
©2009
42
PHOTOMOD GeoMosaic 4.4
Fig.25 Local brightness adjustment in preview window
Local brightness parameters (the Parameters button) are adjusted in appropriate window on
two tabs: Base – contains parameters influencing on brightness insight images and between
them, and Edges – contains parameters influencing on brightness of external mosaic border.
Fig.26 Base local adjustment parameters
On Base tab:
• Fragment size − a size of image fragments of the same name, used to create a model of
local brightness adjustment. The bigger fragment size the better adjustment but the
slower processing.
43
RACURS Co., Ul. Yaroslavskaya, 13-A, office 15, 129366, Moscow, Russia
July 2009
•
•
•
•
Number of fragments − number of fragments of the same name, located on each
image. The greater the number the better adjustment, but the slower the process of
parameters calculation and mosaic creation.
Number of inner points − sets the number of points inside the image and on the edges
of output mosaic, where the brightness should be preserved. Lack of inner points leads to
brightness anomalies when moving away from the cutlines. Excess number of inner
points causes the brightness un-adjustment along the cutlines.
Contrast coefficient – in some cases when the contrast of initial images was defined
incorrectly it causes poor brightness adjustment or errors in creating of local brightness
adjustment model. You can increase the value of this parameter up to 7 to improve the
result.
Brightness addition in inner points – allows to setup brightness (separately by R, G, B
channels) in inner points either along the strip and/or between the strips. It is
recommended to use this parameter in case of considerable brightness change from
image center to its sides, which is impossible to remove by another way. At that the Inner
points parameter should be not more than 1-2.
Fig.27 Brightness parameters on mosaic edges
Edges tab contains the following parameters:
• Brightness addition − allows to setup smooth brightness change on 4 sides of output
mosaic. Color imbalance on mosaic sides is unnoticeable, that is why the brightness is
changing in all spectral channels at the same time.
• Trim off percent – allows to exclude corresponding percent of image area along the
mosaic sides from processing (because there are auxiliary signs, marks, etc.).
• Density coefficient − sets the amount of tie points on the edges of mosaic, which are
used for adjustment. Lack of these points leads to brightness anomalies when moving
away from the cutlines. Excess number of tie points causes the brightness un-adjustment
along the cutlines.
Note. Changing these parameters is recommended just for experienced users
Note. Since local adjustment parameters depend on cut lines location, then any
cutlines change results in recalculation of the parameters, when you start mosaic or
preview building
©2009
44
PHOTOMOD GeoMosaic 4.4
Note. It is recommended to exclude each second image in every strip from the mosaic
when using local brightness adjustment. Obviously it is necessary to have triple
overlap (greater than 50 percent) between images in this case
If you get message Interpolation model building error during mosaic creation, it means
that local brightness adjustment has been done incorrectly and you should change the
Contrast coefficient parameter, as described above or correct cutlines manually.
8.2.3. Building strips
The set of initial images should be organized into strips for correct local brightness
adjustment and automatic building of regions of interest. GeoMosaic program includes strips
building option which uses analysis of mutual images placement.
Fig.28 Strip building parameters
Menu command Block scheme | Build strips opens the window where you can setup the
following parameters of strips creation:
• Minimal overlap between images. The less the parameter, the less overlap area is
allowed between the images in the strip.
• Minimal angle between axes and diagonals
• Maximal angle between axes
• Maximal differences of axis angles
• Priority strips direct may be horizontal, vertical and arbitrary
It is recommended to change these parameters only when the strips are created incorrectly.
You can view created strips in preview window as lines joining centers of images included to
the same strip (the option Show preview should be ON).
8.2.4. Additional recommendations
In most cases the local brightness adjustment procedure provides satisfactory results. But if
you want the algorithm to work ideally, draw the cut lines as described below.
The local adjustment works in such a way that images of each strip are adjusted first and on
the second step the strips are inter-adjusted. So the best situation is when ROIs borders
inside every strip are “continuous” as it is showed on the picture.
45
RACURS Co., Ul. Yaroslavskaya, 13-A, office 15, 129366, Moscow, Russia
July 2009
image 1
image 2
image 3
image 4
overlapping
areas
continuous cutline
inside the strip
Then the strips are adjusted with some overlapping area:
strip 1
overlapping
areas
strip 2
strip 3
Fig.29
Moreover, you should pay attention on the order of images insight the strip – because ROIs
taken from “upper” image are included to the resulting mosaic and their brightness is
considered during brightness adjustment of the resulting mosaic.
For brightness adjustment of resulting mosaic it is enough to change images order, using
menu command Mosaic | Images order (or the
window.
©2009
icon) which opens the Images order
46
PHOTOMOD GeoMosaic 4.4
Fig.30 Images order change
The color in this table highlights the images of the same strip. You can move images in the
- Upper,
- Lower,
- To top,
- To bottom, and select
list using the icons
those to be included in resulting mosaic in overlapping area. It is convenient to use the
following operations for work with images list:
- select strip – opens an additional window with the list of strips for selecting.
- by images order – restores the initial order of the images and cancels all changes.
invert order of selected images – allows to sort selected images in the revert order.
invert order of all images – allows to sort all images in the revert order.
copy to clipboard – copies list of images names into clipboard in text format, allowing
to paste them into text editor, send by e-mail, etc.
find – starts image search in the list using its name after name input to search field.
Select image name by mouse click and group of images holding left mouse button along with
Ctrl and Shift keys pressed. You can also move selected images names using buttons with
arrows in this window, described above.
8.3. Splitting into sheets
Process of splitting output mosaic into map sheets is described in details in the chapter 10
Splitting mosaic into map sheets.
47
RACURS Co., Ul. Yaroslavskaya, 13-A, office 15, 129366, Moscow, Russia
July 2009
8.4. Preferences
Preferences window (Fig.31) opens using the
command Service | Preferences.
icon of the main button bar or menu
Fig.31
PHOTOMOD GeoMosaic preferences include the following tabs:
General:
• Autocentering to marker – automatically centers window into marker position on the
image after zoom in/out
• Paint raster in separate thread – allows to output mosaic in separate thread. The
visualization thus could be smoother but slower, with pre-loading of white background
that is not convenient for panning. It is recommended to use this option, for viewing the
rasters with large volume or from slow media (CD, network).
• Fill holes between cutlines – if this option is ON then empty areas (“holes”) between
ROIs created during cutlines drawing are hatched by red color. (See also the chapter
7.2.3 Creating and editing Regions of Interest)
• Trim off images edges – allows to set percent of the image area to be cut from each
side of initial image to eliminate fiducial mark’s areas from resulting mosaic.
Windows:
• Preview raster size – allows to select maximum raster size (by lines or columns) in
Preview window (the default value is 600). Increasing the parameter value causes
improving raster quality but slows down the Preview building.
• Block scheme – allows to select number of strips and images included to the block
scheme (see the chapter 6.7 Block scheme). For example if this parameter is 3 x 4 the
block scheme consists of 3 strips by 4 images. The Overlap parameter is used to set up
number of overlapping images in adjacent portions of the block scheme.
• Display output mosaic – opens window with resulting mosaic after its building
• Open all sheets – if this option is OFF and you are building the mosaic split into sheets,
the only one of sheets is opened, and other ones you can view using the icons of upper
button bar (
windows.
©2009
,
). If the option is ON you will get all sheets opened in separate
48
PHOTOMOD GeoMosaic 4.4
•
•
•
Show images names – turns off/on images names in images windows and also in
preview and resulting mosaic.
Synchronous marker movement – while working with block scheme window, the
marker moves synchronously on adjacent images, which overlap with the current one.
The option is ON by default. Use X key to turn on the option in image window.
Autocentering by synchronous marker movement – if synchronous marker movement
is ON (see previous option), the adjacent image is moved when marker moves on the
first image to center the window into marker position.
The Precision tab of Preferences window is used to setup the parameter Cell size decimal
places, which allows to input decimal places amount used for mosaic pixel size calculating.
Fig.32 Mosaic precision settings
Two sliders located on this tab (Trim background and ROIs autobuilding) allow to adjust
speed and quality of two processes: removing of background when building mosaic, and
automatic cutlines creation.
The option Save color adjustment parameters is used when the project contains a big
number of images. In this case brightness adjustment parameters, selected on the
corresponding tabbed page (see the chapter 8.2 Brightness adjustment), are stored in file of
the mosaic project. It allows to open a preview image more quickly when open the project for
the next time.
The Images tab in Preferences window allows to create multiscale (pyramidal) images to
speed up loading the images into mosaic project.
49
RACURS Co., Ul. Yaroslavskaya, 13-A, office 15, 129366, Moscow, Russia
July 2009
Fig.33 Preferences of multiscale images creation
If you create the mosaic using images of big enough volume, you are recommended to check
the option of multiscale images creation (Create pyramid levels) to speed up their loading
into mosaic project. After that specify target folder and path to save multiscale images (with
PYR extension), and select compression mode and quality.
Use the command Service | Delete multiscale images to delete multiscale images from the
project.
The Mouse tab is used to assign operations for mouse buttons (such as duplicating of
Insert, Enter, S and other keys). These settings allow to simplify cutlines creation.
9. Mosaic preview
Once all necessary parameters are set, select menu command Mosaic | Preview or push
to see a mosaic preview. In this case mosaic is built in fast mode with low
the icon
accuracy. It is convenient to use a preview mode for example to estimate the results of
mosaic color adjustment.
©2009
50
PHOTOMOD GeoMosaic 4.4
Fig.34 Mosaic preview window
At the lower left part of Preview window there are standard icons for displaying raster image:
•
- one step zooming out (duplicated by “/” key)
•
- one step zooming out (duplicated by “/” key) for all images opened
•
- 1:1 mode (image cell corresponds to the screen pixel) (duplicated by Alt-1 shortcut)
•
- one step zooming in (duplicated by “*” key)
•
- one step zooming in (duplicated by “*” key) for all images opened
•
- fitting the whole image into the window (duplicated by Alt-Enter shortcut)
•
- fitting the whole image into the window for all images opened in block scheme
(duplicated by Alt-Shift-Enter shortcut)
You can also use following key combinations to zoom arbitrary image fragment or move it:
• Ctrl + Alt + mouse
zooming in by zoom box, “drawn” by mouse
• Ctrl + Alt + Shift + mouse
zooming out by zoom box
• Alt + mouse
panning the image
• Mouse wheel
mouse wheel steering allows to zoom in/zoom out
image on the screen
Following sliders (
,
,
), located at the bottom of the window, are used to set up
brightness, contrast and gamma respectively for the active image.
51
RACURS Co., Ul. Yaroslavskaya, 13-A, office 15, 129366, Moscow, Russia
July 2009
When working with color images there is a possibility to adjust these radiometric parameters
separately by channels (using the buttons
). Right click any slider and select
the option Set original BCG correction to restore BCG settings by default.
Note. Current coordinates of marker on the preview image (in project coordinate
system) are shown in the rightmost field of Status panel. You can copy them to
clipboard (by Ctrl-C) and paste afterward into chosen application (by Ctrl-V)
If you need to setup brightness of one image included to the mosaic select it by click inside
the corresponding ROI (ROIs are displayed by pushing the
icon or using Alt-Z hot
keys). In this case all BCG settings will affect only the selected image.
Note. These settings are memorized and used for output mosaic creation
In the preview window the following main menu icons are used:
•
- opens/hides a window for specifying the Images order for including fragments of
sources images into output mosaic in the overlapping area, see the chapter 8.2.4
Additional recommendations
•
(duplicated by Alt-Z hot keys) - shows/hides regions of interest in preview and
output mosaic windows
•
- shows/hides sheet borders if output mosaic is divided into map sheets (the
appropriate option is ON in Splitting into sheets tab of Parameters window, see the
chapter 10 Splitting mosaic into map sheets)
Select a rectangular area in the Preview window to include only a corresponding portion of
the source block of images into output mosaic. Use mouse move along with pressed Shift
key to draw a rectangle on the image. The polygon can be resized by dragging special marks
on its sides or moved by dragging. See also the chapter 11.2 Building mosaic for the block
fragment.
10. Splitting mosaic into map sheets
Output mosaic could be divided into map sheets. Use the tab Mosaic | Parameters | Split
into sheets (Fig.35) to specify splitting parameters.
©2009
52
PHOTOMOD GeoMosaic 4.4
Fig.35
Use the following ways to split output mosaic into sheets:
Regular splitting – select the option Regular splitting and specify splitting parameters,
see the chapter 10.1 Splitting parameters. At that the whole mosaic is divided into
sequential map sheets according to the parameters selected.
•
Sheets from files – select the option Sheets from files and load sheet borders exported
from PHOTOMOD system resources in txt format (in the window opened by the button
•
•
) or import them from external formats txt, lst, dxf, csv or MIF/MID (in the window
opened by the Import button), see the chapter 10.4 Loading sheet coordinates from the
text file. Besides you can rename files with sheets and frames of mosaic into work
numbers (in the window opened by the CSV button, see the chapter 11.6 Creating
marginalia for mosaic).
By images – borders of images are used as borders of mosaic sheets, if the option By
images is selected. At that each initial image of mosaic project is considered as map
sheet. Sheet names are defined as initial images names in GeoMosaic project (and they
could be changed if necessary). Sheets management (turn ON/OFF, rename) is the
same as for Regular sheets splitting, see the chapter 10.1 Splitting parameters.
If the check box Remove sheets out of project is marked (by default) the map sheets on
the image area which is out of project territory will be not created. If it is necessary to import
and show all sheets irrespective of their location on mosaic project, clear the check box and
re-build the preview to see where the sheets are located.
You can also exclude sheets manually on preview image as described in the chapter 10.2
Splitting preview.
53
RACURS Co., Ul. Yaroslavskaya, 13-A, office 15, 129366, Moscow, Russia
July 2009
10.1. Splitting parameters
If you split the mosaic into Regular sheets or By images, specify the parameters of splitting
in the window opened by the button Parameters from the tab Mosaic | Parameters |
Splitting into sheets.
Fig.36
To change the extents of the mosaic enter new coordinate values of mosaic corners in West,
South text fields. Sheet sizes are defined in Width and Height text fields in meters on the
terrain. As a result number of sheets by X and Y axes are displayed in Number of sheets /
Horizontally and Number of sheets / Vertically text fields. You can also set overlapping
areas of adjacent sheets in meters (Overlap (m) / Horizontally and Overlap (m) /
Vertically).
If the Trim off “null” edges option is on the size of uppermost and rightmost sheets are
changed to cut them off by the mosaic border. In this case number of sheets is calculated
automatically and can not be edited. If this option is off all sheets are of the same size
(defined by Width and Height parameters) and the North and East coordinates are
calculated automatically and can not be edited.
In Sheets base name field you should input “root” name of mosaic sheets (Sheet by
default). At that full file name of the sheet is formed as follows: <Base name (5
characters)>_<literal number of the sheet along the South-North direction (A, B, …,
Z)>_<numerical number of the sheet along the West-East direction (1,2,3,…) >.<file
extension according to the selected file type>.
See also the chapter 10.3 Sheet file names.
Push the button Sheet list to open a window with full information corresponding to current
state of the block sheets: total number of sheets, number of selected sheets to be included
into mosaic and the information about each separate sheet: file name, border and status
(create mosaic / not create mosaic), see Fig.37.
©2009
54
PHOTOMOD GeoMosaic 4.4
Fig.37
In this window you can change the sheet status (create/skip) by checking/clearing the check
box in the Create column.
For editing of file name of selected sheet push the button
(change sheet name) and
input new name in the window appeared. For editing of selected sheet name you can use the
following keys: F2 – to start editing, Enter – to save new name, Esc – to cancel changing.
(rename created sheets),
If you need to change all sheets names push the button
which opens a window intended for renaming of all mosaic sheets in the following way.
Fig.38 Mosaic sheets renaming
Input new sheet name in the Base sheets name field and its starting number in First sheet
number field. In the First sheet panel select the position of a sheet which number is start of
numeration for the whole sheets block. For that indicate a number of row (starting from the
bottom of mosaic scheme) and column (from leftmost one on scheme) in appropriate fields.
You may indicate the direction of renaming (bottom-to-top or top-to-bottom on scheme),
and also input a step value for sheets numeration increasing (in the Sheet number step
field).
For renaming of sheets that are skipped during mosaic creation, mark the Use skipped
sheets check box (they have no numeration by default).
55
RACURS Co., Ul. Yaroslavskaya, 13-A, office 15, 129366, Moscow, Russia
July 2009
You can select all sheets in the list using the icon
selection by the icon
Select all, and invert previous
Invert selection.
To search a sheet by its name or name fragment in the File name column of sheets list,
input symbols into search field and push the button
Find sheet or press Enter.
Save to save sheets borders to file in TXT format, after that input file
Click the icon
name and path in the window opened.
Mosaic sheets parameters created in this window could be exported to TXT, DXF or CSV
format. Push the button
opened.
Export and specify output file name and path in the window
To exit Sheet list window click the icon
or cancel parameters editing by clicking Esc.
Note. Block must contain at least one sheet. When the number of sheets is one its
status is always “To be created” and it cannot be excluded from processing
Once splitting parameters are selected, push OK and open preview window with splitting
results, see the chapter 10.2 Splitting preview.
10.2. Splitting preview
To display the results of splitting mosaic into sheets push the
icon of the main icon bar
or select menu command Mosaic | Preview to open Preview window (Fig.39).
©2009
56
PHOTOMOD GeoMosaic 4.4
Fig.39 Preview of splitting into map sheets
When the button
(Sheet extents) is pushed, click the selected sheet in preview image
and it will be bounded by yellow frame and its file name will be displayed under preview
window. Its Status parameter can be one of two choices – to be created / to be skipped.
The lower string of the window (Status) shows the number of map sheets and a volume of
resulting mosaic in kilobytes.
Frame of a sheet to be created is green and of a sheet to be skipped – red.
To include / exclude selected mosaic sheet from processing (change its status) use mouse
double click in preview window.
You can select and include/exclude a group of map sheets to/from output mosaic on preview
image by the following ways:
•
When using regular or by images splitting on map sheets (see the chapter 10 Splitting
mosaic into map sheets) you can include/exclude sheet's group by frame using mouse
along with Shift key pressed. For that click sheet in a corner of group (its border
becomes yellow), then click opposite corner of a group along with Shift key pressed. If
the first sheet selected was excluded from output mosaic, the whole group of sheets will
be excluded either.
•
When using custom sheets (created using the option Sheets from files, see the chapter
10 Splitting mosaic into map sheets) you can exclude sheets by frame using mouse
along with Ctrl-Shift pressed.
•
To include custom sheets by frame use mouse along with pressed Ctrl key.
57
RACURS Co., Ul. Yaroslavskaya, 13-A, office 15, 129366, Moscow, Russia
July 2009
Sheets renaming is available from contextual menu (opened by right click of sheet on
preview image) (Fig.39). Select command Change sheet name to rename only selected
sheet. Rename created sheets command is intended for renaming of all names of mosaic
sheets using opened window, described in the chapter 10.1 Splitting parameters.
Note. Block must contain at least one sheet. When the number of sheets is one its
status is always “To be created” and it cannot be excluded from processing
You can create frames and marginalia for mosaic sheets in styles and symbols used in
Russian State Land Use Survey in 1:2,000, 1:5,000, 1:10,000 and 1:25,000 map scales for
MicroStation and MapInfo systems, see the chapter 11.6 Creating marginalia for mosaic.
10.3. Sheet file names
Push the File names button in the Mosaic window (opened by the command Mosaic |
Parameters | Split into sheets) to open Sheets file window:
Fig.40
In this window you can edit the file type (its format) and the path to sheet files, where the
sheets are stored after mosaic creation. Files of map sheets have the same format, as the
mosaic, which is not divided into sheets, see the chapter 11.1 Building and viewing mosaic.
10.4. Loading sheet coordinates from the text file
To load coordinates of sheet borders from a text file select the option Sheets extents from
files at the Split into sheets panel. While working in this mode you can not change splitting
parameters (the Parameters button is inactive), since full splitting information is stored in the
text file. You can also import sheets coordinates by clicking the Import button on Split into
sheets tab. It allows to import file with map sheets borders to the following formats: .txt, .lst,
.dxf, .csv or MIF/MID.
At that you can change coordinate system from left- to right-handed or vice versa, by
checking the option Swap X, Y.
When importing sheets from MIF/MID format you can import sheets' names from attribute.
Input attribute name (ID or Orto) containing names of map sheets to be imported in the
Attribute with sheet names field in window of import parameters.
©2009
58
PHOTOMOD GeoMosaic 4.4
Fig.41 Import sheets from file
A sample of the file with sheet borders (coordinates of corners) in text format:
[MainSection]
SheetCount=5
[Sheet0]
Name="Sheet_1.tif"
X0=535017.208
Y0=164805.265
X1=535517.248
Y1=164805.265
X2=535517.248
Y2=165305.305
X3=535017.208
Y3=165305.305
[Sheet1]
Name="Sheet_2.tif"
X0=535517.208
Y0=164805.265
X1=536017.248
Y1=164805.265
X2=536017.248
Y2=165305.305
X3=535517.208
Y3=165305.305
[Sheet2]
Name="Sheet_3.tif"
X0=536017.208
Y0=164805.265
X1=536517.248
Y1=164805.265
X2=536517.248
Y2=165305.305
X3=536017.208
Y3=165305.305
[Sheet3]
Name="Sheet_4.tif"
X0=536517.208
Y0=164805.265
X1=537017.248
59
RACURS Co., Ul. Yaroslavskaya, 13-A, office 15, 129366, Moscow, Russia
July 2009
Y1=164805.265
X2=537017.248
Y2=165305.305
X3=536517.208
Y3=165305.305
[Sheet4]
Name="Sheet_5.tif"
X0=535017.208
Y0=165305.265
X1=535517.248
Y1=165305.265
X2=535517.248
Y2=165805.305
X3=535017.208
Y3=165805.305
Note. If borders are loaded from text file, the sheets can be of any convex quadrangle
shape (for example – a trapeze)
11. Building mosaic
11.1. Building and viewing mosaic
Mosaic creation is started by menu command Mosaic | Build! or by clicking the icon
of
the main icon bar, that opens standard OS Windows dialog of output file name selection
(Save as window). In case of splitting the mosaic into sheets (if the appropriate option is ON,
see the chapter 10 Splitting mosaic into map sheets), the dialogue of file name input
appears, where you should input file name of output map sheets (see the chapter 10.3 Sheet
file names).
©2009
60
PHOTOMOD GeoMosaic 4.4
Fig.42 Selecting output mosaic format
Mosaic image is created in the following output formats selected from drop-down list:
•
•
•
•
•
•
•
•
•
•
•
Tag Image File Format (TIFF) – allows to save output mosaic with or without JPEG
compression (depending on the option in Mosaic | Parameters | Mosaic window, see
the chapter 8.1 Mosaic)
Windows Bitmap File (BMP)
VectOr format (see the chapter 12 Export mosaic to PHOTOMOD VectOr)
GeoTIFF – TIFF format, containing special tags with georeference. This option is not
available for local and Cartesian coordinate systems
ERDAS IMAGINE (IMG) – raster format of ERDAS system
NITF (NITF)
JPEG (JPEG)
PNG (PNG)
DGN (DGN) – raster format of MicroStation system, allows to save adaptive color palette
for output mosaic
PCIDSK (PIX) – raster format with georeference data in its header, developed by PCI
Geomatics
JPEG2000 (JP2) – raster format with jpeg-compressing and georeference data in its
header, output image in this format has limited volume up to 500 Mb.
After path and file name input push the Save button to start mosaic creation. At that
georeference file is saved along with mosaic file in the same folder, see the chapter 15
Georeference file.
When the building is complete a window with output mosaic opens, if the option Display
output mosaic is ON (see the chapter 8.4 Preferences).
61
RACURS Co., Ul. Yaroslavskaya, 13-A, office 15, 129366, Moscow, Russia
July 2009
Fig.43 Mosaic window
At the lower left part of Mosaic window there are standard icons for raster image managing:
•
- one step zooming out (duplicated by “/” key)
•
- one step zooming out (duplicated by “/” key) for all images opened
•
- 1:1 mode (image cell corresponds to the screen pixel) (duplicated by Alt-1 keys)
•
- one step zooming in (duplicated by “*” key)
•
- one step zooming in (duplicated by “*” key) for all images opened
•
- fitting the whole image into the window (duplicated by Alt-Enter keys)
•
- fitting the whole image into the window for all images opened in block scheme
(duplicated by Alt-Shift-Enter keys)
You can also use following key combinations to zoom arbitrary image fragment or move it:
• Ctrl + Alt + mouse
zooming in by zoom box, “drawn” by mouse
• Ctrl + Alt + Shift + mouse
zooming out by zoom box
• Alt + mouse
panning the image
• Mouse wheel
mouse wheel steering allows to zoom in/zoom out
image on the screen
Following sliders (
,
,
), located at the bottom of the window, are used to set up
brightness, contrast and gamma respectively for the active image.
©2009
62
PHOTOMOD GeoMosaic 4.4
When working with color images there is a possibility to adjust these radiometric parameters
separately by channels (using the buttons
). Right click any slider and select
the option Set original BCG correction to restore BCG settings by default.
Note. These settings are temporary and do not affect the mosaic file
Show the regions of interest on the output mosaic by pushing the icon
keys), that allows also using export/import operations for ROI’s.
(or Alt-Z hot
Note. Current coordinates of marker on the preview image (in project coordinate
system) are shown in the rightmost field of Status panel. You can copy them to
clipboard (by Ctrl-C) and paste afterward into chosen application (by Ctrl-V)
11.2. Building mosaic for the block fragment
You can select a rectangular area in the Preview window (see the chapter 9 Mosaic preview)
to create mosaic only for corresponding portion of the source block of images. Use Shift +
left mouse button to draw a rectangle on the image. You can resize the polygon by
dragging special marks on its sides or move it by the mouse. To input coordinates of the
fragment corners from the keyboard use the Coordinates window, opened by menu
command Mosaic | Coordinates or by the icon
. Once the fragment is specified, start
mosaicking in a standard way (by clicking the
icon or menu command Mosaic | Build!).
This mode is useful for quick visual results control on small mosaic portions.
11.3. Mosaic editing in Dust Correct application
After mosaic building you can “clean” the artifacts there – images of dust particles, photo
emulsion defects etc. For this purpose you can use special application Dust Correct, which
opens by pushing the icon
in main menu of PHOTOMOD GeoMosaic module.
Note. Dust Correct application works with the images in Windows BMP and Stripped
SingleScale TIFF formats without compression. If you try to open the image of any
other format, it is opened in “read only” mode
Open the image selected from the list appeared after clicking main menu command File |
Open image or the hot keys Ctrl-O or pushing the icon
.
For the convenient searching for the artifact, zoom in the initial image (by hot key “*”, for
instance) and find the defect while panning the image by hot keys Alt-mouse or by the
keyboard (Shift-keyboard arrows). Then select the fragment containing not only artifact, but
also an image part with similar texture for substitute (cleaning) the image.
63
RACURS Co., Ul. Yaroslavskaya, 13-A, office 15, 129366, Moscow, Russia
July 2009
Fig.44 Image processing result in Dust Correct application window
For selecting the fragment by green frame use Shift-mouse combination, to cancel selection
click Esc.
You may open and edit the fragment selected either in PHOTOMOD built-in editor or in
external software. To open selected image in built-in editor open the Parameters panel using
menu command Parameters | Parameters and check out the option Use internal editor
(Fig.45).
©2009
64
PHOTOMOD GeoMosaic 4.4
Fig.45
Then copy the fragment to the clipboard (using standard OS Windows command – Ctrl-C or
Copy to clipboard of Dust Correct toolbar). After that, the Editor
pushing the icon
window containing the fragment selected opens.
Fig.46 Editor window
In the Editor window place the mouse cursor in the “source point” (by Shift-mouse click) –
the exact place where the image texture fits closely the needed one. At that you can set the
aperture value (in the upper numeric field
) – the diameter of the circle around
the “source point”, which is the source of the “patch” texture. Afterwards clean the artifact
using mouse moves. Use the following buttons to perform undo/redo operations:
- undo all – to cancel all actions in the Editor window
(or Ctrl-Z shortcut) - cancel – to cancel the last action in the Editor window
(or Shift-Ctrl-Z shortcut) - redo – to redo cancelled action.
65
RACURS Co., Ul. Yaroslavskaya, 13-A, office 15, 129366, Moscow, Russia
July 2009
When obtained satisfying result push the icon
that closes the Editor window and pastes
edited fragment to Dust Correct window. To cancel editing results and exit without image
change, just close the Editor window.
If you prefer to edit the image in the external graphic software, copy the image or its fragment
there by standard OS Windows operations copy/paste (Ctrl-C/Ctrl-V) or use the icons
Paste from clipboard. At that the option Use internal editor
Copy to clipboard and
in Parameters panel (opened by menu command Parameters | Parameters, see Fig.31)
should be cleared.
The icon
(Disable changes) or Ctrl-L shortcut is used for fixation of the fragment frame
size, intended for external editing (to fit its former place after editing).
Use the icon
module.
or hot keys Ctrl-F4 to close the image without exit from DustCorrect
11.4. Measurements over mosaic
There is a possibility to make control measurements of distances on the mosaic. Just click
left mouse button, drag a line to the point you need and release the button. You will get a
distance value L displayed at the bottom of window.
11.5. Loading mosaic
You can load and view previously created orthomosaic (using menu command Mosaic |
Open or the icon
•
•
•
•
•
•
•
•
•
or hot keys Ctrl-Alt-O) from the following formats:
Tag Image File Format (TIFF) – selected folder should contain tiff file with mosaic and
also georeference file with the same name (see the chapter 15 Georeference file).
Windows Bitmap File (BMP)
VectOr (SIT, RSW, MTW) – raster format of PHOTOMOD VectOr system, see the
chapter 12 Export of mosaic to PHOTOMOD VectOr
IMG – raster format of ERDAS system
NITF
JPEG
GIF
PNG
USGS DEM (DEM).
11.6. Creating marginalia for mosaic
It is possible to create map frame and marginalia in styles and symbols used in Russian
State Land Use Survey in 1:2,000, 1:5 000, 1:10 000 and 1:25 000 map scales for
MicroStation and MapInfo systems, using the command Mosaic | Create marginalia.
©2009
66
PHOTOMOD GeoMosaic 4.4
12. Export of mosaic to PHOTOMOD VectOr
PHOTOMOD VectOr is a GIS and Desktop Cartography module of PHOTOMOD system,
used basically for creating and printing out digital maps (see VectOr User Manual).
PHOTOMOD GeoMosaic supplies export of orthomosaic and corresponding DEM to
PHOTOMOD VectOr.
To export mosaic to VectOr format, select menu command Mosaic | Build! and specify
output file type as VectOr (RSW).
Fig.47 Map file selection dialog
In the window opened input the name and path of output mosaic in SIT file name field.
In case of new VectOr map creation you get a dialog with the following fields to be filled in:
Fig.48
•
•
•
SIT scale – select the scale of output mosaic (1:2,000 by default)
Work area name – arbitrary name of output map region (up to 31 character)
Resource file name – name of file with a map symbol library (.rsc file). Several standard
“classifiers” for different map scales are included to PHOTOMOD system (stored in
PHOTOMOD \ VectOr folder). See also GIS VectOr User Manual.
Note. Since VectOr always works with a left-handed coordinate system (X – to the
north, Y – to the east) mosaic coordinates will be swapped accordingly
Click the button Continue to start creating mosaic in GIS VectOr format.
13. Pan sharpening operation
PHOTOMOD GeoMosaic module allows to perform pan sharpening operation which
includes merging of color (or multispectral) image with panchromatic one with higher spatial
resolution, that leads to creation of color image with high spatial resolution.
67
RACURS Co., Ul. Yaroslavskaya, 13-A, office 15, 129366, Moscow, Russia
July 2009
Initial images used for this operation should be georeferenced. If there is no reference to
coordinate system, use raster georeference window, see the chapter 7.4 Raster image
georeferencing.
Fig.49 Georeferencing of initial color image
on toolbar (or select menu command Service | Pan sharpening),
Than push the button
and in dialogue opened select file with images to perform pan sharpening:
©2009
68
PHOTOMOD GeoMosaic 4.4
Fig.50 Pan sharpening parameters
Input path to initial images in two upper fields of the window – High resolution image
(grayscale) and Low resolution image (color).
To select file name and format of output image click the button
in Pan-sharpened
image field and input image file name and select its format in drop-down list in the window
opened.
PHOTOMOD GeoMosaic system allows to create pan-sharpened images in the following
output formats selected from drop-down list:
•
•
•
•
•
•
•
•
•
•
•
69
Tag Image File Format (TIFF) – allows to save output file with or without JPEG
compression (depending on the option in the Compression panel, see below)
Windows Bitmap File (BMP)
GIS Panorama raster map (RSW) – raster format of Panorama system (see the chapter
12 Export mosaic to PHOTOMOD VectOr)
GeoTIFF – TIFF format, containing special tags with georeference
ERDAS IMAGINE (IMG) – raster format of ERDAS system
NITF (NITF)
JPEG (JPEG)
PNG (PNG)
DGN (DGN) – raster format of MicroStation system
PCIDSK (PIX) – raster format with georeference data in its header, developed by PCI
Geomatics
JPEG2000 (JP2) – raster format with jpeg-compressing and georeference data in its
header, output image in this format has limited volume up to 500 Mb.
RACURS Co., Ul. Yaroslavskaya, 13-A, office 15, 129366, Moscow, Russia
July 2009
Pan sharpening operation is performed using one of three methods: HSV, Brovey and
Principal components. If you need to obtain different result select another method, using
Pan sharpening method drop-down list.
Usually it is not easy to predict in advance how the results of each method will differ. One or
another way would be preferable depending on input images type. HSV and Principal
components methods allow to obtain similar results on images, where there is no evident
dominance or lack of some color. Brovey algorithm is close to them on images with average
brightness, but differs on darkened or too bright images. It is also hard enough to define
preliminary what color balancing parameters to choose.
Note: it is recommended first to perform pan sharpening operation for image fragment
to adjust the method and color balancing parameters, and then apply them to the
whole image and to other similar images
You can process some part of an image when the option Use fragment is marked. Push the
button Select fragment and select the fragment in the opened window. For that drag green
frame by mouse along with pressed Shift key. You can move the frame over the image by
mouse along with pressed Ctrl key. To resize the frame drag small squares on its sides by
the mouse. Press Esc to cancel fragment selection. If you are satisfied with the fragment
selected (push OK) or press Enter to save selection and close window. Push Cancel to
close the window without changes.
For speeding up the scaling of output image mark Create MS TIFF check box, that will allow
to create pyramid levels in output image of TIFF or GeoTIFF format.
Check the option TIFF, JPEG compression in the Compression panel to reduce the output
image (JPEG compression will be applied to TIFF files) and then select the level of
compression using Image quality slider. The value of compression is 75% by default (as a
rule, it allows to compress the image 5-7 times more).
The color of output image is adjusted using the options Interpolate color image, Correct
colors use spectrum, Correct colors use area, described in the chapter 13.1 Color
balancing of output image.
When all parameters are set up push the OK button to start the process of pan-sharpened
image creation. At that the accompanying georeference file will be saved to the same folder
in format selected in the Georeference file drop-down list (see the chapter 15 Georeference
file).
After completing the process the output image window is opened.
13.1. Color balancing of output image
Prior to color balancing parameters adjustment you should keep in mind that the closer the
colors of output image to colors of the initial raster, the more loss of output image details.
The following options of Pan sharpening parameters window are used for color balancing of
output image.
©2009
70
PHOTOMOD GeoMosaic 4.4
Fig.51 Color balance parameters
The checkbox Interpolate color image is marked by default. In this case, color bilinear
interpolation in frames of one pixel of initial color raster. It is recommended to use the option
in most cases, except those rare ones when the interpolation clearly leads to image
sharpness deterioration.
Fig.52 Pan sharpening result using Brovey method without interpolation of color image (left)
or with interpolation (right)
71
RACURS Co., Ul. Yaroslavskaya, 13-A, office 15, 129366, Moscow, Russia
July 2009
When the interpolation is not used (the option is Interpolate color image cleared), small
squares with pixel size corresponding to initial color raster are clearly visible on output
image, that is undesirable in most cases.
For some images it would be enough to apply one of two other methods along with
interpolation to obtain an acceptable result.
Fig.53 Initial color image (left) and the result of pan sharpening operation by Brovey method
with color raster interpolation option
Pan sharpening operation leads unavoidably to some distortion of initial colors. Sometimes it
is insignificant as shown on the Fig.53 above, and sometimes it is essential enough. For
instance, the output image may acquire gloomy grey tint, or vegetation may become bright
green too much, etc. In order to correct color during pan sharpening you may use an
additional options.
When using the option Spectral color correction (see Fig.51) the color of each pixel will be
changed to make it maximally similar to the color of appropriate pixel of initial color image
without visible deterioration of output image sharpness.
Push the button
using spectrum.
©2009
to open a window allowing to setup parameters of color correction
72
PHOTOMOD GeoMosaic 4.4
Fig.54 Color correction using spectrum
The window is intended for adjustment of the following parameters:
73
•
When the option Automatic correction is on (by default) the spectral parameters of
initial raster are analyzed and used for pan sharpening (see Fig.55). At that the color
correction level management (using the Level slider) becomes available.
•
Level. Zero percent value (leftmost slider position) turns off automatic correction using
color (clears the Automatic correction checkbox), hundred percent value (rightmost
slider position) – maximal possible correction means that output image get minimal
details, but colors will be maximally close to input image colors. Correction level
change allows to pass gradually from one of these limits to another. It is
recommended to reduce the level when you need to increase a level of details (at that
output image often becomes somehow grayish), or to raise the level if you need to
enhance color rendering.
•
Method. Is used both with automatic correction and without it. When using the
Equalization method the color which is linear combination of color pixel on input color
raster and corrected color is assigned to each pixel. It allows to approximate resulting
image color to initial one, along with smoothing of black-and-white image contrast. At
that some blurriness of resulting image details may occur.
•
Clear hue brightness – correction parameters used both with automatic correction
and without it. The example of these controls use is brightness decreasing of
vegetation green color (see Fig.56, 57). Each of three sliders influences on color
correction in the area where the value of an appropriate channel prevails. I.e. the red
slider adjusting results in visualization of red areas on pan-sharpened image, the blue
slider – for blue areas, the green one – for green. Generally it leads to change of color
value of selected channel, but it could not be considered as usual monotonous
brightness change. When the parameter value is less than 0.5 the appropriate
brightness it will be decreased, if it is more than 0.5 – it will be increased. If brightness
of some color is setup it its average value (the slider position is in 50%), this color
channel will be not corrected.
RACURS Co., Ul. Yaroslavskaya, 13-A, office 15, 129366, Moscow, Russia
July 2009
Fig.55 Initial color image (left), pan sharpening operation result by Brovey method without
color correction (in center), with automatic correction (right)
Fig.56 Initial color image (left), pan sharpening operation result by Brovey method without
color correction (right)
©2009
74
PHOTOMOD GeoMosaic 4.4
Fig.57 Result of the same operation when the green color brightness is reduced
In some cases you can use the option Neighbor color correction (see Fig.51). At that each
pixel of color image gets its color from an average color of its neighbors considering weight
coefficients. Neighbor color correction algorithm is also helpful when it is necessary to obtain
an image with objects of more similar color, and also for images with poor georeference,
when there is noticeable shift of objects on color and b/w images. In this case the correction
may result in some sharpening of objects' contours (see Fig. 60).
Push the button
correction process.
to open the following window to setup parameters of neighbor color
Fig.58 Neighbor color correction parameters
The window is intended for adjustment of the following parameters:
•
75
Aperture size – size of neighboring area around pixel to be processed measured in
pixels of color raster. For instance, Fig.59 shows that hatched pixel is surrounded by
3x3 pixels area, which color values will be used for measuring of central pixel color. So
the aperture in this case is 3. Maximal allowed aperture size is 9.
RACURS Co., Ul. Yaroslavskaya, 13-A, office 15, 129366, Moscow, Russia
July 2009
Fig.59 Aperture size around pixel with color to be defined
•
Grey threshold – averaging is performed only for those pixels where grey color
intensity in appropriate pixels of b/w raster differs from the current pixel intensity not
more then for the threshold defined.
•
RGB threshold – averaging is performed only for those pixels where the value of
each channel differs from the value in the current pixel not more then for the threshold
defined.
Color intensity thresholds may vary from 0 to 255. If the threshold value is 255 (maximal
value) averaging will be executed in the whole neighborhood.
Fig.60 Pan sharpening operation result by Brovey method without color correction (left) and
using neighbor color correction (right)
When using default parameters you will get only insignificant color correction, almost
unnoticed for eyes. On example shown on Fig.60 are used the following settings: aperture
size – 7, grey threshold – 25, RGB threshold – 70. The option Neighbor color correction is
off by default. When the thresholds have big values the aureole around objects may appear
when using this option, and also the color of whole image may worsen.
©2009
76
PHOTOMOD GeoMosaic 4.4
Note: it is recommended to use the Neighbor color correction option very carefully.
Along with image improvement in some part of image, it would result in quality
worsening in other parts
14. Coordinate system transformation
Coordinate system could be selected both for initial images and for resulting mosaic if
necessary. The coordinate system transformation is started on Mosaic tab in Preferences
window (see the chapter 8.1 Mosaic) if the option Set coordinate system is ON. Push the
button
project.
and open the window used for changing the initial coordinate system of mosaic
Fig.61
Upper field of this window is intended for selecting of coordinate systems database from set
of databases included to PHOTOMOD GeoMosaic, and opened after pushing the Select
button.
Fig.62
After that select coordinate system of initial images in the Input coordinate system field. If
initial images are linked to different coordinate systems, choose appropriate coordinate
system for each image individually or for all images of the project, by selecting options For
each image or For all. When choosing coordinate system for individual image, push the
Select button and select individual image and its coordinate system (by the button
opened window with list of project images.
77
) in
RACURS Co., Ul. Yaroslavskaya, 13-A, office 15, 129366, Moscow, Russia
July 2009
Coordinate system selection and working with it including creating new one in opened
window is described in the chapter 16 Coordinate systems.
Fig.63 Coordinate system selection for the individual image
Then in the window Coordinate systems select output coordinate system in the same way
(by pushing the button Change in Input coordinate system field) for referencing the
resulting mosaic.
Once all the above parameters are setup push OK button to start coordinate system
transformation.
Note. You can specify path to coordinate system database manually, it is stored by
default in the following folder C:/Program files/PHOTOMOD GeoMosaic/CoordSys
15. Georeference file
When the mosaic file is created the georeference file is saved to the same folder. This file is
used for referencing the mosaic to the coordinate system and has formats, described in the
chapter 15.1 PHOTOMOD Geo file, 15.2 ArcWorld file and 15.3 MapInfo file. The
georeference file format is selected on the tab Mosaic | Parameters | Mosaic (see the
chapter 8.1 Mosaic).
Note. In case of mosaic export to GeoTIFF, VectOr, MicroStation, ERDAS Imagine the
georeference information is stored directly in the file and the separate georeference
file is not created
©2009
78
PHOTOMOD GeoMosaic 4.4
15.1. PHOTOMOD Geo file
PHOTOMOD georeference file has .geo extension and contains pixel and ground
coordinates of 4 mosaic cells as well as cell size by X and Y axes in given units.
Example of geo file:
Mosaic created by PHOTOMOD 10.01.07
Units: (m)
Linscale: 8.600
Colscale: 8.600
(0.5, 0.5) (8271360.000 East, 1857514.200 North)
(0.5, 2446.5) (8271360.000 East, 1836470.000 North)
(2612.5, 0.5) (8293831.800 East, 1857514.200 North)
(2612.5, 2446.5) (8293831.800 East, 1836470.000 North)
Coordinate system: UTM, (North)
15.2. Arc World file
Georeference file, used by Arc INFO (.tfw extension at export to TIFF format)
Example of .tfw file:
1.000000
0.000000
0.000000
-1.000000
551286.128054
200588.824470
After mosaic export to other formats georeference files (of text format likewise .tfw file) are
created with the following extensions:
After export to BMP georeference file with .bpw extension is created.
After export to JPG georeference file with .jgw extension is created.
After export to NITF georeference file with .nfw extension is created.
After export to DGN georeference file with .dgw extension is created.
After export to PNG georeference file with .pgw extension is created.
15.3. MapInfo file
Georeference file, used by MapInfo (.tab extension)
Example of .tab file:
!table
!version 300
!charset WindowsLatin1
Definition table
File "mosaic.tif"
Type "RASTER"
(143424.937,2635592.133) (0,0) Label "Point 1",
(224834.937,2635592.133) (1163,0) Label "Point 2",
(143424.937,2565592.133) (0,1000) Label "Point 3",
79
RACURS Co., Ul. Yaroslavskaya, 13-A, office 15, 129366, Moscow, Russia
July 2009
(224834.937,2565592.133) (1163,1000) Label "Point 4"
CoordSys Earth Projection 8, 104, "m", 33.000000, 0.000000, 0.999600, 500000.000000,
0.000000
16. Coordinate systems
16.1. Selecting coordinate system
Coordinate systems databases are installed automatically along with PHOTOMOD
GeoMosaic program. You can use special window to change coordinate system of mosaic
project, see the chapter 14 Coordinate system transformation. After database selection you
can select coordinate system in the list, edit its parameters (such as cartographic projection,
datum, ellipsoid, etc.) or create a new one. See also the chapter 16.2 Coordinate system
database, 16.4 Coordinate system editing and 16.5 Coordinate system creating.
Click the Open button to open the window with coordinates systems list included to selected
base. For the quick search of needed system, input coordinate system name or key word into
the Search field (fig.64) and choose the search direction: down (the
button) or up (the
button) the list.
Fig.64 Coordinate system database search
The arrow in the leftmost column marks the name of first coordinate system found with the
name searched.
You can edit, export or delete the coordinate system selected. And also you can create new
one or import existing using an appropriate buttons of this window (see also the chapters
16.4 Coordinate system editing and 16.5 Coordinate system creating).
16.2. Coordinate system database
Coordinate systems database includes a list of coordinate systems supported by GeoTIFF
format used to store georeferenced raster images (standard of EPSG – European Petroleum
Survey Group).
©2009
80
PHOTOMOD GeoMosaic 4.4
Fig.65 Coordinate systems database
Besides the EPSG database there are Cartesian (on the plane) and Local (the Earth is
approximated by sphere) coordinate systems added. The Cartesian coordinate system is
used for relatively small blocks of large scale aerial images. The coordinate systems are
created separately for each zone. So if you have a project covering several zones all ground
control point coordinates must be recalculated to the coordinate system of one zone. The
name of coordinate system looks like NAD83 / UTM zone 30N, where NAD83 is a datum,
UTM is a coordinate system, 30 is a number of zone and N is a hemisphere (north).
Select the coordinate system and click OK button to assign it to the project. See also the
chapter 16.4 Coordinate system editing.
16.3. Types of coordinate systems
Coordinate system types (the list is open by the New button of Select reference system
window) are as follows:
• Geocentric – coordinate system with the origin in the mass center of the Earth. At that Z
axis is oriented to the North pole, X axis to the intersection point of Greenwich meridian
and equator, and Y axis to the East
• Latitude / longitude – geographic (latitude / longitude / height) coordinate system
• Local Cartesian – coordinate system on the plane
• Local curved – coordinate system on the sphere
• Projected – coordinate system defined by the map projection
• Topocentric horizontal – coordinate system with the origin in the selected space point.
At that X axis lies in the plain of origin meridian, Z axis lies on ellipsoid surface normal in
origin, and Y axis is oriented in the following way: in left coordinate system it is Eastward,
and in right – Northward.
Note. PHOTOMOD GeoMosaic does not work with Geodetic coordinate systems, so if
you need to process such data you should convert ground control points coordinates
81
RACURS Co., Ul. Yaroslavskaya, 13-A, office 15, 129366, Moscow, Russia
July 2009
to selected Projected coordinate system using Geodetic calculator included to the
PHOTOMOD GeoMosaic installation kit (see the chapter 17 Geodetic calculator)
16.4. Coordinate system editing
In very most cases you need just pre-defined coordinate systems included to the database.
Nevertheless PHOTOMOD GeoMosaic provides all necessary tools for editing coordinate
system parameters. For example you want to change the ellipsoid in UTM coordinate system
from NAD 83 to WGS 84. For this purpose you should:
- open coordinate system database
- select coordinate system (for example NAD83 / UTM zone 30N)
- push the Edit button
-
select Ellipsoid option in the opened window and push the
select WGS-84 ellipsoid in the list appeared
push OK
button at the left
In the same way you can change all other coordinate system parameters such as datum,
map projection, ellipsoid parameters and so on (see also the chapter 16.5 Coordinate system
creating).
16.5. Coordinate system creating
Let’s consider a sample of coordinate system creation. For example you need to create a
coordinate system in Transverse Mercator map projection for the area of 8th zone (origin
meridian 136 degrees) of the north hemisphere on the ellipsoid WGS-84. In this case do the
following:
- open a window of coordinate system database selection (Project | New | Coordinate
system or Project | Properties | Coordinate system)
- select coordinate system database
- push the New button in appeared window, which contains the list of available coordinate
systems
- select reference system type as Projected (Select reference system type window)
Fig.66 Coordinate system type selection
-
push OK
fill out the following fields of Edit projected reference system window:
− Name – arbitrary name (for example UTM, 8N zone)
©2009
82
PHOTOMOD GeoMosaic 4.4
−
−
−
−
−
−
Abbreviation – arbitrary short name
Description – arbitrary description
Datum – select datum World Geodetic System 1984, (WGS 84 ellipsoid will be
displayed in Ellipsoid field automatically)
Prime meridian – select Greenwich from the list
Linear units – select Meters from the list
Axis names – set names for axis as E, N, H
Fig.67 Coordinate system parameters
-
Push the
button in Map projection field and select UTM zone 8N in Select map
projection window
Fig.68 Map projection selection
83
RACURS Co., Ul. Yaroslavskaya, 13-A, office 15, 129366, Moscow, Russia
July 2009
-
Push OK
PHOTOMOD GeoMosaic module includes parameters of predefined geoid (EGM-96 – Earth
Gravity Model-1996) you may need to recalculate height system of your GeoMosaic project.
Mark this option in the Height system panel to use this geoid to set heights in coordinate
system. There is also an opportunity to set up heights using user-defined geoid.
You can also set map projection parameters manually. In this case push the New button in
the Select map projection window.
Select the following parameters in Edit map projection window:
-
Push the
button in Projection type field and select UTM (6 degree zones) in the list
appeared
Click hemisphere field and select N (Northern) in drop-down list
Click zone field and select 8 in drop-down list
Fig.69 Creating map projection
Note. Do not input zone number while editing or creating map projection, since it is
included to Reference system name (see Fig.60, 61)
Another way to select map projection is to use Transverse Mercator projection with full list of
parameters. In this case you should set the following values in Edit map projection window:
©2009
84
PHOTOMOD GeoMosaic 4.4
Fig.70 Creating map projection
-
projection type – Transverse Mercator
central meridian longitude – -135.0
latitude of origin – 0.0
central meridian scale factor – 0.9996
false easting at origin – 500000.0
false northing at origin – 0.0
In case of selecting Projection type as UTM (6 degree zones) these parameters are set
automatically, so this sample just shows the system flexibility.
17. Geodetic calculator
An additional PHOTOMOD GeoMosaic system utility, intended for recalculating of ground
control points coordinates from one coordinate system into another.
Geodetic Calculator is running from OS Windows Start menu: Start | Programs |
PHOTOMOD GeoMosaic | Geodetic calculator.
At first program launch you should specify the path to folder containing coordinate systems
database in the following window.
85
RACURS Co., Ul. Yaroslavskaya, 13-A, office 15, 129366, Moscow, Russia
July 2009
Fig.71 Selection of folder with coordinate system database
Then the dialogue of the program settings is opened, (also could be opened using menu
command Tools | Options, or the icon
Options). Upper panel of the window –
Database directory – shows the folder selected, and allows to change the path to database
directory if needed.
If coordinates calculations have poor result the field with invalid value is shown in red color
(by default) or by color selected in drop-down list of Colors panel.
Fig.72 Program settings
Interface mode panel allows to select one of two working modes: Standard and Advanced
which have different set of menu commands (appeared after pushing Database menu item)
for work with coordinate systems database. See also the chapter 16 Coordinate systems.
Standard set of Database menu contains the following items:
©2009
86
PHOTOMOD GeoMosaic 4.4
Advanced set of Database menu contains the following items:
After pushing OK in Options window the main PHOTOMOD GeoCalculator window is
opened.
Fig.73
87
RACURS Co., Ul. Yaroslavskaya, 13-A, office 15, 129366, Moscow, Russia
July 2009
For example, you have initial GCP coordinates set in geodetic coordinate system (Lat, Long,
H). To re-calculate them into Cartesian you should do the following.
Push the Select button in Reference system field of the left panel (or Ctrl-L hot keys) and
select appropriate coordinate system in which input GCP’s were measured. Then load ASCII
file with points coordinates (use the Load button in Points field, or Ctrl-Alt-L hot keys).
In the right panel in Reference system field exactly in the same way you may select the
resulting coordinate system (from Cartesian ones available) and recalculate the coordinates
(use the Calculate button under right Points field or the icon
Calculate from left to
right). After that, in the right Points field new GCP coordinates appear. Save the result (use
the Save button under right Points field) in txt file and use it in further work with
PHOTOMOD project.
Operations of point’s coordinates selection and recalculation may be performed both from left
to right panel (as described above) and vice versa – from right to left panel. In the latter case
use the icon
Calculate from right to left.
Fig.74
Besides, PHOTOMOD GeoCalculator allows to view, select, edit and also export/import
coordinate systems databases using main menu item Database (Fig.74). See also the
chapter 16 Coordinate systems.
©2009
88
PHOTOMOD GeoMosaic 4.4
18. PHOTOMOD MSTiff Maker utility
In some cases when you create the projects with big number of images located on different
media and which occupy a huge disk space, it is convenient to transfer them into
PHOTOMOD MSTiff format even prior to new project creation. This format allows to speed
up the access to the initial raster image and also to save disk space. For such transfer use
the utility, opened by the following command: Start | Programs | PHOTOMOD GeoMosaic |
Utilities | PHOTOMOD MSTiff Maker.
Fig.75 MSTiff Maker window
In Source images window select the folder with images (upper window) and Tiff files stored
there (lower window). You can add/exclude images files from Processing list window using
arrow buttons located between the windows. Click these buttons to collect the set of images
from different folders/computers to convert them afterwards in PHOTOMOD MSTiff format.
The Conversion settings panel allows to set up the following parameters of image
conversion:
• Target folder – pop-down list to select the folder for resulting images storing;
• File names modification – to add name prefix (Add prefix field) or suffix (Add suffix) to
images names group;
• Compress % – to specify initial images compression level after the conversion, 80% – by
default;
• Decompress – to allow decompressing of compressed images while converting.
If target folder already contains files with the same names, you can overwrite them by new
ones turning on the Overwrite existing files option.
The buttons Start, Pause, Cancel, and Close are used for converting process management
and Ready, Current and Total fields – to view the process state.
89
RACURS Co., Ul. Yaroslavskaya, 13-A, office 15, 129366, Moscow, Russia
July 2009
19. PHOTOMOD ImageProcessor
The application (opened by pushing the button
on toolbar or by menu command Service
| ImageProcessor) is intended for radiometric correction and geometric transformations of
raster images or their fragments, and also includes saving and printing options.
Fig.76 PHOTOMOD ImageProcessor utility window
19.1. Menu commands
Main menu contains the following items and commands.
File – used to open, save, print and close images, and contains the following commands:
•
•
•
•
•
•
•
Open (duplicated by the button
) – opens file in raster format (listed below) in the
application window
Save – saves the image without changing its name and format
Save as (duplicated by the button
) – saves the image in selected format
considering user's settings, see the chapter 19.3.6 Image saving
Close – closes active image window
Close all – closes all image windows
) – opens a window to setup and start printing of
Print (duplicated by the button
active window image (see the chapter 19.3.5 Image printing)
Exit – closes application window.
ROI – used for operations with raster image fragment (see the chapter 19.3.4 Operations
with image fragment) and contains the following commands:
• Copy (duplicated by Ctrl-C shortcut) – copies selected ROI to clipboard
©2009
90
PHOTOMOD GeoMosaic 4.4
•
•
•
Paste as new image (duplicated by Shift-Ctrl-V shortcut) – pasts selected ROI to
new window
Full image (duplicated by Alt-Enter shortcut) – shows image in window at full
Delete (duplicated by clicking the Delete button) – cancels fragment selection and
deletes its frame
Processing – used for image transformations (see the chapter 19.2.1 Radiometric
correction, 19.2.2 Geometric transformations) and contains the following commands:
•
Color channels (duplicated by the button
•
Auto levels (duplicated by the button
•
Curves (duplicated by the button
•
Brightness-Contrast-Gamma (duplicated by the button
•
Color balance (duplicated by the button
•
Filters (duplicated by the button
•
Rotate-Flip (duplicated by the button
•
Resize (duplicated by the button
•
Raster expansion (duplicated by the button
•
Trim edges (duplicated by the button
•
Undo all (duplicated by the button
•
Cancel (duplicated by the button
•
•
) – cancels the last undo operation
Redo (duplicated by the button
Batch – opens a window used to process a set of images, see the chapter 19.2.3
Batch processing.
)
)
)
)
)
)
)
)
)
)
) – cancels all performed operations
) – cancels the last operation
Windows – used for windows location management and contains the following commands:
• Cascade – displays windows stacked and cascading from the upper left to the lower
right of the screen
• Tile vertically – displays windows edge to edge vertically
• Tile horizontally – displays windows edge to edge horizontally
• Minimize – displays all opened windows minimized along the bottom of the screen.
Help – contains the following commands:
• Contents (or F1 key) – opens Help file.
• About… – opens a window with information related to version number, serial number,
date of version compiling, etc.
19.2. Image zooming tools
At the lower left part of the window there is a set of buttons used for raster image scale
management:
•
- one step zooming out (duplicated by “/” key)
•
- one step zooming out (duplicated by “/” key) for all images opened
•
- 1:1 mode (image cell corresponds to the screen pixel) (duplicated by “Alt-1” keys)
•
- one step zooming in (duplicated by “*” key)
91
RACURS Co., Ul. Yaroslavskaya, 13-A, office 15, 129366, Moscow, Russia
July 2009
•
- one step zooming in (duplicated by “*” key) for all images opened
•
- fitting the whole image into the window (duplicated by “Alt-Enter” keys)
Mouse wheel steering is also used for image zoom in / zoom out.
Current image zoom is shown in window title bar in brackets after image name and in the
lower part of the window as
.
You can move image in window in panning mode by mouse along with pressed Alt key.
19.3. Work in application
Open an image in application window by the button
(or select menu command File |
Open), that allows to load a raster of one of the following formats:
•
•
•
•
•
•
•
•
•
•
•
•
Tag Image File Format (TIFF)
Windows Bitmap File (BMP)
VectOr (SIT, RSW, MTW) – raster format of PHOTOMOD VectOr and Panorama
systems (see the chapter 12 Export of mosaic to PHOTOMOD VectOr)
GeoTIFF – TIFF format, containing special tags with georeference data
ERDAS IMAGINE (IMG) – raster format of ERDAS system
NITF (NITF)
JPEG (JPEG)
GIF (GIF)
PNG (PNG)
PCIDSK (PIX) – raster format with georeference data in its header, developed by PCI
Geomatics
JPEG2000 (JP2) – raster format with jpeg-compressing and georeference data in its
header, output image in this format has volume limited up to 500 Mb
USGS DEM (DEM)
Image processing includes radiometric correction operations (see the chapter 19.3.1
Radiometric correction) and geometric transformations (see the chapter 19.3.2 Geometric
transformations).
19.3.1. Radiometric correction
You can process the image opened radiometrically using buttons of toolbar (see the chapter
19.1 Menu commands) or commands of menu item Processing, see the description of
operations in the chapter 7.1.1.1 Image radiometric correction.
19.3.2. Geometric transformations
The application provides the following geometric transformations of an image:
1. Rotation-flipping (using menu command Processing | Rotate-Flip) – the operations is
used for image rotation at 90, 180 or 270 degrees clockwise using buttons of the toolbar
opened.
©2009
92
PHOTOMOD GeoMosaic 4.4
Fig.77 Rotate-flip tools
The buttons
and
of this toolbar allow to flip image vertically or horizontally
correspondingly. Use the buttons
correspondingly.
and
to cancel all or the last of performed actions
2. Image resizing (using menu command Processing | Resize) – the operation is used to
change a raster size in width and height along with resampling operation. In the dialogue
opened you can input a resize value and its units (pixels or percent), and select resampling
method from drop-down list.
Fig.78 Resize settings
Use the Preserve aspect ratio check box to preserve initial proportions during image size
change.
3. Raster expansion (in the window opened by menu command Processing | Raster
expansion) – the operation is used to add a background of selected size (in pixels) to each
side of the image. Background color is selected from appropriate drop-down list.
Fig.79 Raster expansion settings
93
RACURS Co., Ul. Yaroslavskaya, 13-A, office 15, 129366, Moscow, Russia
July 2009
4. Edges trimming (in the window opened by menu command Processing | Trim edges) –
the operation is used to eliminate pre-set part of an image (in pixels) from each edge of
raster.
Fig.80 Edges trimming settings
19.3.3. Batch processing
In some cases it is suitable to apply transformations to a batch of images. Select menu
command Processing | Batch processing, to make settings of images batch processing
that allows to open the following window.
Fig.81 Batch processing window
Upper toolbar contains the following buttons:
- new project – creates new project of batch processing
- open batch project – opens existing project of batch processing (file with RPB
extension)
- save batch project – allows to save a project of batch processing to new file with RPB
extension
- add images – adds image selected in upper file list to list of images for batch
processing
- delete images – deletes selected image from list of images for batch processing
©2009
94
PHOTOMOD GeoMosaic 4.4
- edit image – opens window of radiometric image correction, see the chapter 19.3.1
Radiometric correction
- edit output parameters – opens window for file name input, and then window for saving
setup of batch processing results, see the chapter 19.3.6 Image saving
- start batch processing – starts batch processing for selected images.
See the description of batch processing setup in the chapter 19.3.3.1 Batch processing
setup.
19.3.3.1. Batch processing setup
First of all you should select a folder containing images to be included into batch processing,
using left panel of the batch processing window (1).
Fig.82 Batch processing setup
Content of a folder selected is shown in the list of upper panel (2).
Mark the Filter checkbox to show only raster file names in this list that are processed in
PHOTOMOD GeoMosaic module, see the chapter 19.3 Work in application.
(Add images) or double click the file
After selecting of file with image push the button
name to add the image to the list of batch processing files in lower panel (3). Select more
images to be processed in batch mode in the same way.
You can include/exclude images to batch processing using the following tools.
To select all images in the panel 3 use the button
images click the button
selection.
Select all, to clear selection of all
Unselect all, to invert selection click the button
Invert
For the image selected in the panel 3 you can make settings for its radiometric and
geometric correction and saving. Use buttons of the toolbar above the panel 3 to select and
setup radiometric and geometric operations, see the chapter 19.3.1 Radiometric correction
and 19.3.2 Geometric transformations. The panel 4 then will contain a list of selected
processes for each image.
95
RACURS Co., Ul. Yaroslavskaya, 13-A, office 15, 129366, Moscow, Russia
July 2009
You can make settings for save operation by clicking the button
(Edit output
parameters). In the window opened select target file name and path, then in the next
opened window make necessary settings, see the chapter 19.3.6 Image saving. Saving
preferences will be shown in the panel 5.
You can save a set of your operations selected for chosen image or images to file with CNV
extension by clicking the button
(save conversion of current image).
This operations set could be applied then to another image or images, selected in the panel
3. For that click the button
(apply conversion to selected images) and select CNV file.
When all necessary images are selected and operations are setup push the button
(Start batch processing) to launch the processing. After that the window of save settings of
batch processing results will be opened, if the settings were not selected previously.
19.3.4. Operations with image fragment
You can select an image fragment by mouse drag over the area you want to select holding
down Shift. The fragment boundary is shown by green dashed line with small rectangles on
its sides. Drag the rectangles to resize the fragment.
Copy the fragment selected to the clipboard (by Ctrl-C), and then paste it to a new window
(by Shift-Ctrl-V shortcut).
Fig.83 Initial image (right) and its fragment
©2009
96
PHOTOMOD GeoMosaic 4.4
You can apply operations of radiometric correction (see the chapter 19.3.1 Radiometric
correction) and geometric transformation (see the chapter 19.3.2 Geometric transformations)
to the fragment selected.
After completing of all necessary processing of the image fragment you can print it (see the
chapter 19.3.5 Image printing) and/or save (see the chapter 19.3.6 Image saving).
19.3.5. Image printing
Use menu command File | Print (or the
necessary settings in the window opened.
button) to print the image or its fragment. Make
Fig.84 Printing settings
In the left part of the window you can adjust the printing options: offsets, printer selection and
its preferences (using the Options button), and input a title of the image to be printed in the
appropriate field. Use the Preview window to the right to view printing settings.
Push the Print button to start printing, or Cancel – to cancel printing and close the window.
19.3.6. Image saving
button) to save the image or its fragment. If you
Use menu command File | Save (or the
need to save the image to file with new name select menu command File | Save as (or the
button
97
), which opens the following window.
RACURS Co., Ul. Yaroslavskaya, 13-A, office 15, 129366, Moscow, Russia
July 2009
Fig.85 Image save settings
The image will be saved with name indicated in the File field in one of the following formats
selected in the File format drop-down list:
• Tag Image File Format (TIFF) – allows to save output file with or without JPEG
compression (depending on the option in the Compression panel, see below)
• Windows Bitmap File (BMP)
• GIS Panorama raster map (RSW) – raster format of Panorama system (see the chapter
12 Export mosaic to PHOTOMOD VectOr)
• GeoTIFF – TIFF format, containing special tags with georeference
• ERDAS IMAGINE (IMG) – raster format of ERDAS system
• NITF (NITF)
• JPEG (JPEG)
• PNG (PNG)
• MicroStation DGN (DGN) – raster format of MicroStation system
• PCIDSK (PIX) – raster format with georeference data in its header, developed by PCI
Geomatics
• JPEG2000 (JP2) – raster format with jpeg-compressing and georeference data in its
header, output image in this format has limited volume up to 500 Mb.
Options in the Compression panel are used to compress the output mosaic image. Check
the TIFF, JPEG compression box and use the slider Image quality if you want to apply the
compression. The default value of compression is 75% (usually it causes the 5-7 times
compression of initial image volume).
When saving the image to TIFF format you may save also image pyramid into the file, i.e.
transfer it to MS TIFF format, if the checkbox Create MS TIFF is marked. Moreover when
saving to TIFF you may select output image resolution (8 or 16) in the Data format dropdown list. It is usually used for transformation of initial 16-bit raster into 8-bit one.
To save image georeference into separate file select its format in the Georeference file
drop-down list. See the chapter 15 Georeference file.
After selecting all parameters click OK to start saving or Cancel to cancel it.
In batch processing mode, the following window opens for selecting parameters for saving
files:
©2009
98
PHOTOMOD GeoMosaic 4.4
Images will be saved in the folder specified in the field Folder, with format chosen from the
dropdown list File format. List of and options for available formats are the same as for
saving single image.
To save image georeference into separate file select its format in the Georeference file
drop-down list. See the chapter 15 Georeference file.
It is also possible to set a suffix which will be appended to the names of source files when
saving images. This is controlled by Add suffix to input file name option. This may be used
for example when saving output files to the same folder as input files.
After selecting all parameters click OK to start processing or Cancel to cancel it.
99
RACURS Co., Ul. Yaroslavskaya, 13-A, office 15, 129366, Moscow, Russia