1
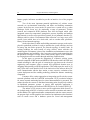
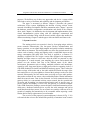
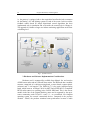
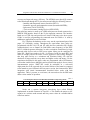
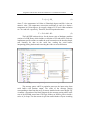
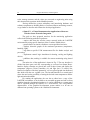
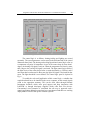
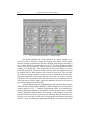
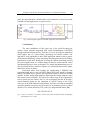
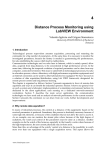
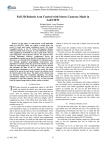
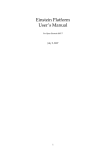
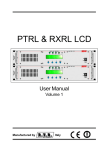
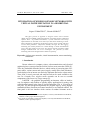
U.P.B. Sci. Bull., Series C, Vol. 75, Iss. 2, 2013
ISSN 2286 – 3540
INTEGRATION OF WIRELESS SENSOR NETWORKS WITH
VIRTUAL INSTRUMENTATION IN A RESIDENTIAL
ENVIRONMENT
Grigore STAMATESCU1, Valentin SGÂRCIU2
This paper presents an approach to integrate wireless sensor networks
(WSN) with the LabVIEW graphical development environment through a dedicated
software driver. As personal constribution, a system architecture and concept
implementation are described, in the context of a smart house monitoring scenario.
Data acquisition is performed via the deployed wireless sensor network with focus
on three main parameters: temperature, humidity and light. The data logging,
monitoring and control functions are realized through a virtual instrumentation
project. This also enables an easy-to-use user interface and the accesibility of data
through standards-based web server technologies. The potential of remote
monitoring and control through mobile terminals is opened up.
Keywords: wireless sensor networks; virtual instrumentation; remote monitoring;
smart house
1. Introduction
Recent advances in computer science, telecommunications and electrical
engineering have converged into the field of wireless sensor networks (WSN) [1].
These tiny embedded networked devices, which consist of processing units, lowpower radios, various sensors and a power supply, usually in the form of batteries,
can be deployed in an interest area and relay important data back to a base station.
There, data is stored, processed and analyzed and can be made available to the
user. In a broader view, wireless sensor networks can be seen as essential
components of the Internet of Things concept [2].
LabVIEW – the graphical programming environment, offers an intuitive
way for engineers and scientists to quickly deploy applications for testing, data
acquisition and control in the form of virtual instruments (VIs). A VI consists of
two parts. The block diagram implements the program logic by wiring together
standardized library functions and control structures or user-defined routines. The
front panel is the user interface which consists of standard elements such as:
1
Assist., Faculty of Automatic Control and Computers, University POLITEHNICA of Bucharest,
Romania, e-mail: [email protected]
2
Prof., Faculty of Automatic Control and Computers, University POLITEHNICA of Bucharest,
Romania, e-mail: [email protected]
42
Grigore Stamatescu, Valentin Sgârciu
buttons, graphs, indicators assembled to provide an intuitive view of the program
scope.
Two of the most important potential applications of wireless sensor
networks are environmental monitoring and home and building automation
systems. In the first case, sensor nodes are spread over a certain area (e.g. urban
landscape, fields, forest etc.) for monitoring a range of parameters. Various
research and commercial WSN platforms have been developed which offer
integrated sensors for temperature, atmospheric pressure, humidity and ambient
light intensity as well as more specialized systems for air pollutants detection [3],
ambient sound or others. Environmental data collection over large areas poses
specific issues which have to be dealt with, such as random node placement,
battery life and network topology.
On the other hand, in home and building automation systems, nodes can be
placed in predefined positions in order to optimize the system efficiency and can
be battery but also mains powered. The network topology is usually static. In
existing buildings the main benefit of using wireless sensor networks for
monitoring the environment is that of low installation and maintenance costs with
good performance and scalability. Also, low-power wireless mesh networking has
the potential to mitigate coverage issues which usually appear in such situations
by relaying data to the base station through multi-hop communication.
In this paper we present the integration of a Memsic wireless sensor
network composed of IRIS nodes and MIB520 USB interface with LabVIEW and
related technologies with the goal of narrowing the gap between the electrical
engineering and computer science research and specialized domain users in
designing and operating real WSN applications. This builds upon the work in [2]
and [3] but with a more detailed view of the intricacies of the software driver for
serial communication with the base station, a more extensive evaluation of the
system deployment and the enabling technology behind the distance monitoring
component.
Literature offers various approaches to integrating specific wireless sensor
networks platforms with the LabVIEW environment. In [4] a technical solution
for sensor network monitoring based on virtual instrumentation is presented. The
authors describe the sensors as distributed measuring points for physical variables
in distributed parameter systems. A generic data aquisition application is
described which employs the dedicated LabVIEW driver for Crossbow WSN [5].
The authors of [6] present a more specific application which focuses on
the in-depth study of the use of wireless sensor networks to monitor and control a
swiftlet habitat. The application handles communication with the sensor network,
the program logic and the graphical user interface but implements other functions
such as remote access and a database system for record and management
Integration of WSN with virtual instrumentation in a residential environment
43
purposes. We build on top of these two approaches and devise a system which
offers both a variety of functions and scalability and development possibilities.
The paper is structured as follows: Chapter 2 describes the general
architecture of the system, highlighting the benefits of using wireless sensor
networks in building environment and home automation tasks. Chapter 3 presents
the hardware structure configuration considerations and details of the software
driver used. Chapter 4 is dedicated to the development and implementation of the
virtual instrumentation project along with the challenges encountered and
experimental evaluation along with the shared variable engine that enables the
distance monitoring. Chapter 5 ends the paper with conclusions and future work.
2. System Overview
The starting point in our scenario is that, by leveraging unique wireless
sensor networks characteristics, like low-power wireless communication and
battery operation, we can obtain high temporal and spatial resolution monitoring
of the indoor environment. This would enable us to have fine-grained control over
actions such as heating, cooling and lighting with a considerable impact on the
energy consumption and utility bills. Our study is applied to a common 1-2
dormitory residential flat. We assign a sensor node equipped with temperature,
humidity and light sensors to each room. After the nodes are powered on, they
self-organize in a mesh network, start sampling the sensors and transmit data
packets over the wireless link. Due to the difficult nature of the indoor
environment, phenomena such as fading, multipath reflection and interference
caused by walls, large metal objects or high powered devices operating in the 2.4
GHz ISM (Industrial, Scientific and Medical) band may appear. These reduce the
radio coverage of the nodes and so, the nodes which fall outside the range of the
base station have to rely on neighbors to forward their packages to the root of the
newtork. Subsequently, the base station starts receiving two types radio packets:
data packets contain the raw sensor values and health packets contain information
about the network status. Data is then forwared via serial communication to the
gateway which, in a conventional wireless sensor network, has the essential task
of storing and forwarding it to interested third parties and, in specific cases, to
process, analyze and display it. In our case, the gateway is a personal computer
with a USB connection, running a custom designed virtual instrumentation project
which uses a dedicated software driver to parse the serial messages and extract
useful data from the byte stream. For our scenario we consider a data rate of 10-60
seconds of sampling and transmission to be reasonable whilst expecting a node
lifetime before battery replacement of several months.
The overview of the proposed system architecture is shown in Fig. 1. It is
to be noticed that we have also included the possibiliy of actuation in our scenario
44
Grigore Stamatescu, Valentin Sgârciu
i.e. the gateway is equipped with a data acquisition board hard-wired to actuators
for the heating, A/C and lighting systems of each of the rooms. In this work the
feedback control based on simple bipositional control algorithms has been
implemented only in simulation and we describe the control logic in Chapter 4.
The approach is scalable to larger area indoor monitoring applications at the floor
or building level.
Fig. 1. System Overview
3. Hardware and Software Implementation Considerations
Hardware used is commercially available from Memsic Inc. and consists
of IRIS sensor nodes and an USB radio base station. The IRIS node has a modular
structure, comprised of a radio/processing board, a sensor board, compact plastic
enclosure and 2 AA batteries. The XM2110 [7] is the main radio/processing
board, which hosts an ATMega 1281 8 bit MCU and a IEEE 802.15.4 compliant
RF230 radio transceiver operating in the 2.4GHz ISM band. This is the newest
module in the line of the original Berkeley motes and is supported by the opensource community under TinyOS 1.x and 2.1 – an event-based, low footprint
operating system for resource constrained devices. Compared to the previous
iteration – MicaZ, the producer mentions better performance in terms of radio
Integration of WSN with virtual instrumentation in a residential environment
45
coverage and improved energy efficiency. The MTS400 sensor board [8] connects
to the main board through the 51-pin connector and offers the following sensors:
- humidity and temperature sensor (Sensirion SHT11);
- barometric pressure and temperature sensor (Intersema MS55ER);
- light sensor (TAOS TLS2550);
- 2-axis accelerometer (Analog Devices ADXL202JE).
The radio base station is made up of a IRIS radio/processor board connected to a
MIB520 USB interface board via the 51-pin expansion connector. The interface
board uses a FTDI chip and provides two virtual COM ports to the host system.
COMx is used for programming the connected mote and COMx+1 is used by
middleware applications to read serial data.
Fig. 2 displays the hardware used to carry out the experimental part of this
paper, in a laboratory setting. Throughout the experiments, three nodes are
programmed with IDs 101, 102 and 103 while the base station has ID 0. Radio
communication is set to channel 26 (2480 MHz center frequency) of the IEEE
802.15.4 defined spectrum allocation, in order to minimize interference by highpowered radio devices such as WiFi access points. Motes can be configured in
either HP – High Power mode or in LP – Low Power. In HP, the node MCU and
radio are always powered on while LP uses aggressive duty-cycling strategies,
that keep radio activity to a minimum and maximize battery life with the
drawback of longer network set-up times and higher end-to-end latency. For the
experiments described in this paper, nodes are programmed with a HP firmware
version that enables faster debugging and accelerated data analysis for our virtual
instrumentation project. While this would be unfeasible in a real-world
deployment due to the expected days to weeks lifetime of the batteries compared
to the months to years lifetime in the low-power version, the framework for WSN
integration with virtual instrumentation described below works with both
approaches. Table 1 presents, as a reference, the current draw for the IRIS mote
under various modes of operation:
Table 1
[mA]
IRIS
Current Requirements for the IRIS Board in Different Operating Modes
Pr. full
Pr. slp
Rad. rcv Rad. tr
Rad. slp Flsh wr
Flsh rd
8
0.008
16
17
0.001
15
4
Flsh slp
0.002
Nodes run a custom low-power networking layer called XMesh,
implemented as module firmware in TinyOS 1.x. This enables the motes to selforganize in a wireless mesh network and relay sensor values in a reliable fashion
to the base station.
46
Grigore Stamatescu, Valentin Sgârciu
Fig. 2. Memsic IRIS WSN Nodes and USB Radio Base Station
In our particular case, for the MTS400 sensor board, the radio data packet
has the structure depicted in Fig. 3.
Fig. 3. XMesh Message Structure for the MTS400 Sensor Board [11]
The message starts with a compulsory TinyOS header of 5 bytes. A 0-7
bytes XMesh header follows with routing layer data such as: source address,
origina address, sequence number and application ID. The XSensor header
includes information about the sensor board ID, packet ID and parent node. The
last 2 bytes of the message contain the the Cyclic Redundancy Check (CRC)
error-detecting code. Within the scope of our application, the “MTS400 Payload”
consists of 26 bytes containing the data from the sensors. This data has to be
extracted from the message structure and raw numeric values have to be converted
to engineering units. As an example, computing the temperature in degrees
Celsius from the reading of the SHT11 humidity and temperature sensor [12],
involves the folowing computation:
Integration of WSN with virtual instrumentation in a residential environment
T = d1 + d2 ⋅ SOT
47
(1)
where T is the temperature in Celsius or Fahrenheit degrees and SOT is the raw
numeric value. The temperature conversion coefficients d1 and d2 to obtain a
temperature in Celsius degrees, for a supply voltage of 2.5V and a 14bit resolution
are -39.6 and 0.01 respectively. Therefore, the final equation becomes:
T = −39.4 + 0.01⋅ SOT
(2)
The LabVIEW software driver for the chosen suite of hardware modules
consists of a LLB library which includes a collection of VIs and subVIs. Each one
implements specific routines to enable the serial connection to the interface board,
start listening for data on the serial bus, reading the serial buffer,
interpreting/parsing the data and converting the values to an useful format.
Fig. 4. Block Diagram Fragment of MTS400 Message Parser VI
The message parser subVI in particular processes the input string from
serial buffer read function output. The result of the message parsing
corresponding to data from the array of sensors installed on the sensor board. Fig.
4 contains a screenshot of the block diagram for the message parsing subVI in the
case of the MTS400 sensor board. The logic follows an iterative process inside a
series of for loops. The data stream is split into useful chunks of bytes according
48
Grigore Stamatescu, Valentin Sgârciu
to the message structure and the values are converted to engineering units using
their characteristic equations inside MathScript nodes.
Having defined the system architecture and introducing hardware and
software components as building blocks of our Smart House monitoring scenario,
we go further to describe and evaluate the developed application.
4. SmartVI – a Virtual Instrumentation Application to Showcase
Wireless Sensor Networks Integration
The goals we have proposed ourselves for the monitoring application
reflect in the following tasks that it performs:
- aquires data from the wireless sensor network inside the LabVIEW
environment by using specific functions of the Crossbow XMesh driver;
- presents data in an intuitive fashion to a non-specialized end-user;
- displays historical graphs of the monitored parameters (temperature,
humitidy, light);
- logs data to specific LVM measurement files for further analysis and
processing;
- implements control logic simulation for heating, cooling and lighting
devices;
- publishes data, making it available for remote monitoring using shared
variables.
The main view of the application is shown in Fig. 5. The user interface is
divided into three parts, each one corresponding to a room of our Smart House.
Intuitive display elements are placed into each of these frames and display the
temperature (degrees Celsius), humidity (%) and light (lux). To observe the
historical evolution of the three parameters, we have placed graphs into dedicated
tabs which offer the user a global view. The last tab functions as a control panel
where the user has the possibility of setting the desired room temperatures and the
light activation thresholds.
For running the application, the user has to either have a copy of the
LabVIEW environment, it can be built as an executable program and run on client
machines through a downloaded runtime or it can be published as a remote panel
and be operated through the Internet via a web browser. The cross-platform
characteristics of the graphical development system enable it to be run on
different host operating systems or in virtualized environments.
Integration of WSN with virtual instrumentation in a residential environment
49
Fig. 5. Front Panel of the SmartVI – Main View
The control logic is as follows: heating/cooling and lighting are treated
separately. The system parameters can be tuned in the dedicated tab of the virtual
instrument front panel. The heating and cooling bipositional control logic relies on
a temperature set-point. If temperature in one of the rooms drops by more than 1
degree, the heating ON signal is activate. When the temperature increases by more
than 1 degree, the cooling ON signal is activated. The light control logic checks if
the light in one of the rooms drops below a certain threshold (e.g. 200 lux) and if
movement has been detected in that room, the light ON signal is activated for that
room. The light threshold is user-defined. The control logic panel is depicted in
Fig. 6.
To enable the real-world application of this control logic, a suitable data
acquisition board has to be installed in the server computer, an the control signals
wired to the appropiate actuators. This can be done either through National
Instruments hardware which offer good support and deep integration with
LabVIEW or through third-party suppliers which offer their own drivers.
Conventional, wired actuation is considered the safe way to approach such a
control application although researchers have experimented and there are working
deployments of wireless low-power actuation systems.
50
Grigore Stamatescu, Valentin Sgârciu
Fig. 6. Front Panel of the SmartVI – Control Panel Tab
The system publishes the room parameters as shared variables to be
accesed locally or remotely, through the internet. The shared variable engine
abstracts network communication from the LabVIEW block diagram and makes it
easy to share data between networked systems [3]. The type of shared variables
we are using for our particular scenario consist of networked-published shared
variables of of double type. After being added to the project library of a certain
LabVIEW application, the shared variables take the form of a terminal which can
be dropped onto the block diagram to be written or read from. They also offer
error input and output terminals to notify the user of communication errors and a
timestamp output that informs about when the value read was written. A specific
UDP protocol is impelemented under this abstraction layer to send data to a server
called the shared variable engine, which then publishes the data to all clients on
the network reading the shared variable.
A block diagram fragment, highlighting the data aquisiton flow from the
USB radio base station and the publishing of light information to local and shared
variable appears in Fig. 7. Graphical programming differs from standard textbased programming languages in that a block executes whenever data is available
to all its compulsory input terminals. This concept is called dataflow. In the main
loop data from the serial port is parsed by the dedicated function described in the
previous section and data is wired to the corresponding local indicators and shared
variables. Upon terminating the application through the Stop button on the main
Integration of WSN with virtual instrumentation in a residential environment
51
panel, the data acquisition is halted and the serial connection is closed to be made
available for other applications or system services.
Fig. 7. Block Diagram Fragment of the Main Application Virtual Instrument
5. Conclusions
The main contribution of this paper lays in the proof-of-concept for
wireless sensor networks integration with virtual instrumentation (LabVIEW)
through dedicated software drivers. Therefore, we have developed an application
which applies this to a Smart House monitoring and control scenario. Our
approach is easily applicable to other WSN application domains such as generic
environmental monitoring, energy monitoring and infrastucture and asset tracking.
Experimental results have shown that, by using the XMesh networking protocol
the system supplies data in a reliable manner to the base station and our virtual
instrumentation project works as designed. The virtual instrumentation project we
have developed has the potential to operate as a centralized framework to gather
data from a variety of sources.
Envisioned future work includes the implementing a MDA300 data
acquisition board driver in the LabVIEW XMesh WSN suite which is currently
lacking. The MDA300 is a generic data acquisition expansion board for the IRIS
platform. It offers analog input channels, digital input and output channels, relays
and external sensor excitation. This opens up a whole range of new applications
such as remote process control. Also, we are investigating the idea to develop a
custom hardware design for the integration of specific sensors to the 51-pin
connector on the IRIS radio/processing module. Our idea is to build an embedded
networked platform using low-cost gas sensors for air monitoring such as: carbon
dioxide (CO2), carbon monoxide (CO), ozone (O3) and particulate matter (PM).
REFERENCES
[1]. C. Gomez, J. Paradells, J. Caballero, Sensors Everywhere: Wireless Network Technologies
and Solutions, F.V.E., 2010.
52
Grigore Stamatescu, Valentin Sgârciu
[2]. M. A. Moisescu, I. S. Sacală, A. M. Stănescu, Towards the Development of Internet of Things
Oriented Intelligent Systems, U.P.B. Sci. Bull., ISSN 1454-234x, Series C, Vol. 72, Iss. 4,
2010.
[3]. E. C. Rada, M. Ragazzi, M. Brini, L. Marmo, P. Zambelli, M. Chelodi, M. Ciolli, Perspectives
of Low-cost Sensors Adoption for Air Quality Monitoring, U.P.B. Sci. Bull., Series D, Vol.
74, Iss. 2, 2012.
[4]. V. Sgârciu, G. Stamatescu, A. Năstase, Optimizarea consumului energetic al unui Smart House
folosind mediul de dezvoltare LabVIEW i tehnologii WSN (Energy Consumption
Optimization of a Smart House using the LabVIEW Environment and WSN Technologies),
Automatizări si Instrumentatie, Nr. 5-6, 2010.
[5]. V. Sgârciu, G. Stamatescu, Distance Process Monitoring using LabVIEW Environment, in
LabVIEW – Modeling, Programming and Simulations (Ed. Riccardo de Asmundis),
InTech, 2011, ISBN 978-953-307-521-210
[6]. C. Volosencu, V. Malita, Application of Virtual Instrumentation for Sensor Network
Monitoring, 2nd International Conference on Manufacturing Engineering, Quality and
Production Systems, 2010.
[7]. National Instruments, Crossbow XMesh WSN - Serial Driver for LabVIEW, 2007.
[8]. O. Al-Khalid, et al., Wireless Sensor Networks for Swiftlet Farms Monitoring, World
Academy of Science, Engineering and Technology, 60/2005.
[9]. Crossbow Inc., MPR-MIB Users Manual, Rev. A, June 2007.
[10]. Crossbow Inc., MTS/MDA Sensor Board Users Manual, Rev. A, June 2007.
[11]. Crossbow Inc., XMesh User’s Manual, Rev. C, March 2007.
[12]. Sensirion, SHT1X Humidity and Temperature Sensor IC Datasheet, 2012.