1
MPC56x NEXUS Debugger and Trace
TRACE32 Online Help
TRACE32 Directory
TRACE32 Index
TRACE32 Documents ......................................................................................................................
ICD In-Circuit Debugger ................................................................................................................
Processor Architecture Manuals ..............................................................................................
MPC500/PQ ..............................................................................................................................
MPC56x NEXUS Debugger and Trace ................................................................................
1
Brief Overview of Documents for New Users .................................................................
5
Warning ..............................................................................................................................
6
Quick Start .........................................................................................................................
7
Target Design Requirement/Recommendations ............................................................
9
General
9
RESET Configuration
10
General Restrictions
11
Correct Start-up Sequence for the NEXUS Debugger
11
Special Warning for MPC561 and MPC563
12
AXIOM Evaluation Board
12
Troubleshooting
13
SYStem.Up Errors
13
FAQ
14
Configuration .....................................................................................................................
Breakpoints ........................................................................................................................
30
32
Software Breakpoints
32
On-chip Breakpoints
32
On-chip Breakpoints on Read or Write Accesses
33
Example for Breakpoints
33
Simultaneous FLASH Programming for MPC56x
34
Memory Classes ................................................................................................................
35
General SYStem Commands ............................................................................................
36
SYStem.CONFIG
Configure debugger according to target topology
36
Select CPU type
36
Run-time memory access (intrusive)
37
Real-time memory access (non-intrusive)
37
Establish the communication with the CPU
38
SYStem.CPU
SYStem.CpuAccess
SYStem.MemAccess
SYStem.Mode
©1989-2015 Lauterbach GmbH
MPC56x NEXUS Debugger and Trace
1
CPU specific SYStem Commands ...................................................................................
SYStem.LOADVOC
39
Load vocabulary for code compression
39
FLASH.MultiProgram
Simultaneous programming of on-chip FLASH
39
SYStem.Option BRKNOMSK
Allow program stop in a non-recoverable state
40
Control for branch trace messages
40
SYStem.Option BTM
SYStem.Option CCOMP
Enable code compression
40
SYStem.Option CLEARBE
Clear MSR[BE] on step/go
41
Run-time memory access for all windows
41
Control for data trace messages
41
SYStem.Option DUALPORT
SYStem.Option DTM
SYStem.Option EXTVECTORS
Workaround for revision C silicon
41
Switch on high memory
42
Configure the show cycles for the I-BUS
43
Flush branch target cache before program start
43
SYStem.Option HighMemory
SYStem.Option IBUS
SYStem.Option ICFLUSH
SYStem.Option IMASKASM
Disable interrupts while single stepping
44
Disable interrupts while HLL single stepping
44
Selection of little endian mode
44
Set NEXUS auxiliary output width
45
SYStem.Option NODATA
The external data bus is not connected to trace
45
SYStem.Option NOTRAP
Use alternative instruction to enter debug mode
45
Control for ownership trace messages
46
Enable overlay support
46
SYStem.Option IMASKHLL
SYStem.Option LittleEnd
SYStem.Option Nexus
SYStem.Option OTM
SYStem.Option OVERLAY
SYStem.Option PPCLittleEnd
Control for PPC little endian
46
Control for program trace messages
47
Control for program trace synchronisation messages
47
Control for queue flush messages
47
SYStem.Option PTM
SYStem.Option PTSM
SYStem.Option QFM
SYStem.Option SCRATCH
Scratch for FPU access
47
SIUMCR setting for the trace
48
Allow SMARTTRACE algorithm to fill trace gaps
48
Control for NEXUS lines
48
SYStem.Option SIUMCR
SYStem.Option SmartTrace
SYStem.Option TriState
SYStem.Option VECTORS
Define ranges for not-standard interupt vectors
48
Enable software watchdog after SYStem.Up
49
Display SYStem window
49
CPU specific MMU Commands ........................................................................................
50
SYStem.Option WATCHDOG
SYStem.state
MMU.DUMP
Page wise display of MMU translation table
MMU.List
50
Compact display of MMU translation table
51
Load MMU table from CPU
52
CPU specific NEXUS Commands ....................................................................................
54
MMU.SCAN
NEXUS.BTM
Program trace messaging enable
54
NEXUS.DTM
Data trace messaging enable
54
NEXUS.OFF
Switch the NEXUS trace port off
55
NEXUS.ON
Switch the NEXUS trace port on
55
Ownership trace messaging enable
55
Set trace port width
55
NEXUS.OTM
NEXUS.PortSize
©1989-2015 Lauterbach GmbH
MPC56x NEXUS Debugger and Trace
2
NEXUS.Register
Display NEXUS trace control registers
56
NEXUS.RESet
Reset NEXUS trace port settings
56
Display NEXUS port configuration window
56
CPU specific TrOnchip Commands .................................................................................
57
NEXUS.state
TrOnchip.BusTrigger
TrOnchip.CONVert
Generate a trigger for the internal trigger bus
57
Adjust range breakpoint in on-chip resource
58
TrOnchip.DISable
Disable NEXUS trace register control
59
TrOnchip.ENable
Enable NEXUS trace register control
60
Allow the EVTI signal to stop the program execution
60
Define data selector
61
TrOnchip.EVTI
TrOnchip.G/H
TrOnchip.IWx.Count
Event counter for I-Bus watchpoint
62
Instructions address for I-Bus watchpoint
63
TrOnchip.IWx.Watch
Activate I-Bus watchpoint pin
63
TrOnchip.LW0.Count
Event counter for L-Bus watchpoint
64
TrOnchip.IWx.Ibus
TrOnchip.LW0.CYcle
Cycle type for L-Bus watchpoint
64
TrOnchip.LW0.Data
Data selector for L-Bus watchpoint
65
TrOnchip.LW0.Ibus
Instructions address for L-Bus watchpoint
65
TrOnchip.LW0.Lbus
Data address for the L-Bus watchpoint
66
Activate L-Bus watchpoint pin
66
Reset on-chip trigger unit
66
Stop program execution at specified exception
67
Set filter for the trace
67
TrOnchip.TOFF
Switch the sampling to the trace to OFF
67
TrOnchip.TON
Switch the sampling to the trace to ON
68
Set a trigger for the trace
68
Adjust HLL breakpoint in on-chip resource
68
Display “TrOnchip” window
69
TrOnchip.LW0.Watch
TrOnchip.RESet
TrOnchip.Set
TrOnchip.TEnable
TrOnchip.TTrigger
TrOnchip.VarCONVert
TrOnchip.view
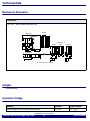
Technical Data ...................................................................................................................
70
Mechanical Dimension
70
Adapter
70
Operation Voltage
70
Operation Frequency
71
Support ...............................................................................................................................
72
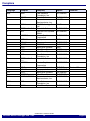
Available Tools
72
Compilers
73
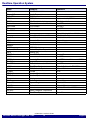
Realtime Operation System
74
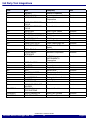
3rd Party Tool Integrations
75
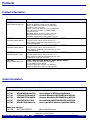
Products .............................................................................................................................
76
Product Information
76
Order Information
76
©1989-2015 Lauterbach GmbH
MPC56x NEXUS Debugger and Trace
3
MPC56x NEXUS Debugger and Trace
Version 06-Nov-2015
03-Jul-14
TrBus.Out and TrBus.Set were moved to general_ref_t.pdf.
©1989-2015 Lauterbach GmbH
MPC56x NEXUS Debugger and Trace
4
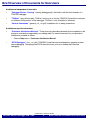
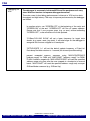
Brief Overview of Documents for New Users
Architecture-independent information:
•
”Debugger Basics - Training” (training_debugger.pdf): Get familiar with the basic features of a
TRACE32 debugger.
•
”T32Start” (app_t32start.pdf): T32Start assists you in starting TRACE32 PowerView instances
for different configurations of the debugger. T32Start is only available for Windows.
•
“General Commands” (general_ref_<x>.pdf): Alphabetic list of debug commands.
Architecture-specific information:
•
“Processor Architecture Manuals”: These manuals describe commands that are specific for the
processor architecture supported by your debug cable. To access the manual for your processor
architecture, proceed as follows:
-
•
Choose Help menu > Processor Architecture Manual.
“RTOS Debugger” (rtos_<x>.pdf): TRACE32 PowerView can be extended for operating systemaware debugging. The appropriate RTOS manual informs you how to enable the OS-aware
debugging.
©1989-2015 Lauterbach GmbH
MPC56x NEXUS Debugger and Trace
5
Brief Overview of Documents for New Users
Warning
NOTE:
To prevent debugger and target from damage it is recommended to connect or
disconnect the debug cable only while the target power is OFF.
Recommendation for the software start:
1.
Disconnect the debug cable from the target while the target power is
off.
2.
Connect the host system, the TRACE32 hardware and the debug
cable.
3.
Power ON the TRACE32 hardware.
4.
Start the TRACE32 software to load the debugger firmware.
5.
Connect the debug cable to the target.
6.
Switch the target power ON.
7.
Configure your debugger e.g. via a start-up script.
Power down:
1.
Switch off the target power.
2.
Disconnect the debug cable from the target.
3.
Close the TRACE32 software.
4.
Power OFF the TRACE32 hardware.
©1989-2015 Lauterbach GmbH
MPC56x NEXUS Debugger and Trace
6
Warning
Quick Start
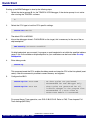
Starting up the BDM Debugger is done by the following steps:
1.
Select the device prompt B: for the TRACE32 ICD-Debugger, if the device prompt is not active
after starting the TRACE32 software.
b:
2.
Select the CPU type to load the CPU specific settings.
SYStem.CPU MPC563
The default CPU is MPC565.
3.
Inform the debugger where’s FLASH/ROM on the target, this is necessary for the use of the onchip breakpoints.
MAP.BOnchip 0x100000++0x0fffff
On-chip breakpoints are now used, if a program or spot breakpoint is set within the specified address
range. A list of all available on-chip breakpoints for your architecture can be found under On-chip
Breakpoints.
4.
Enter debug mode.
SYStem.Up
This command resets the CPU, enables the debug mode and stops the CPU at the first opfetch (reset
vector). After this command is possible to access memory and registers.
5.
Configure the IBUS.
SYStem.Option IBUS NONE
; No show cycles are performed.
; Recommended for BDM debugger only.
SYStem.Option IBUS IND
;
;
;
;
Show cycles are generated for all
indirect changes in the program flow.
Recommended if a RISC Trace or
PowerTrace module is connected.
For proper Nexus Trace operation, use SYS.O IBUS CHG. Refer to FAQ “Trace Impacts.Full
Trace settings(MPC56x)”
©1989-2015 Lauterbach GmbH
MPC56x NEXUS Debugger and Trace
7
Quick Start
6.
Set the special function registers to prepare your target memory for program loading.
Data.Set SPR:027E %Long 0x800
7.
Load the program.
Data.LOAD.Elf diabp555.x
; Load ELF file
The load command depends on the file format generated by your compiler. For more information refer to
Compiler. A full description of the Data.Load command is given in the “General Commands Reference”.
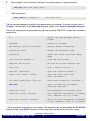
The start up sequence can be automated using the script language PRACTICE. A typical start sequence is
shown below:
b::
; Select the ICD-Debugger device
; prompt
WinCLEAR
; Delete all windows
MAP.BOnchip 0x100000++0x0fffff
; Specify where’s FLASH/ROM
SYStem.CPU 0x563
; Select the processor type
SYStem.Up
; Reset the target and enter debug
; mode
Data.LOAD.Elf diabp563.x
; Load the application
Register.Set PC main
; Set the PC to the function main
Data.List
; Open a source listing *)
Register /SpotLight
; Open the register window *)
Frame.view /Locals /Caller
; Open the stack frame with
; local variables *)
Var.Watch %Spotlight flags ast
; Open watch window for variables *)
PER.view
; Open a window for the special
; function registers
Break.Set sieve
; Set breakpoint to function sieve
Break.Set 0x1000 /Program
; Set a software breakpoint to address
; 1000 (address 1000 is in RAM)
Break.Set 0x101000 /Program
; Set an on-chip breakpoint to address
; 101000 (address 101000 is in FLASH)
*) These commands open windows on the screen. The window position can be specified with the WinPOS
command. Refer to the PEDIT command to write a script and to the DO command to start a script.
©1989-2015 Lauterbach GmbH
MPC56x NEXUS Debugger and Trace
8
Quick Start
Target Design Requirement/Recommendations
General
•
Locate the NEXUS connector as close as possible to the processor to minimize the capacitive
influence of the line length and cross coupling of noise onto the NEXUS signals.
Ensure that the debugger signal (HRESET) is connected directly to the HRESET of the processor. This will
provide the ability for the debugger to drive and sense the status of HRESET. The target design should only
drive the HRESET with open collector, open drain. HRESET should not be tied to PORESET, because the
debugger drives the HRESET and DSCK to enable BDM operation.
•
Terminate MCKI, MSEI, MDIO:1 with 100 pF and 47 in series, as close a possible to the
corresponding CPU pin.
•
Take care, that the MDO6 line is connected to the MPC5xx pin
MBIO32B[6]/MPWM[4]/MDO[6] and not to MPWM[18]/MDO[6].
•
Pull up all inputs by 10 k resistors to VREF, except RSTI/. (Refer to the Freescale
Semiconductor recommendation AN2289/D)
•
Connect all pins as recommended in AN2289/D.
•
Do not use any cable extender.
©1989-2015 Lauterbach GmbH
MPC56x NEXUS Debugger and Trace
9
Target Design Requirement/Recommendations
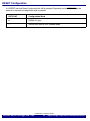
RESET Configuration
At HRESET the Hard Reset Configuration bits will be sampled. Depending on the RSTCONF pin the
external or the internal configuration word is sampled.
RSTCONF
Configuration Word
0
DATA[0..31] pins
1
internal data default word (0x0000 0000)
©1989-2015 Lauterbach GmbH
MPC56x NEXUS Debugger and Trace
10
Target Design Requirement/Recommendations
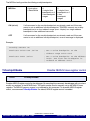
General Restrictions
The CPU handles the debug mode similar to an exception.
SYStem.Option BRKNOMSK OFF: The program execution is not stopped as long as the processor is in a
non-recoverable state (RI bit cleared in the Machine Status register).
SYStem.Option BRKNOMSK ON: The program execution can be stopped by a breakpoint even if the
processor is in a non-recoverable state. Since the debug exception overwrites SRR0 and SRR1 it is not
advisable to continue the debugging process.
MPC5xx
The CPU handles the debug mode similar to an exception. Therefore
stopping during the non-recoverable state of the CPU will cause the
SRR0/1 registers to be lost. Breakpoints should not be placed at the start
and end of exception handlers to avoid this problem. Asynchronous
breakpoints can be disabled when the CPU is in non-recoverable state
(SYStem.Option BRKNOMSK command). Executing a GO command is
not allowed when the CPU is in non-recoverable state. Single stepping on
assembler level is allowed.
Correct Start-up Sequence for the NEXUS Debugger
1.
Switch the power for the NEXUS debugger ON.
2.
Start the TRACE32 software.
3.
The SYStem.Option TriState has to be OFF.
4.
Switch ON the target.
If you don´t care about the correct start-up sequence, the user program can start unintentionaly before the
debugger is activated. The result can be that the PLL is already set.
©1989-2015 Lauterbach GmbH
MPC56x NEXUS Debugger and Trace
11
Target Design Requirement/Recommendations
Special Warning for MPC561 and MPC563
The MPC561 and MPC563 seem to be extremly sensitive about noise, overshots and wrong or missing
termination of MCKI.
MCKI is the NEXUS clock from debugger to target.
AXIOM Evaluation Board
The AXIOM EVB can have problems when using the MPC561 or MPC563. The reason is an open, not
terminated line (DSCK_MCKI) from J4 to one of the mictor connectors at the base board.
To improve the behavior of the AXIOM EVB the following is recommended:
1.
Cut the DSCK_MCKI line on the base board close to J4.
2.
Put a short cut jumper between pin 3 and pin 4 of the BDM connector.
©1989-2015 Lauterbach GmbH
MPC56x NEXUS Debugger and Trace
12
Target Design Requirement/Recommendations
Troubleshooting
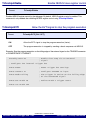
SYStem.Up Errors
The SYStem.Up command is the first command of a debug session where communication with the target is
required. If you receive error messages while executing this command this may have the following reasons:
•
The target has no power.
•
The target is in reset: The debugger controls the processor reset and use the RESET line to
reset the CPU on every SYStem.Up.
Target power fail
The target has no power.
Emulation debug port fail
HRESET/ is permanently active
NEXUS transmitter can´t send data
Bad connection to the target.
PowerOnRESET/ active or not connected
©1989-2015 Lauterbach GmbH
MPC56x NEXUS Debugger and Trace
13
Target Design Requirement/Recommendations
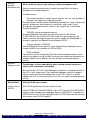
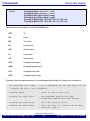
FAQ
Debugging via
VPN
The debugger is accessed via Internet/VPN and the performance is very
slow. What can be done to improve debug performance?
The main cause for bad debug performance via Internet or VPN are low data
throughput and high latency. The ways to improve performance by the debugger
are limited:
in practice scripts, use "SCREEN.OFF" at the beginning of the script and
"SCREEN.ON" at the end. "SCREEN.OFF" will turn off screen updates.
Please note that if your program stops (e.g. on error) without executing
"SCREEN.OFF", some windows will not be updated.
"SYStem.POLLING SLOW" will set a lower frequency for target state
checks (e.g. power, reset, jtag state). It will take longer for the debugger to
recognize that the core stopped on a breakpoint.
"SETUP.URATE 1.s" will set the default update frequency of Data.List/
Data.dump/Variable windows to 1 second (the slowest possible setting).
prevent unneeded memory accesses using "MAP.UPDATEONCE
[address-range]" for RAM and "MAP.CONST [address--range]" for ROM/
FLASH. Address ranged with "MAP.UPDATEONCE" will read the specified
address range only once after the core stopped at a breakpoint or manual
break. "MAP.CONST" will read the specified address range only once per
SYStem.Mode command (e.g. SYStem.Up).
©1989-2015 Lauterbach GmbH
MPC56x NEXUS Debugger and Trace
14
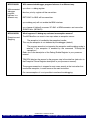
Target Design Requirement/Recommendations
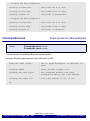
Setting a
Software
Breakpoint fails
What can be the reasons why setting a software breakpoint fails?
Setting a software breakpoint can fail when the target HW is not able to
implement the wanted breakpoint.
Possible reasons:
The wanted breakpoint needs special features that are only possible to
realize by the trigger unit inside the controller.
Example: Read, write and access (Read/Write) breakpoints ("type" in Break.Set
window). Breakpoints with checking in real-time for data-values ("Data").
Breakpoints with special features ("action") like TriggerTrace, TraceEnable,
TraceOn/TraceOFF.
TRACE32 can not change the memory.
Example: ROM and Flash when no preparation with FLASH.Create,
FLASH.TARGET and FLASH.AUTO was made. All type of memory if the
memory device is missing the necessary control signals like WriteEnable or
settings of registers and SpecialFunctionRegisters (SFR).
Contrary settings in TRACE32.
Like: MAP.BOnchip for this memory range. Break.SELect.<breakpoint-type>
Onchip (HARD is only available for ICE and FIRE).
RTOS and MMU:
If the memory can be changed by Data.Set but the breakpoint doesn't work it
might be a problem of using an MMU on target when setting the breakpoint to a
symbolic address that is different than the writable and intended memory
location.
Sporadic
Debug Port Fail
The debugger crashes sporadically when a dump window is open or a
system up is sometimes not possible.
Be sure that the "VCC PIN" of the debug port connector is connected directly to
the VCC of your target board. The Lauterbach debugger uses this voltage to
supply a buffer that drives the debug lines to the CPU. If there is a resistor
between the VCC of your board and our VCC pin, our supply voltage might drop
too low.
MPC5XX/8XX
Writing SYPCR has no effect.
Cannot write to
SYPCR
The SYPCR register can only be written one time.
If the SYSTEM.OPTION.WATCHDOG is set to OFF then the CPU WATCHDOG
function will be disabled by the debugger during a SYSTEM.UP. To disable the
WATCHDOG on the CPU the debugger writes to SYPCR and uses the one-time
write access to the SYPCR register.
©1989-2015 Lauterbach GmbH
MPC56x NEXUS Debugger and Trace
15
Target Design Requirement/Recommendations
MPC5XX/8XX
ICTRL register
access
Write access to the ICTRL register by the program does not take any
effekt!
If BDM (background debug mode) is enabled, the ICTRL register CAN NOT be
modified through the program and can only be modified through RCPU
development access (by debugger).
[MPC565 user manual, chapter 23.2.5.1 Program Trace Guidelines]
The BDM is enalbed if the Debugger is connected and CPU is up.
(e.g. SYStem.Mode.Up, SYStem.Mode.Go)
The BDM is disabled even if the debugger is connected when
SYStem.Mode.NoDebug is used.
The debug mode will be enable with a DSCK assert HIGH while SRESET
asserted.
SRESET __________/-----------DSCK -----------xxxxxxxxxxxx
If there is no debugger connected and there is the same behavior, maybe a pullup at DSCK causes the BDM automatically.
Note: Use the SYStem.Option.IBUS [xxx] to set the ICTRL[ISCT_SER] bits.
Manual access to the ICTRL register (SPR 158./0x9E) will be overwritten by the
debugger with each Step or Go!
MPC5XX/8XX
Step or Go
can't be
executed
Successful
Step or go result in a error message!
... VFLS0/1 pins have wrong status.
Freeze connected?
sys.o.freeze
VFLS from MIOS modul used?
PU is missing 10 kOhm Right after reset VFLS pins are also inputs!
State is non-recoverable!
©1989-2015 Lauterbach GmbH
MPC56x NEXUS Debugger and Trace
16
Target Design Requirement/Recommendations
MPC5XX/8XX
With connected
debugger
program
behaves in a
different way
With connected debugger program behaves in a different way
sys.o.ibus == debug register
ibus has priority, register will be overwritten.
RSTCONF for IBUS will be overwritten.
sys.nodebug only will not enable the BDM interface.
sys.o.freeze.off (default) assumes VFLS0/1 at BDM connector and overwrites
SIUMCR bits. (MPC8XX)
MPC8XX/5XX
What happens if I debug my code and an exception occurs?
Exceptions and
Stepping
The MPC8xx/5xx can react in two ways when an exception occurs:
The exception is handled by the exception handler.
This way the exception is not detected by the debugger (default).
The program execution is stopped at the exception and the debug mode is
entered, if the exception is enabled by the command "TrOnchip.Set
<exception>".
Refer also to the description of the Debug Enable Register in your processor
manual.
TRACE32 displays the reason for the program stop in the state line (refer also to
the Exception Cause Register description in your processor manual).
The program execution is stopped in most cases exactly at the instruction that
caused the exception, in some cases at the next instruction.
On some exceptions it is not possible to continue the debugging.
©1989-2015 Lauterbach GmbH
MPC56x NEXUS Debugger and Trace
17
Target Design Requirement/Recommendations
MPC8XX/5XX
Software runs
differently with
ICD
The target runs fine without the ICD attached. But with the ICD attached,
the target runs for a while and then it hangs up.
If the debug mode is enabled, the serialize control bit and the instruction fetch
show cycle control bits are set to SERALL after reset.
In SERALL mode the processor is fetch serialized and all internal fetch cycles
appear on the external bus. The processor performance is, therefore, much
slower. If only a BDM debugger is used perform the command "SYStem.Option
IBUS NONE".
In NONE mode the processor works in normal mode and no show cycles are
performed. There is no performance degradation in this mode.
If a RISC Trace or a PowerTrace is used, perform the command "SYStem.Option
IBUS IND". In IND mode the processor works in normal mode and show cycles
are performed for all indirect changes in the program flow. The performance
degradation in this mode is about 1 %.
For more information refer to the description of the ISCT_SER register in your
processor manual.
MPC8XX/5XX
Using
NOTRAP
Option
How do I use the TRAP exeption for my own application?
Use the command SYStem.Option NOTRAP ON With this setting the TRAP
exception is no longer used for software breakpoints. UNDEF 0 is used instead.
Use the command TrOnchip.Set PRIE OFF With this setting the debug mode is
no longer entered when a TRAP occurs. See also the Debug Enable Register in
you processor manual.
Now your application can handle the TRAP instruction.
©1989-2015 Lauterbach GmbH
MPC56x NEXUS Debugger and Trace
18
Target Design Requirement/Recommendations
MPC8XX/5XX
What means
"stopped by
SEI"?
Where can I find more information about the acronyms SEIE, PRIE, MCIE,
...?
These names reflect the bits of the DER Register (Debug Enable Register),
ECR (Exception Cause Register for MPC5xx family) and ICR (Interrupt Cause
Register for MPC8xx family).
The TRACE32 Debugger evaluate these bits all the time the processor change
from running mode to stop status. The abbreviation of these corresponding
exceptions/interrups handler differ a little bit between the MPC5xx and MPC8xx
family and several sub-derivatives manual.
Additional Information:
In a debug session almost all exception could be used/enabled/configured to
stop the CPU and enter the debug mode instead of executing the corresponding
exception handler.
This could be set up in the T32 PowerView Menue: Break - OnChip_Trigger Set - [MCIE] (MCIE is used as example here) or alternatively in the command
line or script language: TrOnchip.Set [MCIE] ON If the option is enabled (box is
checked), the CPU will stop right at the instruction cause this exception/interrupt
and enter the debug mode.
MPCXXX
Runtime
Accuracy
MPCXXX
Verify Error at
Single-Step or
Breakpoint
When stepping with the ICD debugger, the runtime counter shows too long
count values.
The runtime counter unit of the PowerPC debugger is realized using a software
counter of the host and a hardware counter of the Lauterbach tool. The
accuracy is about 10 us.
I get the error message: verify error at address ...,
By default TRACE32-ICD uses software breakpoints to set a breakpoint to an
instruction. Software breakpoint means the original instruction is replaced by to
TRAP in order to stop the program. This is the reason why a software breakpoint
usually requires that the instruction is in RAM. Otherwise the error message
verfiy error at address (address) is displayed.
The reasons for these errors are:
The instruction is in ROM/FLASH/EPROM. To set software breakpoints in
FLASH refer to the command "FLASH.Auto".
The appropriate CS is switched to ReadOnly mode. In this case it is not
possible to patch the code.
It is possible to use a limited number of on-chip breakpoints to set a breakpoint
to ROM/FLASH/EEPROM or ReadOnly memories. For more information refer to
the command "MAP.BOnchip <range>".
©1989-2015 Lauterbach GmbH
MPC56x NEXUS Debugger and Trace
19
Target Design Requirement/Recommendations
Connect a
Nexus Probe to
a PowerTrace
Unit
How do I correctly connect a Nexus Probe to a PowerTrace unit?
A Nexus probe has one, two or three ribbon cables for the connection to the
PowerTrace unit.
The PowerTrace has three connectors which are marked with A, B and C. (C is
close to the black heatsink)
Nexus probe connectors of newer probes are also marked with A, B and C.
Place the appropriate cable into the corresponding connector.
For older probes note the following:
Probes with a single cable: connect the ribbon cable to connector C.
Probes with two cables: connect the upper cable to connecter C, the second
cable underneath to B.
Probes with three cables: connect the upper cable to connecter C, the second
cable underneath to B and the third cable below to connector A. One does not
require an additional JTAG dongle!
Incorrect
Nexus-POD
CPLD Revision
What is the reason for "Incorrect Nexus-POD CPLD revision" message?
There are several reasons for the following message:
Incorrect Nexus-POD CPLD revision - Please call technical support (refer to
AREA)
A wrong T32xxx.EXE has been executed (e.g. Super10.exe for a Copperhead probe)
Just use the right SW.
The current SW contains a new image for the CPLD on the probe.
This reason is very seldom, but it may happen. One have to consider, that it is
just a warning and normally one can continue using the debugger. However only
for the case, the Area window shows a similar "expected CPLD revision
number". It is recommended to contact your next support office. One will get a
SW-Tool and some instructions how to fix it.
The probe is defective.
This reason can be recognized if the expected CPLD revision number is totally
different from the current CPLD revision number, or even 0x00000 or 0xFFFFF.
It is a serious reason and requires to send the probe back for repair. Also
contact your local support office first.
©1989-2015 Lauterbach GmbH
MPC56x NEXUS Debugger and Trace
20
Target Design Requirement/Recommendations
Missing
Address
Information on
Top of the
Trace
Is there any reason why symbol addresses and names are not displayed
from the beginning of the trace?
The Nexus protocol defines that a full address is transferred only occasionally,
just in a Branch-Trace-Sync-Message and Data-Trace-Sync-Message. Most of
the time only the significant portion of the current address is generated in the
device and transferred in a Nexus message. Therefore the address can only be
reconstructed and displayed after occurrence of a Sync-Message in the trace
memory. A Sync messages is generated automatically after 255 messages
latest.
A single Nexus message without knowing what had happened before is useless!
Look at the T.L /NEXUS , then one will see the location of the DTSM . After that
location the address information is visible.
A Sync message could be missing on top of the trace in the following cases:
Any time Program is running before trace is in ARM state!
Normally if analyzer is armed manually!
In FIFO mode if trace memory overflows.
Selective trace using Watchpoints
Selective trace using CTU
Some other cases.
Nexus
Connector
Pinout on
Target
I don't know exactly which signals from MCU must be connected to which
signal on the AUX-port connector.
Must certain signals be crossed ?
Not at all. The pin out one can find in the manual and at our home page, fits the
description of Nexus standard from the target point of view.
With other words, you have to connect the signals from the device to the
appropriate signals with the same name on the connector. You
must not take care about signal crossing.
©1989-2015 Lauterbach GmbH
MPC56x NEXUS Debugger and Trace
21
Target Design Requirement/Recommendations
No or wrong
Data in Nexus
Trace
There are no or wrong Nexus Trace entries. What can be wrong ?
There are different reasons for the case the Nexus trace remains empty or the
contents of the trace memory is not correct. Often this happens, if new prototype
targets are used. Provided the Nexus probe is not defective, the Nexus probe target connection should be investigated.
To prevent wrong trace analyzer settings by scripts, enter the command
Analyzer.Reset and disable Performance Analysis , before checking the steps
below.
First check if the Nexus probe or the extension cable is properly connected
to the target.
To be able to trace Nexus messages, the appropriate trace signals must be
activated, available at the connector
and they must fit timing and electrical demands.
Activation of trace signals is the job of the Trace32 SW. The user must not
take care about.
The designer of the target is responsible for the availability of all relevant
Nexus signals, according
to the Nexus standard specifications and the information one can find at the
Lauterbach home page
(Adaptions/Connectors).
It is recommended to check the scheme of the target in case of problems.
The following trace signals (trace clock and status signals) are essential for
trace capture:
MCKO, MSEO0 (and MSEO1 in case it is provided by the CPU). It is
recommended to observe these
signals during real time program execution if the trace record counter does not
change, despite the Analyzer
state is in ARM state. All two (three) signals must change their levels.
Trace data signals (MDO0 ... MDO15 , number depending on the aux port width)
have to follow the same requirements
as the trace clock and control signals, but they can not prevent trace entries.
They just can cause wrong trace entries.
©1989-2015 Lauterbach GmbH
MPC56x NEXUS Debugger and Trace
22
Target Design Requirement/Recommendations
Target Aux Port
Connector
Location and
Extension
Cables
Can I use a longer extension cable?
Often customer ignore the warnings regarding the locaction of the aux port
connector and regarding additional extension cables between the debugger and
the target.
This can cause a lot of trouble, especially for high speed applications. We
strongly recommend to place the aux port connector as close as possible
nearby the CPU. As closer as better. Take care about the signal trace length.
Do not connect aux port signals to other connectors than the aux port connector
and prevent signal stubs. Connect a proper termination to the signals coming
from the probe, close to the CPU. Signals from the CPU to the probe should not
be terminated.
One can add 0 Ohm resistors in line of each Nexus signal close to the CPU. If
necessary 0 Ohm can be replaced by a better value.
The debugger does normally not need any pull-up or pull-down, except for reset.
Care must just be taken just for non-Nexus signals. Bear in mind that the target
needs possibly a pull-up or pull-down for certain signals if the debugger is not
connected.
Pay attention about the recommendations of the device manufacturer regarding
the circuitry around the Nexus Aux port.
We also recommend to use no other extension cables than the cables which
come with the debugger.
If possible do not use additional cables at all. Longer cables may work, but must
not. It is the customers risk to use longer once as recommended. We can not
guarantee proper operation.
MPC5XX/8XX
Writing SYPCR has no effect.
Cannot write to
SYPCR
The SYPCR register can only be written one time.
If the SYSTEM.OPTION.WATCHDOG is set to OFF then the CPU WATCHDOG
function will be disabled by the debugger during a SYSTEM.UP. To disable the
WATCHDOG on the CPU the debugger writes to SYPCR and uses the one-time
write access to the SYPCR register.
©1989-2015 Lauterbach GmbH
MPC56x NEXUS Debugger and Trace
23
Target Design Requirement/Recommendations
NEXUSMPC56X
Available
Nexus
Adaptions
Which kind of Nexus adaptions are available for PowerPC debugging? Are
converters also available?
Current Connections and Converters:
Preprocessor
AMP40 (LA-7781)
to
to
AMP50 (LA-7783)
to
to
Glenair51 (LA-7782) to
to
AMP40 8bit/MDO
to
AMP50 8bit/MDO
to
Target
Order Nummer
AMP50
(LA-7786)
Glenair51
follows
AMP40
(LA-7784)
Glenair51
follows
AMP40
(LA-7784)
AMP50
follows
AMP40 2bit/MDO
(LA-7787)
AMP50 2bit/MDO
(LA-7785)
If you need a different adaption it will take a few weeks to develop it.
Some NEXUS connectors are shown in the file below.
http://www.lauterbach.com/faq/nexcon.pdf Nexus Connectors
NEXUSMPC56X
AXIOM EVABoard for 561/3
If I change the CPU to MPC561/3 at the Axiom EVB, I have some problems
to start the debugger on certain frequencies. What can I do?
It seems that the MPC561 and MPC563 is very sensitive about spikes,
overshots and missing or wrong termination on the MCKI line. Unfortunately the
current Axiom EVB has a very long open line at the base board to one of the
Mictor connectors. To improve that behavior, cut the line DSCK/MCKI(J4-66) or/
and short cut the pins 3 - 4 at the BDM-Port connector by a jumper.
For new target designs take care that the location of the NEXUS/READI
connector is very close to the MCP561/3, the aux. port lines are as short as
possible and terminate the lines correctly.
©1989-2015 Lauterbach GmbH
MPC56x NEXUS Debugger and Trace
24
Target Design Requirement/Recommendations
NEXUSMPC56X
BDMDebugport
Fails after
Changing
Clock
Frequency
Why do I get a "emulator debug port problem" when I try to change the
system clock via the System Clock SFRs?
(Taken from CUSTOMER ERRATA AND INFORMATION SHEET CDR_AR_924)
READI: Communication is lost when clock freq. is changed while in BDM mode.
****** DESCRIPTION:
When the READI is being used for BDM, a deadlock occurs when the
development tool tries to enter a low-power mode or change the clock frequency
(via the debug port). The internal clock will still run at the previous frequency. If
code running on the target is changing the frequency then the following will
occur:
All READI MDI/MSEItraffic is ignored when this change is recognized.
All MDO messages in the transmit FIFO will be sent.
Then the MCKO will be stopped until the PLL has relocked at the new frequency.
****** WORKAROUND:
Do not change the System Clock by the NEXUS debugger. Use the code
running on the target to change the clock speed.
Reset the READI module by asserting sreset_b or hreset_b to continue
debugging after unsuccessfully changing the system frequency.
****** NOTE: In newer silicons this problem is fixed.
NEXUSMPC56X
Comparision
PowerTraceNEXUS to
RISC Trace
What is the difference between a Nexus Debugger and a BDM/RISC Trace
configuration?
The main differences are listed in the document below.
http://www.lauterbach.com/faq/nexus_vs_icr.pdf Differences
©1989-2015 Lauterbach GmbH
MPC56x NEXUS Debugger and Trace
25
Target Design Requirement/Recommendations
NEXUSMPC56X
Debugger
access during
PLL setup
What's the reason for "emulation debug port fail" during step over PLL
setup ?
During PLL setup instructions it may happen that MCKO and MCKI are turned
off
for a certain time by the device. It depends on the PLL filter how long it lasts.
Both clocks are important for the communication between the debugger and the
device.
If there is a communication request or a data transfer in progress during the
missing
clocks, it may happen that communication fails. A "Debug port fail" is the result.
To prevent that issue,
do not Step over PLL setup instructions
do not set breakpoints right after PLL setup instructions
make sure that any dual-port access is disabled during PLL setup
disable terminal functionality during PLL setup
NEXUSMPC56X
Different
Address Space
for BDM vs.
Nexus
My Chip Select Setup works with a BDM debugger, but with a Nexus
debugger the CS Setup does not work properly. What is the reason for?
If the upper addresses of the available address space are used to distinguish
between the different chip select lines of the MPC56x, one must be aware that
Nexus trace messages and dual ported memory access uses 25 address lines
only (restricted by the Nexus aux. port protocol). A BDM-Debugger however,
uses the full address space of 32 address lines. The only way to access full
address space is to use the option "SYStem.Option HighMemory ON". Than all
debugger accesses will be handled by BDM instructions in a Nexus message
frame. In this case the CPU must be stopped in any case to access the memory.
Bear in mind, that the trace reconstruction can not work properly in this case,
due to the fact, that the address space in the trace messages can not be
extended.
©1989-2015 Lauterbach GmbH
MPC56x NEXUS Debugger and Trace
26
Target Design Requirement/Recommendations
NEXUSMPC56X
External
Watchdog
timer
Why does the debugger not work on my target with an external watch-dog
timer?
In general, all watch dog timers (WDT) in the system must be disabled anyhow.
The debugger SW needs to initialize the Nexus interface of the device and must
do other settings. Also it takes some time to start a user program. If a WDT pulls
Reset before it can be disabled, the debugger SW has no chance to finish
initialization.
The device internal WDT will be disabled by the debugger SW during startup
automatically.
An external WDT must be turned off by HW. This is very important, because
normally a batch job (Practice) sequence is too slow to do it in time by SW.
The only chance to disable an external WDT by SW is to use an appropriate
user program on the target which will be started by SYSTEM.STANDBY. This is
the fastest method to start a user program out of Reset.
NEXUSMPC56X
MDI/MDO
Lines
Disconnected
in MDO2 Mode
NEXUSMPC56X
Nexus Debug
Port Fail
Do MDI/MDO lines have to be disconnected from Nexus port in MDO2
mode?
Normally the only line which must be disconnected is MDI1.
MDO 7..2 are input lines anyway and don't need to be disconnected. But it is
recommended and usually done by the small PCB.
Why do I get the error message "Emulator debug port fail"?
This is a global nexus protocol error . There are different reasons for this error
message:
Nexus message access timeout
MCKO clock is missing
general connector problems
NEXUSMPC56X
Nexus Probe
(MNAD_x)
Front
Connector
What is the pinout and the meaning of the Nexus Probe Front Connector?
(MNAD_x)
Please refer to the pdf file.
http://www.lauterbach.com/faq/frontjumperpinoutmbmad.pdf Pinout for
MBMAD front connector
©1989-2015 Lauterbach GmbH
MPC56x NEXUS Debugger and Trace
27
Target Design Requirement/Recommendations
NEXUSMPC56X
Port
Replacement
Feature
NEXUSMPC56X
Realtime
Recording by
NEXUS
Is the port replacement feature supported?
We don't expect to support the port replacement feature. It's made to use the
same pins for Nexus and for the application when using an 80 pin connector. But
device manufacturers don't seem to have plans to support this feature.
Can there be a delay between the time of a message is entered into the
NEXUS message queue and the time of this message is sampled in the
trace?
Yes, there can be a delay between the time of a message is entered into the
NEXUS message queue (max. 8 entries) and the time of this message is
sampled into the trace and marked with a time stamp.
Delay due to different priorities of messages
NEXUS messages have different priorities. High priority messages are output
first. High priority messages are for example Invalid Messages. Data or Program
messages have a low priority. The delay is not predictable.
Delay due to the filling degree of the NEXUS queue
If the NEXUS queue is nearly full when a message is entered, it take more time
until the message is output. The delay is not predictable.
Delay due to port width
If a small NEXUS model is used it takes more time to output a message then on
a large NEXUS model. The delay is predictable.
Delay due to message portion collector in the NEXUS debugger
A message can be 16, 24, 32 ... bit long. The NEXUS port has a width of 2 or 8
bit. So the NEXUS debugger has to wait until the complete message is output.
When the NEXUS debugger received the full message, the message is sampled
into the trace buffer and marked with a time stamp.
NEXUSMPC56X
Which slot on the PowerTrace is used for the NEXUS adapter?
For the Motorola MPC56x family slot C has to be used.
Required Slot
for NEXUS
Preprocessor
©1989-2015 Lauterbach GmbH
MPC56x NEXUS Debugger and Trace
28
Target Design Requirement/Recommendations
NEXUSMPC56X
What do I have to consider if I want to debug the TPU?
To debug the TPU the CPU has to enter the test mode.
TPU Registers
are all Reset to
Zero
An example is given in demo\powerPC\etc\tpu.cmm on the TRACE32 software
CD.
http://www.lauterbach.com/faq/tpu.cmm Demo
NEXUSMPC56X
Trace Impacts ,
Full trace
settings
NEXUSMPC56X
Usage of
Nexus-pins or
IO-pins
Are there impacts using Nexus trace ? What are the right settings to get
full trace?
Refer to the Motorola's AN
http://www.lauterbach.com/faq/pages_from_nexus08oct20011.pdf AN by
Motorola
Can the multi function pins (Nexus or I/O ) be usesed as I/O during Nexus
debugging?
No, they can't. When Nexus port is active the I/O function of the multi function
pins will be disabled.
If you prefer to debug and to use these I/O pins at a time you need to connect
the additional BDM debug cable (no trace capability; extra charge) to
PowerTrace instead of the Nexus preprocessor.
NEXUSMPC56X
Usage of the
Terminal with
NEXUS
How is the terminal supposed to be used on nexus?
It works like dual port memory. So SingleE and BufferE are prefered modes.
READPIPE and WRITEPIPE can connect the "host side"of the terminal to a
named pipe on the host to talk to another application (not nexus specific).
©1989-2015 Lauterbach GmbH
MPC56x NEXUS Debugger and Trace
29
Target Design Requirement/Recommendations
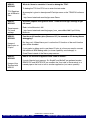
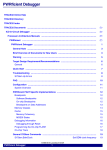
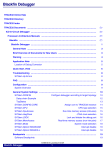
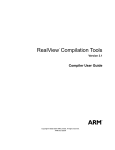
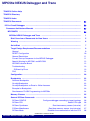
Configuration
HUB
PC or
Workstation
100 MBit Ethernet
Target
PODBUS IN
TRIG
NEXUS Adapter
SELECT
LOGIC ANALYZER PROBE
EMULATE
DEBUG CABLE
RECORDING
TRIGGER
ETHERNET
CON ERR
TRANSMIT
RECEIVE
POWER
7-9 V
COLLISION
PODBUS OUT
LAUTERBACH
C
B
A
POWER TRACE / ETHERNET
NEXUS
Connector
USB
Ethernet
Cable
POWER TRACE / ETHERNET
POWER
AC/DC Adapter
©1989-2015 Lauterbach GmbH
MPC56x NEXUS Debugger and Trace
30
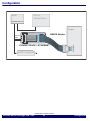
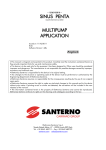
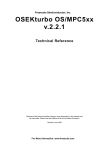
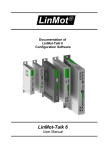
Configuration
HUB
PC or
Workstation
1 GBit Ethernet
PODBUS SYNC
TRIG
SELECT
RUNNING
USB
Target
DEBUG CABLE
LINK
ACTIVITY
ETHERNET
Ethernet
Cable
POWER DEBUG II
POWER
POWER
7-9 V
PODBUS OUT
LAUTERBACH
POWER TRACE II
PODBUS EXPRESS OUT
PODBUS EXPRESS IN
LAUTERBACH
POWER
SELECT
LOGIC ANALYZER PROBE
RECORD
RUNNING
PREPROCESSOR / NEXUS
POWER
7-9V
B
A
NEXUS
Connector
C
NEXUS Adapter
PODBUS OUT
PODBUS EXPRESS OUT
POWER DEBUG II
POWER TRACE II
AC/DC Adapter
©1989-2015 Lauterbach GmbH
MPC56x NEXUS Debugger and Trace
31
Configuration
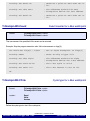
Breakpoints
There are two types of breakpoints available: software breakpoints (SW-BP) and on-chip breakpoints (HWBP).
Software Breakpoints
Software breakpoints are the default breakpoints on instructions. Software breakpoints can be set to any
instruction address in RAM and after some preparations also to instructions in FLASH. For more
information, refer to the command FLASH.AUTO.
There is no restriction in the number of software breakpoints. Please consider that increasing the number of
software breakpoints will reduce the debug speed.
On-chip Breakpoints
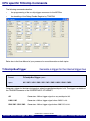
The following list gives an overview of the usage of the on-chip breakpoints by TRACE32:
•
CPU family
•
On-chip breakpoints: Total amount of available on-chip breakpoints.
•
Instruction breakpoints: Number of on-chip breakpoints that can be used for Program
breakpoints.
•
Read/write breakpoints: Number of on-chip breakpoints that can be used as Read or Write
breakpoints.
•
Data breakpoints: Number of on-chip data breakpoints that can be used to stop the program
when a specific data value is written to an address or when a specific data value is read from an
address.
CPU Family
On-chip
Breakpoints
Instruction
Breakpoints
Read/write
Breakpoints
Data
Breakpoints
MPC5xx
4 Instruction
2 Read/Write
4
2
2
©1989-2015 Lauterbach GmbH
MPC56x NEXUS Debugger and Trace
32
Breakpoints
On-chip Breakpoints on InstructionsROM or FLASH
If a breakpoint is set to an instruction, a software breakpoint is used by default. If your code is in FLASH,
ROM etc. you can advise TRACE32 to automatically use on-chip breakpoint for specific address ranges by
using the command MAP.BOnchip <range>.
On-chip Breakpoints on Read or Write Accesses
On-chip breakpoints are always used, if a Read or Write breakpoint is set. For the MPC5xx/8xx it is also
possible to define a specific data value. Refer to the Break.Set command for more information.
Example for Breakpoints
Assume you have a target with FLASH from 0 to 0xFFFFF and RAM from 0x100000 to 0x11FFFF. The
command to configure TRACE32 correctly for this configuration is:
Map.BOnchip 0x0--0x0FFFFF
The following breakpoint combinations are possible.
Software breakpoints:
Break.Set 0x100000 /Program
; Software Breakpoint 1
Break.Set 0x101000 /Program
; Software Breakpoint 2
Break.Set 0xx /Program
; Software Breakpoint 3
On-chip breakpoints:
Break.Set 0x100 /Program
; On-chip Breakpoint 1
Break.Set 0x0ff00 /Program
; On-chip Breakpoint 2
©1989-2015 Lauterbach GmbH
MPC56x NEXUS Debugger and Trace
33
Breakpoints
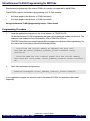
Simultaneous FLASH Programming for MPC56x
Simultaneous programming of the internal FLASH is currently not supported for the MPC56x.
The MPC555 supports simultaneous programming of all 14 flash modules.
•
8 64-byte pages in the 8 blocks of FLASH module A
•
6 64-byte pages in the 6 blocks of FLASH module B
Using simultaneous FLASH programming is up to 7 times faster!
Programming Procedure
1.
Load the application program into the virtual memory of TRACE32-ICD.
For the simultaneous FLASH programming the code can not directly be loaded from the host. The
code has to be loaded into the virtual memory (VM) of TRACE32-ICD first.
TRACE32-PowerView can recognize empty 64-byte pages and skip them while programming. For
this reason the virtual memory should be initialized with 0xff.
; initialize the virtual memory of TRACE32-ICD with 0xff
Data.Set VM:<start_address_internal_flash>++0x6ffff %Long
0xffffffff
; load the code for the internal FLASH into the virtual memory
Data.LOAD.Elf <file_name> <start_address_internal_flash>++0x6ffff /
VM
2.
Start the simultaneous programming.
FLASH.MultiProgram <start_address_internal_flash>++0x6ffff
If your application program also contains code for the external FLASH, this code has to be loaded
separately.
©1989-2015 Lauterbach GmbH
MPC56x NEXUS Debugger and Trace
34
Breakpoints
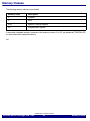
Memory Classes
The following memory classes are available:
Memory Class
Description
P
Program
D
Data
SPR
Special Purpose Register
CP
Compressed Program
If the cache is disabled, memory accesses to the memory classes IC or DC are realized by TRACE32-ICD
as reads and writes to physical memory.
©1989-2015 Lauterbach GmbH
MPC56x NEXUS Debugger and Trace
35
Memory Classes
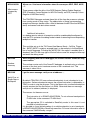
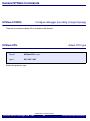
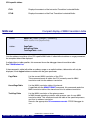
General SYStem Commands
SYStem.CONFIG
Configure debugger according to target topology
There are no multicore capable CPUs available at the moment.
SYStem.CPU
Select CPU type
Format:
SYStem.CPU <cpu>
<cpu>:
561 | 563 | 565
Selects the processor type.
©1989-2015 Lauterbach GmbH
MPC56x NEXUS Debugger and Trace
36
General SYStem Commands
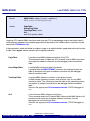
SYStem.CpuAccess
Run-time memory access (intrusive)
Format:
SYStem.CpuAccess <mode>
<mode>:
Enable | Denied | Nonstop
Enable
Enable performs an update of the memory displayed in the TRACE32 window.
Therefore the debugger stops the program execution about 10 times/s, switches
to debug mode, updates the memory and restarts the program execution
afterwards.
Each short stop takes 1 … 100 ms depending on the speed of the debug
interface and on the size of the read/write accesses required.
The run-time memory access has to be activated for each window by using the
memory class E: (e.g. Data.dump E:0x100) or by using the format option %E
(e.g. Var.View %E var1).
Denied
No memory read or write is possible while the CPU is executing the program.
Nonstop
Nonstop ensures that the program execution can not be stopped and that the
debugger doesn’t affect the real-time behavior of the CPU.
Nonstop reduces the functionality of the debugger to:
•
run-time access to memory and variables
•
trace display
The debugger inhibits the following:
•
to stop the program execution
•
all features of the debugger that are intrusive (e.g. spot breakpoints, performance analysis via StopAndGo, conditional breakpoints etc.)
SYStem.MemAccess
Real-time memory access (non-intrusive)
.
Format:
SYStem.MemAccess NEXUS | Denied
NEXUS
Memory access is done via the NEXUS interface.
Denied
.Real-time memory access during program execution to target is disabled.
Default: Denied.
©1989-2015 Lauterbach GmbH
MPC56x NEXUS Debugger and Trace
37
General SYStem Commands
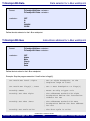
SYStem.Mode
Establish the communication with the CPU
Format:
SYStem.Mode <mode>
<mode>:
Down
Up
Select target reset mode.
Down
Disables the debugger.
Depending on the SYStem.Option TriState The Nexus lines will be tristated or
the CPU will be hold in reset.
StandBy
This mode is used to start debugging from power-on. The debugger will wait
until power-on is detected, then bring the CPU into debug mode, set all debug
and trace registers and start the CPU. In order to halt the CPU at the first
instruction, place an on-chip breakpoint to the reset address
(Break.Set 0x100 /Onchip)
Up
Resets the CPU, enables the debug mode and stops the CPU at the first
opfetch (reset vector). All register are set to the default value.
Go
Resets the target with debug mode enabled and prepares the CPU for debug
mode entry. After this command the CPU is in the system.up mode and running.
Now, the processor can be stopped with the break command or until any break
condition occurs.
Debugger functions for StandBy:
Target Power
HRESET/
Debugger State
not ok
xxx
StandBy
ok
active
StandBy (NEXUS initialized and waiting for HRESET/ no
longer active)
ON
not active
Up (the NEXUS debugger enables the debug mode and
starts the user program immediately.
The program execution can be stopped manually or at an
on-chip breakpoint)
The target power is checked by a voltage comparator. The voltage is defined by VREF.
If StandBy is selected, the NEXUS debugger will change into StandBy mode as soon as the target power
fails or HRSET/ becomes active. To terminate this, select SYStem.Mode Down or SYStem.Mode Up
explicitly.
©1989-2015 Lauterbach GmbH
MPC56x NEXUS Debugger and Trace
38
General SYStem Commands
CPU specific SYStem Commands
SYStem.LOADVOC
Format:
Load vocabulary for code compression
SYStem.LOADVOC <file>
Load vocabulary for code compression. This is usually not required, since the vocabulary is already in the
ELF file.
FLASH.MultiProgram
Simultaneous programming of on-chip FLASH
Available on:
MPC555 (K1, K2, K3)
Format:
FLASH.MultiProgram <range>
Allows simultaneous programming of the internal FLASH. For a complete description of the programming
procedure see Simultaneous FLASH Programming for MPC555.
©1989-2015 Lauterbach GmbH
MPC56x NEXUS Debugger and Trace
39
CPU specific SYStem Commands
SYStem.Option BRKNOMSK
Format:
Allow program stop in a non-recoverable state
SYStem.Option BRKNOMSK [ON | OFF]
The CPU handles debug events similar to exceptions. When a debug event (normally a break) OR an
exception occurs, the CPU copies the MSR (Machine Status Register) into SRR1 (Machine Status Save/
Restore Register 1) and the IP (Instruction Pointer) into SRR0 (Machine Status Save/Restore Register 1).
This means, that after an exception occurred, the old values of IP and MSR are as backup in the SRR0 and
SRR1 registers. If now a break happens, these values will be overwritten by the new MSR and IP values. So,
it is possible to return to the exception routine and stop the processor, but it’s not possible to return to the
main program and continue the user application! The status after the start of the exception routine is
called non recoverable state.
If one wants to break in a non recoverable state, you must switch the option BrkNoMsk to on.
ON
The program execution can be stopped by a breakpoint even if the processor is
in a non-recoverable state. Since the debug exception overwrites SRR0 and
SRR1 it is not advisable to continue the debugging process.
OFF
The program execution is not stopped as long as the processor is in a nonrecoverable state (RI bit cleared in the Machine Status register).
SYStem.Option BTM
Format:
Control for branch trace messages
SYStem.Option BTM [ON | OFF]
Control for the NEXUS branch trace messages.
ON
NEXUS outputs branch trace messages.
OFF
No branch trace messages are output by NEXUS.
SYStem.Option CCOMP
Format:
Enable code compression
SYStem.Option CCOMP [ON | OFF]
If the code compression unit of the MPC5xx is used, this option must be switched on before the program is
loaded. Then correct disassembly is possible.
©1989-2015 Lauterbach GmbH
MPC56x NEXUS Debugger and Trace
40
CPU specific SYStem Commands
SYStem.Option CLEARBE
Format:
Clear MSR[BE] on step/go
SYStem.Option CLEARBE [ON | OFF]
If the option CLEARBE is switched on, the BE bit of the MSR register will be cleared before every Go or
Step.
SYStem.Option DUALPORT
Format:
Run-time memory access for all windows
SYStem.Option DUALPORT [ON | OFF]
If SYStem.MemAccess NEXUS is ON and SYStem.Option DUALPORT is ON, run-time memory access
is automatically activated for each displayed memory location and variable.
SYStem.Option DTM
Format:
Control for data trace messages
SYStem.Option DTM [ON | OFF]
Control for the NEXUS data trace messages.
ON
NEXUS outputs data trace messages.
OFF
No data trace messages are output by NEXUS.
SYStem.Option EXTVECTORS
Format:
Workaround for revision C silicon
SYStem.Option EXTVECTORS <range>
Workaround for revision C silicon.
©1989-2015 Lauterbach GmbH
MPC56x NEXUS Debugger and Trace
41
CPU specific SYStem Commands
SYStem.Option HighMemory
Format:
Switch on high memory
SYStem.Option HighMemory [ON | OFF]
If the upper addresses of the available address space are used to distinguish between the different chip
select lines of the MPC56x, one must be aware that Nexus trace messages and dual ported memory access
uses 25 address lines only (restricted by the Nexus aux. port protocol). A BDM-Debugger however, uses the
full address space of 32 address lines. The only way to access full address space is to use the option
SYStem.Option HighMemory ON. Than all debugger accesses will be handled by BDM instructions in a
Nexus message frame. In this case the CPU must be stopped in any case to access the memory. Bear in
mind, that the trace reconstruction can not work properly in this case, due to the fact , that the address space
in the trace messages can not be extended.
©1989-2015 Lauterbach GmbH
MPC56x NEXUS Debugger and Trace
42
CPU specific SYStem Commands
SYStem.Option IBUS
Format:
Configure the show cycles for the I-BUS
SYStem.Option IBUS [<Value>]
With this option, you can set the instruction fetch show cycle and serialize control bits of the IBUS support
control register. TRACE32 does the best setting for NEXUS Trace automatically.
SERALL
All fetch cycles are visible on the external bus. In this mode the processor is
fetch serialized. Therefore the processor performance is much lower then
working in regular mode.
SERCHG
All cycles that follow a change in the program flow are visible on the external
bus. In this mode the processor is fetch serialized. Therefore the processor
performance is much lower then working in regular mode.
SERIND
All cycles that follow an indirect change in the program flow are visible on the
external bus. In this mode the processor is fetch serialized. Therefore the
processor performance is much lower then working in regular mode.
SERNONE
In this mode the processor is fetch serialized. Therefore the processor
performance is much lower then working in regular mode. No information about
the program flow is visible on the external bus.
CHG
All cycles that follow a change in the program flow are visible on the external
bus. The performance degradation is small here.
IND
All cycles that follow an indirect change in the program flow are visible on the
external bus. The performance degradation is small here.
This setting is recommended if a preprocessor for MPC500/800 is used.
NONE
No show cycles are performed. (Recommended when only a BDM debugger is
used.)
RESERVED
Should not be used.
SYStem.Option ICFLUSH
Flush branch target cache before program start
t
Format:
SYStem.Option ICFLUSH [ON | OFF]
Invalidates the instruction cache and flush the data cache before starting the target program (Step or Go).
This is required when the CACHEs are enabled and software breakpoints are set to a cached location.
©1989-2015 Lauterbach GmbH
MPC56x NEXUS Debugger and Trace
43
CPU specific SYStem Commands
SYStem.Option IMASKASM
Format:
Disable interrupts while single stepping
SYStem.Option IMASKASM [ON | OFF]
Default: OFF.
If enabled, the interrupt mask bits of the CPU will be set during assembler single-step operations. The
interrupt routine is not executed during single-step operations. After single step the interrupt mask bits are
restored to the value before the step.
SYStem.Option IMASKHLL
Format:
Disable interrupts while HLL single stepping
SYStem.Option IMASKHLL [ON | OFF]
Default: OFF.
If enabled, the interrupt mask bits of the cpu will be set during HLL single-step operations. The interrupt
routine is not executed during single-step operations. After single step the interrupt mask bits are restored to
the value before the step.
SYStem.Option LittleEnd
Format:
Selection of little endian mode
SYStem.Option LittleEnd [ON | OFF]
With this option data is displayed little endian style.
Normally, the PowerPC debugger displays data big endian style.
©1989-2015 Lauterbach GmbH
MPC56x NEXUS Debugger and Trace
44
CPU specific SYStem Commands
SYStem.Option Nexus
Format:
Set NEXUS auxiliary output width
SYStem.Option Nexus MDO2 | MDO8
MDO2
Small NEXUS model is used.
With the small NEXUS model the NEXUS auxiliary output is only 2 bit wide.
MDO8
Large NEXUS model is used.
With the large NEXUS model the NEXUS auxiliary output is 8 bit wide.
SYStem.Option NODATA
Format:
The external data bus is not connected to trace
SYStem.Option NODATA [ON | OFF]
This command is not necessary for the NEXUS debugger. It is only available to keep PRACTICE scripts
compatible for both the BDM and the NEXUS debugger.
SYStem.Option NOTRAP
Format:
Use alternative instruction to enter debug mode
SYStem.Option NOTRAP [ON | OFF]
By setting a software breakpoint the original code at the break location is patched by TRAP. If the TRAP
command is already used by the application software for another purpose, an illegal instruction is patched
instead of TRAP if the SYStem.Option NOTRAP is ON.
©1989-2015 Lauterbach GmbH
MPC56x NEXUS Debugger and Trace
45
CPU specific SYStem Commands
SYStem.Option OTM
Format:
Control for ownership trace messages
SYStem.Option OTM [ON | OFF]
Control for the NEXUS ownerchip trace messages.
ON
NEXUS outputs ownership trace messages.
OFF
No ownership trace messages are output by NEXUS.
SYStem.Option OVERLAY
Format:
Enable overlay support
SYStem.Option OVERLAY [ON | OFF | WithOVS]
Default: OFF.
ON: Activates the overlay extension and extends the address scheme of the debugger with a 16 bit virtual
OverlayID. Addresses therefore have the format <OverlayID>:<address>. This enables the
debugger to handle overlayed program memory.
OFF: Disables support for code overlays.
WithOVS: Like option ON, but also enables support for software breakpoints. This means that TRACE32
writes software breakpoint opcodes both to the execution area (for active overlays) and to the storage area.
In this way, it is possible to set breakpoints into inactive overlays. Upon activation of the overlay, the target's
runtime mechanisms copies the breakpoint opcodes to execution area. For using this option, the storage
area must be readable and writable for the debugger.
SYStem.Option OVERLAY ON
Data.List 0x2:0x11c4
; Data.List <OverlayID>:<address>
SYStem.Option PPCLittleEnd
Format:
Control for PPC little endian
SYStem.Option LittleEnd [ON | OFF]
Normally, the PowerPC debugger displays data big endian style.
©1989-2015 Lauterbach GmbH
MPC56x NEXUS Debugger and Trace
46
CPU specific SYStem Commands
With this option data is displayed in PPC little endian style.
SYStem.Option PTM
Format:
Control for program trace messages
SYStem.Option PTM [ON | OFF]
This system option is automatically set by TRACE32. Before you change the default setting of this system
option please contact LAUTERBACH.
SYStem.Option PTSM
Format:
Control for program trace synchronisation messages
SYStem.Option PTSM [ON | OFF]
This system option is automatically set by TRACE32. Before you change the default setting of this system
option please contact LAUTERBACH.
SYStem.Option QFM
Format:
Control for queue flush messages
SYStem.Option QFM [ON | OFF]
This system option is automatically set by TRACE32. Before you change the default setting of this system
option please contact LAUTERBACH.
SYStem.Option SCRATCH
Available on:
Format:
Scratch for FPU access
MPC5xx
SYStem.Option SCRATCH <address> | AUTO
Reading the FPU registers of the MPC5xx requires two memory words in target memory. This option defines
which location is used. The content of the memory location will be restored after use.
©1989-2015 Lauterbach GmbH
MPC56x NEXUS Debugger and Trace
47
CPU specific SYStem Commands
SYStem.Option SIUMCR
Format:
SIUMCR setting for the trace
SYStem.Option SIUMCR [<value>]
This command is not necessary for the NEXUS debugger. It is only available to keep PRACTICE scripts
compatible for both the BDM and the NEXUS debugger.
SYStem.Option SmartTrace
Format:
ON
Allow SMARTTRACE algorithm to fill trace gaps
SYStem.Option SmartTrace [ON | OFF]
Allow TRACE32 to fill the trace gaps by the SmartTrace algorithm when the
command CTS.List is used.
SYStem.Option TriState
Format:
Control for NEXUS lines
SYStem.Option TriState [ON | OFF]
ON
TriState NEXUS line in SYStem.Down.
OFF
Hold CPU in reset in SYStem.Down.
SYStem.Option VECTORS
Format:
Define ranges for not-standard interupt vectors
SYStem.Option VECTORS <range> [<range> | <range> … ]
Define the address ranges for not-standard interrupt vectors for the disassembler. This is necessary if the
interrupt vector table is relocated or if the enhanced interrupt control is used.
©1989-2015 Lauterbach GmbH
MPC56x NEXUS Debugger and Trace
48
CPU specific SYStem Commands
SYStem.Option WATCHDOG
Format:
Enable software watchdog after SYStem.Up
SYStem.Option WATCHDOG [ON | OFF]
If this option is switched off, the watchdog timer of the CPU is disabled after the SYStem.Up.
Otherwise the watchdog will be periodically reset by the debugger. Software Watchdog Timer (SWT) —
The SWT asserts a reset or non-maskable interrupt (as selected by the system protection control register) if
the software fails to service the SWT for a designated period of time (e.g, because the software is trapped in
a loop or lost). After a system reset, this function is enabled with a maximum time-out period and asserts a
system reset if the time-out is reached. The SWT can be disabled or its time-out period can be changed in
the SYPCR. Once the SYPCR is written, it cannot be written again until a system reset.
Software Watchdog Timer (SWT) — The SWT asserts a reset or non-maskable
interrupt (as selected by the system protection control register) if the software
fails to service the SWT for a designated period of time (e.g, because the
software is trapped in a loop or lost). After a system reset, this function is
enabled with a maximum time-out period and asserts a system reset if the timeout is reached. The SWT can be disabled or its time-out period can be changed
in the SYPCR. Once the SYPCR is written, it cannot be written again until a
system reset.
SYStem.state
Format:
Display SYStem window
SYStem.state
Displays the SYStem window.
©1989-2015 Lauterbach GmbH
MPC56x NEXUS Debugger and Trace
49
CPU specific SYStem Commands
CPU specific MMU Commands
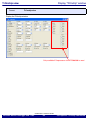
MMU.DUMP
Page wise display of MMU translation table
Format:
MMU.DUMP <table> [<range> | <addr> | <range> <root> | <addr> <root>]
MMU.<table>.dump (deprecated)
<table>:
PageTable
KernelPageTable
TaskPageTable <task>
and CPU specific tables
Displays the contents of the CPU specific MMU translation table.
•
If called without parameters, the complete table will be displayed.
•
If the command is called with either an address range or an explicit address, table entries will
only be displayed, if their logical address matches with the given parameter.
The optional <root> argument can be used to specify a page table base address deviating from the default
page table base address. This allows to display a page table located anywhere in memory.
PageTable
Display the current MMU translation table entries of the CPU.
This command reads all tables the CPU currently used for MMU translation
and displays the table entries.
KernelPageTable
Display the MMU translation table of the kernel.
If specified with the MMU.FORMAT command, this command reads the
MMU translation table of the kernel and displays its table entries.
TaskPageTable
Display the MMU translation table entries of the given process.
In MMU based operating systems, each process uses its own MMU
translation table. This command reads the table of the specified process,
and displays its table entries.
See also the appropriate OS awareness manuals: RTOS Debugger for
<x>.
©1989-2015 Lauterbach GmbH
MPC56x NEXUS Debugger and Trace
50
CPU specific MMU Commands
CPU specific tables:
ITLB
Displays the contents of the Instruction Translation Lookaside Buffer.
DTLB
Displays the contents of the Data Translation Lookaside Buffer.
MMU.List
Compact display of MMU translation table
Format:
MMU.List [<table> [<range> | <address>]]
MMU.<table>.List (deprecated)
<table>:
PageTable
KernelPageTable
TaskPageTable <task>
Lists the address translation of the CPU specific MMU table. If called without address or range parameters,
the complete table will be displayed.
If called without a table specifier, this command shows the debugger internal translation table.
See TRANSlation.List.
If the command is called with either an address range or an explicit address, table entries will only be
displayed, if their logical address matches with the given parameter.
PageTable
List the current MMU translation of the CPU.
This command reads all tables the CPU currently used for MMU
translation and lists the address translation.
KernelPageTable
List the MMU translation table of the kernel.
If specified with the MMU.FORMAT command, this command reads the
MMU translation table of the kernel and lists its address translation.
TaskPageTable
List the MMU translation of the given process.
In MMU based operating systems, each process uses its own MMU
translation table. This command reads the table of the specified process,
and lists its address translation.
See also the appropriate OS awareness manuals: RTOS Debugger for
<x>.
©1989-2015 Lauterbach GmbH
MPC56x NEXUS Debugger and Trace
51
CPU specific MMU Commands
MMU.SCAN
Load MMU table from CPU
Format:
MMU.SCAN <table> [<range> <address>]
MMU.<table>.SCAN (deprecated)
<table>:
PageTable
KernelPageTable
TaskPageTable <task>
ALL
and CPU specific tables
Loads the CPU specific MMU translation table from the CPU to the debugger internal translation table. If
called without parameters the complete page table will be loaded. The loaded address translation can be
viewed with TRANSlation.List.
If the command is called with either an address range or an explicit address, page table entries will only be
loaded if their logical address matches with the given parameter.
PageTable
Load the current MMU address translation of the CPU.
This command reads all tables the CPU currently used for MMU translation,
and copies the address translation into the debugger internal translation
table.
KernelPageTable
Load the MMU translation table of the kernel.
If specified with the MMU.FORMAT command, this command reads the
table of the kernel and copies its address translation into the debugger
internal translation table.
TaskPageTable
Load the MMU address translation of the given process.
In MMU based operating systems, each process uses its own MMU
translation table. This command reads the table of the specified process,
and copies its address translation into the debugger internal translation
table.
See also the appropriate OS awareness manuals: RTOS Debugger for
<x>.
ALL
Load all known MMU address translations.
This command reads the OS kernel MMU table and the MMU tables of all
processes and copies the complete address translation into the
debugger internal translation table.
See also the appropriate OS awareness manuals: RTOS Debugger for
<x>.
©1989-2015 Lauterbach GmbH
MPC56x NEXUS Debugger and Trace
52
CPU specific MMU Commands
CPU specific tables:
ITLB
Loads the instruction translation table from the CPU to the debugger internal
translation table.
DTLB
Loads the data translation table from the CPU to the debugger internal
translation table.
TLB
Loads the translation table from the CPU to the debugger internal translation
table.
TLB0
Loads the translation table 0 from the CPU to the debugger internal
translation table.
TLB1
Loads the translation table 1from the CPU to the debugger internal
translation table.
TLB2
Loads the translation table 2 from the CPU to the debugger internal
translation table.
©1989-2015 Lauterbach GmbH
MPC56x NEXUS Debugger and Trace
53
CPU specific MMU Commands
CPU specific NEXUS Commands
NEXUS.BTM
Format:
Program trace messaging enable
NEXUS.BTM [ON | OFF]
SYStem.Option BTM [ON | OFF] (deprecated)
Control for NEXUS program trace messaging.
ON (default)
Program trace messaging enabled.
OFF
Program trace messaging disabled.
NEXUS.DTM
Data trace messaging enable
Format:
NEXUS.DTM <mode>
SYStem.Option DTM [OFF | ON | Read | Write | ReadWrite] (deprecated)
<mode>:
OFF | ON | Read | Write | ReadWrite
Controls the Data Trace Messaging method.
OFF
Data trace messaging disabled (default)
ON
(Same as ReadWrite)
Read
Write
ReadWrite
Data trace messages for read accesses (load instructions)
Data trace messages for write accesses (store instructions)
Data trace messages for read and write accesses (load and store instructions)
©1989-2015 Lauterbach GmbH
MPC56x NEXUS Debugger and Trace
54
CPU specific NEXUS Commands
NEXUS.OFF
Format:
Switch the NEXUS trace port off
NEXUS.OFF
If the debugger is used stand-alone, the trace port is disabled by the debugger.
NEXUS.ON
Format:
Switch the NEXUS trace port on
NEXUS.ON
The NEXUS trace port is switched on. All trace registers are configured by debugger.
NEXUS.OTM
Format:
Ownership trace messaging enable
NEXUS.OTM [OFF | ON ]
SYStem.Option OTM [OFF | ON] (deprecated).
Controls ownership trace messaging.
OFF
Ownership trace messaging disabled (default)
ON
Enable ownership trace messaging. An OTM is generated if the application
writes to the PID register.
NEXUS.PortSize
Set trace port width
Format:
NEXUS.PortSize <portsize>
SYStem.Option.Nexus<portsize> (deprecated)
<portsize>:
MDO8 | MDO2
Sets the nexus port width to the number of used MDO pins. The setting can only be changed if no debug
session is active (SYStem.Down).
©1989-2015 Lauterbach GmbH
MPC56x NEXUS Debugger and Trace
55
CPU specific NEXUS Commands
NEXUS.Register
Format:
Display NEXUS trace control registers
NEXUS.Register
This command opens a window which shows the NEXUS configuration and status registers of NPC, core
and other trace clients.
NEXUS.RESet
Format:
Reset NEXUS trace port settings
NEXUS.RESet
Resets NEXUS trace port settings to default settings.
NEXUS.state
Format:
Display NEXUS port configuration window
NEXUS.state
Display NEXUS trace configuration window.
©1989-2015 Lauterbach GmbH
MPC56x NEXUS Debugger and Trace
56
CPU specific NEXUS Commands
CPU specific TrOnchip Commands
The following commands describe:
•
the programming of the on-chip trigger resources for the MPC5xx
•
the handling of the Debug Enable Register by TRACE32
Refer also to the User Manual of your processor for more information on both topics.
TrOnchip.BusTrigger
Generate a trigger for the internal trigger bus
Format:
TrOnchip.BusTrigger <par>
<par>:
All | LWO | LW1 | IW0 | IW1 | IW2 | IW3 | LW01 | IW01 | IW23
Generate a trigger for the internal trigger bus, when the specified watchpoint is hit. The trigger is available on
the TRIGGER connector of the POWERTRACE / ETHERNET.
All
Generate a 100 ns trigger signal on any watchpoint hit.
LW0 | LW1
Generate a 100 ns trigger signal when LW0/1 is hit.
IW0 | IW1 | IW2 | IW3
Generate a 100 ns trigger signal when IW0/1/2/3 is hit.
©1989-2015 Lauterbach GmbH
MPC56x NEXUS Debugger and Trace
57
CPU specific TrOnchip Commands
LW01
Activate the trigger when LW0 is hit, deactive the trigger when LW1 is hit.
IW01 | IW23
Activate the trigger when IW0 is hit, deactive the trigger when IW1 is hit.
Example: Generate a 100 ns trigger pulse for the TRIGGER connector of the POWERTRACE / ETHERNET
if the function sieve is entered.
; Program the on-chip trigger unit
Break.Set sieve /Alpha
; Set an Alpha breakpoint to the
; entry of sieve
TrOnchip.RESet
; Reset on-chip trigger unit
TrOnchip.IW0.Ibus Alpha
; The addresses marked with Alpha
; breakpoints define the I-Bus
; address
TrOnchip.IW0.WATCH ON
; Activate the watchpoint function
TrOnchip.BusTrigger IW0
; Select IW0 as source for the
; trigger signal
Configure the internal trigger bus
TrBus.RESet
; Reset trigger bus settings
TrBus.Connect Out
; The TRIGGER connector works as
; output
TrBus.Mode Low
; The trigger signal is low active
TrBus.Out Break OFF
TrOnchip.CONVert
Format:
Adjust range breakpoint in on-chip resource
TrOnchip.CONVert [ON | OFF]
For on-chip-breakpoints see the corresponding chapter.
©1989-2015 Lauterbach GmbH
MPC56x NEXUS Debugger and Trace
58
CPU specific TrOnchip Commands
The MPC5xx family provides the follwing on-chip breakpoints:
MPC5xx
4 Instruction,
2 Read/Write
4
4 single I-bus
breakpoints or 2
I-bus breakpoint
ranges
2
2 single L-bus
breakpoints or 1
L-bus
breakpoint
ranges
2
ON (default)
If all resources for the on-chip breakpoints are already used and if the user
wants to set an additional on-chip breakpoint, TRACE32 converts an on-chip
breakpoint set to a short address range (max. 4 bytes) to a single address
breakpoint to free additional resources.
OFF
If all resources for the on-chip breakpoints are already used and if the user
wants to set an additional on-chip breakpoint, an error message is displayed.
Example:
TrOnchip.Convert ON
Break.Set 0x100++0x4 /Write
; Set a write breakpoint to the
; address range 0x100++0x4
Break.Set 0x800 /Write
; Set a write breakpoint to the address
; 0x800. The first set breakpoint is
; reduced to address 0x100
TrOnchip.DISable
Format:
Disable NEXUS trace register control
TrOnchip.DISable
Disables NEXUS register control by the debugger. By executing this command, the debugger will not write or
modify any registers of the NEXUS block. This option can be used to manually set up the NEXUS trace
registers. The NEXUS memory access is not affected by this command. To re-enable NEXUS register
control, use command TrOnchip.ENable. Per default, NEXUS register control is enabled.
©1989-2015 Lauterbach GmbH
MPC56x NEXUS Debugger and Trace
59
CPU specific TrOnchip Commands
TrOnchip.ENable
Format:
Enable NEXUS trace register control
TrOnchip.ENable
Enables NEXUS register control by the debugger. By default, NEXUS register control is enabled. This
command is only needed after disabling NEXUS register control using TrOnchip.DISable.
TrOnchip.EVTI
Format:
Allow the EVTI signal to stop the program execution
TrOnchip.EVTI [ON | OFF]
ON
Allow the EVTI signal to stop the program execution (faster).
OFF
The program execution is stopped by sending a break sequence via NEXUS.
Example: Stop the program execution on the falling edge of the external signal on the TRIGGER connector
of POWERTRACE / ETHERNET.
TrOnchip.EVTI ON
; Enable fast stop via an external
; signal
; Configure the internal trigger bus
TrBus.RESet
; Reset trigger bus settings
TrBus.Connect In
; Configure TRIGGER as input
TrBus.Mode Falling
; The trigger is active on the falling edge
; of the connected signal
TrBus.Set Break ON
; Define Break a trigger event
TrBus.Out Break OFF
©1989-2015 Lauterbach GmbH
MPC56x NEXUS Debugger and Trace
60
CPU specific TrOnchip Commands
TrOnchip.G/H
Format:
Define data selector
TrOnchip.G.Value <hexmask> | <float>
TrOnchip.H.Value <hexmask> | <float>
TrOnchip.G.Size [Byte | Word | Long]
TrOnchip.H.Size [Byte | Word | Long]
TrOnchip.G.Match [OFF | EQ | NE | GT | LT | GE | LE]
TrOnchip.H.Match [OFF | EQ | NE | GT | LT | GE | LE]
Defines the two data selectors of the MPC500/800 family.
OFF
Off
EQ
Equal
NE
Not equal
LE
Lower equal
GE
Greater equal
LT
Lower then
GT
Greater then
ULE
Unsigned lower equal
UGE
Unsigned greater equal
ULT
Unsigned lower then
UGT
Unsigned greater then
Example: Stop the program execution if a value between 0x50 and 0x70 is written to the variable vint.
Var.Break.Set vint /Alpha
; Set a breakpoint of the type Alpha to vint
; Program the first L-Bus watchpoint
TrOnchip.RESet
; Reset on-chip trigger unit
TrOnchip.LW0 LBUS Alpha
; The addresses marked with Alpha
; breakpoints define the L-Bus address
TrOnchip.LW0.CYcle Write
; The L-Bus cycle is write
TrOnchip.LW0.Data GANDH
; The L-Bus data is a logical AND of data
; selector G and H
©1989-2015 Lauterbach GmbH
MPC56x NEXUS Debugger and Trace
61
CPU specific TrOnchip Commands
; Program the data selector G
TrOnchip.G.Value 0x50
; The value for G is 0x50
TrOnchip.G.Size Long
; The access size is Long
TrOnchip.G.Match GT
; The match is GreaterThan
; Program the data selector H
TrOnchip.H.Value 0x70
; The value for H is 0x70
TrOnchip.H.Size Long
; The access size is Long
TrOnchip.H.Match LT
; The match is LowerThan
TrOnchip.IWx.Count
Format:
Event counter for I-Bus watchpoint
TrOnchip.IW0.Count <count>
TrOnchip.IW1.Count <count>
The occurrence of the specified I-Bus event can be counted.
Example: Stop the program execution after 100. entries to INT5.
Break.Set INT5 /Alpha
; Set an Alpha breakpoint to the entry of
; INT5
TrOnchip.RESet
; Reset on-chip trigger unit
TrOnchip.IW0.Ibus Alpha
; The addresses marked with Alpha
; breakpoints define the I-Bus address
TrOnchip.IW0.Count 100.
; The I-Bus counter is set to 100.
Go
©1989-2015 Lauterbach GmbH
MPC56x NEXUS Debugger and Trace
62
CPU specific TrOnchip Commands
TrOnchip.IWx.Ibus
Instructions address for I-Bus watchpoint
Format:
TrOnchip.IW0.Ibus <selector>
TrOnchip.IW1.Ibus <selector>
<selector>:
OFF
Alpha
Beta
Charly
Delta
Echo
Define the instruction for the I-Bus watchpoint.
TrOnchip.IWx.Watch
Activate I-Bus watchpoint pin
Format:
TrOnchip.IW0.Watch [OFF | ON]
TrOnchip.IW1.Watch [OFF | ON]
ON
A pulse is generated on IWP0/IWP1/IWP2/IWP3 if the I-Bus watchpoint is hit. The
processor pins IWP0/IWP1/IWP2/IWP3 serve multiple functions. Please check
your target hardware to find out which pin can be used for the trigger pulse. The
smallest pulse length is one clock cycle.
OFF
The program execution is stop on a hit of the L-Bus watchpoint.
Example: Generate a pulse on IW0 when the function func5 is entered. Generated a pulse on IW1 on the
exit of func5.
Break.Set func5 /Alpha
; Set an Alpha breakpoint to the entry
; of func5
Break.Set v.end(func5)-3 /Beta
; Set a Beta breakpoint to the exit of
; func5
TrOnchip.RESet
; Reset the on-chip trigger unit
TrOnchip.IWO.Ibus Alpha
; The addresses marked with Alpha
; breakpoints define the Ibus address
©1989-2015 Lauterbach GmbH
MPC56x NEXUS Debugger and Trace
63
CPU specific TrOnchip Commands
TrOnchip.IWO.Watch ON
; Generate a pulse on IWP0 when IW0 is
; hit
TrOnchip.IW1.Ibus Beta
; The addresses marked with Beta
; breakpoints define the Ibus address
TrOnchip.IW1.Watch ON
; Generate a pulse on IWP1 when IW1 is
; hit
TrOnchip.LW0.Count
Format:
Event counter for L-Bus watchpoint
TrOnchip.LW0.Count <count>
TrOnchip.LW1.Count <count>
The occurrence of the specified L-Bus event can be counted.
Example: Stop the program execution after 100. write accesses to flags[3].
Var.Break.Set flags[3] /Alpha
; Set an Alpha breakpoint to flags[3]
TrOnchip.RESet
; Reset on-chip trigger unit
TrOnchip.LW0.Lbus Alpha
; The addresses marked with Alpha
; breakpoints define the L-Bus address
TrOnchip.LW0.CYcle Write
; The L-Bus cycle is write
TrOnchip.LW0 Count 100.
; The L-Bus counter is set to 100.
Go
TrOnchip.LW0.CYcle
Cycle type for L-Bus watchpoint
Format:
TrOnchip.LW0.CYcle <cycle>
TrOnchip.LW1.CYcle <cycle>
<cycle>:
Read
Write
Access
Define the cycle type for the L-Bus watchpoint.
©1989-2015 Lauterbach GmbH
MPC56x NEXUS Debugger and Trace
64
CPU specific TrOnchip Commands
TrOnchip.LW0.Data
Data selector for L-Bus watchpoint
Format:
TrOnchip.LW0.Data <selector>
TrOnchip.LW1.Data <selector>
<selector>:
OFF
G
H
GANDH
GORH
Define the data selector for the L-Bus watchpoint.
TrOnchip.LW0.Ibus
Instructions address for L-Bus watchpoint
Format:
TrOnchip.LW0.Ibus <selector>
TrOnchip.LW1.Ibus <selector>
<selector>:
OFF
Alpha
Beta
Charly
Delta
Echo
Define the instruction for the L-Bus watchpoint.
Example: Stop the program execution if func5 writes to flags[3].
Var.Break.Set func5 /Alpha
; Set an Alpha breakpoint to the
; complete range of func5
Var.Break.Set flags[3] /Beta
; Set a Beta breakpoint to flags[3]
TrOnchip.RESet
; Reset on-chip trigger unit
TrOnchip.LW0.Ibus Alpha
; The addresses marked with Alpha
; breakpoints define the instruction
; address for LW0
TrOnchip.LW0.Lbus /Beta
; The addresses marked with Beta
; breakpoints define the data address
; for LW0
TrOnchip.LW0.CYcle Write
; The data cycle is write
©1989-2015 Lauterbach GmbH
MPC56x NEXUS Debugger and Trace
65
CPU specific TrOnchip Commands
TrOnchip.LW0.Lbus
Data address for the L-Bus watchpoint
Format:
TrOnchip.LW0.Lbus <selector>
TrOnchip.LW1.Lbus <selector>
<selector>:
OFF
Alpha
Beta
Charly
Delta
Echo
Defines on which data address for the L-Bus watchpoint.
TrOnchip.LW0.Watch
Activate L-Bus watchpoint pin
Format:
TrOnchip.LW0.Watch [OFF | ON]
TrOnchip.LW1.Watch [OFF | ON]
ON
A pulse is generated on LWP0/LWP1 if the L-Bus watchpoint is hit. The
processor pins LWP0/LWP1 serve multiple functions. Please check your target
hardware to find out which pin can be used for the trigger pulse. The smallest
pulse length is one clock cycle.
OFF
The program execution is stop on a hit of the L-Bus watchpoint.
TrOnchip.RESet
Format:
Reset on-chip trigger unit
TrOnchip.RESet
Reset the on-chip trigger unit.
©1989-2015 Lauterbach GmbH
MPC56x NEXUS Debugger and Trace
66
CPU specific TrOnchip Commands
TrOnchip.Set
Stop program execution at specified exception
Format:
TrOnchip.Set <item> [OFF | ON]
<item>:
CHSTPE … SEIE
The program execution is stopped at the specified exception. For more details refer to the Debug Enable
Register in your processor manual.
For details on the exceptions refer to the description of the Debug Enable Register in your processor
manual.
If program execution is stopped by an exception, the name of the exception is shown in the command line of
TRACE32. Refer to the description of the Exception Cause Register in your processor manual for details.
TrOnchip.TEnable
Format:
Set filter for the trace
TrOnchip.TEnable <par>
Obsolete command. Refer to the Break.Set command to set trace filters.
TrOnchip.TOFF
Format:
Switch the sampling to the trace to OFF
TrOnchip.TOFF
Obsolete command. Refer to the Break.Set command to set trace filters.
©1989-2015 Lauterbach GmbH
MPC56x NEXUS Debugger and Trace
67
CPU specific TrOnchip Commands
TrOnchip.TON
Switch the sampling to the trace to ON
Format:
TrOnchip.TON EXT | Break
Obsolete command. Refer to the Break.Set command to set trace filters.
TrOnchip.TTrigger
Format:
Set a trigger for the trace
TrOnchip.TTrigger <par>
Obsolete command. Refer to the Break.Set command to set a trigger for the trace.
TrOnchip.VarCONVert
Format:
Adjust HLL breakpoint in on-chip resource
TrOnchip.VarCONVert [ON | OFF]
The MPC56x family provides the follwing on-chip breakpoints:
MPC5xx
4 Instruction,
2 Read/Write
4
4 single I-bus
breakpoints or 2 I-bus
breakpoint ranges
2
2 single L-bus
breakpoints or 1 L-bus
breakpoint ranges
2
ON (default)
If all resources for the on-chip breakpoints are already used and if the user
wants to set an addtional on-chip breakpoint, TRACE32 converts an on-chip
breakpoint set to a scalar variable to a single address breakpoint to free
additional resources.
OFF
If all resources for the on-chip breakpoints are already used and if the user
wants to set an addtional on-chip breakpoint, an error message is displayed.
©1989-2015 Lauterbach GmbH
MPC56x NEXUS Debugger and Trace
68
CPU specific TrOnchip Commands
TrOnchip.view
Format:
Display “TrOnchip” window
TrOnchip.view
Display the TrOnchip window.
Only available if Preprocessor for MPC500/800 is used
©1989-2015 Lauterbach GmbH
MPC56x NEXUS Debugger and Trace
69
CPU specific TrOnchip Commands
Technical Data
Mechanical Dimension
Dimension
LA-7791
NEXUS-MPC565-MICTOR
CABLE
TOP VIEW
mounting hole
2X dia. 100
CONVERTER TO
PIN 1
425
538
2475
1525
1325
150
GLENAIR51
AMP50
AMP40
1
1
675
277
825
275
300
2475
SIDE VIEW
175
1675
1550
1550
675
1225
1
75
825
275
825
275
388
525
ALL DIMENSIONS IN 1/1000 INCH
Adapter
Not necessary.
Operation Voltage
Adapter
OrderNo
Voltage Range
Nexus Adapter for MPC56x family/Mictor38
LA-7791
2.3 .. 3.0 V
©1989-2015 Lauterbach GmbH
MPC56x NEXUS Debugger and Trace
70
Technical Data
Operation Frequency
tbd
©1989-2015 Lauterbach GmbH
MPC56x NEXUS Debugger and Trace
71
Technical Data
Support
TMPM332FW
TMPM333FW
YES YES YES
YES YES YES
INSTRUCTION
SIMULATOR
POWER
INTEGRATOR
ICD
TRACE
ICD
MONITOR
ICD
DEBUG
FIRE
ICE
CPU
Available Tools
YES
YES
©1989-2015 Lauterbach GmbH
MPC56x NEXUS Debugger and Trace
72
Support
Compilers
Language
Compiler
Company
Option
ADA
GNAT
ELF/DWARF
C
C
CXPPC
CC
C
XCC-V
C
C
GREEN-HILLS-C
GCC
C
MCCPPC
C
C
C
C
C
C
C++
ULTRA-C
HIGH-C
DCPPC
D-CC
D-CC
D-CC
GCC
C++
C++
GREEN-HILLSC++
CCCPPC
Free Software
Foundation, Inc.
Cosmic Software
Freescale
Semiconductor, Inc.
GAIO Technology Co.,
Ltd.
Greenhills Software Inc.
HighTec EDV-Systeme
GmbH
Mentor Graphics
Corporation
Radisys Inc.
Synopsys, Inc
TASKING
Wind River Systems
Wind River Systems
Wind River Systems
Free Software
Foundation, Inc.
Greenhills Software Inc.
C++
C++
C++
C++
C/C++
MSVC
HIGH-C++
D-C++
GCCPPC
CODEWARRIOR
GCC
GCC
JAVA
FASTJ
Mentor Graphics
Corporation
Microsoft Corporation
Synopsys, Inc
Wind River Systems
Wind River Systems
Freescale
Semiconductor, Inc.
Free Software
Foundation, Inc.
Wind River Systems
Comment
ELF/DWARF
XCOFF
SAUF
ELF/DWARF
ELF/DWARF
ELF/DWARF
ROF
ELF/DWARF
ELF/DWARF
IEEE
COFF
ELF/DWARF
ELF/DWARF
ELF/DWARF
ELF/DWARF
EXE/CV5
ELF/DWARF
ELF/DWARF
ELF/STABS
ELF/DWARF
WindowsCE
ELF/DWARF
ELF/DWARF
©1989-2015 Lauterbach GmbH
MPC56x NEXUS Debugger and Trace
73
Support
Realtime Operation System
Name
Company
Comment
AMX
ChorusOS
CMX-RTX
DEOS
ECOS
Elektrobit tresos
ERCOSEK
Erika
FreeRTOS
Linux
Linux
LynxOS
MQX
MQX
NetBSD
NORTi
Nucleus PLUS
OS-9
OSE Delta
OSEK
OSEKturbo
PikeOS
ProOSEK
pSOS+
QNX
RTEMS
RTXC 3.2
RTXC Quadros
Sciopta
SMX
ThreadX
uC/OS-II
uITRON
VRTXsa
VxWorks
KadakProducts Ltd.
Oracle Corporation
CMX Systems Inc.
DDC-I, Inc.
eCosCentric Limited
Elektrobit Automotive GmbH
ETAS GmbH
Evidence
Freeware I
MontaVista Software, LLC
LynuxWorks Inc.
Freescale Semiconductor, Inc.
Synopsys, Inc
MISPO Co. Ltd.
Mentor Graphics Corporation
Radisys Inc.
Enea OSE Systems
Freescale Semiconductor, Inc.
Sysgo AG
Elektrobit Automotive GmbH
Wind River Systems
QNX Software Systems
RTEMS
Quadros Systems Inc.
Quadros Systems Inc.
Sciopta
Micro Digital Inc.
Express Logic Inc.
Micrium Inc.
Mentor Graphics Corporation
Wind River Systems
implemented by DDC-I
1.3, 2.0 and 3.0
via ORTI
via ORTI
via ORTI
v7
Kernel Version 2.4 and 2.6, 3.x, 4.x
3.0, 3.1, 4.0, 5.0
3.1.0, 3.1.0a, 4.0
3.x and 4.x
2.40 and 2.50
4.x and 5.x
via ORTI
via ORTI/former MetrowerksOSEK
via ORTI
2.1 to 2.5, 3.0, with TRACE32
6.0 to 6.5.0
4.10
3.4 to 4.0
3.0, 4.0, 5.0
2.0 to 2.92
HI7000, RX4000, NORTi,PrKernel
5.x to 7.x
©1989-2015 Lauterbach GmbH
MPC56x NEXUS Debugger and Trace
74
Support
3rd Party Tool Integrations
CPU
Tool
Company
ALL
ALL
ALL
ADENEO
X-TOOLS / X32
CODEWRIGHT
ALL
CODE CONFIDENCE
TOOLS
CODE CONFIDENCE
TOOLS
EASYCODE
ECLIPSE
RHAPSODY IN MICROC
RHAPSODY IN C++
CHRONVIEW
LDRA TOOL SUITE
UML DEBUGGER
Adeneo Embedded
blue river software GmbH
Borland Software
Corporation
Code Confidence Ltd
ALL
ALL
ALL
ALL
ALL
ALL
ALL
ALL
ALL
ALL
ALL
ALL
ALL
ALL
ALL
ALL
ALL
ALL
ALL
ALL
ALL
POWERPC
POWERPC
POWERPC
ATTOL TOOLS
VISUAL BASIC
INTERFACE
LABVIEW
CODE::BLOCKS
C++TEST
RAPITIME
DA-C
TRACEANALYZER
SIMULINK
TA INSPECTOR
UNDODB
VECTORCAST
WINDOWS CE PLATF.
BUILDER
GR228X ICTESTSYSTEME
OSE ILLUMINATOR
DIAB RTA SUITE
Host
Windows
Windows
Windows
Code Confidence Ltd
Linux
EASYCODE GmbH
Eclipse Foundation, Inc
IBM Corp.
IBM Corp.
Inchron GmbH
LDRA Technology, Inc.
LieberLieber Software
GmbH
MicroMax Inc.
Microsoft Corporation
Windows
Windows
Windows
Windows
Windows
Windows
Windows
Windows
Windows
NATIONAL
INSTRUMENTS
Corporation
Open Source
Parasoft
Rapita Systems Ltd.
RistanCASE
Symtavision GmbH
The MathWorks Inc.
Timing Architects GmbH
Undo Software
Vector Software
Windows
Windows
Windows
Windows
Windows
Windows
Windows
Windows
Linux
Windows
Windows
Battefeld GmbH
Windows
Enea OSE Systems
Wind River Systems
Windows
Windows
©1989-2015 Lauterbach GmbH
MPC56x NEXUS Debugger and Trace
75
Support
Products
Product Information
OrderNo Code
Text
LA-7791
Nexus Adapter for MPC56x family/Mictor38
NEXUS-MPC565-MICTOR
Adapter for NEXUS on Spanish Oak (MPC565),
Silver Oak (MPC561) and Green Oak (MPC563)
with 38 pin mictor connector
includes software for Windows, Linux and MacOSX
only with PowerTrace Ethernet 256MB/512MB
or PowerTrace PX
AMP40NS NEXUS connector requires LA-7793
AMP50 NEXUS connector requires LA-7794
GLENAIR51 NEXUS connector requires LA-7797
LA-7793
Converter Mictor38 to NEXUS/AMP40 for MPC56x
CONV-MICTOR38-AMP40
Converter from the 38 pin mictor connector on
Nexus Adapter for MPC56x family/Mictor38 (LA-7791)
to NEXUS/AMP40NS
LA-7794
Converter Mictor38 to NEXUS/AMP50 for MPC56x
CONV-MICTOR38-AMP50
Converter from the 38 pin mictor connector on
Nexus Adapter for MPC56x family/Mictor38 (LA-7791)
to NEXUS/AMP50
LA-7797
Conv. Mictor38 to NEXUS/GLENAIR51 for MPC56x
CONV-MIC38-GL51-56X
Converter from the 38 pin mictor connector on
Nexus Adapter for MPC56x family/Mictor38 (LA-7791)
to NEXUS 51 pin Glenair connector
LA-7785
Conv. Large NEXUS Model to Small Model AMP50
NEXUS-CONV-SMALL-50
Converter from large NEXUS model AMP50
to small NEXUS model AMP50
to adapt to NEXUS on Spanish Oak (MPC565),
Silver Oak (MPC561) and Green Oak (MPC563)
Order Information
Order No.
Code
Text
LA-7791
LA-7793
LA-7794
LA-7797
LA-7785
NEXUS-MPC565-MICTOR
CONV-MICTOR38-AMP40
CONV-MICTOR38-AMP50
CONV-MIC38-GL51-56X
NEXUS-CONV-SMALL-50
Nexus Adapter for MPC56x family/Mictor38
Converter Mictor38 to NEXUS/AMP40 for MPC56x
Converter Mictor38 to NEXUS/AMP50 for MPC56x
Conv. Mictor38 to NEXUS/GLENAIR51 for MPC56x
Conv. Large NEXUS Model to Small Model AMP50
Additional Options
LA-1370
MICTOR-FLEXEXT
Mictor Flex Extension
©1989-2015 Lauterbach GmbH
MPC56x NEXUS Debugger and Trace
76
Products
©1989-2015 Lauterbach GmbH
MPC56x NEXUS Debugger and Trace
77
Products