1
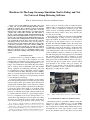
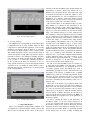
Hardware-In-The-Loop On-ramp Simulation Tool to Debug and Test
the Universal Ramp Metering Software
Rene O. Sanchez, Roberto Horowitz and Pravin Varaiya
Abstract— An on-ramp simulation system that can be used
to debug and test the Universal Ramp Metering Software
(URMS) is presented. The tool includes a simple car following
microscopic traffic model for the on-ramp and a Controller
Interface Device (CID), which interfaces a standard personal
computer with a 2070 traffic controller. The CID consists of
the low cost and commonly available National Instruments (NI)
USB-6501 24-Channel Digital I/O device and a basic circuit that
interfaces the 5-Volt TTL logic from the Digital I/O board to the
2070 controller. The resulting hardware-in-the-loop simulation
tool systematically reads the phase states from the controller
and changes detector states based on the cars trajectories as
displayed on the on-ramp simulator. With this tool it is possible
to check the performance of the 2070 controller running the
URMS as if the traffic controller was operating on a standard
on-ramp managed by Caltrans. Finally, the real-time nature of
this tool is discussed based on a quantitative analysis of the
simulator performance running on the Windows XP operating
system.
I. INTRODUCTION
A hardware-in-the-loop simulation (HILS) system was
developed as a tool to assist in the completion of a ramp
metering field test. This field test has been proposed in order
to implement queue control on the Hegenberger Rd. loop onramp to 880 southbound in the Caltrans Bay Area District
(D4) to study its effect in minimizing queue and mainline
density oscillations and enhancing performance. This will
be accomplished by using a 2070 traffic controller running
a modified Universal Ramp Metering Software (URMS),
which is a recently developed program that allows the 2070
traffic controller to function as a ramp metering controller
for use throughout California[1].
To prevent on-ramp queues from spilling over into surface
streets and interfering with the street traffic, the queue length
must be regulated. If the queue length could be measured, an
asymptotically stable PI regulator can be designed to stabilize
the closed loop queue dynamics [2]. However, the PI regulator needs the current queue length as its feedback signal,
which unfortunately is not available in the field. For the
field test, two different queue-length estimation methods will
be evaluated. The first method is a queue-length estimator
based on a simplified model for the driving behavior of a
vehicle that is approaching the end of the queue: the vehicle
decelerates at a constant rate from its cruising speed, until it
stops. By measuring speed upstream of the on-ramp, using
R. O. Sanchez is with the Department of Mechanical Engineering,
University of California, Berkeley. [email protected]
R. Horowitz is a Professor at Department of Mechanical Engineering,
University of California, Berkeley. [email protected]
P. Varaiya is a Professor at Department of Electrical Engineering, University of California, Berkeley. [email protected]
dual loop detectors, it will be possible to estimate the queuelength[2]. The second method estimates the queue-length
using a vehicle re-identification algorithm [3], [4]. This
scheme is based on matching individual vehicle signatures
obtained from Sensys wireless sensor arrays placed at the
two ends of the on-ramp.
Before deploying a 2070 controller with a modified URMS
in the Hegenberger on-ramp, it must be thoroughly debugged. In addition, the modified software must be tested
and approved by D4 engineers before it can be used on
the field. The unmodified URMS software has already been
debugged and tested by Caltrans engineers before its release
for preliminary testing in the field using a traditional traffic
controller suitcase tester device (see Figure 1). However, one
of the main drawbacks of this tester is the need to manually
operate mechanical switches to simulate loop detector signals. This debugging and testing approach becomes difficult
and sometimes inappropriate when coordination of signal
actuation is required, as will be the case for the field test. To
debug and test the modified URMS, it will be necessary to
recreate the dual detector signals used to measure vehicle
speed upstream of the on-ramp, with good accuracy. For
this reason, it was decided to design and build a hardwarein-the-loop simulation system to replicate in real-time the
Hegenberger on-ramp detector signals.
Fig. 1.
Traffic controller suitcase tester used to evaluate the URMS
II. HARDWARE-IN-THE-LOOP SIMULATION
The hardware-in-the-loop simulation (HILS) concept has
been used to create a simulation tool to test the URMS
running on a 2070 controller. A particular feature of this
type of architecture is that the traffic simulation model does
not implement any control logic, instead it controls traffic
flow in the simulation based on the phase states produced
by the traffic signal control equipment. Simultaneously, the
traffic signal control equipment uses the detector signals
generated by the simulation to update its control logic (see
Figure 2(a)) [5]. HILS has been used in the past to interface
with traffic signal control equipment for testing purposes;
however, previous systems focused on testing intersection
control software. The simulation time step used in these
systems is on the order of seconds, and equipment is used
primarily to simulate loop detector signals used by traffic
controllers to determine car presence and a rough estimate
of occupancy [6], [7]. The tool presented in this paper is
primarily designed to generate, through simulation, traffic
detector signals for an on-ramp/freeway system (see Figure
3(b)) with sufficient resolution to allow the 2070 controller
to accurately calculate volume, occupancy, and speed.
The HILS system presented in this paper has three basic
components: 1) a controller interface device (CID), 2) a
software interface module, and 3) a microscopic simulation
engine. A description of each component is presented below.
a)
Computer
2070 Controller
Controller Interface Device (CID)
The custom made circuit was designed to interface the 5Volt TTL logic from the digital I/O board to the 2070 controller. This circuit was built using a modular IC breadboard
socket, SN706 TTL hex inverter buffers/drivers with opencollector high-voltage outputs, one 7805A voltage regulator,
and a 12-Volt power supply.
Two main goals of the CID design stage were portability
and low cost. The portability was ensured with the use of a
small USB DIO board that can be used in most personal
computers. The low cost was achieved by using one of
the cheapest data acquisition boards on the market. The
components to build the CID presented in this paper cost
less than 200 U.S. dollars.
B. Software Interface Module
The software interface model provides the linkage between
the CID and the traffic simulation program. The NI USB6501 board used to build the CID comes with drivers that
can be used to develop customized applications using NI
LabVIEW. These drivers serve as the software interface
module, and do not require any modification when used in
the HILS tool.
Detector
States
Detector
States
C. Microscopic Simulation Engine
Phase
States
Phase
States
b)
2070 Controller
running the URMS
CID
Computer running Simulation Tool
Fig. 2. (a) On-ramp simulation tool architecture (b) On-ramp simulation
tool setup
The simulation engine was developed using the NI LabVIEW development environment. Before deciding to create a
custom traffic microscopic simulator, commercial simulator
packages were considered. However, the time steps used in
these simulators were not low enough for the resolution desired for this application, e.g. CORSIM uses a 1 second time
step while VISSIM can not go lower than 100 milliseconds.
This limitation was one reason for developing a microscopic
simulation specifically for an on-ramp/freeway system with a
time step between 1 and 10 milliseconds. Another reason was
to have the flexibility to customize the simulation engine to
complement some features of the URMS, e.g. configuration
and testing menus.
A. Computer Interface Device (CID)
This device provides the interface from the 2070 traffic
controller to the personal computer running the traffic simulation. The CID has two main elements: 1) the NI USB-6501
device and 2) a custom electronic circuit.
The NI USB-6501 is a portable digital Input/Output device, which provides data acquisition and control capabilities.
With plug-and-play USB connectivity, the NI USB-6501 is
very versatile and can be used in most personal computers.
The NI USB-6501 has 24 single-ended digital lines, which
comprise three DIO ports. In this tool, two ports are configured to generate detector signals and one port is used to
read the phase states output from the controller. This device
was chosen because of its low price, portability, and because
when used with LabVIEW, it provides a straightforward
procedure to interface with the simulation engine. Signals
can be sent and received using LabVIEW standard functions
that can easily be accessed from the simulation.
a)
b)
Traffic Light State
(available from 2070 Controller)
LO
TO
Q
On-ramp Demand
(data available from D4)
P D
Legend:
T1
L1
T2
L2
T3
L3
T4
L4
Detection Station
(data available from PeMS)
L = Leading Detector
T = Trailing Detector
P = Passage Detector
D = Demand Detector
LO = On-ramp Leading Detector
TO = On-ramp Trailing Detector
Q = Queue Detector
Fig. 3.
(a) Hegenberger Rd. loop on-ramp to 880 southbound (b)
Hegenberger on-ramp/mainline layout used for the simulation tool
III. THE MODEL
In order to simulate the Hegenberger on-ramp/freeway
system (see Figure 3(a)), it was necessary to use a simplified
layout that would capture the detector location and the ramp
characteristics. Figure 3(b) shows a simplified configuration
of the Hegenberger onramp/freeway system that follows the
NTCIP typical on-ramp layout as close as possible [8], which
is also the standard configuration used in the URMS. The
ramp layout had to be slightly modified to incorporate dual
detection for queue-length estimation.
A traffic controller operating on an on-ramp in California
is usually programmed to collect data from the on-ramp detectors, set the traffic light phase states, and collect mainline
detection stations data (sometimes multiple mainline detection stations). In order for the simulation tool to generate
the signals that a traffic controller would encounter in the
field, it was decided to simulate traffic conditions on the
Hegenberger on-ramp/mainline system with two completely
different models: 1) a constant velocity microscopic mainline
traffic model and 2) a simplified car following on-ramp traffic
model. The 2070 controller is able to read the detector states
set by both models and can update the on-ramp simulation
metering rate (phase states). With this approach, on-ramp
traffic conditions do not have any effect on the mainline
freeway simulation. However, simulated mainline traffic
conditions may have an effect on the on-ramp simulation
depending on the ramp metering algorithms implemented in
the URMS. The simulation tool was designed in this way in
order to test traffic responsive ramp metering algorithms like
ALINEA [9], where mainline traffic conditions read by the
controller are used to set the metering rate at the on-ramp.
It should be noted that this tool only allows testing the open
loop behavior of ramp metering algorithms, as there is no
interaction of the on-ramp and the mainline model.
Fig. 4.
(left) Freeway layout (right) On-ramp layout
A. Freeway Mainline Model
A constant velocity microscopic mainline traffic model
was used to model vehicle trajectories on the mainline. In
this model, the cars of a given freeway lane travel at the
same speed, and their position is updated every simulation
period. The car trajectories start at the beginning of the
freeway segment, and end when the car reaches the end of the
freeway segment, given by the user-specified freeway length
(see Figure 4 (left)). The cars are generated based on the flow
specified for every calculation interval. The URMS software
calculates aggregates of mainline data every 30 seconds. For
this reason, parameters for a given lane can be updated every
30 second calculation interval in the simulation. However,
the calculation interval should be set taking the data used to
feed the simulator into account. For example, if PeMS [10]
data are used, the calculation interval should be set equal to
the time granularity used in the data set.
The model for the freeway can be very simple because
the main objective of this part of the tool is to generate
loop detector signals that the controller can read to calculate
aggregate values for each calculation interval, and use these
aggregate values as the input for traffic-responsive ramp
metering controllers.
Fig. 5.
Mainline loop detectors actuation
B. On-ramp Model
A simplified car following traffic model, based on [11],
was used to simulate vehicles on the on-ramp. This is
a simple model specifically conceived for a homogeneous
highway in which the nth vehicle follows the same trajectory
as the (n-1)th vehicle except for a translation in space and
time. It was necessary to incorporate the ramp metering
traffic signal into the model, which can be considered as an
inhomogeneity, by specifying rules of how vehicles react to
the signal. The rules that were specified are: 1) a car in front
of the traffic light must stop when the light is red, and 2)
only a predetermined number of cars can advance per green
phase. It was decided to use this model because it is simple
but captures dynamics that are important for an accurate
generation of detector signals. There is a particular interest
in testing algorithms that use vehicle speed close to the onramp entrance to estimate queue-length. This model allows
for changes in speed based on driver behavior parameters
and the presence of vehicles ahead. With this model it is
also possible to introduce queue dynamics in the simulation,
a feature necessary for the accurate generation and timing of
on-ramp detector signals.
For the simulation, it is necessary to know parameters
related to the length of the on-ramp, the length of the loop
detectors, and the position of the loop detector with respect
to the ramp entrance. All these parameters can be specified
using the simulator on-ramp layout menu, as shown in Figure
4 (right). For the Hegenberger on-ramp, these parameters
were obtained from Goolge EarthT M and [12].
C. Vehicle/Loop Interaction
The loop detector signals generated by the simulation tool
are actuated based on vehicle positions. Both simulations
have the location of the loop detectors with respect to
the beginning of the freeway segment and the beginning
of the on-ramp, respectively. When any of the data points
representing a vehicle is on the detection zone specified by
the location of its leading and trailing edge, the detector
signal is triggered. The interaction between loop detectors
and cars occurs in real-time. Whenever the display in the
simulator shows an active detector, the detector signal read
by the controller for that specific detector is active as well
(see Figure 5). This is a desired feature for a debugging tool,
since it helps to visually identify what is the state of each
signal going into the controller.
In order to recreate the signals generated in a real onramp/freeway system more realistically, three types of vehicles can be generated in the simulator: 1) cars, 2) pickups,
and 3) trucks. Each vehicle has an independent length, shape,
and probability of occurrence. The particular shape of each
car can be observed in Figure 5.
used in conjunction with the URMS Input File Test utility, it
is straightforward to check if the simulation and the URMS
signal assignments match and if the detector states are read
properly by the 2070 controller.
IV. SIMULATION TOOL
The simulation software was developed using the NI LabVIEW development environment. This software is composed
of four elements: 1) the 2070 controller input configurator,
2) the 2070 controller output configurator, 3) a freeway
simulator, and 4) an on-ramp simulator. When the program
is run, the user can decide if any configurator will be used. If
the configuration process for the inputs or outputs is skipped,
the configuration stored in the computer will be used by
the program. After the configuration process is completed or
bypassed, the on-ramp and freeway simulations start. In the
following, each component of the software is described.
Fig. 7.
2070 Controller Output Configurator
B. 2070 Controller Output Configurator
The 2070 controller output configuration application was
developed to match the URMS configuration convention. The
diagram used in the configurator to show the output file
current assignments (see Figure 7) is the same as that used in
[1] to describe the physical output number for each output
file slot for a Model 334 cabinet. An output configurator
was implemented in order to map every phase indication
used in the simulation to the corresponding phase in the
2070 controller, as recommended in [5]. In this configuration
application, it is possible to independently read the phase of
each active output. When this feature is used in conjunction
with the URMS Output File Test, Output Signal Test, and/or
Lights Test utilities, it is easy to check if the simulation and
the URMS output signal assignments match and if the phase
states are read properly by the simulation.
C. Freeway Simulator
Fig. 6.
2070 Controller Input Configurator
A. 2070 Controller Input Configurator
The 2070 controller input configuration application was
developed to match the URMS configuration convention.
The diagram used in the configurator to show the Input File
current assignments (see Figure 6) is the same as that used
in [1] to describe the physical input number for each input
file slot for a Model 334 cabinet. An input configurator
was included in this tool, because it is necessary to map
every detector used in the simulation to the corresponding
detector in the 2070 controller, as recommended in [5]. In
this configuration application, it is possible to independently
change the state of each active input. When this feature is
The constant velocity microscopic mainline traffic model
described earlier is implemented in the freeway simulator
application. There are three components associated with
this part of the simulation: 1) the freeway simulation user
interface, shown in Figure 8, 2) a freeway layout menu
(see Figure 4(left)), and 3) a vehicle menu. The simulation
interface is used to observe the movement of vehicles through
the defined freeway segment. With this interface, information
related to the simulation can be accessed and it is possible to
set and modify freeway lane parameters independently. In the
freeway layout menu, the dimension of the mainline segment,
the detector location, and the detector separation can be set.
Finally, the vehicle menu is used to determine the properties
of the three types of vehicles present in the simulation.
The vehicle parameters for the mainline simulation can be
different from those used on the on-ramp simulator.
Fig. 8.
Freeway simulator interface
D. On-ramp Simulator
The simplified car following traffic model described earlier
is implemented in the on-ramp simulator. There are three
components associated with this application: 1) the on-ramp
simulation user interface, shown in Figure 9, 2) a freeway
layout menu (see Figure 4(right)), and 3) a vehicle menu.
The simulation interface is used to observe the movement of
vehicles through the on-ramp. This component also displays
information related to the simulation, including the phase
state output by the 2070 controller. Using this interface, it
is also possible to set and modify simulation parameters.
In the on-ramp layout menu, the dimension of the onramp segment, the detectors location, their length, and their
separation can be set. Finally, the vehicle menu is used to
determine the properties of the three types of vehicles present
in the on-ramp simulator.
Fig. 9.
On-ramp simulator interface
V. BENCHMARKING
This tool was designed to simulate traffic conditions on an
on-ramp/freeway system and update vehicle positions and
detector states in real-time. In the context of this project,
real-time means that the HILS system should simulate the
displacement of vehicles, check if the vehicles are on a
detection zone, and update detector states with a time equal
or less than the actual time it would take vehicles to travel
the same displacement on a real on-ramp/freeway system.
Furthermore, it is desired to achieve the smallest possible
simulation time step (∆t) in order to increase the resolution
of the detector signals sent to the 2070 controller.
The real-time nature of the hardware-in-the-loop simulation (HILS) tool is limited by the performance of the
Windows XP operating system, which only permits a 1
ms time resolution. Even though an actual HILS simulation
step (∆tactual ) may take less than 1 ms, this time is usually
larger, since Windows XP does not have sufficient realtime capability to effectively implement such precise timing
[5]. To compensate for this limitation, the simulation was
designed so that the timing of the simulator would be based
on three time stamps: 1) a reference time stamp obtained
at the beginning of the simulation run (to ), 2) a time stamp
recorded in the (i-1)th simulation step (ti−1 ), and 3) a time
stamp obtained in the current (ith) simulation step (ti ). To
update any quantity that needs the total simulation time, the
difference between ti and to is used. For quantities that need
the time increment between the (i-1)th and the ith simulation
steps, e.g. to calculate position increments, the difference
between ti and ti−1 is used. This configuration helps maintain
accurate simulation timing even when variations in the
actual simulation step execution time (∆tactual ) occur. Offsets
introduce by having ∆tactual 6= ∆t at the ith simulation step
can be removed at the (i+1)th simulation step.
In order to show that the HILS system is a reliable tool
to debug and test the URMS, it was important to quantify
the uncertainty introduced by not developing this tool on
a real time operating system environment. As a result, a
benchmarking procedure was used to characterize the realtime nature of the software. 8 simulation runs, of 60,000
simulation steps each, were executed using different desired
time steps (∆t). The actual time step (∆tactual ) was recorded
for each simulation step and stored into a file. These data
were used to determine the time reliability of this tool as a
function of ∆t.
The results of the analysis are presented in Table I and
show that ∆tactual for at least 97.5% of the steps is within one
millisecond of ∆t. The worst performance is observed when
∆t = 1 ms. As ∆t increases, the percentage of ∆tactual that are
within one ms of ∆t increases, while the standard deviation
decreases. Based on Table I and Figure 10, choosing ∆t =
2 ms provides the time resolution needed for the HILS tool
while introducing an acceptable error on the generation of
the detector signals.
In order to quantify the effect of time uncertainty on
the detector signals, a worst case scenario analysis for ∆t
= 2 ms was performed. The shortest signals generated by
the simulator, which are also the most affected by the time
uncertainty, are those of the smaller cars traveling over a loop
detector at the speed limit. There is a speed limit specified
for the freeway and one for the on-ramp. Assuming that
CID and a 2070 controller running the URMS. The system
was developed to assist in the debugging and testing process
involved with the release of a URMS version for deployment
in the field. Since this tool was specifically tailored for a
2070 controller running the URMS, it allows for an easy
configuration of the system and a user-friendly interface
that matches or complements some of the URMS debugging
features. The paper also presented an analysis of the realtime nature of the simulator that shows that for all practical
purposes, Windows XP limited real-time capabilities do not
affect the performance of the HILS tool. Future research
involves adding more versatility to the tool and enabling
communication with the controller in order to increase synchronization.
Fig. 10.
Histograms of ∆tactual for multiple simulation runs (60,000
iterations each) using different ∆t
∆tactual = ∆tmax , the propagation of the maximum error, of 16
ms, is shown in Table II. Based on the data collected from
the benchmarking procedure, the uncertainty propagated to
detector signals generated by the simulators is within ± 16
ms, which when used by the 2070 controller to calculate
velocity would yield a ± 6.4 mph uncertainty for the freeway
simulator and a ± 1.5 mph uncertainty for the on-ramp
simulator. The ± 6.4 mph uncertainty in the mainline speed
computations may seem significant. However, it will not
considerably affect the aggregate mainline speed since it is
calculated as an average over a URMS calculation interval.
For any practical purposes, the ± 1.5 mph uncertainty will
not affect the velocity estimation on the on-ramp.
1
2
3
4
5
10
25
50
∆t
∆taverage
σ
∆tmax
∆tactual = ∆t±1
ms
ms
ms
ms
ms
ms
ms
ms
2.00
2.09
3.26
4.19
5.20
10.25
25.34
50.93
0.506
0.465
0.553
0.426
0.492
0.476
0.478
0.271
17
17
17
17
18
23
30
56
97.63%
98.99%
99.20%
99.60%
99.69%
99.76%
99.96%
99.91%
TABLE I
B ENCHMARKING RESULTS OF 60,000 SIMULATION STEP RUNS FOR
DIFFERENT ∆t.
On-ramp
Freeway
Vmax
tactuation
tcontroller
Vcontroller
40 mph
80 mph
408.32 ms
204.16 ms
408.32 ± 16 ms
204.16 ± 16 ms
40 ± 1.5 mph
80 ± 6.4 mph
TABLE II
S IMULATED LOOP DETECTOR SIGNAL UNCERTAINTY FOR ∆t = 2 ms,
Ldetector =1.8 m and Lcar = 5.5 m .
VI. CONCLUSION
This paper presented a hardware-in-the-loop on-ramp evaluation system for the URMS, which consists of a personal
computer running an on-ramp microscopic traffic model, a
Symbol
Name
Unit
∆t
∆taverage
∆tactual
∆tmax
σ
Vmax
Ldetector
Lcar
tactuation
tcontroller
Vcontroller
desired simulation time step
average simulation execution time
actual simulation execution time
maximum recorded time step
standard deviation
maximum velocity used in simulation
loop detector length
average regular car length
theoretical detector actuation time based on Vmax
detector actuation time recorded by 2070 controller
velocity calculated by 2070 controller
ms
ms
ms
ms
ms
mph
m
m
ms
ms
mph
TABLE III
L IST OF S YMBOLS
R EFERENCES
[1] D. Wells and E. Torizno, “URMS: Universal Ramp Metering Software
User Manual,” tech. rep., Traffic Operations, Caltrans. Version 1.07,
2008.
[2] X. Sun, Modeling, Estimation, and Control of Freeway Traffic. PhD
thesis, University of California, Berkeley, 2005.
[3] K. Kwong, R. Kavaler, R. Rajagopal, and P. Varaiya, “A practical scheme for arterial travel time estimation based on vehicle reidentification using wireless sensors,” in Transportation Research
Board 89th Annual Meeting, 2009.
[4] K. Kwong, R. Kavaler, R. Rajagopal, and P. Varaiya, “Arterial travel
time estimation based on vehicle re-identification using wireless sensors,” Submited for publication to TRC.
[5] D. Bullock, B. Johnson, R. B. Wells, M. Kyte, and Z. Li, “Hardwarein-the-loop simulation,” Transportation Research Part C: Emerging
Technologies, vol. 12, no. 1, pp. 73 – 89, 2004.
[6] Z. Li, B. Johnson, A. Abdel-Rahim, and M. Kyte, “Hardware and
software design of an automated testing tool for traffic controllers,” in
Intelligent Transportation Systems Conference, 2006. ITSC ’06. IEEE,
pp. 1525–1530, Sept. 2006.
[7] E. Kwon, S. Kim, and T. M. Kwon, “Pseudo real-time evaluation of
adaptive traffic control strategies using hardware-in-loop simulation,”
in Industrial Electronics Society, 2001. IECON ’01. The 27th Annual
Conference of the IEEE, vol. 3, pp. 1910–1914 vol.3, 2001.
[8] “NTCIP 1207:2001, v01.17. National Transportation Communications
for ITS Protocol. Object Definition for Ramp Meter Control (RMC)
units,” tech. rep., ASSHTO/ITE/NEMA, 2001.
[9] H. Hadj-Salem, J.-M. Blosseville, and M. Papageorgiou, “Alinea: a
local feedback control law for on-ramp metering; a real-life study,”
pp. 194–198, May 1990.
[10] PeMS, “PeMS website,” url:http://pems.eecs.berkeley.edu, accessed
2/3/2009, 2009.
[11] G. F. Newell, “A simplified car-following theory: a lower order model,”
Transportation Research Part B: Methodological, vol. 36, no. 3,
pp. 195 – 205, 2002.
[12] T. O. Program, “Ramp Meter Design Manual,” tech. rep., California
Department of Transportation, 2000.


![Registry Manual []](http://vs1.manualzilla.com/store/data/005750489_1-c8586633e9f35db1a00a4874731a3151-150x150.png)