1
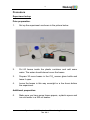
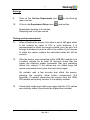
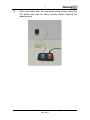
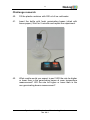
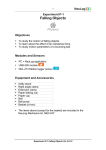
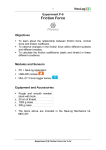
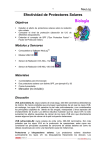
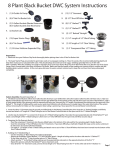
1 Experiment B-11 Respiration of Germinating Seeds Objectives To learn about cellular respiration, dormancy and germination. To compare respiration rates of germinating and non-germinating beans. To investigate the effect of ice cold water on the respiration of the germinating beans. Modules and Sensors PC + NeuLogTM software USB-200 module NUL-220 CO2 logger sensor BAT-200 Battery module (optional) Equipment and Accessories Glass bottle for the CO2 sensor (included with the sensor) Plastic container 250 ml beaker The Plastic container and beaker are included in the NeuLog Utility accessories, UTL-KIT. Experiment B-11 Respiration of Germinating Seeds Ver 3.2.1 2 Materials Tissue paper Disposable spoon 90 beans 200 ml of ice cold water Introduction In cellular respiration, chemical energy stored in carbohydrates turns into energy that can be used by the cell in the form of ATP (adenosine triphosphate). Cellular respiration (with or without the presence of oxygen) occurs in all living cells including plants. This is the chemical reaction for cellular respiration (with glucose): C6H12O6 + 6O2 6CO2 + 6H2O + energy (ATPs + heat) Many plants generate seeds to produce their offspring. After a seed drops from a plant it usually goes into a resting period called dormancy, which can sometimes take a few years. In this period the seed respires very slowly and does not germinate. This is the reason why nuts have so many calories in them; they use them to survive during dormancy. There are different cues needed to break dormancy in different species: deterioration of the seed coat, elevated soil nutrients, soil temperature, rain, light, etc. After emerging from dormancy, the seed is able to germinate. Germination requires high energy to occur; therefore cellular respiration increases as a seed emerges from dormancy. In this activity we will measure the respiration rates of nongerminating beans and germinating beans by using a CO2 logger sensor and compare the results. We will also measure the respiration rate while the germinating beans are cooled by ice cold water. Experiment B-11 Respiration of Germinating Seeds Ver 3.2.1 3 Procedure Experiment setup Prior preparation: 1. Set up the experiment as shown in the picture below. 2. Put 60 beans inside the plastic container and add some water. The water should almost cover the beans. 3. Prepare 30 more beans in the CO2 sensor glass bottle and leave it open. 4. Leave the beans in this way overnight or a few hours before the experiment. Additional preparation: 5. Make sure you have some tissue papers, a plastic spoon and ice cold water in a 250 ml beaker. Experiment B-11 Respiration of Germinating Seeds Ver 3.2.1 4 Sensor setup 6. Connect the USB-200 module 7. Check that the CO2 sensor USB-200 module. to the PC. is connected to the Important: You must wait at least 30 minutes after connecting the sensor to the USB-200 module or to the battery module before beginning offsetting and measurements. Note: The following software functions are explained in short. It is recommended to practice the NeuLog application functions (as described in the user manual) beforehand. 8. Run the NeuLog application and check that the CO2 sensor is identified. Experiment B-11 Respiration of Germinating Seeds Ver 3.2.1 5 Settings 9. Click on the On-line Experiment icon main icon bar. 10. Click on the Experiment Setup icon in the NeuLog and set the: Experiment duration to 5 minutes Sampling rate to 60 per minute Testing and measurements 11. When offsetting the sensor, the value is set to 380 ppm which is the outdoor air value of CO2 in most locations. It is recommended to offset the sensor outside (you can get it out through a window) to avoid a shift in the values (if you choose to offset the sensor indoors the calculated rates will still be correct). 12. After the sensor was connected to the USB-200 module or to a battery module for at least 30 minutes, check that the values are relatively stable (remember that your breathing affects the values). If the values are not stable keep the sensor connected some more time and check again. Go outside, wait a few minutes and offset the sensor, pressing the sensor’s offset button continuously (3-5 seconds). If needed, disconnect the sensor from the USB200 module and quickly connect it to a battery module. 13. Come back inside and make sure again that the CO2 values are relatively stable (they should be higher than outside). Experiment B-11 Respiration of Germinating Seeds Ver 3.2.1 6 14. Close the bottle with the non-germinating beans using the CO2 probe and wait for three minutes before starting the measurement. Experiment B-11 Respiration of Germinating Seeds Ver 3.2.1 7 15. Click on the Run Experiment icon measurement. to start the 16. Click on the Zoom fit icon during the measurement to see better how the graph changes. 17. Your graph should be similar to the following: 18. Save your graph. 19. You can see that there is a slight increase in the CO2 level. This indicates a very small respiration rate as expected. 20. Click on the Select zone icon of the graph. 21. Click on the Show Functions icon and select the linear area . Experiment B-11 Respiration of Germinating Seeds Ver 3.2.1 8 22. Click on the CO2 button on the left of the screen and then click on the Linear fit button. 23. This is the linear fit function we received: Y=0.015X + 355 The respiration rate is 0.015 ppm/minute for the sample experiment. 24. Fill in your results in the following table: Germinating/Nongerminating beans Non-germinating (sample experiment) Germinating (sample experiment) Non-germinating Germinating Germinating Conditions Respiration [ppm/minute] Room temperature 0.015 rate Room temperature 1.256 Room temperature Room temperature Bottle in ice cold water 25. Click on the Erase Graph icon . 26. Remove the non-germinating beans from the bottle. 27. Take the tissue paper and dry 30 of the germinating beans. Experiment B-11 Respiration of Germinating Seeds Ver 3.2.1 9 28. Put them inside the CO2 sensor bottle. 29. Close the bottle using the CO2 probe and wait for three minutes before starting the measurement. 30. Click on the Run Experiment icon measurement. 31. Click on the Zoom fit icon during the measurement to see better how the graph changes. 32. Your graph should be similar to the following: 33. Save your graph. 34. You can see that there is a larger increase in the CO2 level in the germinating beans compared to the non-germinating beans. to start the Experiment B-11 Respiration of Germinating Seeds Ver 3.2.1 10 35. Click on the Select zone icon of the graph. and select the linear area 36. Click on the Show Functions icon 37. Click on the CO2 button on the left of the screen and then click on the Linear fit button. 38. This is the linear fit function we received: Y=1.256X + 663 . The respiration rate is 1.256 ppm/minute for the sample experiment. 39. Fill in your results in the previous table. Experiment B-11 Respiration of Germinating Seeds Ver 3.2.1 11 Challenge research 40. Fill the plastic container with 200 ml of ice cold water. 41. Insert the bottle with fresh germinating beans (dried with tissue paper). Wait for 5 minutes and repeat the experiment. 42. What results would you expect to see? Will the rate be higher or lower than in the germinating beans at room temperature measurement? Will the rate be higher or lower than in the non-germinating beans measurement? Experiment B-11 Respiration of Germinating Seeds Ver 3.2.1 12 Summary questions 1. What was the ratio between respiration rates of the germinating beans and the non-germinating beans in your experiment? Why is there such a difference? 2. How did the ice cold water affect the respiration rate of the germinating beans? Explain. 3. What other condition change (besides cold temperature) could be applied to the germinating beans in this experiment? How would this change in conditions affect the respiration rates? 4. Draw a flow chart that describes the life cycle of a plant. Experiment B-11 Respiration of Germinating Seeds Ver 3.2.1