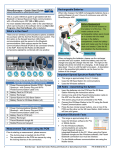
1
Spokane River Quality Assurance Project Plan – Addendum 1 August 11, 2015 Quality Assurance Project Plan Addendum 1 Spokane River Toxics Reduction Strategy Study Prepared for: Spokane River Regional Toxics Task Force FINAL Date: August 11, 2015 Spokane River Quality Assurance Project Plan – Addendum 1 Blankpage August 11, 2015 Spokane River Quality Assurance Project Plan – Addendum 1 _______________________________________________ August 11, 2015 Date:__________________________ Date:_____________________________ Date:_____________________________ Aug. 14th, 2015 Date:_____________________________ DaleHoover,LaboratoryQAManager AXYSAnalyticalServices ________________________________________________ JohnKern,LaboratoryTechnicalDirector SVLAnalytical,Inc. ________________________________________________ MichaelDesmarais,LaboratoryQCManager SVLAnalytical,Inc. _______________________________________________ ShawnHinz,ProjectManagerGravity Environmental 3 Spokane River Quality Assurance Project Plan – Addendum 1 August 11, 2015 TABLE OF CONTENTS Abstract ...........................................................................................................................................................1 Introduction ...........................................................................................................................................................1 ProjectOrganization.............................................................................................................................................................................2 Budget ................................................................................................................................................................................................5 Background ...........................................................................................................................................................5 ConfidenceIntervalTesting...............................................................................................................................................................5 2014SynopticSurvey...........................................................................................................................................................................6 2105DryWeatherSurvey..................................................................................................................................6 Parameters................................................................................................................................................................................................7 Schedule ................................................................................................................................................................................................7 QualityObjectivesandCriteria........................................................................................................................9 SamplingProcedures........................................................................................................................................11 SamplingInitiation..............................................................................................................................................................................11 SampleCollection.................................................................................................................................................................................12 FlowMeasurements............................................................................................................................................................................12 SampleHandlingandCustody.......................................................................................................................12 AnalyticalMethods............................................................................................................................................13 QualityControl....................................................................................................................................................13 FieldSamplingQualityControl......................................................................................................................................................13 FieldMeasurementsQualityControl...........................................................................................................................................14 LaboratoryAnalysisQualityControl...........................................................................................................................................14 CorrectiveAction................................................................................................................................................15 FieldMeasurementsandSampleCollection.............................................................................................................................15 LaboratoryAnalyses...........................................................................................................................................................................15 DataManagement...............................................................................................................................................16 References ........................................................................................................................................................16 i Spokane River Quality Assurance Project Plan – Addendum 1 August 11, 2015 LIST OF FIGURES Figure1.ProjectTeamOrganization..............................................................................................................................5 Figure2.SpokaneRiverMonitoringLocationsMap.................................................................................................8 LIST OF TABLES Table1.ProjectTeamResponsibilities..........................................................................................................................3 Table2.SpokaneRiverMonitoringLocations.............................................................................................................9 Table3.SpokaneRiverMonitoringParameters.........................................................................................................9 Table4.PCBDataQualityIndicators.............................................................................................................................10 Table5.DataQualityIndicators–DOC,TOC,TSS,TDS.........................................................................................10 Table6.DryWeatherSampling–PCBSampleCount............................................................................................11 Table7.SpecificationLimitsofFieldMeasurementInstruments.....................................................................11 Table8.SpokaneWeatherStationLocations.............................................................................................................12 Table9.Guidelinesforsamplecontainerpreparationandpreservation......................................................13 Table10.Parameters,DetectionLimits,ExpectedConcentrationsandAnalyticalMethods................13 ii Spokane River Quality Assurance Project Plan – Addendum 1 August 11, 2015 Abstract ThisAddendumtotheQualityAssuranceProjectPlan(QAPP)correspondstoacontinuationin2015ofthe workdescribedintheoriginalQAPPfor2014.Theobjectiveof2015DryWeatherSurveyistocollectthe necessarydatatorepeatthesemi‐quantitativemassbalanceassessmentconductedusingthe2014Synoptic Surveydata,focusingonthesectionofriverbetweenBarkerRoadandtheSpokaneUSGSGage.The2014 QAPPandSamplingandAnalysisPlan(SAP)(approvedbyEcologyandSRRTTF)arestillapplicable.The revisionscontainedinthisAddendumconsistof: Refiningin‐streamsamplinglocationsinanarrowerspatialareatofocusontheareaimmediately upstreamanddownstreamofpotentialgroundwatercontributionsidentifiedin2014. Narrowingthetemporalscopeofsamplingtoashorterdurationbuthigherfrequencythan2014, consistentwiththenarrowerspatialscope. Revisingthedefinitionofawetweathereventtoconsidermultipleprecipitationgages,insteadofthe singleprecipitationgageusedduring2014. Inclusionofmanualstreamflowmonitoring(andStandardOperatingProceduresforthis monitoring)atsamplingstationswithoutflowgagingstations. Introduction TheSpokaneRiverRegionalToxicsTaskForce(SRRTTF)isdevelopingacomprehensiveplantoreducetoxic pollutantsintheSpokaneRiver,specificallypolychlorinatedbiphenyls(PCBs).Thecomprehensiveplanwill bedesignedtoidentifyspecificmanagementactionsthatcanbeundertakentocontrolpollutantloadssuch thatwaterqualityobjectivescanultimatelybeattained.Comprehensiveplansofthistyperequiredata capableofdescribingindividualsourcesandsite‐specificprocessesthatdriveresultingconcentrations. LimnoTech(2014a)describedtheoveralldatacollectionstrategyforafirstyearofmonitoring,basedonthe workconductedtoidentifykeygapsintheexistingdatasetandissuesaddressedataDecember2013 monitoringworkshop. ASynopticSurveywasconductedin2014toidentifypotentiallysignificantdryweathersourcesofPCBsto theSpokaneRiverbetweenLakeCoeurd’AleneandNineMileDam.Theresultsofthisstudyshowedthe stronglikelihoodofagroundwaterPCBsourcebetweenBarkerRoadandtheTrentAvenueBridge,andthe potentialofanadditionalgroundwaterPCBsourcebetweentheTrentAvenueBridgeandtheSpokaneUSGS gage(LimnoTech,2015).TheSRRTTFTechnicalTrackWorkGrouprecommended,andtheTaskForceasa wholeapproved(SRRTTF,2015a,2015b),conductinga2015SynopticSurveytoconfirmthefindingsofthe 2014SynopticSurveyoveranarrowerspatialscope. ThisQAPPaddendumhasbeenpreparedtoprovidetherevisedsamplingplanandtodocumentthe proceduralandanalyticalrequirementsforthe2015DryWeatherSurveytotakeplaceinAugust2015.The QAPPaddendumalsoaddresslogisticalproblemsencounteredduringthe2014SynopticSurvey,suchas accuratestreamflowmeasurementsandpossibleimpactsfromprecipitationevents.TheQuality Assurance/QualityControlproceduresoutlinedinthe2014QAPPwillbefollowedforthissamplingwork (LimnoTech,2014b). 1 Spokane River Quality Assurance Project Plan – Addendum 1 August 11, 2015 Project Organization Eachoftheorganizationsincludedintheprojectteamhasestablishedanorganizationalstructurefor providingtechnicaldirectionandadministrativecontroltoaccomplishquality‐relatedactivitiesforthe developmentoftheproject. KeyprojectpersonnelandtheircorrespondingresponsibilitiesarelistedinTable1belowandshownin Figure1. 2 Spokane River Quality Assurance Project Plan – Addendum 1 August 11, 2015 Table 1. Project Team Responsibilities Name/Affiliation Project Title/Responsibility SRRTTF Oversight and direction Secure funding for project activities Review and utilize project results Facilitate communications and provide public access to information Develop recommendations for controlling and reducing sources Develop comprehensive plan SRRTTF ACE President Manage contracts: review and approve project specifications Ensure project is completed in timely manner Receive deliverables and reports Manage data on behalf of SRRTTF Communicate with SRRTTF Communicate quality assurance issues with SRRTTF Ensure access to project information on the SRRTTF website Facilitate upload of data to EIM Project Manager General oversight Review/approval of all work products prior to delivery to SRRTTF‐ACE Ensures that work is done in accordance with QAPP and SAP Reviews project with Laboratory Operations Directors prior to sampling Provides oversight of field activities (variances, documentation, QA/QC) Arranges for system audits Advisor Reviews/approves QAPP Bud Leber – SRRTTF‐ACE David Dilks ‐ LimnoTech Jim Bellatty, Adriane Borgias – Department of Ecology Robert Steed – Idaho DEQ Cathy Whiting ‐ LimnoTech Carrie Turner ‐ LimnoTech LimnoTech Shea Hewage – AXYS Analytical Services Richard Grace – AXYS Sean Campbell – AXYS Analytical Services Advisor Reviews/approves QAPP Field Manager: Synoptic Survey and Quarterly sampling events Direct all field activities, ensure samples handled in accordance with SAP Data screening, evaluation, validation, and usability determination Manage field variances, nonconformance, and corrective actions Manage reports, documentation, Project QA/QC file, and electronic data Communicates project specifics with Project Manager Conducts training of field sampling crew Project Quality Assurance Officer Performs systematic evaluation of data quality Receives notices, initiates investigation, and documents nonconformance with DQOs Manage the Project QA/QC file Independent Auditor Perform a critical, written evaluation of the work product Conducts audits at the direction of the Project Manager Laboratory Operations Director Sample analysis Serves as main point of contact for laboratory Manages laboratory Quality Assurance systems Final review and validation of data and field systems Initiates corrective actions for nonconformance Communicates with Project Manager and SRRTTF‐ACE Laboratory Project Director Oversight of all laboratory commercial and technical project specifications Laboratory Project Manager Serves as main point of contact for laboratory Assists Laboratory Operations Director with management of laboratory QA systems 3 Spokane River Quality Assurance Project Plan – Addendum 1 Name/Affiliation Dale Hoover‐AXYS Analytical Services John Kern – SVL Analytical, Inc. Michael Desmarais– SVL Analytical, Inc. Christine Meyer – SVL Analytical, Inc. Shawn Hinz – Gravity Environmental August 11, 2015 Project Title/Responsibility Communicates with Project Manager Laboratory QA/QC Managers Manages Laboratory QA/QC activities Reviews and verifies field records, laboratory records and laboratory data Addresses nonconformance and carries out corrective actions at the laboratory. Technical Director Sample analysis Serves as main point of contact for laboratory Manages laboratory Quality Assurance systems Final review and validation of data and field systems Initiates corrective actions for nonconformance Communicates with Project Managers and SRRTTF‐ACE Laboratory QA/QC Manager Manages Laboratory QA/QC activities Reviews and verifies field records, laboratory records and laboratory data Addresses non‐conformances and carries out corrective actions at the laboratory. Laboratory Project Manager Serves as main point of contact for laboratory Assists Laboratory Operations Director with management of laboratory QA systems Conducts Sample Collection Collects samples in accordance with QAPP and SAP Prepares and follows the Invasive Species Plan Prepares and administers Health and Safety Plan for employees Maintains equipment logs, field records and data sheets Transfers field data to Field Manager Manages field equipment, conducts calibrations Addresses nonconformance findings and responds to corrective actions Thelinesofreportingfortheorganizationsintheprojectareshownintheorganizationchart(Figure1).Each teammemberhasresponsibilityforperformanceofassignedqualitycontroldutiesinthecourseof accomplishingidentifiedactivities.Thequalitycontroldutiesinclude: • Completingtheassignedtaskonorbeforescheduleandinaqualitymannerinaccordancewith establishedprocedures;and • AscertainingthattheworkperformedistechnicallycorrectandmeetsallaspectsoftheQAPP. 4 Spokane River Quality Assurance Project Plan – Addendum 1 August 11, 2015 Figure 1. Project Team Organization Budget Thetotalbudgetforthisprojectis$95,000.ThisincludesPCBanalysisbyAXYSAnalyticalServices, conventionalparameteranalysesbySVLAnalytical,fieldsamplingbyGravityEnvironmental,andoversight anddataanalysisbyLimnoTech. Background TheSpokaneRiverwatershedhasexistingPCBmonitoringdata,whichprovideanestimateoftheamountof PCBsenteringtheSpokaneRiverfromcontributingsourceareacategories(e.g.stormwater,WWTPs).Based ontheSpokaneRiverPCBSourceAssessment2004‐2007(Serdaretal,2011),only43%ofthePCBsource loadingtotheriverbetweenStateline(RM96.1)andLongLakeDam(RM33.9)couldbeidentified.Thisis dueinparttotheuncertaintyoftheanalysesandthehighvariabilityinthedata.Theexistingdataindicate thatsourcesofPCBsareverydiffusethroughoutthewatershed,suchthatmoredatawillbeneededto supportdevelopmentofamanagementplanwithtargetedcontrolactions(LimnoTech,2013).Twostudies wereconductedin2014,theConfidenceIntervalTestingandtheSynopticSurvey. Confidence Interval Testing ConfidenceIntervalTestingwasperformedinMay2014toprovideinformationforthe2014sampling program.TheConfidenceIntervalTestingwasperformedbyEcologyasaninitialtasktoconfirmthe appropriatesamplevolumesandfrequencies.Thisinitialsamplingeffortwasdesignedtogenerate 5 Spokane River Quality Assurance Project Plan – Addendum 1 August 11, 2015 informationbothonthetemporalvariabilityofPCBconcentrations,aswellasestimatesofmeasurement uncertaintyforthelowPCBconcentrationsoccurringintheSpokaneRiver. FivesamplingeventswereconductedinMay2014ontheSpokaneRiverattheStateParkParcelatRiverMile 87,locatedbetweenMirabeauandSullivanParks(referredtoastheMirabeauParksite)andthreesampling eventsattheLakeCoeurd’Aleneoutlet.Sampleswerecollectedforbothdiscreteandcompositeanalysesat MirabeauPark,whilediscretesampleswerecollectedattheLakeCoeurd’Aleneoutlet. TheresultsshowedthatPCBconcentrationswereverylowatbothstations,withlabblank‐corrected concentrationsrangingfrom7.7to54pg/lattheLakeCoeurd'AleneOutletand6.2to80pg/latMirabeau Park.Concentrationsobservedintripblanksandlaboratoryblankswereatsimilarlevelstothoseobserved infieldsamples,makingitdifficulttodistinguishanenvironmentalsignalfromthenoiseinlaboratory measurement.Basedontheseresults,itwasdeterminedthatthePCBconcentrationswerepredictedtobe significantlyhigherduringtheAugust2014SynopticSurveythantheywereduringtheMaysampling,dueto muchlowerriverflowsandconsequentlylowerdilutionofweather‐independentexternalPCBsources. Therefore,thedatawouldbesufficienttosupportasemi‐quantitativemassbalanceassessmentandbeable toidentifystreamreacheswhereincrementalloadsleadtoasignificantincreaseinriverconcentrations. 2014 Synoptic Survey The2014SynopticSurveyconsistedofdryweathersamplinginAugust2014,atmultiplelocationsinthe SpokaneRiverupstreamofLakeSpokane.Thesestationsconsistedofriverlocationswithgagingstations, NPDESpermittedsourcesandtheLatah(Hangman)Creekmouth.Multipleriversamplingeventswere conducted(withsomecompositingtoreduceanalyticalcosts)overatwoweeksamplingperiodtoreducethe uncertaintyinloadingestimatescausedbydaytodayvariabilityinconcentrations. TheresultsshowedthattotalPCBconcentrationsaremostlybelow50pg/lfromtheLakeCoeurd’Alene outlettotheBarkerRoadBridge.Concentrationsaregenerallybetween100and200pg/lfromtheTrent AvenueBridgedownstreamtoNineMileDam.Approximatelyonequarterofallsamplesexceedthe Washingtonwaterqualitystandardof170pg/l,whileallofthesamplesexceedthedownstreamSpokane TribeofIndians’waterqualitystandardof1.3pg/l. 2105 Dry Weather Survey Theobjectiveof2015DryWeatherSurveyistocollectthenecessarydatatorepeatthesemi‐quantitative massbalanceassessmentconductedusingthe2014SynopticSurveydata,focusingonthesectionofriver betweenBarkerRoadandtheSpokaneUSGSGage.The2015samplinglocationsarebasedontheresultsof 2014SynopticSurvey,whichshowedthestronglikelihoodofagroundwaterPCBsourcebetweenBarker RoadandtheTrentAvenueBridge,andthepotentialofanadditionalgroundwaterPCBsourcebetweenthe TrentAvenueBridgeandtheSpokaneUSGSgage(LimnoTech,2015).Thein‐streamsamplinglocationshave beenplacedinanarrowerspatialareatofurtheridentifypotentialgroundwatercontributions. Measurementofriverflowinconjunctionwithwaterqualitywillallowconcentrationmeasurementstobe convertedtomassloads.Flowmeasurementswillbemadeatthelocationsthatdonothaveaflowgaging station.TheDryWeatherSurveysamplelocationsaresummarizedinTable2.Riverlocationsareidentified asin‐streamsamplesandNPDESpermittedsourcesareidentifiedasdischargesamples.Thepointof dischargeisdeterminedtobethelocationidentifiedinthedischargersNPDESpermitorasdeterminedinthe fieldbythesamplingteamandapprovedbytheprojectmanager.ThesamplelocationsareshowninFigure 2. 6 Spokane River Quality Assurance Project Plan – Addendum 1 August 11, 2015 Samplingwillbeconductedduringthesummerlowflowperiod(August)tominimizepotentialconfounding effectsofwetweathersources. Parameters ThestudyparametersincludePCBcongeners,totalsuspendedsolids(TSS),totaldissolvedsolids(TDS),total organiccarbon(TOC)anddissolvedorganiccarbon(DOC).TSS,TOCandDOCwillbeusedtoprovide informationonthedistributionofPCBsamongvariousforms(i.e.purelydissolved,adsorbedtosolids,sorbed toDOC),whichwillbeneededifafateandtransportmodelisdeveloped.TDScanbeusedasatracerto provideinformationongroundwatercontributiontotheriver.Theparametersincludedinthe2105Dry WeatherSurveyarelistedinTable3. Schedule Keymilestonesassociatedwiththeprojectaredescribedbelowalongwiththeirtargetedcompletiondates: SRRTTFTechnicalTrackWorkGroupReview August5,2015 Conductsamplingevent August17,2015 DraftReport December1,2015 FinalReport February28,2016 7 Spokane River Quality Assurance Project Plan – Addendum 1 August 11, 2015 Figure 2. Spokane River Monitoring Locations Map 8 Spokane River Quality Assurance Project Plan – Addendum 1 August 11, 2015 Table 2. Spokane River Monitoring Locations Site SR‐3 SR‐4 SR‐5 SR‐6 SR‐7 SR‐8 SR‐8a SR‐9 Location Spokane River at Spokane Spokane River at Greene Street Bridge Spokane County Regional Water Reclamation Facility Inland Empire Paper Spokane River at Below Trent Bridge Kaiser Aluminum Mirabeau Park Spokane River at Barker Road Bridge Type of Sample In‐stream In‐stream Discharge Discharge In‐stream Discharge In‐Stream In‐stream USGS Gage X X Manual Flow Measurement X X X Table 3. Spokane River Monitoring Parameters Parameter Polychlorinated Biphenyl (PCB)– 209 Congeners Dissolved Organic Carbon (DOC) Total Organic Carbon (TOC) Total Suspended Solids (TSS) Total Dissolved Solids (TDS) Temperature Conductivity pH Dissolved Oxygen (DO) Turbidity Type of Parameter Laboratory analytical Laboratory analytical Laboratory analytical Laboratory analytical Laboratory analytical In‐situ measurement In‐situ measurement In‐situ measurement In‐situ measurement In‐situ measurement Quality Objectives and Criteria Thedataqualityobjectivesareintendedtoclarifythestudy’stechnicalandqualityobjectives,definethe appropriatetypeofdata,andspecifytolerablelevelsofpotentialdecisionerrorsthatwillbeusedasthebasis forestablishingthequalityandquantityofthedataneededtosupportdecisions.Thedataqualityobjectives forthisstudyhavebeendevelopedinordertoensurethatthedatacollectedareofacceptablequalityand supporttheobjectivesoftheproject.ThedataqualityobjectivesaredescribedinSection1.4ofthe2014 QAPP(LimnoTech,2014b). The2015datawillbeevaluatedrelativetothedataqualityobjectivesoutlinedinthe2014QAPP(LimnoTech, 2014b).DataqualitywillbeinterpretedusingtheDataQualityIndicators(DQIs)whicharethequantitative statisticsandqualitativedescriptorsusedtointerpretthedegreeofacceptabilityofthedatatotheuser.The DQIsincludebiasandprecision,representativeness,completeness,comparability,andtherequireddetection limits(sensitivity)fortheanalyticalmethods. TheDataQualityIndicatorsandthemeasurementperformancecriteriaforeachareprovidedinTables4and 5.ThenumberofsamplescollectedperlocationisincludedinTable6.Thespecificationsforfield instrumentsareincludedinTable7. Itshouldbenotedthatthereisnostandardblankcorrectionmethod,andnumerousapproachesareutilized, bothnationallyandwithintheSpokaneRiverBasin.Theselectionofthemostappropriateblankcorrection 9 Spokane River Quality Assurance Project Plan – Addendum 1 August 11, 2015 methodologymustconsiderfactorssuchas:studyobjectives,samplematrix,samplingmethodology,expected rangeofresults,andtoleranceforbiasedresults. Table 4. PCB Data Quality Indicators Analytical Method PCB Congeners EPA 1668C /AXYS Method MLA-010 Rev 11 BIAS BIAS BIAS PRECISION SENSITIVITY COMPLETENESS Daily Calibration Verification Lab Control Sample Recovery* % recovery limits % recovery limits Sample and Method Blank Surrogate Recovery % recovery limits Method Blank Duplicate Sample Detection Limit (Level at which nondetects are reported) Completeness Criteria Concentration (pg/L) RPD (valid for congeners > 10x EDL) 50% Concentration (pg/L) % 50-145% 50-150% 25-150%* Maximum = 127 pg/L (total) Laboratory will B-qualify congeners results < 3x the concentration in an associated blank 1-20 95 *PerAXYSMethodMLA‐010Revision11forOPR,internalstandardsandlabeledcompounds. Table 5. Data Quality Indicators – DOC, TOC, TSS, TDS DQI Parameter Analytical Method DOC TOC TSS TDS EPA 415.3 EPA 415.1 EPA 160.2 EPA 160.1 BIAS BIAS Lab Matrix Control Spikes Sample % % recovery recovery limits limits 80‐ 80‐ 120% 120% 80‐ 80‐ 120% 120% 80‐ ‐‐ 120% 80‐ ‐‐ 120% BIAS PRECISION PRECISION Matrix Spike Replicate SENSITIVITY Detection Limit COMPLETENESS Lab Blanks Replicate Samples Completeness Criteria RPD RPD % < ½ EQL 30% 20% 1 mg/L 95 < ½ EQL 30% 20% 1 mg/L 95 < ½ EQL 30% ‐‐ 1 mg/L 95 < ½ EQL 30% ‐‐ 1 mg/L 95 10 Spokane River Quality Assurance Project Plan – Addendum 1 August 11, 2015 Table 6. Dry Weather Sampling – PCB Sample Count Number of Samples Duplicates Composite Samples Barker Road Mirabeau Park 5 5 1 1 1 1 Trent Bridge Green Street Gage Spokane Gage Kaiser Aluminum Inland Empire Paper Spokane County WRF 5 5 5 5 5 5 1 1 1 1 1 1 1 1 1 1 1 1 Sampling Location Table 7. Specification Limits of Field Measurement Instruments Parameter Instrument Range Accuracy Resolution Temperature Hydrolab ‐5 to 50°C ±0.10°C 0.01°C YSI ‐5 to 45°C ±0.15°C 0.01°C Hydrolab 0 to 14 units ±0.2 units 0.01 units YSI 0 to 14 units ±0.2 units 0.01 units Hydrolab 0 to 20 mg/L ±0.2 mg/L 0.01 mg/L YSI 0 to 20 mg/L ±0.2 mg/L 0.01 mg/L Hydrolab 0 to 100 mS/cm ±0.5% of range 1.0 uS/cm YSI 0 to 100 mS/cm ±1% of range 1.0 uS/cm YSI 0‐1000 NTU ±5% of range 0.1 units pH Dissolved Oxygen Conductivity Turbidity Sampling Procedures Sampling Initiation Theinitiationofmonitoringisdesignedwiththeintenttocaptureidealdryweatherconditionsifpossible,yet ensurethatmonitoringbeconductedduringthelowflowperiod.Monitoringisscheduledtobegininmid‐ August.Priortoinitiationofsamplingthefollowingconditionsmustbemet: • Twodayshavepassedsincethelastrainfallgreaterthananaverageof0.2inchesatthe reportingprecipitationstationsintheCityofSpokaneMS4/CSOdrainagebasin.Thesestations arelistedinTable8. • Thelocalweatherforecastcontainsnodayswithapredictedlikelihoodofrainfallgreaterthan 50%forthefollowingthreedays. Oncesamplingisinitiated,sampleswillbecollectedeverydayoverafivedayperiod.Ateachsamplingstation asinglesamplewillbecollectedfordiscreteanalysisandanothersampletobeanalyzedaspartofa compositeofallfivesamplescollectedatthatstation,forallparameters.Compositingwillbeconductedby thelaboratory. 11 Spokane River Quality Assurance Project Plan – Addendum 1 August 11, 2015 Wastewatereffluentswillbesampledasgrabsamplesonthreeseparatedates,spacedevenlyoverthedry weathersamplingperiod(Days1,3and5).Eachsamplingeventwillcollectasinglesamplefordiscrete analysisandanothersampletobeanalyzedaspartofacompositeofallthreesamplescollectedatthat station. Ifaprecipitationeventexceedinganaverageof0.2inchesatallweatherstations(Table8)occursduringthe samplingperiodthefollowingchangeswillbemadetothesamplingplan: Ifaprecipitationeventgreaterthan0.2inchesofprecipitation(averageofallweatherstations) occursafterfourdaysofsamplinghavebeencompleted,thefifthdayofsamplingwillbeaborted. Ifaprecipitationeventgreaterthan0.2inchesofprecipitation(averageofallweatherstations) occursafterthreedaysorlessofsamplinghavebeencompleted,samplingwillbesuspendedfortwo daysandthenresumedtocompletefivedaysofsampling. Sample Collection Allsamplingproceduresdescribedinthe2014SAP(LimnoTech,2014c)willbefollowed. Flow Measurements Manualflowmeasurementswillbecollectedatthefollowinglocations: BarkerRoad MirabeauPark TrentBridgeGage FlowmeasurementswillbecollectedatthetimeofeachsamplecollectionusingaSontekM‐9. TheStandardOperatingProcedureforstreamflowmeasurementisincludedinAppendixA. Table 8. Spokane Weather Station Locations Site 1 2 3 4 5 6 7 8 Weather Station Location Spokane, WA Corbin Park, Spokane, WA Kendall Yards, Spokane, WA River Run, Spokane, WA West Central, Spokane, WA Lincoln Heights, Spokane, WA South Hill, Spokane, WA Felts Field Latitude/Longitude 47.65 °N, 117.43 °W 47.68 °N, 117.42 °W 47.66 °N, 117.44 °W 47.67 °N, 117.46 °W 47.67 °N, 117.45 °W 47.64 °N, 117.36 °W 47.62 °N, 117.35 °W 47.68 °N, 117.32 °W Sample Handling and Custody SamplehandlingwillbetheresponsibilityofGravityEnvironmentalandwillbeperformedusingmethodsas specifiedinthe2014SAP(LimnoTech,2014c),sothatrepresentativesamplesarecollected,stored,and submittedtothelaboratoryforanalysis.Samplecontainers,volumes,preservativesandholdingtimesare summarizedinTable9.Propersamplehandlingandcustodyprocedureswillbeemployedasdiscussedinthe 2014QAPP(LimnoTech,2014b). 12 Spokane River Quality Assurance Project Plan – Addendum 1 August 11, 2015 Table 9. Guidelines for sample container preparation and preservation Parameter PCB TSS TDS TOC DOC Container Volume Amber glass Polypropylene Polypropylene Amber glass Amber glass Preservative o 2.36 L 1 L 500 ml 40 ml 40 ml 4 C 4o C 4o C 4o C, H2SO4 4o C Holding Time 1 year 7 days 7 days 28 days 28 days Analytical Methods Thefollowingsectiondetailstheaspectsoftheanalyticalrequirements,ensuringthatappropriateanalytical methodsareemployed.Tables4and5summarizetheanalyticalmethodstobeusedbythelaboratory.Table 9displaystherequiredcontainertype,samplevolume,preservation,andholdtimeforthestudyparameters accordingtothepreviouslyreferencedmethods.AXYSAnalyticalServicesandSVLAnalytical,Inc.will providesamplecontainersfromacommercialsupplier.Allsamplecontainerswillbenewandpre‐cleanedby thesupplier.Inaddition,thecontractlaboratorieswillprovidesamplelabelsforeachbottle.Thedetection limits,expectedconcentrations,andanalyticalmethodsareincludedinTable10(Ecology,2014). Table 10. Parameters, Detection Limits, Expected Concentrations and Analytical Methods Parameter Matrix Detection Limit Expected Concentrations Number of Samples Analytical Method PCB (pg/L) Water 1‐20 10‐10,000 total 55 EPA 1668C TSS (mg/L) Water 1 1‐80 47 SM‐2540D TDS (mg/L) Water 1 1‐80 47 SM‐2540C TOC (mg/L) Water 1 1‐2 47 SM‐5310B DOC (mg/L) Water 1 1‐2 47 SM‐5310B Laboratory AXYS Analytical Services SVL Analytical, Inc. SVL Analytical, Inc. SVL Analytical, Inc. SVL Analytical, Inc. Quality Control Analyticalqualitycontrolwillbeperformedinaccordancewiththespecifiedanalyticalmethodsandas presentedinthe2014QAPP(LimnoTech,2014b). Field Sampling Quality Control FieldsamplingQCconsistsofcollectingfieldQCsamplestohelpevaluateconditionsresultingfromfield activities.FieldQCisintendedtosupportanumberofdataqualitygoals: • Combinedcontaminationfromfieldsamplingthroughsamplereceiptatthelaboratory(toassess potentialcontaminationfromambientconditions,samplecontainers,sampletransport,and laboratoryanalysis)–assessedusingtripblanks/transferblanks. 13 Spokane River Quality Assurance Project Plan – Addendum 1 • August 11, 2015 Combinedsamplingandanalysistechniquevariability,aswellassampleheterogeneity–assessed usingfieldreplicates. TripBlanks–Tripblankswillbeusedtoevaluatewhethercontaminantshavebeenintroducedintothe samplesduetoexposuretoambientconditionsorfromthesamplecontainersthemselves.Atripblankisa controlledwatersample,withminimalconcentrationsofcontaminantsofconcern,whichisproducedbythe laboratory.Thetripblankaccompaniesthesamplingequipmentintothefieldandisstoredwiththe analyticalsamples.Iftransferblanksarerequired,theywillbeobtainedbypouringdeionizedwaterintothe samplecontainerinthefield,preservedandshippedtothelaboratorywiththefieldsamples.Trip/transfer blankswillbecollectedatafrequencyof10%oroneblankpersamplinground. Trip/transferblanks,asdescribedabove,willbepreserved,packaged,andsealedinthesamemanner describedforthesurfacewatersamples.Aseparatesamplenumberandstationnumberwillbeassignedto eachblank.Thesampleswillbesubmittedas“blind”samplestothelaboratoryforanalysis.Iftargetanalytes arefoundintheblanksabovethecriteria,samplingandhandlingprocedureswillbereevaluatedand correctiveactionstaken.Thesemayconsistof,butarenotlimitedto,obtainingsamplingcontainersfrom newsources,trainingofpersonnel,discussionswiththelaboratory,invalidationofresults,greaterattention todetailduringthenextsamplingevent,orotherproceduresconsideredappropriate. FieldReplicateSamples–Fieldreplicatesampleswillbecollectedtoevaluatetheprecisionofsample collectionthroughanalysis.Fieldreplicateswillbecollectedatdesignatedsamplelocationsbyfillingtwo distinctsamplecontainersforeachanalysis.Fieldreplicatesampleswillbepreserved,packaged,andsealed inthesamemannerdescribedforthesurfacewatersamples.Aseparatesamplenumberandstationnumber willbeassignedtoeachreplicate.Thesampleswillbesubmittedas“blind”samplestothelaboratoryfor analysis. Fieldreplicateswillbecollectedforeachanalyticalparameteratafrequencyof10%oronefieldreplicateper samplinground,whicheverisless.Thereplicatesampleswillbecollectedatrandomlocationsforeach samplingevent.Iftheacceptancecriteriaareexceeded,fieldsamplingandhandlingprocedureswillbe evaluated,andproblemscorrectedthroughgreaterattentiontodetail,additionaltraining,revisedsampling techniques,orwhateverappearstobeappropriatetocorrecttheproblem. Field Measurements Quality Control QualitycontrolrequirementsforfieldmeasurementsareprovidedinTable5. Fieldinstrumentationwillbecalibratedaccordingtothemanufacturer’srequirementsandwillbecalibrated daily.Ifafieldinstrumentcannotbecalibrateditshouldnotbeused. Laboratory Analysis Quality Control LaboratoryQCistheresponsibilityofthelaboratorypersonnelandQA/QCdepartmentsofAXYSAnalytical ServicesandSVLAnalytical,Inc.Thelaboratory’sQAManualdetailstheQA/QCproceduresitfollows.The followingelementsarepartofstandardlaboratoryqualitycontrolpractices: • Analysisofmethodblanks • Analysisoflaboratorycontrolsamples • Instrumentcalibration(includinginitialcalibration,calibrationblanks,andcalibrationverification) • Analysisofmatrixspikes(TOC/DOC) • Analysisofduplicates 14 Spokane River Quality Assurance Project Plan – Addendum 1 August 11, 2015 ThedataqualityobjectivesforAXYSAnalyticalServicesandSVLAnalytical,Inc.(includingfrequency,QC acceptancelimits,andcorrectiveactionsiftheacceptancelimitsareexceeded)aredetailedin2014QAPP (LimnoTech,2014b).Anyexcursionsfromtheseobjectivesmustbedocumentedbythelaboratoryand reportedtotheProjectManager/ProjectQAO. Corrective Action Correctiveactionswillbeimplementedasrequiredtorectifyproblemsidentifiedduringthecourseofnormal fieldandlaboratoryoperations.Possibleproblemsrequiringcorrectiveactioninclude: • Equipmentmalfunctions; • Analyticalmethodologyerrors;or • Non‐compliancewithqualitycontrolsystems. Equipmentandanalyticalproblemsthatrequirecorrectiveactionmayoccurduringsamplingandsample handling,samplepreparation,andlaboratoryanalysis. Fornon‐complianceproblems,stepsforcorrectiveactionwillbedevelopedandimplementedatthetimethe problemisidentified.Theindividualwhoidentifiestheproblemisresponsibleforimmediatelynotifyingthe ProjectManagerandtheProjectQAO. Anynon‐conformancewiththeestablishedqualitycontrolproceduresoutlinedinthe2014QAPP (LimnoTech,2014b)willbeidentifiedandcorrected.TheProjectManagerwillensurethataCorrective ActionMemorandumisissuedforeachnon‐conformancecondition.Allnon‐conformancememorandawillbe discussedinthefinalreportsubmittedtotheSRRTTF‐ACE. Field Measurements and Sample Collection ProjectstaffwillberesponsibleforreportinganysuspectedQAnon‐conformanceordeficienciestotheField Manager.TheFieldManagerwillberesponsibleforassessingthesuspectedproblemsinconsultationwith theProjectManagertoreviewthesamplingprotocolsandprovideadditionaltrainingifnecessary.Ifitis determinedthatthesituationwarrantsacorrectiveaction,thenaCorrectiveActionMemorandumwillbe issuedbytheFieldManager. TheFieldManagerwillberesponsibleforensuringthatthecorrectiveactionfornon‐conformancetakes placeby: • Evaluatingallreportedincidencesofnon‐conformance; • Controllingadditionalworkonnonconformingitems; • Determiningwhatcorrectiveactionisneeded; • Maintainingalogofnon‐conformanceissues; • Reviewingresponsestocorrectiveactionmemoranda; • Ensuringthatcopiesofcorrectiveactionmemorandaandresponsesareincludedintheprojectfiles. Noadditionalworkwillbeperformeduntilappropriatecorrectiveactionhasbeenimplementedand documentedinresponsetothecorrectiveactionmemoranda. Laboratory Analyses Correctiveactionsarerequiredwheneverlaboratoryconditions,instrumentmalfunctionorpersonnel situationshaveledorcouldpotentiallyleadtoerrorsintheanalyticaldata.Thecorrectiveactiontakenwill bedependentontheanalysisandtheevent. 15 Spokane River Quality Assurance Project Plan – Addendum 1 August 11, 2015 Laboratorypersonnelarealertedthatcorrectiveactionsmaybenecessaryif: • QCdataareoutsidetheacceptablerangeforprecisionandaccuracy; • Blankscontaintargetanalysesaboveacceptablelevels; • UndesirabletrendsaredetectedinspikerecoveriesorRPDbetweenduplicates; • Excessiveinterferenceisnoted;or • DeficienciesaredetectedbytheIndependentAuditorduringlaboratorysystemauditsasdescribed. Correctiveactionproceduresareoftenhandledatthebenchlevelbytheanalyst,whoreviewsthe preparationorextractionprocedureforpossibleerrors,checkstheinstrumentcalibration,spikeand calibrationmixes,andinstrumentsensitivity,etc. CorrectiveactiontakenwithineachlaboratoryistheresponsibilityoftheLaboratoryOperations/Technical Director.Whenaproblemoccurs,theLaboratoryTechnicalDirectorinformstheProjectManageraboutthe problemandthestepstakentoresolveit.Oncetheproblemisresolved,fulldocumentationofthecorrective actionprocedurewillbesubmittedtotheProjectManager. Allnon‐conformancememorandainitiatedbythecontractlaboratorywillbediscussedinthecasenarrative orincludedinthelaboratoryreports.TheProjectManagerwillfollow‐uponallcorrectiveactionsthatare takentoensurethatthememorandaareaccurate. Data Management Datamanagementwillbeconductedasdescribedinthe2014QAPP(LimnoTech,2014b). References Ecology,2014.SpokaneRiverToxicsSampling2012‐2013–SurfaceWater,CLAMandSedimentTrap Results.TechnicalMemorandumfromBrandiEra‐MillertoDaleNorton. LimnoTech,2013.IdentificationofDataGaps‐Final.MemorandumfromDaveDilks,TimToweyandKat RidolfitoSpokaneRiverRegionalToxicsTaskForce.November14,2013. LimnoTech,2014a.DataCollectionStrategyforPCBComprehensivePlan‐Draft.MemorandumfromDave DilkstoSpokaneRiverRegionalToxicsTaskForce.February4,2014. LimnoTech,2014b.QualityAssuranceProjectPlan,preparedforSpokaneRiverRegionalToxicsTaskForce, July23,2014. LimnoTech,2014c.SamplingandAnalysisPlan,preparedforSpokaneRiverRegionalToxicsTaskForce,July 31,2014. LimnoTech,2015.SpokaneRiverRegionalToxicsTaskForcePhase2TechnicalActivitiesReport: IdentificationofPotentialUnmonitoredDryWeatherSourcesofPCBstotheSpokaneRiver.Preparedfor SpokaneRiverRegionalToxicsTaskForce. Serdar,D.,B.Lubliner,A.Johnson,D.Norton,2011.SpokaneRiverPCBSourceAssessment2003‐2007. PublicationNo.11‐03‐013. SpokaneRiverRegionalToxicsTaskForce,2015a.TechnicalTrackWorkGroupMeeting,MeetingMinutes, May6,2015 SpokaneRiverRegionalToxicsTaskForce,2015b.TaskForceMeeting,DraftSummaryNotes,June24,2015. 16 Spokane River Quality Assurance Project Plan – Addendum 1 August 11, 2015 17 Spokane River Quality Assurance Project Plan – Addendum 1 August 11, 2015 APPENDIX A FLOW MEASUREMENT – STANDARD OPERATING PROCEDURE 18 (These components are shown and detailed in the GPS Quick Start Guide) RiverSurveyor - Quick Start Guide Getting started with the RiverSurveyor System O This is a quick reference guide to get started with the standard RiverSurveyor ADP (S5 or M9) system. The use and setup of additional optional system components are detailed on other Quick Start Guides. For more detailed information, refer to the User Manual which can be found on the software CD or via Start | All Programs | SonTek Software after installation. What’s in the Case? P Q R S T RTK GPS Components and Accessories RTK Base Station with Tripod Adapter, GPS antenna, rod and mount Tripod Antenna cable for RTK Base Station Radio Antenna for RTK Base Station Battery Packs for RTK Base Station (x2) Battery Recharger for RTK Base Station Important RiverSurveyor Facts The specifications for the two available RiverSurveyor ADP models are below. Only one ADP is provided with each RiverSurveyor system: RiverSurveyor ADP Range Profiling: 0.06 to 5.0 m Depth: 15.0 m S5 OR What does the RiverSurveyor do? Profiling: 0.06 to 30.0 m Depth: 80.0 m M9 A Some important tips on the RiverSurveyor and its use: • The RiverSurveyor requires no calibration. • Data files are stored on the system and not the PC. They must be downloaded from the system. • Discharge calculation is internal, so measurement quality is unaffected by communications losses. B C E D The RiverSurveyor measures velocities in 3-D throughout the water column below the ADP. It combines tracking information (from Bottom-Track or optional GPS) to measure the total discharge across a river section. Assembling the System The following instructions apply to Standard configuration systems using the Serial Power/Communications cable directly connected to the system for communications and power. Make sure that the cable connector is flush with the ADP connector. Tighten the locking sleeve. K L N F G H J I (Components shown in blue are described in other Quick Start Guides) A B C D E F G H I J K L M N Standard Components S5 or M9 with optional GPS mount and antenna Serial Power/Communications cable(10m) with Adaptor Plug Set (non-US) AC Power Supply Serial to USB Adapter Software and Documentation CD Optional Components and Accessories Power Communications Module (PCM) with Dummy Plug and 8-Pin Power/Communication cable (1m) Battery Pack for PCM (x2) Battery Recharger Parani Bluetooth dongle Kit Mobile Phone and Watertight Lanyard Spread Spectrum (SS) Base Station Battery Packs for SS Base Station (x2) Hydroboard (not shown) GPS Antenna cable Windows Software Installation Insert the RiverSurveyor Live CD-ROM into a PC. The Installation Menu should appear automatically. If not, double click on setup.exe in your CD-ROM drive menu. Install RiverSurveyor Live for PC. Measuring Discharge - Theory The total discharge through a measurement section is computed based on the mean water velocity in the water column and the cross-sectional area. For the purposes of a measurement, the section is broken into three key components: the Start Edge, the Transect and the End Edge. These components are summed together to calculate the total discharge as shown below: Start Edge End Edge Transect RiverSurveyor – Quick Start Guide: Getting started with the RiverSurveyor System Discharge Measurement Facts and Tips Updating and Changing Settings Site selection is an important part of a discharge measurement and can be fundamental in its success. Here are a few quick guidelines to aim for: • Avoid possible obstructions and immediately downstream of bridges, dates and weirs • Flow should be uniform with minimal turbulence • Consider the ADP’s profiling and depth specification (shown on the other side) Key factors when making a discharge measurement: • During the edge measurements, keep the vessel as stationary as possible. • During the transect, maintain a constant vessel speed and direction as is practical. • Ideally, any vessel movement should be slow relative to the flow velocity, and changes in heading should be gradual. These settings are typically specific to the site and should be reviewed prior to starting a measurement. Direct Connection to the System Connect to the system using the Windows software by pressing the Connect button or the Quick Link on the Start page. Connect button Quick Link Select the Serial Port that the ADP is connected to and press Connect The System page (shown to the right) will be displayed showing the system configuration, settings and utility functions. System Settings Enter the depth the vertical beam is below the water surface, Salinity and Magnetic Declination Windows Software Data Collection To collect discharge data using the Windows software: 1. Press the Start button (or F5) to start data collection, but this does not record any data. Instead it allows the data from the system to be viewed to make sure the system is operating correctly. Make sure that all indicators (shown in the top left) are all valid (not red). Position the vessel at the start edge of the transect. 2. Press the Start Edge button (or F5) and collect at least 10 edge samples. The Edge windows will be displayed showing both edges. Keep the vessel as stationary as possible during this time. Input the start edge information into the Edge dialog that pops up and press OK. 3. Press the Start Moving button (or F5) and the Transect window will be displayed. Keep the vessel speed and direction constant as you cross the river. Pre-Measurement Tests It is important to ensure the integrity of the system prior to any measurements and there are a series of tests that should be performed in this process: • Compass Calibration is necessary prior to all measurements and compensates for magnetic fields. In the Utilities section in the software select Compass Calibration. Press the Start button and rotate the ADP through two complete circles while varying pitch and roll. Magnetic Distortion (M) should be below 10. Keep your cell phone away from the system Site Information Enter all relevant information to the site and measurement. Note that more information is better that less. Calibration Score (Q) should be above 3 4. When the vessel reaches the end edge press the End Edge button (or F5). Follow the same instructions as for the Start Edge (Step 2). 5. Press the End Transect button on completion of the end edge. This automatically opens a new data collection window so you can start a new measurement. The system is still running, so if you need to keep making measurements repeat steps 2 to 5 again or press the Abort button (or F8) to stop. 6. On completion of all your measurements, it is recommended to go to the System tab and download all your collected data files. Technical Support • • In the Utilities section, set the System Time In the Recorder section, select Download all files and then Format Recorder. SonTek/YSI Technical Support is available 24 hours a day, 7 days a week. Tel: +1-858-546-8327 Email: [email protected] Fax: +1-858-546-8150 Web: www.sontek.com RiverSurveyor – Quick Start Guide: Getting started with the RiverSurveyor System