1
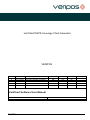
VeriChart DGPS Coverage Chart Generator
VERIPOS
D
C
B
A
1
12.08.2014
10.03.2004
27.11.2003
30.07.2003
22.07.2003
REVISION
DATE
Template update
Amended for v1.61 release
Revised installation procedure
Issued for use
Issued for internal comment
DESCRIPTION
AR
DM
DM
DM
DM
EM
DS
DS
DS
DS
EM
DF
DF
DF
DF
ORIGINATOR
CHECKED
APPROVED
Procedure Title:
VeriChart Software User Manual
Document No:
Date: 12.08.2014
AB-V-MA-00578
File Ref:
AB-V-MA-00578.doc
CLIENT APPR
Procedure Title:
File Ref.:
VeriChart Software User Manual
AB-V-MA-00578
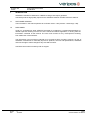
CONTENTS
1.
INTRODUCTION ......................................................................................................................................... 3
1.1
1.2
SOFTWARE VERSION ............................................................................................................................... 3
DISCLAIMER ............................................................................................................................................... 3
2.
INSTALLATION .......................................................................................................................................... 4
2.1
2.2
2.3
2.4
2.5
2.6
2.7
2.8
BACKGROUND ........................................................................................................................................... 4
MINIMUM COMPUTER SYSTEM REQUIREMENTS ................................................................................. 4
SOFTWARE VERSION ............................................................................................................................... 4
LICENSING ................................................................................................................................................. 5
LIABILITY .................................................................................................................................................... 5
SOFTWARE INSTALLATION...................................................................................................................... 6
POST INSTALLATION PROCEDURES ...................................................................................................... 6
REMOVING SOFTWARE COMPONENTS ................................................................................................. 6
3.
CREATING COVERAGE CHARTS ............................................................................................................ 7
3.1
3.2
3.3
3.4
3.5
3.6
3.7
3.8
3.9
GETTING STARTED ................................................................................................................................... 7
SETTING PROJECTION DETAILS ............................................................................................................. 9
ADDING RANGE CONTOURS ................................................................................................................... 9
ADDING A WORKSITE ............................................................................................................................... 9
DISPLAYING SATELLITE FOOTPRINTS ................................................................................................... 9
DGPS STATION SELECTION .................................................................................................................. 10
CONTROLLING COVERAGE CHART APPEARANCE ............................................................................ 10
PRODUCING A GLOBAL COVERAGE CHART ....................................................................................... 10
CONFIGURING THE OUTPUT FORMAT ................................................................................................. 11
4.
REFERENCE GUIDE ................................................................................................................................ 12
4.1
4.2
4.3
4.4
4.5
4.6
4.7
VERICHART DATA PROCESSING .......................................................................................................... 12
MENU COMMANDS .................................................................................................................................. 13
CHART CONFIGURATION PARAMETERS ............................................................................................. 15
CHART REPORT FEATURES .................................................................................................................. 18
OPERATIONS ........................................................................................................................................... 20
ERROR MESSAGES ................................................................................................................................ 23
REFERENCE STATION CONFIGURATION FILE .................................................................................... 26
5.
CONTACT INFORMATION ....................................................................................................................... 27
6.
INTERNET LINKS ..................................................................................................................................... 28
6.1
6.2
6.3
WEBSITES ................................................................................................................................................ 28
DOWNLOAD SITES .................................................................................................................................. 28
DOCUMENT VIEWERS ............................................................................................................................ 28
7.
GLOSSARY ............................................................................................................................................... 29
Rev No:
Date:
D
12.08.2014
Page 2
VeriChart Software User Manual
Procedure Title:
File Ref.:
1.
VeriChart Software User Manual
AB-V-MA-00578
INTRODUCTION
VERIPOS VeriChart for Windows is a DGPS coverage chart report generator.
VeriChart produces high quality reports for the VERIPOS network of DGPS reference stations.
1.1
SOFTWARE VERSION
The information in this manual pertains to VeriChart version 1.6X (versions 1.60 through 1.69).
1.2
DISCLAIMER
Under no circumstances shall VERIPOS be liable for incidental or consequential damages or
related expenses resulting from the use of the VeriChart software application, or arising from the
information contained in this manual. The user must account for any consequences resulting
from malfunction of the software.
The information in this manual is believed to be accurate at time of writing. However, as part of
VERIPOS’ commitment to continually improve its products, services and specifications, VERIPOS
reserves the right to make changes at any time without notice.
VeriChart comes with no warranty and no support.
Rev No:
Date:
D
12.08.2014
Page 3
VeriChart Software User Manual
Procedure Title:
File Ref.:
2.
INSTALLATION
2.1
BACKGROUND
VeriChart Software User Manual
AB-V-MA-00578
VeriChart requires third party software components to operate successfully. These are
1. The Generic Mapping Tools (GMT)
2. The netCDF library for Windows (required by GMT)
3. GNU Ghostscript
GMT is a collection of tools that allow users to manipulate geographical oriented data sets and
®
produce PostScript illustrations. GMT supports 25 common map projections and comes with
support data such as coastlines, rivers, and political boundaries.
NetCDF (network Common Data Form) is an interface for array-oriented data access and a library that
provides an implementation of the interface.
®
®
GNU Ghostscript is an interpreter for the Adobe PostScript language enabling Postscript
documents to be converted to many different formats.
®
Section 4.1 provides additional information regarding the relationship between VeriChart and GMT
/ Ghostscript.
Further information on third party components can be obtained via the links given in Section 5.
Distributions of GMT, the netCDF library and GNU Ghostscript are included on the VeriChart
installation.
2.2
2.3
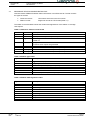
MINIMUM COMPUTER SYSTEM REQUIREMENTS
Operating system
Windows 95 OSR 2.5
Windows NT 4.0 + Service Pack 6
Windows 2000 + Service Pack 2
Windows XP
Windows 7
Free disk space
200 Mb
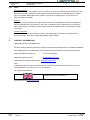
SOFTWARE VERSION
VeriChart has been tested with the software components listed in Section 2.1 at the versions
given below.
Component
Version
GMT
GNU Ghostscript
NetCDF library
3.4.2
7.05
3.4.0
Operation of VeriChart with software components at versions other than these has not been
tested and cannot be guaranteed.
Rev No:
Date:
D
12.08.2014
Page 4
VeriChart Software User Manual
Procedure Title:
File Ref.:
2.4
VeriChart Software User Manual
AB-V-MA-00578
LICENSING
Each software component is distributed and installed under the terms of its own license
agreement. The user must consent to the terms of the license prior to installation of the software
component.
2.5
LIABILITY
VERIPOS disclaims any responsibility for or liability related to any of the software
components listed in Section 2.1.
Rev No:
Date:
D
12.08.2014
Page 5
VeriChart Software User Manual
Procedure Title:
File Ref.:
VeriChart Software User Manual
AB-V-MA-00578
2.6
SOFTWARE INSTALLATION
2.6.1
Installation from CD
A bundled distribution of VeriChart incorporating third party components is included on the VeriChart
CD as a self-installing setup file VeriChart_setup_XXX.exe where XXX is the version number of the
application.
To install VeriChart simply run VeriChart_setup_XXX.exe and follow the on-screen
instructions.
2.7
POST INSTALLATION PROCEDURES
Once the installation process is complete VeriChart needs to be configured before it can be used to
produce reports. Post-installation configuration covers set-up of system paths and (optionally) user
paths.
2.7.1
Starting VeriChart for the first time
A shortcut to VeriChart is set up as part of the installation process in the Start Menu under Programs
→ VERIPOS.
Select the shortcut to start VeriChart.
2.7.2
Configure system paths
Configuration of system paths is mandatory. The installation process provides a default system path
configuration and this should not require alteration. Refer to section 4.5.1 for details.
2.7.3
Configure user paths
Configuration of user paths is optional and may be omitted. The installation process provides a
default user path configuration. Refer to Section 4.5.2 for details.
2.7.4
Produce a sample coverage chart
When system and user paths are configured VeriChart is ready for use and can be tested by
generating a report from one of the sample configurations provided. A step by step guide to
producing a sample coverage chart is given in Section 3.1.
2.8
REMOVING SOFTWARE COMPONENTS
The VeriChart application and associated components can be uninstalled using the standard
Windows Control Panel Add/Remove Programs mechanism.
Rev No:
Date:
D
12.08.2014
Page 6
VeriChart Software User Manual
Procedure Title:
File Ref.:
VeriChart Software User Manual
AB-V-MA-00578
3.
CREATING COVERAGE CHARTS
3.1
GETTING STARTED
The easiest way to become familiar with producing VeriChart coverage chart reports is to use the
sample configurations supplied with VeriChart. These configurations produce coverage charts of
the main VERIPOS operating regions (Table 3-1).
Table 3-1 Sample VeriChart Configuration Files
Configuration file
Coverage chart
NWECS.vcc
Africa.vcc
Canada.vcc
Caspian.vcc
South America.vcc
North America.vcc
North Sea and Eastern Atlantic
West & South West Africa
Nova Scotia & Newfoundland
Caspian Sea
Brazil & Venezuela
Gulf of Mexico
The sample configuration files are located in the Config directory of the VeriChart
installation.
Note
®
The sample configurations produce Adobe Portable Document Format (PDF) format report files.
3.1.1
Load a sample configuration
To load, for example, the sample Caspian Sea configuration (Caspian.vcc) into VeriChart
1. From the menu, select File - Open.
2. Select the Caspian.vcc file using the File Open Dialog.
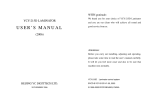
3.1.2
Generate the coverage chart report
To produce a report from the Caspian configuration loaded in 3.1.1
1. From the menu, select Tools - Generate report.
2. Wait for the report to be produced (the mouse cursor changes to an hourglass until the
report is complete).
3. If the View report option [4.2.3.1] is selected then the report will be automatically
displayed in a PDF document viewer.
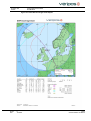
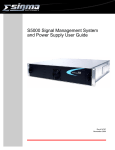
Report files are by default written to the Reports directory of the VeriChart installation. The report
produced should be similar to that shown in Figure 3-1.
Rev No:
Date:
D
12.08.2014
Page 7
VeriChart Software User Manual
Procedure Title:
File Ref.:
VeriChart Software User Manual
AB-V-MA-00578
Figure 3-1 North Sea Coverage Chart Report
Rev No:
Date:
D
12.08.2014
Page 8
VeriChart Software User Manual
Procedure Title:
File Ref.:
3.2
VeriChart Software User Manual
AB-V-MA-00578
SETTING PROJECTION DETAILS
The bounding region of a coverage chart map (the region of the globe displayed on the chart) is
controlled by the selection of map projection and scale.
VeriChart supports several map projections (Table 3-2). Table
3-2 VeriChart map projections
Projection
Type
Mercator
Miller
Lambert conformal conic
Azimuthal equidistant
Stereographic
Cylindrical
Cylindrical
Conic
Azimuthal
Azimuthal
Projections are selected from the Projection pull-down list box. The map
scale is selected from the Scale pull-down list box.
The central meridian (Longitude) and parallel (Latitude) together with the projection and scale
define the region displayed in the coverage chart.
If a Lambert projection is selected then entry of two standard parallels is also required. The standard
parallels are usually chosen at 1/6 and 5/6 of the latitude range of the map.
Choosing a projection is mostly a matter of personal preference. Some projections look better
than others do at certain scales and global regions. As a general rule large-scale maps of
equatorial & mid-latitude regions appear better using a cylindrical projection, regions closer to the
poles a conic or azimuthal projection.
3.3
ADDING RANGE CONTOURS
A DGPS range contour is added to the coverage chart by entering a range value in one of the four
Contours controls.
Entering a value of zero disables display of the contour.
Up to four contours can be displayed on the coverage chart.
3.4
ADDING A WORKSITE
To add a worksite location to the coverage chart select the Display worksite checkbox and supply a
name and location (in degrees) for the worksite in the Name and Location edit controls.
A ring of constant range can be displayed centred on the worksite by selecting the Range ring
checkbox and entering a value for the ring radius.
If a range ring has been selected and the Spotlight checkbox is also selected then the area within the
range ring will be highlighted on the chart.
3.5
DISPLAYING SATELLITE FOOTPRINTS
The circles of visibility of the VERIPOS-I service downlink satellites are displayed on the coverage
chart if the Inmarsat footprints checkbox is selected.
All points within each circle have an elevation angle to the respective satellite greater than or equal
to the Emask setting.
Rev No:
Date:
D
12.08.2014
Page 9
VeriChart Software User Manual
Procedure Title:
File Ref.:
3.6
VeriChart Software User Manual
AB-V-MA-00578
DGPS STATION SELECTION
The inclusion of DGPS reference stations in a coverage chart report depends on the bounding
region of the chart [3.2] and the station selection options.
VeriChart has three main reference station categories which can be included in the report in any
combination.
Inmarsat stations
HF stations
Planned stations
Stations forming the VERIPOS-I network
Stations forming the VERIPOS-HF network
Locations under consideration for future network expansion
Reference stations are included in the coverage chart by selecting the Inmarsat, HF or Planned
Station options checkboxes.
3.7
CONTROLLING COVERAGE CHART APPEARANCE
The appearance of the coverage chart can be modified by these configuration options.
1. Grid interval
Sets the latitude and longitude gridline intervals.
2. Station labels
Stations displayed on the coverage map can be labelled by their location, RTCM ID or have
no label.
3. Label border
This option places a border around each station label, which improves clarity in some
situations.
4. List order
The reference station list [4.4.4] can be sorted by RTCM ID, station location (name) or by
the range to the worksite (if selected).
3.8
PRODUCING A GLOBAL COVERAGE CHART
The global coverage chart option produces a report where the bounding region of the coverage
chart map is global.
The report contains no station list [4.4.4] or worksite information [4.4.5]. To create
a global report select the Global coverage chart checkbox.
The projection parameters for a global report are fixed other than the choice of a central meridian.
All other chart options are available for selection.
Rev No:
Date:
D
12.08.2014
Page 10
VeriChart Software User Manual
Procedure Title:
File Ref.:
3.9
VeriChart Software User Manual
AB-V-MA-00578
CONFIGURING THE OUTPUT FORMAT
VeriChart supports a number of document formats
®
®
Adobe PostScript (PS)
®
Adobe Portable Document Format (PDF)
JPEG file format (JPG)
Portable Network Graphics (PNG)
Tagged Image File Format (TIF)
Windows bitmap (BMP)
The document format is selected by from the Format pull-down list box.
The resolution of the report file in dots per inch (dpi) is set by the value in the Resolution control.
Resolutions up to 600 dpi are supported.
If JPEG output is selected then a JPEG Quality factor can be entered in the Quality control.
A JPEG quality factor of 100 produces the best quality output (but with the least
compression).
Finally the orientation of the document (portrait or landscape) is selected using the
Orientation radio buttons.
®
Note that the native format of coverage chart documents is PostScript and that the content is mostly
®
®
vector data. Either PostScript or Adobe PDF is the most suitable format for the output document.
The BMP or TIFF raster formats are uncompressed and so the size of the document may be very
large, up to 25Mb using a high resolution.
The PNG and JPEG raster formats use compression and will produce a reasonably sized document
even at high resolution The PNG format provides better image quality but its use is not widespread.
Links to some downloadable document viewers are given in Section 5.3.
Rev No:
Date:
D
12.08.2014
Page 11
VeriChart Software User Manual
Procedure Title:
File Ref.:
VeriChart Software User Manual
AB-V-MA-00578
4.
REFERENCE GUIDE
4.1
VERICHART DATA PROCESSING
This section describes the process of generating a coverage chart report and the
relationship between VeriChart and third party software components.
VeriChart compiles a coverage chart from three data sources
1. A user configuration file (vcc document)
2. A station configuration file
3. DGPS range contour files
Information contained in the user configuration file controls the layout and content of the report. The
station configuration file holds information on the VERIPOS DGPS network and the range contour files
are the source of range contours in the coverage chart itself.
When a report is generated VeriChart produces a script of GMT commands, which is then executed
®
®
to produce an intermediate report in Adobe PostScript format.
®
If the requested output format is something other than PostScript then the intermediate report is
processed by the GNU Ghostscript interpreter to produce a final report in the desired format.
Rev No:
Date:
D
12.08.2014
Page 12
VeriChart Software User Manual
Procedure Title:
File Ref.:
4.2
VeriChart Software User Manual
AB-V-MA-00578
MENU COMMANDS
This section describes the commands available using the VeriChart menu. Some
commands can also be accessed using the toolbar or keyboard shortcuts.
4.2.1
File menu
4.2.1.1 New
Toolbar button
Shortcut key
Ctrl+N
Shortcut key
Ctrl+O
Shortcut key
Ctrl+S
Shortcut key
None
Create a new VeriChart configuration.
4.2.1.2 Open...
Toolbar button
Open an existing VeriChart configuration.
4.2.1.3 Save
Toolbar button
Save the current VeriChart configuration.
4.2.1.4 Save As...
Toolbar button
None
Save the current VeriChart configuration under a different filename.
4.2.1.5 Exit
Toolbar button
None
Shortcut key Alt+F4
Quit VeriChart.
4.2.2
Tools menu
4.2.2.1 Generate report
Toolbar button
Shortcut key
Ctrl+R
Shortcut key
None
Create a coverage chart using the current configuration.
4.2.2.2 Generate contours
Toolbar button
None
Generate range contour files using active station configuration file [4.5.3].
4.2.2.3 Set system paths
Toolbar button
None
Shortcut key
None
Set paths to GMT and Ghostscript applications [4.5.1].
Rev No:
Date:
D
12.08.2014
Page 13
VeriChart Software User Manual
Procedure Title:
File Ref.:
VeriChart Software User Manual
AB-V-MA-00578
4.2.2.4 Set user paths
Toolbar button
None
Shortcut key
None
Set paths to user input and output directories. Set active station configuration file [4.5.2].
4.2.3
Options menu
4.2.3.1 View report
Toolbar button
None
Shortcut key
None
If selected automatically launches document viewer after report is generated.
4.2.4
Help menu
4.2.4.1 User manual
Toolbar button
None
Shortcut key
None
Shortcut key
None
Display the VeriChart user manual.
4.2.4.2 About VeriChart...
Toolbar button
Display program information, version number and copyright.
Rev No:
Date:
D
12.08.2014
Page 14
VeriChart Software User Manual
Procedure Title:
File Ref.:
4.3
VeriChart Software User Manual
AB-V-MA-00578
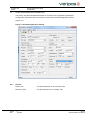
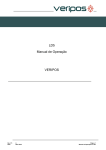
CHART CONFIGURATION PARAMETERS
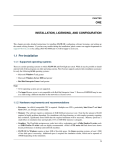
This section provides a detailed description of coverage chart configuration parameters.
Configuration parameters are set using the controls in the VeriChart application window
(Figure 4-1).
Figure 4-1 VeriChart application window
4.3.1
Rev No:
Date:
General
Report Title
The title text printed on the coverage chart
Reference date
The date printed on the coverage chart
D
12.08.2014
Page 15
VeriChart Software User Manual
Procedure Title:
File Ref.:
4.3.2
4.3.3
4.3.4
Rev No:
Date:
VeriChart Software User Manual
AB-V-MA-00578
Projection details
Global coverage chart
Produces a global coverage chart if selected. All other items in this
section are then disabled with the exception of the central
meridian selection (Centre Lon).
Projection
Select from the pull down list of available map projections
Scale
Select from the pull down list of available chart scales
Centre (Lat / Lon)
The geodetic centre of the coverage chart. Input is in decimal
degrees. The latitude range is constrained to +/- 80 degrees.
Parallels (Lat / Lon)
The standard parallels P1 and P2 for a Lambert projection. Input is
in decimal degrees. The range is constrained to +/- 85 degrees. Both
parallels must be on the same hemisphere (North or South).
Chart options
Grid interval
The interval in decimal degrees of displayed lines of latitude and
longitude. Values between 1 and 30 degrees are accepted.
Contours
Specify up to four values for range contours from reference
stations. Contour ranges specified in kilometres. Values up to
3000 km are accepted. Enter 0 to omit contours.
Station labels
Choose how to print station labels on the coverage chart. Select
one of Name (Reference station name), ID (Station RTCM ID) or
None.
Label border
Select to print a border around each station label. This can
improve the clarity on some coverage charts.
Inmarsat footprints
Select to include Inmarsat satellite footprints on the coverage
chart.
Emask
Sets the elevation mask, in degrees, of Inmarsat footprints.
Station options
Inmarsat
Select to include VERIPOS-I stations in the coverage chart.
Planned
Select to include future / planned VERIPOS stations in the
coverage chart.
List order
Affects the ordering of the list of available reference stations
displayed on the coverage chart. Choose from :
D
12.08.2014
ID
Sort by RTCM ID in ascending order
Name
Sort by station name in ascending order
Range
Sort by station name in ascending order [4.3.5]
Page 16
VeriChart Software User Manual
Procedure Title:
File Ref.:
4.3.5
4.3.6
Rev No:
Date:
VeriChart Software User Manual
AB-V-MA-00578
Worksite
Display worksite
Select to display a worksite location on the coverage chart. If not
selected then all other items in this section are disabled.
Name
The name of the worksite as it appears on the chart.
Location
The worksite location, in decimal degrees. The worksite latitude
range is constrained to +/- 85 degrees.
Label alignment
Select from the pull down list of available alignment options.
Modifying the label placement can improve the appearance of a
coverage chart.
Range ring
Select to display a ring of constant range around the worksite.
(Range)
The radius of the worksite range ring in kilometres. Values
between 10 and 3000 km are accepted.
Spotlight
Select to highlight the chart region within the worksite range ring.
Output
Format
Select from the pull down list of available document formats.
Resolution
Resolution of the document in dpi (dots per inch). Values between
72 and 600 dpi are accepted.
Quality
The JPEG quality factor. Applicable only to JPEG documents.
Values between 10 and 100 (best quality) are accepted.
Orientation
Select the orientation of the coverage chart (portrait or landscape).
D
12.08.2014
Page 17
VeriChart Software User Manual
Procedure Title:
File Ref.:
4.4
VeriChart Software User Manual
AB-V-MA-00578
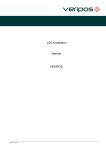
CHART REPORT FEATURES
This section describes the features available on a coverage chart report, illustrated by the sample
report in Figure 4-2.
4.4.1
Report header
The report header displays the title of the report
4.4.2
Coverage map
The coverage map is the main feature of the report. It can display
4.4.3
A high resolution coastline map of the selected region
The location of VERIPOS reference stations
Up to four DGPS range contours. Each contour is a line of constant range to the
nearest reference station in the VERIPOS DGPS network
The worksite location
A ring of constant range from the worksite (which may be highlighted)
Footprints of the VERIPOS-I service downlink satellites with a user selectable elevation mask
Map key
The map key provides a legend for the coverage map symbols. In addition it displays details of
4.4.4
The map projection
The scale of the map
The elevation mask used in the generation of satellite footprints (if selected)
Reference station list
A list of VERIPOS DGPS reference stations located within the bounding region of the chart. Each
entry details
The location of the reference station
The RTCM ID (Address)
The geodetic co-ordinates of the station
The range in kilometres from the station to the worksite (if selected)
A maximum of 18 stations can be displayed on a single report. If the chart region contains more than
18 stations then changing the station list sort order [4.3.4] may be considered to ensure that stations
of interest are included in the list.
Rev No:
Date:
D
12.08.2014
Page 18
VeriChart Software User Manual
Procedure Title:
File Ref.:
4.4.5
VeriChart Software User Manual
AB-V-MA-00578
Worksite information
If a worksite is selected then the following details are provided on the report
4.4.6
The worksite name
The geodetic co-ordinates of the worksite
The radius in kilometres of the worksite range ring (if selected)
Inmarsat downlink details
A list of Inmarsat geostationary satellites that provide current or future VERIPOS-I services. Each
entry contains a coloured symbol matching the satellite footprint shown in the coverage map.
If a worksite is selected the direction (azimuth and elevation) from the worksite to each satellite is
displayed.
4.4.7
Notes
A set of informational notes regarding the VERIPOS DGPS service.
4.4.8
Report footer
The report footer displays
Rev No:
Date:
The reference date of the report
The name and build ID of the station file used to generate the report
The name of the chart configuration file used to generate the report
D
12.08.2014
Page 19
VeriChart Software User Manual
Procedure Title:
File Ref.:
VeriChart Software User Manual
AB-V-MA-00578
4.5
OPERATIONS
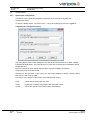
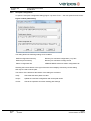
4.5.1
System path configuration
VeriChart access to third party software components is set through the System path
configuration dialog.
To open the dialog (Figure 4-3) select Tools → Set system paths from the menu. Figure 43 System path configuration dialog
The dialog displays the current settings for the paths to the home directories for GMT, netCDF
& Ghostscript applications. The home directory in each case is the directory immediately above
the Bin directory.
Figure 4-3 shows the path settings required after a typical installation of software
components from the VeriChart CD.
Selecting the browse button to the right of the edit control displays a directory browse dialog
that may be used to set the path.
The actions of the buttons at the bottom of the dialog are as follows.
Rev No:
Date:
Verify
Check that the three paths are valid
Accept
Update the VeriChart configuration with these path values
Cancel
Cancel the operation and retain existing path settings
D
12.08.2014
Page 20
VeriChart Software User Manual
Procedure Title:
File Ref.:
4.5.2
VeriChart Software User Manual
AB-V-MA-00578
User path configuration
To open the user path configuration dialog (Figure 4-4) select Tools → Set user paths from the menu.
Figure 4-4 User paths dialog
The dialog allows the following settings to be modified
Default configuration directory
Directory for VeriChart configuration (.vcc) files
Default reports directory
Directory for VeriChart coverage charts
Station configuration file
VERIPOS DGPS reference station configuration file
Selecting the browse button to the right of the edit control displays a directory browse dialog
that may be used to set the path.
The actions of the buttons at the bottom of the dialog are as follows.
Rev No:
Date:
Verify
Check that the three paths are valid
Accept
Update the VeriChart configuration with these path values
Cancel
Cancel the operation and retain existing path settings
D
12.08.2014
Page 21
VeriChart Software User Manual
Procedure Title:
File Ref.:
4.5.3
VeriChart Software User Manual
AB-V-MA-00578
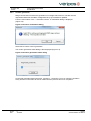
Contour generation
Range contour files are used in the generation of coverage chart contours. The files must be
regenerated whenever the station configuration file [4.7] is modified or updated.
From the menu select Tools → Generate contours. A confirmation dialog is displayed
(Figure 4-5).
Figure 4-5 Contour confirmation dialog
Select OK to confirm contour generation
The contour generation status dialog is then displayed (Figure 4-6).
Figure 4-6 Contour generation status dialog
Contour file generation takes some time, typically 5 - 10 minutes. You may cancel the operation
at any time but contour files will not be created until the process has run to completion.
Rev No:
Date:
D
12.08.2014
Page 22
VeriChart Software User Manual
Procedure Title:
File Ref.:
4.6
VeriChart Software User Manual
AB-V-MA-00578
ERROR MESSAGES
Error messages are displayed in pop-up dialogs when a fault condition arises in program execution.
Most error messages are self-explanatory and resolution is straightforward. Other
specific error messages are given below grouped by program operation.
Given the complexity of Windows systems the suggested resolution of each error can only be a most
probable solution.
4.6.1
System and user path errors
System and user paths are checked prior to contour or report generation. Specific VeriChart, GMT,
netCDF and Ghostscript files are tested to ensure that system and path settings are correct. If any
files are not located then an error is reported.
The general form of the message is given below.
Message
File not found
{Full path of file tested}
Check {Component name} system / user path
Rev No:
Date:
Explanation
A file could not be found using the current system & user path settings
Resolution
Check system and user paths [4.5.1], [4.5.2]
D
12.08.2014
Page 23
VeriChart Software User Manual
Procedure Title:
File Ref.:
4.6.2
VeriChart Software User Manual
AB-V-MA-00578
Contour generation errors
Errors arising from the contour generation operation.
Message
Contouring failed. Failed to load station file
Explanation
The station configuration file could not be found or failed to load
Resolution
Check path to station configuration file [4.5.2]
Message
Contouring failed. Can't create range files
Explanation
Intermediate range data files could not be produced
Resolution
Check there is sufficient free disk space on the VeriChart installation drive.
At least 50 Mb is required.
Message
Contouring failed. No room on disk
Explanation
Intermediate range data files could not be produced
Resolution
Check there is sufficient free disk space on the VeriChart installation drive.
At least 50 Mb is required.
Message
Contouring failed. Installation process failure
Explanation
Timeout on range file installation (60 seconds)
Resolution
Check system paths to GMT and netCDF home directories [4.5.1] Close
all other applications when running contour generator
Message
Contouring failed. Installation process could not be started
Explanation
Windows process could not be created. Probable cause - command processor
cannot be located [command.com (Windows 95) or cmd.exe]
Resolution
Close all other applications when running contour generator
Check that command processor is present in the Windows system
directory.
Rev No:
Date:
D
12.08.2014
Page 24
VeriChart Software User Manual
Procedure Title:
File Ref.:
4.6.3
VeriChart Software User Manual
AB-V-MA-00578
Report generation errors
Errors arising from the report generation operation.
Message
Report is locked or in use. Aborted
Explanation
An attempt was made to overwrite an existing report that is currently in use
by another application.
Resolution
Close the report and try again
Message
Output creation failed
Explanation
Windows process could not be created. Probable cause - command processor
cannot be located [command.com (Windows 95) or cmd.exe]
Resolution
Close all other applications when running contour generator
Check that command processor is present in the Windows system
directory.
Rev No:
Date:
Message
Report file was not created
Explanation
The View report option is selected [4.2.3.1] but the report document
cannot be located after report generation is complete.
Resolution
Check that all user paths are valid [4.5.2]
Message
Failed to launch report viewer. Command failed with error code xx
Explanation
The View report option is selected [4.2.3.1] but a viewer cannot be
located for the selected document format.
Resolution
Check file associations for the document format in Windows Explorer
D
12.08.2014
Page 25
VeriChart Software User Manual
Procedure Title:
File Ref.:
4.7
VeriChart Software User Manual
AB-V-MA-00578
REFERENCE STATION CONFIGURATION FILE
VeriChart retains VERIPOS network station information in an ASCII text file. The file contains
two types of records
Comment records
Lines with a semicolon in the first column
Station records
Single line records in CSV format (Table 4-1)
The station record field data controls the location and appearance of the station in coverage
chart reports.
Table 4-1 Reference station record format
Field
ID
Description
1
2
3
Station
Name
Type
4
Active
5
6
7
8
Alignment
ECEF X
ECEF_Y
ECEF_Z
Reference station RTCM ID
Descriptive name (normally location) for the station
Station type code. See
Table 4-2
[0 | 1]. Active stations have a value of 1 and are considered for
inclusion when reports are generated
Station label alignment code. See Table 4-3
ECEF X co-ordinate of station position (metres)
ECEF Y co-ordinate of station position (metres)
ECEF Z co-ordinate of station position (metres)
Table 4-2 Station type codes
Type code
Description
0
1
2
3
4
5
6
VERIPOS-HF (HF) station
rd
3 party HF station
VERIPOS-I (Inmarsat) single frequency station
Co-located HF & Inmarsat station
Planned reference station
Reserved
VERIPOS-I (Inmarsat) dual frequency station
Table 4-3 Station label alignment codes
Rev No:
Date:
Type code
Description
0
1
2
3
4
5
6
7
8
Bottom left
Bottom centre
Bottom right
Middle left
Middle centre
Middle right
Top left
Top centre
Top right
D
12.08.2014
Page 26
VeriChart Software User Manual
Procedure Title:
File Ref.:
4.7.1
VeriChart Software User Manual
AB-V-MA-00578
Notes
Co-located stations
In cases where two or more stations are co-located (e.g. an HF and Inmarsat station operate from the
same site) a record is included for each station (marked inactive) and an additional record of station
type 3 (co-located) added at the same position. This record is marked active. The purpose is to
improve report presentation.
Build ID
Each time a report is generated an eight-character build ID is calculated for the station configuration
file and displayed in the report footer [4.4.8]. If the configuration file is modified in any way then the
build ID will change. This feature can be used to track the information used to compile the coverage
chart report.
Contour generation
Contour files should be regenerated [4.5.3] after any modification of the station configuration file to
ensure that range contours accurately reflect station location details.
5.
CONTACT INFORMATION
VERIPOS CONTACT INFORMATION
All initial contacts regarding technical or support issues should be addressed to the VERIPOS Helpdesk.
Where appropriate the Helpdesk will refer issues to the regional operations and engineering teams.
VERIPOS Helpdesk Telephone:
+44 (0) 1224 965900
VERIPOS Helpdesk E-mail:
[email protected]
VERIPOS Online Support Site (VOSS): http://help.veripos.com
Note:
If shipping equipment back to VERIPOS, please contact the Helpdesk who will provide the current
shipping address, according to your area of operations.
UK Veripos office address:
Veripos House, 1B Farburn Terrace, Dyce,
Aberdeen. AB21 7DT Scotland UK
For other sites visit www.veripos.com
Rev No:
Date:
D
12.08.2014
Page 27
VeriChart Software User Manual
Procedure Title:
File Ref.:
6.
VeriChart Software User Manual
AB-V-MA-00578
INTERNET LINKS
The links given in this section are correct at the time of writing.
6.1
6.2
WEBSITES
VERIPOS home page
www.veripos.com
GMT home page
http://gmt.soest.hawaii.edu
Ghostscript home page
www.cs.wisc.edu/~ghost
NetCDF home page
www.unidata.ucar.edu/packages/netcdf
DOWNLOAD SITES
GMT 3.4.2
ftp://gmt.soest.hawaii.edu/pub/gmt/
GNU Ghostscript 7.05
ftp://mirror.cs.wisc.edu/pub/mirrors/ghost/gnu/gs705/gs705
w32.exe
NetCDF 3.4.0 WIN32 library
ftp://ftp.unidata.ucar.edu/pub/netcdf/contrib/win32/netcdf
3.4.win32bin.zip
6.3
Rev No:
Date:
DOCUMENT VIEWERS
Adobe Acrobat Reader
www.adobe.com/products/acrobat/readermain.html
GSView PostScript viewer
www.cs.wisc.edu/~ghost/gsview
D
12.08.2014
Page 28
VeriChart Software User Manual
Procedure Title:
File Ref.:
7.
Rev No:
Date:
VeriChart Software User Manual
AB-V-MA-00578
GLOSSARY
DGPS
Differential GPS
Ghostscript
A Postscript language interpreter
GMT
The Generic Mapping Tools
GPS
Global Positioning Systems
NetCDF
Network Common Data Form. An interface for array-orientated data access
RTCM
Shorthand for RTCM SC-104, the recognised standard for the format
transmission of DGPS correction messages
VERIPOS-I
The VERIPOS satellite broadcast DGPS service
VERIPOS-HF
The VERIPOS HF DGPS service
D
12.08.2014
Page 29
VeriChart Software User Manual