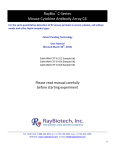
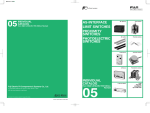
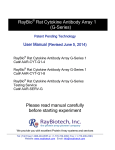
1
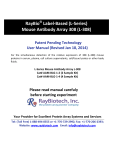
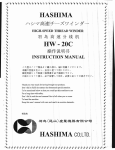
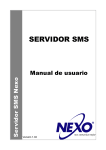
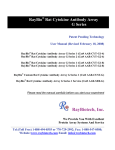
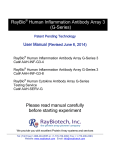
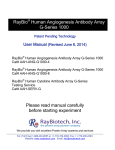
RayBio® Mouse Angiogenesis Antibody Array 1
(G-Series)
Patent Pending Technology
User Manual (Revised July
July 2, 201
2012
012)
RayBio® Mouse Angiogenesis Antibody Array G-Series 1
Cat# AAM-ANG-G1-4
RayBio® Mouse Angiogenesis Antibody Array G-Series 1
Cat# AAM-ANG-G1-8
RayBio® Mouse Angiogenesis Antibody Array
G-Series Testing Service
Cat# AAM-SERV-G
Please read manual carefully
before starting experiment
We provide you with excellent Protein Array systems and services
Tel: (Toll Free) 1-888-494-8555 or +1-770-729-2992; Fax: +1-770-206-2393;
Website: www.raybiotech.com Email: [email protected]
RayBiotech, Inc., the Protein Array Pioneer Company, strives to
research and develop new products to meet demands of the
biomedical community. RayBiotech’s patent-pending technology
allows detection of up to 507 cytokines, chemokines and other
proteins in a single experiment. Our format is simple, sensitive,
reliable, reproducible and cost-effective.
Our product offerings include:
1.
2.
o
o
3.
4.
5.
6.
7.
8.
9.
10.
11.
12.
13.
14.
Protein (antigen) Arrays
®
RayBio Cytokine Antibody Arrays
C Series (Membrane, chemiluminescence detection)
G-Series (Glass chip, fluorescence detection)
Pathway- and disease-focused antibody arrays
o Angiogenesis Antibody Arrays
o Apoptosis Antibody Arrays
o Atherosclerosis Antibody Arrays
o Chemokine Antibody Arrays
o Growth Factor Antibody Arrays
o Inflammation Antibody Arrays
o MMP Antibody Arrays
o Obesity Antibody Arrays
Quantibody® Multiplex ELISA Arrays
®
RayBio L-Series Biotin Label-based Antibody Arrays
®
RayBio E-Series Competition-based Antibody Arrays
®
RayBio Phosphorylation Antibody Arrays
o Receptor Tyrosine Kinases
o EGFR and ErbB family (site-specific phosphorylation)
Over 700 different ELISA kits
EIA (Competitive ELISA) kits
Cell-based Phosphorylation Assay
Over 10,000 different antibodies
Recombinant proteins
Peptide
Recombinant antibodies
Protocol for RayBio® Mouse Angiogenesis
Antibody Array G-Series 1
TABLE OF CONTENTS
I.
Introduction····················································································1
II.
Product Information·································································5
A. Storage Recommendations·······································5
B. RayBio® G-Series Glass Chip Layout ·············6
C. Materials Provided ··························································6
D. Additional Materials Required·································6
E. How It Works ········································································7
III.
Helpful Tips and General Considerations··············7
A. Preparation and Storage of Samples················7
B. Handling Glass Chips····················································9
C. Incubations and Washes············································9
D. Data Extraction Tips·······················································9
IV.
Protocol··························································································10
A. Preparation and Storage of Reagents············10
B. Blocking and Incubations·········································11
C. Fluorescence Detection············································14
V.
Interpretation of Results···················································15
A. Explanation of Control Spots·······························15
B. Typical Results using G-Series Arrays·········16
C. Background Subtraction··········································17
D. Normalization of Array Data··································17
E. Threshold of Significance·········································18
VI.
Antibody Array Map······························································19
VII.
Troubleshooting Guide·······················································20
VIII.
Selected References····························································22
RayBio® Cytokine Antibody Arrays are patent-pending technology.
RayBio® is the trademark of RayBiotech, Inc.
1
RayBio® Mouse Angiogenesis Antibody Array G-Series 1
I. Introduction
New techniques such as cDNA microarrays have enabled us to
analyze global gene expression1-3. However, almost all cell functions
are executed by proteins, which cannot be studied simply through
DNA and RNA techniques. Experimental analysis clearly shows
disparity can exist between the relative expression levels of mRNA
and their corresponding proteins4. Therefore, analysis of the
proteomic profile is critical.
The conventional approach to analyzing multiple protein expression
levels has been to use 2-D SDS-PAGE coupled with mass
spectrometry5,6. However, these methods are slow, expensive, laborintensive and require specialized equipment7. Thus, effective study of
multiple protein expression levels can be complicated, costly and
time-consuming. Moreover, these traditional methods of proteomics
are not sensitive enough to detect most cytokines (typically at pg/ml
concentrations).
Cytokines, broadly defined as secreted cell–cell signaling proteins
distinct from classic hormones or neurotransmitters, play important
roles in inflammation, innate immunity, apoptosis, angiogenesis, cell
growth and differentiation7. They are involved in most diseases,
including cancer, obesity and inflammatory and cardiac diseases.
Simultaneous detection of multiple cytokines undoubtedly provides a
powerful tool to study cytokines. Regulation of cellular processes by
cytokines is a complex, dynamic process, often involving multiple
proteins. Positive and negative feedback loops, pleiotropic effects
and redundant functions, spatial and temporal expression of or
synergistic interactions between multiple cytokines, even regulation
via release of soluble forms of membrane-bound receptors, all are
common mechanisms modulating the effects of cytokine signaling8-14.
As such, unraveling the role of individual cytokines in physiologic or
pathologic processes generally requires consideration and detection
of multiple cytokines rather than of a single cytokine.
2
RayBio® Mouse Angiogenesis Antibody Array G-Series 1
RayBio® G-Series Cytokine Antibody Arrays have several
advantages over detection of cytokines using single-target ELISA:
1. More Data, Less Sample: Antibody arrays provide high-content
screening using about the same sample volume as for ELISA.
2. Global View of Cytokine Expression: Antibody array screening
improves the chances for discovering key factors, disease
mechanisms or biomarkers related to cytokine signaling.
3. Greater Sensitivity: As little as 4 pg/ml of MCP-1 can be detected
using the G-Series array format. In contrast, our similar MCP-1
ELISA assay has a sensitivity of 40 pg/ml of MCP-1.
4. Increased Range of Detection: ELISA assays typically detect a
concentration range of 100- to 1000-fold, however, RayBiotech
arrays can detect IL-2 at concentrations of 25 to 250,000 pg/ml, a
range of 10,000-fold.
5. Better Precision: As determined by densitometry, the inter-array
Coefficient of Variation (CV) of spot signal intensities is 5-10%,
comparing favorably with ELISA testing (CV = 10-15%).
The RayBio® G-Series Cytokine Antibody Array is a glass chip that is
a highly sensitive approach to simultaneously detect multiple
cytokine expression levels from diverse sample types. The
experimental procedure is simple and can be performed in any
laboratory. The signals from G-Series arrays are detected using a
laser scanner.
Larger, multi-array G-Series Cytokine Antibody Array Kits can detect
hundreds of cytokines in a single experiment. For example, the
Mouse G1000 arrays can detect up to 96 cytokines, and the Mouse
G2000 can detect up to 144 cytokines.
RayBiotech, The Protein Array Pioneer Company, introduced the first
protein arrays to the market in 2001 and continues to lead in the
development of innovative protein array technologies. For a list of
publications demonstrating the usefulness of this easy-to-use array
format, see Section VIII.
3
RayBio® Mouse Angiogenesis Antibody Array G-Series 1
1. Tang X, Marciano DL, Leeman SE, Amar S. LPS induces the interaction
of a transcription factor, LPS-induced TNF-a factor, and STAT6(B) with
effects on multiple cytokines. PNAS. 2005;102(14): 5132-5137.
2. Xu Y, Kulkosky J, Acheampong E, et al.. HIV-1-mediated apoptosis of
neuronal cells: Proximal molecular mechanisms of HIV-1-induced
encephalopathy. PNAS. 2004;101(18): 7070-7075.
3. El-Hage N, Gurwell JA, Singh IN, et. al. Synergistic increases in
intracellular Ca(2+), and the release of MCP-1, RANTES, and IL-6 by
astrocytes treated with opiates and HIV-1 Tat. Glia. 2005;50(2): 91-106.
4. Oh HS, Moharita A, Potian JG, et al. Bone Marrow Stroma Influences
Transforming Growth Factor-β Production in Breast Cancer Cells to
Regulate c-myc Activation of the Preprotachykinin-I Gene in Breast
Cancer Cells. Cancer Res. 2004;64: 6327-6336.
5. Osorio Y, Ghiasi H. Recombinant Herpes Simplex Virus Type 1 (HSV-1)
Codelivering Interleukin-12p35 as a Molecular Adjuvant Enhances the
Protective Immune Response against Ocular HSV-1 Challenge. J Virol.
2005;79(6): 3297–3308.
6. Mullick A, Elias M, Picard S, Bourget L, et al. Dysregulated Inflammatory
Response to Candida albicans in a C5-Deficient Mouse Strain. Infect
Immunity. 2004;72(10): 5868-5876.
7. Maruvada P, Wang W, Wagner PD, Srivastava S. Biomarkers in
molecular medicine: cancer detection and diagnosis. Biotechniques.
2005;38: S9-S15.
8. Bartek J, Hodny Z, Lukas J. Cytokine loops driving senescence. Nature
Cell Biol. 2008;10: 887-889.
9. Minami K, Yanagawa Y, Iwabuchi K, et al. Negative feedback regulation
of T helper type 1 (Th1)/Th2 cytokine balance via dendritic cell and
natural killer T cell interactions. Blood. 2005;106: 1685-1693.
10. Ozaki K, Leonard WJ. Cytokine and Cytokine Receptor Pleiotrophy and
Redundancy. J Biol Chem. 2002;227: 29355-29358.
11. Ragab AA, Nalepka JL, Bi Y, Greenfield EM. Cytokines synergistically
induce osteoclast differentiation: support by immortalized or normal
calvarial cells. Am J Physiol Cell Physiol. 2002;283(3): C679-C687.
12. Devalaraja MN, Richmond A. Multiple chemotactic factors: fine control or
redundancy. Trends Pharmacol Sci. 1999;20(4): 151-156.
13. Heaney ML, Golde DE. Soluble Cytokine Receptors. Blood. 1996;87(3):
847-857.
4
RayBio® Mouse Angiogenesis Antibody Array G-Series 1
II. Product Information
A. Storage Recommendations:
For best results, we recommend storing the entire kit at –20°C or
–80°C upon arrival and using the kit within 6 months of receipt.
RayBiotech warranties this product for 6 months if stored in this
manner.
Once thawed, store glass chips and 1X Blocking Buffer at
–20°C or –80°C and all other component at 4°C. After thawing, the
entire kit should be used within 3 months. RayBio® Antibody Array
kits are robust and will retain full activity even if accidentally stored
at room temperature (RT) for up to 24 hours.
B. RayBio® G-Series Glass Chip Layout
Antibody
Array
Antibody
Array
Blank
Blank
Barcode
Barcode
4 arrays in one glass chip
8 arrays in one glass chip
5
RayBio® Mouse Angiogenesis Antibody Array G-Series 1
B. Materials Provided
AAM
AAM
AAMAAMANGANG--G1ANG-G1- ANG
4
8
Item
Description
AAM-ANG-G1
RayBio® Mouse Angiogenesis
G1 Microarray Glass Chip*
0103002ANG-MG1
Biotin-Conjugated Anti-Cytokines
1 ea
2 ea
0103004-H
1,500X HiLyte Plus™ 532
Streptavidin-Fluor†
1 ea
1 ea
0103004-B
1X Blocking Buffer
10 ml
20 ml
0103004-W‡
20X Wash Buffer I ‡
30 ml
30 ml
0103004-W‡
20X Wash Buffer II ‡
30 ml
30 ml
0103004-L
2X Cell Lysis Buffer (optional)
10 ml
10 ml
1 chip with 1 chip with
4 Sub8 Subarrays*
arrays*
Other Kit Components:
Manual, Adhesive Plastic Strips, 30 ml Centrifuge Tube
* Kit contains 1 pre-assembled glass chip with either 4 or 8 printed
sub-arrays per chip (in sealed plastic envelope)
sub--arrays/chip may be
[NOTE: In some cases, 2 chips x 4 sub
sub--arrays]
substituted in kits containing 8 sub
† This fluor is patent-pending technology from Anaspec, Inc.
‡ Wash Buffers and Detection Buffers are sold as sets
C. Additional Materials Required
•
•
•
•
•
Small plastic boxes or containers
Pipettors, pipette tips and other common lab consumables
Orbital shaker or oscillating rocker
Aluminum foil
Gene microarray scanner or similar laser fluorescence
scanner (see pages 9 & 15)
6
RayBio® Mouse Angiogenesis Antibody Array G-Series 1
D. How It Works
Samples
Array support
Incubation of Sample
with arrayed antibody
supports
1-2 hrs
Cocktail of
Biotin-Ab
Incubation with
Biotinylated Ab
1-2 hrs
Labeledstreptavidin
Incubation with
labeled-Streptavidin
1 hrs
Detection of
signals
Data analysis
and graph
III. Helpful Tips and General Considerations
A. Preparation and Storage of Samples
1. General Considerations:
• Freeze samples as soon as possible after collection.
• Avoid multiple freeze-thaw cycles. If possible, sub-aliquot
your samples prior to initial storage.
• Spin samples hard (5-10 minutes at 10K to 15K RPM)
immediately prior to incubation of samples with array.
• Optimal sample concentrations may need to be determined
empirically based on the signal intensities of spots and
background signals obtained.
7
RayBio® Mouse Angiogenesis Antibody Array G-Series 1
Most samples will not need to be concentrated. If concentration
is required, we recommend using a spin-column concentrator
with a chilled centrifuge.
•
2. Recommended Sample Volumes and Dilution Factors
made
NOTE: All sample dilutions should be m
ade using 1X Blocking
Buffer. For all sample types, final sample volume = 50µll per
50-100 µ
sub--array
sub
Cell Cultured Media:
Media Neat (no dilution needed)
Serum
Serum & Plasma:
Plasma 5-fold to 10-fold dilution
Most other Body Fluids:
Fluids Neat or 2-fold to 5-fold dilution
Cell and Tissue Lysates:
Lysates Minimum 5-fold to 10 fold to equal
concentrations of total protein in each lysate sample.
o You must determine the total protein concentration of each
lysate/homogenate. We recommend using the BCA method
(available from Pierce); it is insensitive to detergents
commonly found in lysis buffers.
o Minimum Recommended Total Lysate Protein Concentration
(prior to sample dilution) = 5 µg/µl
o Minimum Recommended Dilution of Lysates (prior to sample
incubation): 5-fold to 10 fold with 1X Blocking Buffer. Dilute all
lysate samples to the same final concentration of total lysate
protein in 1X Blocking Buffer to 50 µl to 100 µl final volume.
o To start, we recommend using 100-200 µg of total protein in 1
ml of 1X Blocking Buffer (final volume) per sub-array.
o Optimal amounts of total lysate protein may range from 501000 µg per sub-array. Based upon background and spots
intensities, you may increase or decrease the amount of
protein used in subsequent experiments.
• Other Liquid Sample Types:
Types Most often Neat or 2-fold to 5-fold.
However, optimal dilutions should be determined empirically.
•
•
•
•
3. Sample Preparation
For tips on sample preparation, please visit our Website:
http://www.raybiotech.com/Tech-Support/SampleTips.pdf
8
RayBio® Mouse Angiogenesis Antibody Array G-Series 1
B. Handling Glass Chips
• Do not remove glass chip from assembly until Step 16.
• Hold the slides by edges only; do not touch the surface.
• Handle all buffers and slides with powder-free gloves.
• Dry glass chip completely before proceeding to Step 3.
• Handle and dry glass chip in clean environment.
• Avoid breaking glass chip when removing the chamber
assembly.
C. Incubations and Washes
• Cover incubation chamber with adhesive film (included in kit) to
prevent evaporation, particularly during incubation or wash
steps >2 h or with liquid volumes <100 µl per well.
• Perform all incubation and wash steps under gentle rotation or
rocking motion (~0.5 to 1 cycle/s).
• Wash steps in Wash Buffer II and all incubation steps may be
performed overnight at 4°C.
o Overnight sample incubations are the most effective at
increasing sample spot intensities.
• Avoid cross-contamination of samples to neighboring wells
• To remove Wash Buffers and other reagents from chamber
wells, you may invert the Glass Chip Assembly to decant, and
aspirate the remaining liquid.
• In Wash Steps 6, 12 and 15, you may gently flush wells several
times using a wash bottle filled with Wash Buffer I.
D. Scanning and Data Extraction Tips:
For tips on scanning and data extraction, please visit our Website:
http://www.raybiotech.com/Tech-Support/ScanningTips.pdf
For a list of recommended scanners, please visit our Website:
http://www.raybiotech.com/resources.asp.
See also page 18 of this manual.
9
RayBio® Mouse Angiogenesis Antibody Array G-Series 1
IV. Protocol
A. Preparation and Storage of Reagents
NOTE: During this protocol, prepare reagents immediately prior to
use and keep working dilutions of all reagents on ice at all times.
1. Blocking Buffer is supplied at 1X concentration. No dilution is
required.
2. Wash Buffers I and II are supplied at 20X concentration.
a). For each glass chip (4 or 8 sub-arrays/chip), dilute 6 ml of
20X concentrate with deionized H20 to a final volume of 120
ml each of Wash Buffer I & Wash Buffer II.
b). Wash buffer reagents at working dilution (1X) can be stored
at 4°C for up to 1 month. Stock solutions at 20X can be
stored 4°C for up to 3 months.
3. Biotin-conjugated Anti-Cytokines are supplied at high
concentration in a small liquid bead (typically ~2-5 µl).
a). Spin down the tube prior to reconstitution, as the
concentrated liquid bead may have moved to the top of the
tube during handling.
b). Prepare stock reagent by adding 300 µl 1X Blocking Buffer
to Biotin-Conjugated Anti-Cytokines. Mix well.
c). 1X Biotin-Conjugated Anti-Cytokines may be stored for 2-3
days at 4°C.
4.
Streptavidin-Fluor is supplied at 1500x concentration.
a). Mix the tube containing 1500X Streptavidin-Fluor well
before use, as precipitants may form during storage.
b). Add 100 µl of 1X Blocking Buffer to tube containing 1500X
Streptavidin-Fluor. Mix well.
c). Quantitatively transfer all of Streptavidin-Fluor reagent from
the original tube to a larger one, and dilute with 1X Blocking
Buffer to a final volume of 1500 µl (ie, 1.5 ml).
d). Wrap tube containing Streptavidin-Fluor with aluminum foil.
e). This working dilution can be stored for 3-5 days at 4°C.
10
RayBio® Mouse Angiogenesis Antibody Array G-Series 1
B. Blocking and Incubations
Section
NOTE: Please carefully read Sectio
n III of this manual before
proceeding
Prepare
NOTE: P
repare all reagents immediately prior to use as described
proceeding..
above (Section IV.A) and before proceeding
1) Remove the package containing the glass chip assembly from
the freezer. Place unopened package on the benchtop and
allow the glass chip assembly to equilibrate to room
temperature (RT), approx. 15 min. Open package, remove the
glass chip assembly and place in laminar flow hood to dry for
1-2 hours.
NOTE: Be sure glass chip is completely dry before proceeding.
2) If necessary, assemble the glass chip into incubation chamber
and frame as shown on page 14. (Note: if you slide is already
assembled, you can proceed directly to Step 3).
3) Add 100 µl 1 X Blocking Buffer into each well and incubate at
RT for 30 min to block slides.
NOTE: Only add reagents or samples to wells printed with
antibodies (see diagram on page 6)
4) Decant Blocking Buffer; then aspirate remaining liquid from
each well.
NOTE: To aspirate liquid samples or reagents from wells, gently
place the pipette tip only in the corners of the well. Do not scrape
the pipette tip across the surface of the chip.
5) Add 50 to 100 µl of each sample to each sub-array. Cover
the incubation chamber with Adhesive film (included in kit).
Incubate arrays with sample at RT for 2 hours. Dilute
sample using 1X Blocking Buffer if necessary.
11
RayBio® Mouse Angiogenesis Antibody Array G-Series 1
6)
Remove adhesive film, and carefully aspirate samples from subarrays, touching only the corners with your pipette tip.
wells..
NOTE: Try to prevent solution from flowing into neighboring wells
12
RayBio® Mouse Angiogenesis Antibody Array G-Series 1
7) Wash 3 x 2 min with 150 µl 1X Wash Buffer I at RT. Be sure to
completely remove sample and Wash Buffer each time and use
fresh buffer for each wash. Decant final wash solution before
proceeding to next step.
8) Obtain a clean container (eg, pipette tip box or slide staining jar)
and place glass chip assembly into the container. Add enough
1X Wash Buffer I to submerge the entire glass chip with frame
intact (approx. 30-50 ml) and remove all bubbles in wells. Wash
10 min at RT with gentle rocking or shaking.
9) Remove assembled glass chip and invert to decant liquid.
Decant buffer from container and replenish with 1X Wash Buffer
I. Submerge the entire glass chip assembly and wash 10 min at
RT with gentle rocking or shaking.
10) Remove assembled glass chip and invert to decant liquid.
Decant buffer from container and repeat Steps 8 & 9 with Wash
Buffer II.
11) Remove assembled glass chip and invert to decant liquid, then
carefully aspirate wash buffer from wells, touching only the
corners with your pipette tip.
12) Add 70 µl of 1X Biotin-conjugated Anti-Cytokines to each subarray. Cover incubation chamber with Adhesive film (included in
kit). Incubate at RT for 2 hours with gentle rocking or shaking.
13) Carefully aspirate all of the Biotin-conjugated Anti-Cytokine
reagent. Wash as described in Step 7 above, first with Wash
Buffer I then with Wash Buffer II, making sure to completely
remove buffer between washes and after final wash.
14) Add 70 µl of 1X Streptavidin-Fluor to each sub-array. Cover the
incubation chamber with Adhesive film (included in kit), then
cover entire assembly with aluminum foil to avoid exposure to
light or incubate in dark room. Incubate at RT for 2 hours with
gentle rocking or shaking.
13
RayBio® Mouse Angiogenesis Antibody Array G-Series 1
15) Remove aluminum foil and adhesive film. Carefully aspirate the
Streptavidin-Fluor reagent. Wash as described in Step 7 above,
first with Wash Buffer I then with Wash Buffer II, making sure to
completely remove buffer between washes and after final wash.
16) Remove the glass chip from the frame assembly. Place the
whole chip in 30 ml centrifuge tube provided, or slide staining jar.
Add enough Wash Buffer I to cover the whole slide (about 20 ml)
and gently rock or shake at RT for 10 min.
17) Decant buffer and repeat wash as described in Step 16 (1 x 10
min with Wash Buffer I). Decant buffer, remove the glass chip
from the tube, then gently rinse the slide with de-ionized H2O
using a plastic wash bottle.
18) Remove excess liquid from 30 ml centrifuge tube (provided in kit)
and place glass chip into the tube. Centrifuge at 1,000 rpm for 3
minutes to remove water droplets.
C. Obtaining Fluorescent Signal Intensities:
19) Remove slide from tube and allow glass chip to dry in a laminar
flow hood for at least 20 minutes. Place chip under an aluminum
foil tent to protect it from light. Make sure the slides are
absolutely dry before scanning or storage.
20) You may proceed immediately to scanning (Step 21), or you may
store the slide at -20 °C in the centrifuge tube provided or at RT
and to scan at a later time.
Unlike
Plus™
™ Fluor 532 used in
Note: U
nlike most Cy3 fluors, the HiLyte Plus
stable
this kit is very st
able at RT and resistant to photobleaching on
chips.. However, please protect glass chips from
completed glass chips
RT..
strong light and temperatures above RT
14
RayBio® Mouse Angiogenesis Antibody Array G-Series 1
21) Scan the glass chip with a laser scanner (such as Innopsys’
InnoScan®) using cy3 or “green” channel (excitation frequency =
532 nm). For tips on scanning, visit our Website:
http://www.raybiotech.com/Tech-Support/ScanningTips.pdf
NOTE: If you do not have a laser scanner, for a nominal fee you
can send your slide to us for scanning and data extraction, and we
will return the results to you. Also, using alternate protocols,
RayBio® G-Series arrays are compatible with LiLi-Cor’s Odyssey
ioScience’s
scanners.. For more information,
and Gentel BioScience
’s APiX scanners
contact these vendors or RayBiotech.
V. Interpretation of Results:
A. Explanation of Controls Spots
Positive Controls (POS1, POS2, POS3) are equal amounts of
biotinylated IgGs printed directly onto the array. All other
variables being equal, the Positive Control intensities will be
the same for each sub-array This allows for normalization
based upon the relative fluorescence signal responses to a
known control, much as “housekeeping” genes or proteins are
used to normalize results in PCR or Western blots,
respectively.
Negative Control (NEG) spots are a protein-containing buffer
(used to dilute antibodies printed on the array). Their signal
intensities represent non-specific binding of Biotin-conjugated
anti-Cytokines and/or Streptavidin-Fluor. Negative control
signal intensities are usually very close to background signals
in each sub-array.
15
RayBio® Mouse Angiogenesis Antibody Array G-Series 1
B. Typical results from RayBio® G-Series Antibody Arrays
The following figure shows typical results obtained using
RayBio® Antibody Array G-Series Arrays. The images were
captured using a GenePix 4000B scanner.
In this example, sera from several patients were incubated with
Human Cytokine Arrays 6, 7 & 8, (sold together as Human
Cytokine Array G-Series 2000, AAH-CYT-G2000-4 or AAH-CTYG2000-8) and processed using this standard protocol.
The 6 strong signals of the Positive Control spots in the upper-left
corner are useful for proper orientation of the array image.
If scanned using optimal scan settings, 3 distinct Positive Control
signal intensities will be seen: POS1>POS2>POS3. If all of these
signals are of similar intensity, try increasing or decreasing laser
power and/or signal gain settings.
Once you have obtained fluorescence intensity data, you should
subtract the background and normalize to the Positive Control
signals before proceeding to analysis.
16
RayBio® Mouse Angiogenesis Antibody Array G-Series 1
C. Background Subtraction:
Most laser fluorescence scanner software have an option to
automatically measure the local background around each spot.
As with spot signal intensities, we recommend using MEDIAN
background signals. If your resulting fluorescence signal intensity
reports do not include these values (eg, a column labeled as
“MED532-B532”), you may need to subtract the background
manually or change the default settings on your scanner’s data
report menu.
D. Normalization of Array Data:
To normalize signal intensity data, one sub-array is defined as
"reference" to which the other arrays are normalized. This choice
can be arbitrary. For example, in our Analysis Tool Software, the
array represented by data entered in the left-most column each
worksheet is the default “reference array.”
You can calculate the normalized values as follows:
X(Ny) = X(y) * P1/P(y)
Where:
P1 = mean signal intensity of POS spots on reference array
P(y) = mean signal intensity of POS spots on Array "y"
X(y) = mean signal intensity for spot "X" on Array "y"
X(Ny)= normalized signal intensity for spot "X" on Array "y"
The RayBio® Analysis Tool software is available for use with data
obtained using RayBio® G-Series Arrays. You can copy and paste
your signal intensity data (with and without background) into the
Analysis Tool, and it will automatically normalize signal intensities
to the Positive Controls.
To order the Analysis Tool, please contact us at +1-770-729-2992
or [email protected] for more information.
17
RayBio® Mouse Angiogenesis Antibody Array G-Series 1
E. Threshold of significant difference in expression:
After subtracting background signals and normalization to Positive
controls, comparison of signal intensities for antigen-specific
antibody spots between and among array images can be used to
determine relative differences in expression levels of each analyte
(ie, protein detected) between samples or groups.
Any ≥1.5-fold increase or ≤0.65-fold decrease in signal intensity for
a single analyte between samples or groups may be considered a
measurable and significant difference in expression, provided that
both sets of signals are well above background (Mean background
+ 2 standard deviations, accuracy ≈ 95%).
NOTE: In the absence of an external standard curve for each
analyte, there is no means of assessing absolute or relative
concentrations of different analytes in the same sample using
immunoassays.. If you w
wish
immunoassays
ish to obtain quantitative data (ie,
concentrations of the various analytes in your samples), try using
our Quantibody® Multiplex ELISA arrays instead.
Data Extraction Tips:
• Ignore any comet tails
• Define the area for signal capture for all spots as 110-120
micron diameter, using the same area for every spot.
• Use median signal value, not the total or the mean
• Use local background correction (also median value).
• Exclude obvious outlier data in its calculations.
• Scan all slides at same PMT
18
RayBio® Mouse Angiogenesis Antibody Array G-Series 1
VI. RayBio® Mouse
Mouse Angiogenesis Antibody Array G-Series 1 Map:
Map:
Detects 24 Mouse Angiogenic Factors in one experiment
A
B
C
D
E
F
G
H
1
POS1
POS2
POS3
NEG
NEG
CCL11
FASLG
bFGF
2
POS1
POS2
POS3
NEG
NEG
BLC
CD30LG
CCL11
3
CSF3
CSF2
IFN-γ
IGF2
IL1A
IL1B
IL12
p40/p70
IL12 p70
4
CSF3
CSF2
IFN-γ
IGF2
IL1A
IL1B
IL12
p40/p70
IL12 p70
5
IL13
IL6
IL9
LeptIn
MCP1
CSF1
MIG
PF4
6
IL13
IL6
IL9
LeptIn
MCP1
CSF1
MIG
PF4
7
TIMP1
TIMP2
TNF-α
THPO
VEGF-A
NEG
NEG
NEG
8
TIMP1
TIMP2
TNF-α
THPO
VEGF-A
NEG
NEG
NEG
Notes on Array Map:
CD30LG = CD30 Ligand, CCL11 = Eotaxin, CSF3 = G-CSF,
CSF2 = GM-CSF, THPO = Thrombopoietin
19
RayBio® Mouse Angiogenesis Antibody Array G-Series 1
VII. Troubleshooting guide
Problem
Cause
Recommendation
No signal for any
spots, including
Positive Controls
Global detection failure
Adjust scanner settings or reassemble chip into holder,
wash slide 2 x 5 min with 150 µl
Wash Buffer II and repeat
Steps 12-19.
Similar signal
intensities for
POS1/2/3
Improper laser power
and/or PMT setting
Repeat scan using higher
and/or lower laser power or
PMT settings
Incomplete washes
Carefully follow wash protocols,
and/or increase wash times
High background
signals
Sample concentration is Repeat using lower sample
too high
concentration
Fluor and/or AntiCytokines are too
concentrated
Review protocol for dilution of
reagents
Bubbles present on chip Be sure to completely remove
during incubations
all bubbles from chip surface
Uneven
background and/or
missing spots
Randomly
scattered highintensity spots
Evaporation during
incubation steps
Cover chamber assembly
during washes and incubations
Pooling/precipitation of
sample or reagent;
Incomplete washes.
Cover chamber assembly and
use a rocker or shaker during
washes and incubations;
carefully follow wash protocols.
Sample is too
concentrated
Repeat experiment using more
dilute sample
Dust or other
particulates
Dry slides in laminar flow hood
and/or use clean containers
and powder-free gloves.
20
RayBio® Mouse Angiogenesis Antibody Array G-Series 1
Sample is too
dilute
Repeat experiment using
higher sample
concentration
Improper dilution
of Anti-Cytokines
or StreptavidinFluor
Re-assemble chip into holder,
wash 2 x 5 min with 150 µl
Wash Buffer II and repeat
Steps 12-19. Spin down
reagents before diluting and
mix well.
Rescan at higher laser power or
signal gain setting
Weak or no signals
antigen-specific pots
+ Low Background
Repeat using higher sample
concentration and/or incubate with
sample O/N at 4°C
Other Tips
Increase concentration of
and/or length of incubation with
Biotin-conjugated Anti-Cytokine
(+ add’l large volume wash
following Biotin-Ab incubation
Review proper storage
conditions for kit components
21
RayBio® Mouse Angiogenesis Antibody Array G-Series 1
III. Selected References Citing RayBio® Mouse G-Series Arrays
1. Long C, Hosseinkhani MR, Wang Y, Sriramarao P,
Walcheck B. ADAM17 activation in circulating neutrophils
following bacterial challenge impairs their recruitment. J
Leuk Biol. 2012 (published online before print). doi:
10.1189/jlb.0312112
2. Newsom DM, Liggitt HD, O’Rourke K, Zhuang D, Schneider
DA, Harrington RD. Cytokine antibody array analysis in
brain and periphery of scrapie-infected Tg338 mice. Compar
Immunol Microbiol Infect Dis. 2011; 34(5): 387-397.
3. Miyauchi S, Maekawa T, Aoki Y, Miyzawa H, et al. Oral
infection with Porphyomonas gingivalis and systemic
cytokine profile in C57BL/6 KOR-ApoEshl mice. J Periodont
Res. 2012;47: 402-708.
4. Chopy D, Pthlichet J, Lafage M, Mégret F, et al. Ambivalent
role of the innate immune response in Rabies virus
pathogenesis. J Virol. 2011;85(13): 6657-6668.
5. Rajanbabu V, Pan C-Y, Lee S-C, Lin W-J, et al. Tilapia
Hepcidin 2-3 peptide modulates lipopolysaccharide-induced
cytokines and inhibits tumor necrosis factor-α through
cyclooxygenase-2 and phosphodiesterase-4D. J Biol Chem.
2010;285: 30577-30586.
6. Gasparrini M, Rivas D, Elbaz A, Duque G. Differential
expression of cytokines in subcutaneous and marrow fat of
aging C57BL/6J mice. Exper Gerontol. 2009;44(9): 613-618.
7. Matsushima Y, Kikkawa Y, Takada T, Matsuoka K, et al. An
atopic dermatitis-like skin disease with hyper-IgE-emia
develops in mice carrying a spontaneous recessive point
mutation in the Traf3ip2 (Act1/CIKS) gene. J Immunol.
2010;185(4): 2340-2349.
22
RayBio® Mouse Angiogenesis Antibody Array G-Series 1
8. Thevenot P, Nair A, Shen J, Lotfi P, Ko CY, Tang L. The
effect of incorporation of SDF-1α into PLGA scaffolds on
stem cell recruitment and the inflammatory response.
Biomaterials. 2010;31(14): 3997-4008).
9. Jiang X, Zhang D, Shi J, Chen Y, Zhang P, Mei B. Increased
inflammatory response both in brain and in periphery in
presenilin 1 and presenilin 2 conditional knock-out mice. J
Alzheim Dis. 2009;18(3): 515-523.
10. Litinov D, Selvarajan K, Garelnabi M, Brophy L,
Parthasarathy S. Anti-atherosclerotic actions of azaelaic
acid, an end product of linoleic acid peroxidation , in mice.
Atheroscler. 2010;209(2): 449-454.
11. Darsigny M, Babeu J-P, Dupuis A-A, Furth EE, et al. Loss of
Hepatocyte-Nuclear-Factor-4α affects colonic ion transport
and causes chronic inflammation resembling inflammatory
bowel disease in mice. PLoS One. 2009;4(10): e7609.
Doi:10.1341/journal.pone.0007609
12. Haddad G, Belosevic M. Transferrin-derived synthetic
peptide induces highly conserved pro-inflammatory
responses of macrophages. Mol Immunol. 2009;46(4):576586.
13. Shin SC, Lee K-M, Kang YM, Kim K, et al. Alterations of
cytokine profiles in mice exposed to chronic low-dose
ionizing radiation. Biochem Biophys Res Comm. 2010;
397(4): 644-649.
14. Stirling DP, Liu S, Kubes P, Yong VW. Depletion of
Ly6G/Gr-1 leukocytes after spinal cord injury in mice alters
wound healing and worsens neurological outcome. J
Neurosci. 2009;29(3): 753-764.
23
RayBio® Mouse Angiogenesis Antibody Array G-Series 1
Customized RayBio® Cytokine Antibody Arrays. Select
Select your cytokines of interest from the
following list, and we will produce the customized array for you. For more information,
please visit our website, www.raybiotech.com.
www.raybiotech.com.
4-1BB
6Ckine
ACE
Activin A
ALKALK-1
Amphiregulin
ANGPTL3
Axl
B7B7-1 / CD80
BAFF R
basic FGF
BCMA
beta IGIG-H3
BLC
Betacellulin
CardiotrophinCardiotrophin-1
CCL28
CCL6
CD27
CD27 Ligand
CD30
CD30 Ligand
CD36
CD40
CD40 Ligand
CD48
CD6
Chemerin
Chordin
Clusterin
C5a
CRGCRG-2
CTACK
CTLACTLA-4
CXCL16
Cystatin C
DAN / NBL1
Decorin
DeltaDelta-like 4
DkkDkk-1
DPPIV
Dtk
E-Cadherin
EDAR
EGF
Endocan
Endoglin
Eotaxin
EotaxinEotaxin-2
Epigen
Epiregulin
E-Selectin
Fas Ligand
Fc gamma RIIA
Fc gamma RIIB
Fetuin A
FltFlt-3 Ligand
Fractalkine
Fractalkine
GalectinGalectin-1
GalectinGalectin-3
GalectinGalectin-7
Gas 1
Gas 6
G-CSF / CSF3
GITR
GITR Ligand
GMGM-CSF / CSF2
gp130
Granzyme B
GremlinGremlin-2
H60
HAIHAI-1
HGF
HGF R
ICAMICAM-1
IFNIFN-gamma
IFNIFN-gamma R1
IGFBPIGFBP-2
IGFBPIGFBP-3
IGFBPIGFBP-5
IGFBPIGFBP-6
IGFIGF-I
IGFIGF-II
ILIL-1 alpha
ILIL-1 beta
ILIL-1 R4 / ST2
ILIL-10
ILIL-11
ILIL-12 p40
ILIL-12 p70
ILIL-13
ILIL-15
ILIL-17
ILIL-17B
ILIL-17B R
ILIL-17E
ILIL-17F
ILIL-1ra
ILIL-2
ILIL-2 R alpha
ILIL-20
ILIL-21
ILIL-22
ILIL-23p19
ILIL-28A
ILIL-3
ILIL-3 R beta
ILIL-33
ILIL-4
ILIL-5
ILIL-6
ILIL-6 R
ILIL-7
ILIL-7 R alpha
ILIL-9
I-TAC
JAMJAM-A
KC / CXCL1
KremenKremen-1
Leptin (OB)
Leptin R
Limitin
NGAL
LIX
LOXLOX-1
L-Selectin
Lungkine
Lungkine
Lymphotactin
MAdCAMMAdCAM-1
MBL2
Marapsin
MCPCP-1 / CCL2
MCPMCP-5 / CCL12
M-CSF / CSF1
MDC / CCL22
Meteorin
MFGMFG-E8
MIG / CCL9
MIPMIP-1α / CCL3
MIPMIP-1β / CCL4
MIPMIP-1γ / CCL9
MIPMIP-2 / CXCL2
MIPMIP-3α / CCL20
MIPMIP-3β / CCL19
MMPMMP-2
MMPMMP-3
Neprilysin
NOPE
NOV / CCN3
Osteoactivin
Osteopontin
Osteoprotegerin
OX40 Ligand
P-Cadherin
Pentraxin 3
Periostin
PFPF-4 / CXCL4
PLGFPLGF-2
Progranulin
Prolactin
Prolactin
ProPro-MMPMMP-9
Prostasin
P-Selectin
RAGE / AGER
RANTES
Renin
Resistin
SCF / Kit Ligand
SDFSDF-1α
Sonic Hedgehog
TACI
TARC / CCL17
TCATCA-3 / CCL1
TECK / CCL25
Testican 3
TGF beta 1
Thrombopoietin
Thymus CKCK-1
KIMKIM-1 / TIMTIM-1
TIMPTIMP-2
TNF alpha
sTNFRI
sTNFRI
TRAIL
TRANCE
TREMTREM-1
TROY
Tryptase ε
TSLP
TWEAK
TWEAK R
VCAMVCAM-1
VEGFVEGF-A
VEGF R1 / FLT1
VEGF R2 / KDR
VEGF R3 / FLT4
VEGFVEGF-D
24
RayBio® Mouse Angiogenesis Antibody Array G-Series 1
Testing Services:
RayBiotech offers full testing services using any of our Array, ELISA
or EIA products, including customized products.
Just send your samples, and we will send you the results.
Custom Services:
1.
2.
3.
4.
5.
6.
7.
8.
9.
10.
Customized Antibody and Protein Arrays
Customized Phosphorylation Arrays
Peptide synthesis
Peptide arrays
Recombinant protein and antibody production
ELISA
EIA
Assay development
Biostatistical & Bioinformatic Analysis
Peptoid Synthesis & Library Screening
Technology Transfer Program:
Have you developed technologies or reagents of interest to the
scientific and research community? RayBiotech can help you
commercialize your technologies, reagents and your dreams.
25
RayBio® Mouse Angiogenesis Antibody Array G-Series 1
RayBio® Cytokine Antibody Arrays
technology developed by RayBiotech.
are
patent-pending
This product is intended for research only and is not to be used
for clinical diagnosis. Our produces may not be resold, modified
for resale, or used to manufacture commercial products without
written approval by RayBiotech, Inc.
Under no circumstances shall RayBiotech be liable for any
damages arising out of the use of the materials.
Products are guaranteed for 6 months from the date
purchase when handled and stored properly. In the event
any defect in quality or merchantability, RayBiotech’s liability
buyer for any claim relating to products shall be limited
replacement or refund of the purchase price.
of
of
to
to
RayBio® is a registered trademark of RayBiotech, Inc.
HiLyte Plus™is a trademark of Anaspec, Inc.
InnoScan® is a registered trademark of Innopsys, Inc.
This product is for research use only.
©2012 RayBiotech, Inc.
26
RayBio® Mouse Angiogenesis Antibody Array G-Series 1