1
SOFTWARE USER MANUAL
UVS Software
for
UVIKON 900 / XL / XS
UVS SOFTWARE for UVIKON 900 / XS /XL
USER MANUAL
Table of Contents
1.
GENERAL INFORMATION ................................................................ 9
1.1. GENERAL WARNINGS.................................................................................................... 9
1.2. CD CONTENT.................................................................................................................. 9
1.3. INSTALLATION and REGISTRATION ............................................................................. 9
2.
OPERATING INSTRUCTIONS ......................................................... 10
2.1. INTRODUCTION............................................................................................................ 10
2.1.1. System Icons ............................................................................................................ 10
2.2. SET-UP.......................................................................................................................... 12
2.2.1. Starting ..................................................................................................................... 12
2.2.2. Options ..................................................................................................................... 12
2.2.2.1. General options
13
After changing com ports please start UVS again.
2.2.2.2.
2.2.2.3.
2.2.2.4.
2.2.2.5.
Audit Trail
Print Control options
Extras
Projects
14
15
16
17
18
2.2.3. Backup...................................................................................................................... 19
2.2.3.1. Backup
2.2.3.2. Restoring Backup Data
2.2.3.3. Archive
19
19
21
2.2.4. User management .................................................................................................... 23
2.2.4.1. Password
2.2.4.1.1.
2.2.4.1.2.
2.2.4.1.3.
2.2.4.1.4.
2.2.4.1.5.
2.2.4.1.6.
2.2.4.1.7.
2.2.4.1.8.
24
User rights
Adding users
Login rights
Login blocked
Additional Rights
Saving data
Password expired
Password
24
25
25
25
25
25
26
26
2.2.4.2. Groups
2.2.5.
2.2.6.
2.2.7.
2.2.8.
26
Baseline.................................................................................................................... 27
Power on .................................................................................................................. 28
Self test and system software initialisation ................................................................ 28
Exiting the system software ...................................................................................... 29
2.3. OPERATION .................................................................................................................. 29
2.3.1. General guidelines .................................................................................................... 29
UVS Software for
UVIKON 900/XL/XS
Manual Version 2.20, Oct. 2007
Page 2 of 202
UVS SOFTWARE for UVIKON 900 / XS /XL
USER MANUAL
2.3.1.1.
2.3.1.2.
2.3.1.3.
2.3.1.4.
2.3.1.5.
2.3.1.6.
Acquisition-Calculate-Display
Recommended Operating Practise
The Acquisition Window
The Method Window
The Report Window
Quick Search Function and Row Colouring
29
29
30
32
32
33
2.3.2. Starting a measurement............................................................................................ 34
2.3.3. Recalculation ............................................................................................................ 34
2.3.4. Saving data............................................................................................................... 35
2.3.5. Loading existing data files......................................................................................... 35
2.3.6. Data conversion to EXCEL format ............................................................................ 36
2.3.7. Export to Clipboard ................................................................................................... 36
2.3.8. ASCII Export ............................................................................................................. 36
2.3.9. Methods.................................................................................................................... 36
2.3.10. Saving methods ........................................................................................................ 38
2.3.11. Cancel all current activities ....................................................................................... 38
2.3.12. Activate Cursor and Manual Peak Picking ................................................................ 38
2.3.13. Zooming.................................................................................................................... 39
2.3.14. Adding comments to curves...................................................................................... 40
2.4. SYSTEM MODES .......................................................................................................... 41
2.4.1. Fixed Wavelength ..................................................................................................... 41
2.4.1.1. The Acquisition Screen in Fixed Wavelength
2.4.1.1.1.
2.4.1.1.2.
2.4.1.1.3.
2.4.1.1.4.
Statistic
Instrument Control
Run parameters
System Status
42
42
42
44
2.4.1.2. Parameters in Fixed Wavelength Acquisition
2.4.1.3. The Method in Fixed Wavelength
2.4.1.3.1.
2.4.1.3.2.
2.4.1.3.3.
2.4.1.3.4.
2.4.1.3.5.
Acquisition parameters
Common Parameters
Calculation
Concentration
Audit Trail in Fixed Wavelength Method
2.4.1.4. The Report Screen in Fixed Wavelength
2.4.1.4.1.
2.4.1.4.2.
2.4.1.4.3.
2.4.1.4.4.
41
Printing
Importing a report from the database
Filtering the report list
Audit Trail in Fixed Wavelength Report
2.4.1.5. Calculations in Fixed Wavelength
2.4.1.6. Concentration in Fixed Wavelength
44
45
45
46
47
48
48
48
49
49
49
50
50
51
2.4.2. Wavelength Scan...................................................................................................... 51
2.4.2.1. The Acquisition Screen in Wavelength Scan
2.4.2.1.1. Run parameters
2.4.2.1.2. System Status
52
53
2.4.2.2. The Method in Wavelength Scan
UVS Software for
UVIKON 900/XL/XS
51
Manual Version 2.20, Oct. 2007
53
Page 3 of 202
UVS SOFTWARE for UVIKON 900 / XS /XL
USER MANUAL
2.4.2.2.1.
2.4.2.2.2.
2.4.2.2.3.
2.4.2.2.4.
2.4.2.2.5.
2.4.2.2.6.
Acquisition parameters
Common Parameters
Calculation
Curve Parameters in the Wavelength Scan Method
Calculation Parameters in the Wavelength Scan Method
Audit Trail in Wavelength Scan Method
2.4.2.3. The Report Screens in Wavelength Scan
2.4.2.3.1.
2.4.2.3.2.
2.4.2.3.3.
2.4.2.3.4.
2.4.2.3.5.
2.4.2.3.6.
2.4.2.3.7.
2.4.2.4.
2.4.2.5.
2.4.2.6.
2.4.2.7.
2.4.2.8.
54
55
55
55
56
57
57
The “Overview” Report Screen
Printing
Importing a report from the database
Filtering the report list
The “Chart” Report Screen
“Chart” Report Screen Functions
Audit Trail in Wavelength Scan Report
57
58
58
59
59
60
61
Calculations in Wavelength Scan
Peak Detection
Overlay
Joined Reports
Wavelength Scan Measurement Example
61
62
63
65
67
2.4.3. Time Drive ................................................................................................................ 69
2.4.3.1. The Acquisition Screen in Time Drive
2.4.3.1.1. Run parameters
2.4.3.1.2. System Status
69
70
2.4.3.2. The Method in Time Drive
2.4.3.2.1.
2.4.3.2.2.
2.4.3.2.3.
2.4.3.2.4.
2.4.3.2.5.
71
Acquisition parameters
Common Parameters
Calculation
Curve Parameters in the Time Drive Method
Calculation Parameters in the Time Drive Method
2.4.3.3. The Report Screens in Time Drive
2.4.3.3.1.
2.4.3.3.2.
2.4.3.3.3.
2.4.3.3.4.
2.4.3.3.5.
2.4.3.3.6.
69
The “Overview” Report Screen
Printing
Importing a report from the database
Filtering the report list
The “Chart” Report Screen
“Chart” Report Screen Functions
2.4.3.4. Calculations in Time Drive
2.4.3.5. Time Drive Measurement Example
72
72
72
73
73
74
74
74
75
75
76
76
77
78
2.4.4. Auto Rate Assay ....................................................................................................... 81
2.4.4.1. The Acquisition Screen in Autorate Assay
2.4.4.1.1. Run parameters
2.4.4.1.2. System Status
82
83
2.4.4.2. The Method in Autorate Assay
2.4.4.2.1.
2.4.4.2.2.
2.4.4.2.3.
2.4.4.2.4.
2.4.4.2.5.
Acquisition parameters
Common Parameters
Calculation
Wavelength
Curve Parameters in the Auto Rate Assay Method
UVS Software for
UVIKON 900/XL/XS
81
Manual Version 2.20, Oct. 2007
83
84
84
85
85
85
Page 4 of 202
UVS SOFTWARE for UVIKON 900 / XS /XL
USER MANUAL
2.4.4.2.6. Calculation Parameters in the Auto Rate Assay Method
2.4.4.3. The Report Screens in Autorate Assay
2.4.4.3.1.
2.4.4.3.2.
2.4.4.3.3.
2.4.4.3.4.
2.4.4.3.5.
2.4.4.3.6.
The “Overview” Report Screen
Printing
Importing a report from the database
Filtering the report list
The “Chart” Report Screen
“Chart” Report Screen Functions
2.4.4.4. Calculations in Autorate Assay
86
87
87
87
88
88
89
89
90
2.4.5. Wavelength Program ................................................................................................ 92
2.4.5.1. The Acquisition Screen in Wavelength Program
2.4.5.1.1. Run parameters
2.4.5.1.2. System Status
93
94
2.4.5.2. The Method in Wavelength Program
2.4.5.2.1.
2.4.5.2.2.
2.4.5.2.3.
2.4.5.2.4.
2.4.5.2.5.
Acquisition parameters
Common parameters
Wavelength Program calculations
Calculation
Audit Trail in Wavelength Program Method
2.4.5.3. The Report Screen in Wavelength Program
2.4.5.3.1.
2.4.5.3.2.
2.4.5.3.3.
2.4.5.3.4.
92
Printing
Importing a report from the database
Filtering the report list
Audit Trail in Wavelength Program Report
2.4.5.4. Calculations in Wavelength Program
2.4.5.5. Wavelength Program Measurement Example
94
95
95
96
97
97
97
98
98
98
99
99
100
2.5. CALCULATIONS.......................................................................................................... 104
2.5.1. Curve Functions...................................................................................................... 104
2.5.1.1.
2.5.1.2.
2.5.1.3.
2.5.1.4.
2.5.1.5.
Derivative
Show cross-points
Smoothing
Calculation
Peak Detection
105
105
105
106
106
2.5.2. Activity .................................................................................................................... 107
2.5.2.1. Activity Results
111
2.5.3. Concentration Factor .............................................................................................. 111
2.5.4. Wavelength Program functions ............................................................................... 111
2.5.5. Linear Calibration.................................................................................................... 111
2.5.5.1. Creating a Calibration File
2.5.5.2. Using a Calibration Curve
111
115
2.5.6. Quadratic Calibration .............................................................................................. 117
2.6. REPORTING................................................................................................................ 118
2.6.1. Printing ................................................................................................................... 118
2.7. REPORT MANAGER ................................................................................................... 121
UVS Software for
UVIKON 900/XL/XS
Manual Version 2.20, Oct. 2007
Page 5 of 202
UVS SOFTWARE for UVIKON 900 / XS /XL
USER MANUAL
2.7.1. Templates............................................................................................................... 122
2.7.1.1.1. How to print single curves in the applications Scan, Timedrive, Auto Rate Assay
2.7.1.2. Create and select templates and template blocks
2.7.1.3. List of some predefined report templates
125
126
131
2.8. Report design editor ..................................................................................................... 132
2.8.1. Controls .................................................................................................................. 133
2.8.1.1. Key control
2.8.1.2. Mouse control
133
133
2.8.2. Toolbars.................................................................................................................. 134
2.8.2.1.
2.8.2.2.
2.8.2.3.
2.8.2.4.
2.8.3.
2.8.4.
2.8.5.
2.8.6.
2.8.7.
Designer mode bar
“Standard” toolbar
“Text” toolbar
“Frame” toolbar
134
134
135
136
“Align” toolbar ......................................................................................................... 136
Designer options..................................................................................................... 137
Report settings........................................................................................................ 139
Page options........................................................................................................... 141
Creating reports ...................................................................................................... 143
2.8.7.1. Report objects
2.8.7.2. “Hello, World!” report example
143
144
2.8.8. The “Text” object..................................................................................................... 144
2.8.9. HTML-tags in the “Text” object................................................................................ 146
2.8.10. Displaying expressions with the help of the “Text” object ........................................ 147
2.8.11. Bands in Report Designer ....................................................................................... 148
2.8.12. “Picture” object........................................................................................................ 150
2.8.13. Chart object ............................................................................................................ 151
2.8.14. Stringgrid object...................................................................................................... 151
2.8.15. Data splitting ........................................................................................................... 152
2.8.16. Child-bands............................................................................................................. 154
2.8.17. Shifting objects ....................................................................................................... 155
2.8.18. Headers and footers of a data band........................................................................ 156
2.8.19. Report viewing, printing and export......................................................................... 158
2.8.20. Control keys............................................................................................................ 159
2.8.21. Mouse control ......................................................................................................... 160
2.8.22. Report printing ........................................................................................................ 160
2.8.23. Text search in report ............................................................................................... 162
2.8.24. Report Export.......................................................................................................... 163
2.8.25. Export to PDF Format ............................................................................................. 163
2.8.26. Export to RTF Format ............................................................................................. 164
2.8.27. Export to Excel........................................................................................................ 165
2.8.28. Export to XML Format............................................................................................. 166
2.8.29. Export to CSV Format............................................................................................. 167
UVS Software for
UVIKON 900/XL/XS
Manual Version 2.20, Oct. 2007
Page 6 of 202
UVS SOFTWARE for UVIKON 900 / XS /XL
USER MANUAL
2.8.30. Export into HTML Format........................................................................................ 168
2.8.31. Export to Text Format ............................................................................................. 169
2.8.32. Report Design References...................................................................................... 170
2.9. Managing curves .......................................................................................................... 174
2.9.1. Direct Printing of Curves ......................................................................................... 174
2.9.2. Editing and Formatting of Charts............................................................................. 175
2.9.2.1. Changing the scaling (Axis)
2.9.2.1.1. Scales
2.9.2.1.2. Decimal Format
2.9.2.1.3. Title
175
176
176
177
2.9.2.2. Titles
2.9.2.3. Legend
177
177
2.9.2.3.1. Style
178
2.9.3. Audit Trail ............................................................................................................... 178
2.9.3.1. Report Trail
2.9.3.2. Deleted Reports
179
179
2.9.4. Electronic Signature................................................................................................ 179
2.9.4.1. Signing a Report
2.9.4.2. Signature Status Indications
3.
179
182
2.9.4.2.1. Quick Overview
2.9.4.2.2. Detail Overview
2.9.4.2.3. Signature Audit Trail
182
182
183
2.9.4.3. Deleting a Signed Report
183
OPTIONS AND ACCESSORIES .................................................... 184
3.1. AUTOMATIC CELL CHANGER.................................................................................... 184
3.1.1. Installation .............................................................................................................. 184
3.1.2. Cell Changer Mode (only UVSX)............................................................................. 184
3.1.2.1.
3.1.2.2.
3.1.2.3.
3.1.2.4.
6 samples / 1 reference.
6 samples / 6 references.
10 samples / 2 references.
Manual operation (only UVSX)
185
186
187
188
3.1.3. Cell Changer operation in the different system methods ......................................... 188
3.1.3.1.
3.1.3.2.
3.1.3.3.
3.1.3.4.
3.1.3.5.
Auto rate assay
Fixed Wavelength
Wavelength Scan
Time Drive
Wavelength Program
188
188
188
188
188
3.2. Thermosystem / Thermopack ....................................................................................... 190
3.2.1. Installation .............................................................................................................. 190
3.2.1.1. Manual operation
190
3.3. Stirrer (only UVSX)....................................................................................................... 190
3.3.1. Installation .............................................................................................................. 190
UVS Software for
UVIKON 900/XL/XS
Manual Version 2.20, Oct. 2007
Page 7 of 202
UVS SOFTWARE for UVIKON 900 / XS /XL
USER MANUAL
3.4. Sipper........................................................................................................................... 191
3.5. Liquid handler............................................................................................................... 193
3.6. Katalase ....................................................................................................................... 200
UVS Software for
UVIKON 900/XL/XS
Manual Version 2.20, Oct. 2007
Page 8 of 202
UVS SOFTWARE for UVIKON 900 / XS /XL
USER MANUAL
1. GENERAL INFORMATION
The user should be, before using the instrument, have read and understood this operating manual,
particularly the general warnings given below.
1.1. GENERAL WARNINGS
Always disconnect the mains plug before starting any work inside the instrument
Any maintenance operation inside the instrument, including lamp replacement, must be carried
out by a service engineer or an authorized person. The user is normally only permitted access to
the inside of the sample compartment.
Keep the sample compartment clean
Set wavelength to zero during transport to protect the drive mechanism
1.2. CD CONTENT
The CD ROM supplied includes :
UVS Spectroscopy Software
Installation program
UVS User Manual
Software User Manual in pdf format
Adobe Acrobat Reader
Installation programs
UVS Software
Validation Certificate
1.3. INSTALLATION and REGISTRATION
The installation and registration procedures are described in a separate document. For the sake of
completeness the login and setup procedures are also described in this document.
UVS Software for
UVIKON 900/XL/XS
Manual Version 2.20, Oct. 2007
Page 9 of 202
UVS SOFTWARE for UVIKON 900 / XS /XL
USER MANUAL
2. OPERATING INSTRUCTIONS
2.1. INTRODUCTION
This section of the manual describes the various operating possibilities available using the UVIKON.
Please note that in all cases it is necessary to follow the general guidelines laid down in section 2.3
dealing with general operation. Examples give a step-by-step introduction to all system methods and
calculation modes.
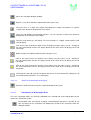
2.1.1. System Icons
The UVS software allows direct selection of many functions via a direct click on the corresponding
icon. Many of these icons have the same function in different methods:
Saves the acquired data in the database. In addition, a report-file will be created in the
corresponding directory for a given method. These report files can be viewed using the
qrv.exe viewer.
Print preview and printing of a report.
Selection mask. You can select a view with date, method, user or name. The appropriate
checkbox must be checked.
Transfers data to Excel. Data will be transferred directly to Excel. Excel must be installed for
this function to be used. Note that this is not a file export and the data can then only be saved
and processed within Excel.
Imports an earlier (extracted) database.
Opens an edit dialogue for reporting functions.
Exports a curve or table to the Windows clipboard for further processing.
Opens the calculation dialogue window or executes a re-calculation.
Opens the audit trail dialogue to allow viewing of the audit trail for a document
Opens the signature dialogue to allow signing of a document
UVS Software for
UVIKON 900/XL/XS
Manual Version 2.20, Oct. 2007
Page 10 of 202
UVS SOFTWARE for UVIKON 900 / XS /XL
USER MANUAL
Shows position of values on X- and Y-axis and allows to manually pick peaks and to add,
edit or delete comments.
UVS Software for
UVIKON 900/XL/XS
Manual Version 2.20, Oct. 2007
Page 11 of 202
UVS SOFTWARE for UVIKON 900 / XS /XL
USER MANUAL
2.2. SET-UP
2.2.1. Starting
Ensure that the Uvikon is connected to the computer and is switched on. Then click on the UVS icon
to start the software. The unit will first initialise, a prompt will appear for user name and password.
User name and password are necessary because of the requirements of CFR Part 11 and permit only
certain actions for users depending on the assigned permissions.
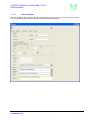
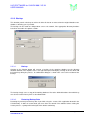
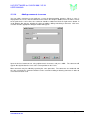
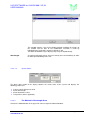
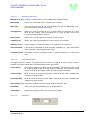
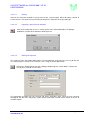
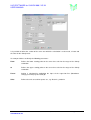
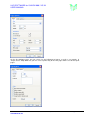
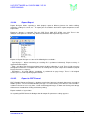
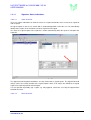
2.2.2. Options
Clicking on Options in the main display opens a dialogue window for entry of various parameters
relating to reporting and archiving functions of the software.
UVS Software for
UVIKON 900/XL/XS
Manual Version 2.20, Oct. 2007
Page 12 of 202
UVS SOFTWARE for UVIKON 900 / XS /XL
USER MANUAL
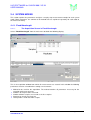
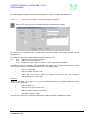
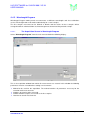
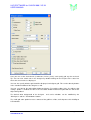
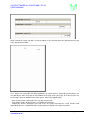
2.2.2.1.
General options
The first window is the “General” window for definition of company name etc. for inclusion on reports
and also for the directory locations for the backup and database functions.
UVS Software for
UVIKON 900/XL/XS
Manual Version 2.20, Oct. 2007
Page 13 of 202
UVS SOFTWARE for UVIKON 900 / XS /XL
USER MANUAL
Instrument
The section contains data regarding the type of instrument, serial number and firmware used. In
addition the accessories are listed and it is possible to enter also manually the serial number of the
accessory.
UV lamp off …
If this box is checked the UV lamp will be switched off automatically at the end of the session.
Com Ports
Define the com ports for uvikon (only UVSX) and thermo system if needed, disable thermo system
checkbox if no thermo system is connected.
After changing com ports please start UVS again.
Options
These options define parameters which are included in the standard reports. Under Logo the location
of a company logo file can be defined which is included in every printed report.
Directory
Here the location paths for the backup directories and database are defined. Definition of a second
backup location is not necessary but recommended.
UVS Software for
UVIKON 900/XL/XS
Manual Version 2.20, Oct. 2007
Page 14 of 202
UVS SOFTWARE for UVIKON 900 / XS /XL
USER MANUAL
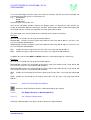
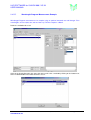
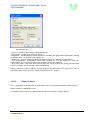
2.2.2.2.
Audit Trail
Error messages
All displayed errors are stored in a text file if this option is checked.
Report revision
If this is checked a report cannot be changed. All modifications are saved in a
copy of the original report and the revision index will be incremented.
Method revision
If this is checked a method cannot be changed. All modifications are saved in
a copy of the original method and the revision index will be incremented.
Normal Trail
A trail is saved with the information user, time and what has changed.
Extended Trail
This is the normal trail with the additional information of old value and new
value.
UVS Software for
UVIKON 900/XL/XS
Manual Version 2.20, Oct. 2007
Page 15 of 202
UVS SOFTWARE for UVIKON 900 / XS /XL
USER MANUAL
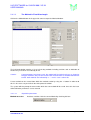
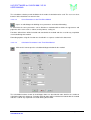
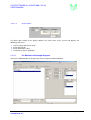
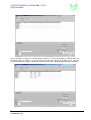
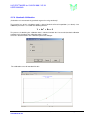
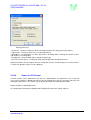
2.2.2.3.
Print Control options
This window is accessed by clicking on the “Controls” tab and allows control of chart print format, chart
colour, decimal points for diplayed absorbance values and audit trail.
Print Chart as Bitmap Normally the chart will be printed with vector graphic, but if your printer driver
don’t print the graphic, try this option.
No Preview
If you check this option the printout will be sent direct to the printer, otherwise
the data is displayed with the preview on the screen.
Chart colour
Colour table for curve colours in the order in which the curves are acquired.
The colours may be selected individually.
Decimals for absorbance
Displayed and rounded values of the absorbance.
UVS Software for
UVIKON 900/XL/XS
Manual Version 2.20, Oct. 2007
Page 16 of 202
UVS SOFTWARE for UVIKON 900 / XS /XL
USER MANUAL
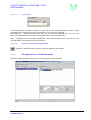
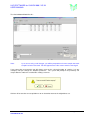
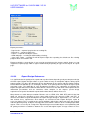
2.2.2.4.
Extras
Autosave
If this option is checked then the data will be saved automatically after acquisition.
Autoprint
Please select for printing immediately after acquisition.
Note : See also the ‘no preview option’
UVS Software for
UVIKON 900/XL/XS
Manual Version 2.20, Oct. 2007
Page 17 of 202
UVS SOFTWARE for UVIKON 900 / XS /XL
USER MANUAL
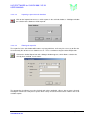
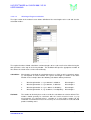
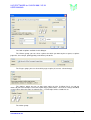
2.2.2.5.
Projects
Define here your projects and link it with the methods (Fix wavelength, wavelength program, scan…)
The name of the project is saved with the report.
UVS Software for
UVIKON 900/XL/XS
Manual Version 2.20, Oct. 2007
Page 18 of 202
UVS SOFTWARE for UVIKON 900 / XS /XL
USER MANUAL
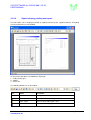
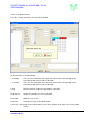
2.2.3. Backup
This function permits a backup or archive of either all data or an extract from the original database to a
database sorted by year is possible.
The backup can be made to 2 independent servers via network, if the appropriate directory locations
have been entered in the options section.
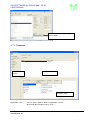
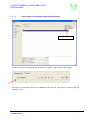
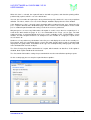
2.2.3.1.
Backup
Clicking on the Backup button will execute a backup of the complete database to the directory
locations defined in the Options menu. The right hand panel will display a listing of all files which will
be backed up during the process. A confirmation dialogue is shown after successful execution of the
backup:
The backup simply saves a copy of the working database files to the defined locations from which they
can also be restored at any time as described below.
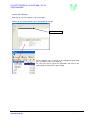
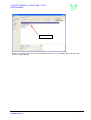
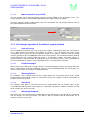
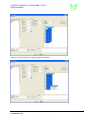
2.2.3.2.
Restoring Backup Data
Restoring of previously backed up data is possible using the “restore UVS” application located in the
UVS directory. In order to restore data you must close the normal UVS software before starting the
restore process, a prompt will remind you of this before continuing:
UVS Software for
UVIKON 900/XL/XS
Manual Version 2.20, Oct. 2007
Page 19 of 202
UVS SOFTWARE for UVIKON 900 / XS /XL
USER MANUAL
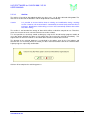
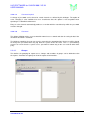
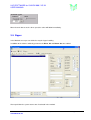
Start the restore UVS program, a prompt will appear to check that the main program has been closed:
Close if necessary and click on OK to obtain the restore dialogue:
Specify the location from which you want to restore the data and click on the Restore button. You will
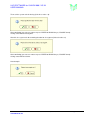
be prompted to enter your name:
This name is required for record purposes and does not correspond with the user names installed for
the main UVS software. Enter a name and click on OK.
The restore process will be confirmed:
UVS Software for
UVIKON 900/XL/XS
Manual Version 2.20, Oct. 2007
Page 20 of 202
UVS SOFTWARE for UVIKON 900 / XS /XL
USER MANUAL
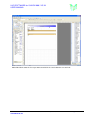
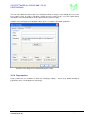
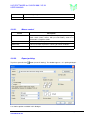
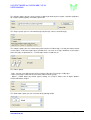
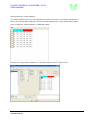
2.2.3.3.
Archive
The archive is based on data obtained within any given year, e.g. all data collected during 2003. The
data is then archived in the database and the original data removed locally.
Caution
It is possible to restore Archive data for viewing and modification during a working
session. However, the restored data is automatically removed locally whenever Exit is
executed. Modifications made during a session are automatically added to the archive
data when exiting.
The archive is not intended for storage of data which will be needed for comparison etc. Therefore,
great care must be taken to select the ideal time to archive all data.
It is also possible to selectively control archiving by using the file based backup program module to
save data before deleting that data in UVS which does not need to be archived immediately. The
original data can then be restored as described above and the archived data removed.
The location of the archived database is pre-defined in the options page in the UVS software and
therefore the user need only define the actual year to be archived and then click on the Archive button.
A prompt appears requesting confirmation:
Click on OK to complete the archiving process.
UVS Software for
UVIKON 900/XL/XS
Manual Version 2.20, Oct. 2007
Page 21 of 202
UVS SOFTWARE for UVIKON 900 / XS /XL
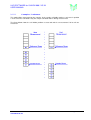
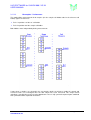
USER MANUAL
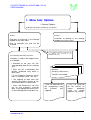
1. Menu item: Options
General Options
Setting the directories for Backup and Archive
Archive
Backup
Execution of Archiving in the Backup
window of the main menu.
Prior to execution the year can be
selected.
Execution of Backup in the Backup
window of the main menu.
Is saved with the Backup if a directory for
the Archive was selected in the
Database directory
Re-importing data from an Archive
Selection is made in the Report menu
of a Method
• Selection of the year lists the
corresponding data for the selected
year
• Data can be re-calculated and
partially combined (only within a
given year)
• In the Report a range of search
filters is available (Date, Text, etc.)
• The copying of data from one
archive into another archive or the
current data base is not possible.
• Users and Powerusers can also
call up and re-process archived
data, if the appropriate permissions
in User Management have been set.
UVS Software for
UVIKON 900/XL/XS
All files are saved in the Database
directory.
(including sub-directories)
Two files are created:
*.bck File extension for
*.zip File extension
the re-importing using
the
„Restore“
tool
supplied
for the manual reimport
procedure
using
an
„Unzip“
program, e.g. Winzip
Manual Version 2.20, Oct. 2007
Page 22 of 202
UVS SOFTWARE for UVIKON 900 / XS /XL
USER MANUAL
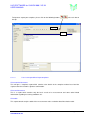
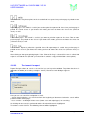
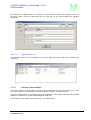
2.2.4. User management
The UV Vision has its own login facility. A login name and a password is required to enter the
program. The assignment of user rights, password administration etc is made by the administrator in a
separate dialogue box accessed by clicking on the Login key in the main display.
UVS Software for
UVIKON 900/XL/XS
Manual Version 2.20, Oct. 2007
Page 23 of 202
UVS SOFTWARE for UVIKON 900 / XS /XL
USER MANUAL
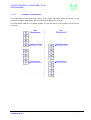
2.2.4.1.
Password
2.2.4.1.1.
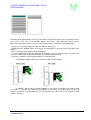
User rights
Visibility
Checked security
rights
Main window
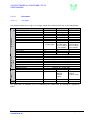
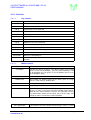
Generally three different user types are recognised with basic default permissions as described below:
Action
Fix Wavelength
Wavelength Program
Scan
Timedrive
Autorate Assay
Calibration
Baseline Run
Option
Administrator
yes
yes
yes
yes
yes
yes
yes
Depends on
security rights
Power User
User
yes
yes
yes
yes
yes
yes
yes
yes
yes
yes
Depends on security rights
yes
yes
Depends on
Depends on
security rights. security rights.
Access only to Access only to
print controls
print controls
Depends on security rights
no
no
yes
yes
Depends on security rights
Depends on security rights
Depends on security rights
Depends on security rights
Depends on security rights
Depends on security rights
Depends on security rights
Depends on security rights
Depends on security rights
Backup
Edit Security
Trail
Service
Password required on saving data
Overwrite existing report on saving data
Create additional report on saving data
Change Method
Delete Report
Modify Report
Signature approval
Signature accept
yes
yes
yes
Report
all
Only own
grouped
member
reports
Method
all
all
or Only own or
grouped
member reports
all
The permissions for individual users are modified by the administrator by checking the appropriate
boxes.
UVS Software for
UVIKON 900/XL/XS
Manual Version 2.20, Oct. 2007
Page 24 of 202
UVS SOFTWARE for UVIKON 900 / XS /XL
USER MANUAL
2.2.4.1.2.
Adding users
In order to add a user it is always necessary to unclick the “write protect” checkbox and the click on
the “+” or “-“ symbols to add or remove a user respectively.
Click on “+” and a dialogue box will prompt for a new user name:
Select local or domain and enter a name and click on OK, the new user will be entered in the list and
the permissions for the new user can be selected using the dialogue boxes on the right of the window:
2.2.4.1.3.
Login rights
Clicking on the drop-down arrow cause the three possible user types to be displayed as a drop-down
list. Select the required user type from the list.
2.2.4.1.4.
Login blocked
Clicking on this checkbox can be used to prevent a user from accessing the system temporarily.
Permanent exclusion of a user should be made by deleting the user completely from the list using the
“-“ button.
2.2.4.1.5.
Additional Rights
Users can be assigned the right to delete reports. If this checkbox is not ticked the user is not allowed
to delete reports.
2.2.4.1.6.
Saving data
Clicking on the “Password required” checkbox will activate a password dialogue in order to permit
saving of the acquired data. This security feature can be used to identify those users allowed to save
data. Only the currently logged-in user provided with the appropriate rights can save data.
Clicking on the “Overwrite allowed” checkbox allows the user to also overwrite previously saved data.
Clicking on the “Create additional report” checkbox allows the user to save additional reports after
creation of the initial report using the same acquired data.
UVS Software for
UVIKON 900/XL/XS
Manual Version 2.20, Oct. 2007
Page 25 of 202
UVS SOFTWARE for UVIKON 900 / XS /XL
USER MANUAL
2.2.4.1.7.
Password expired
A change of password can be forced at certain intervals as defined by this dialogue. The option of
never changing is also available but users should note that this option is not acceptable when
operating in a controlled environment.
Entry of a time interval automatically produces a new box with the actual date by which the password
must be changed.
2.2.4.1.8.
Password
This allows definition of the user password for normal access control and also for saving of data if the
checkbox described is activated.
The initial password for the new user must be entered in the appropriate box. New users will be forced
to change this password when they log onto the system for the first time. This is a precautionary
measure to ensure that the system access password is known only to the user and no other thirdparty.
2.2.4.2.
Groups
This defines the grouping for report access. Groups and members of groups can be defined to view
the reports. A member of a group can view the reports of all members.
UVS Software for
UVIKON 900/XL/XS
Manual Version 2.20, Oct. 2007
Page 26 of 202
UVS SOFTWARE for UVIKON 900 / XS /XL
USER MANUAL
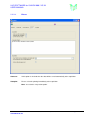
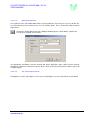
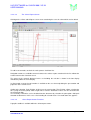
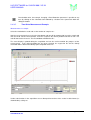
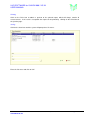
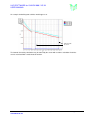
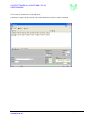
2.2.5. Baseline
The UVS software does not automatically execute a baseline at start-up. This operation can be
executed by clicking on the Baseline Run icon in the start-up screen to open the following dialogue
window:
The actual conditions under which a baseline is executed can impact later measurement results if
these are made using different parameters such as scan speed. For this reason the UVS software
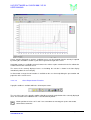
requires a method to be defined in Wavelength Scan mode before a baseline can be executed.
Click on the selection button adjacent to the method box in order to select the correct method if this is
not already displayed. This method is then displayed before starting a baseline but can only be edited
in the method editor itself thus permitting tracking of baseline conditions during normal operation.
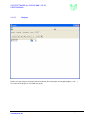
Click on OK in order to start the baseline measurement, the unit will position itself at the correct
starting wavelength and then automatically start the run:
UVS Software for
UVIKON 900/XL/XS
Manual Version 2.20, Oct. 2007
Page 27 of 202
UVS SOFTWARE for UVIKON 900 / XS /XL
USER MANUAL
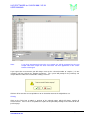
2.2.6. Power on
Switch on the power supply to the instrument, PC and monitor. The Uvikon has an indicator showing
that the power is on. From the Windows Desktop click on the shortcut to display the start-up screen
and login dialogue.
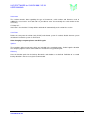
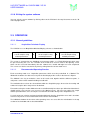
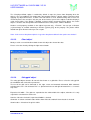
2.2.7. Self test and system software initialisation
The self test takes about 2 minutes (max) and performs the following checks:
Program memory
Data memory
Tungsten halogen lamp on
Deuterium lamp on
Data transfer
Wavelength drive
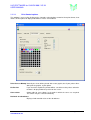
During self test you will see the main software window on the screen with “Initializing instrument”
displayed on the bottom status bar.:
After completion of the initialisation this message will disappear and the software will prompt for user
name and password for log in.
UVS Software for
UVIKON 900/XL/XS
Manual Version 2.20, Oct. 2007
Page 28 of 202
UVS SOFTWARE for UVIKON 900 / XS /XL
USER MANUAL
2.2.8. Exiting the system software
You can exit the system software by clicking either on the Exit icon in the top left corner or on the “X”
in the top right corner.
2.3. OPERATION
2.3.1. General guidelines
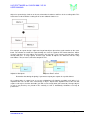
2.3.1.1.
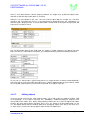
Acquisition-Calculate-Display
The UVIKON uses an Acquisition-Calculate-Display scheme as shown below:
Acquire data for
1 to 10 samples using
method parameters
Calculate
1 to 10 samples using
method parameters
Display results of
1 to 10 samples using
method parameters
The system is structured to use individual measurement modes, e.g. Fixed Wavelength, which must
be pre-selected by the user. The selection of the mode to be used is made in the opening screen
which can be accessed immediately after the software has started and login has been completed.
This screen can also be reached at any time by exiting from the current mode in use.
2.3.1.2.
Recommended Operating Practise
Each measuring mode uses Acquisition parameters which must be pre-defined in a Method. The
Method also contains the data necessary for the final display of the results in the form of a Report.
The Method is the key to maintain a trace to all results and, together with the different reports, is
subject to a strict revision control including an audit trail.
The method to be used can be selected from within the Acquisition page, where also the naming and
number of samples to be analysed can be defined.
For routine testing the various Methods to be used will normally have been pre-defined and therefore it
should not be necessary for users to access the Method screen. All necessary entries for simple
routine operation with a series of samples can therefore be made directly in the Acquisition area.
A result report can also be previewed and printed directly from the Acquisition area and is therefore
not necessary for the user to switch between the various main windows.
The individual windows for the three main operating areas are accessible via main buttons in the top
section of each window and are described below:
UVS Software for
UVIKON 900/XL/XS
Manual Version 2.20, Oct. 2007
Page 29 of 202
UVS SOFTWARE for UVIKON 900 / XS /XL
USER MANUAL
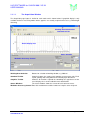
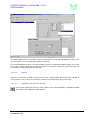
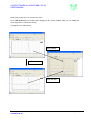
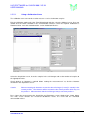
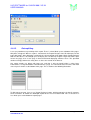
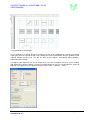
2.3.1.3.
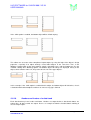
The Acquisition Window
The Acquisition page layout is similar for each mode and is shown below. A graphical display is only
available for those measuring modes where graphics are actually required and used, e.g. Wavelength
Scanning.
Working Area Selection bar
Standard tool bar
Result display area
Status windows
Method & Accessory Control
Buttons for selection of working window, e.g. Method.
Contains buttons for starting and stopping measurements plus Excel
export, printing and saving data for the currently open document.
Graphics Toolbar
Contains all functions required for controlling the appearance of the
curve display, these are described in more detail below.
Status Windows
The status windows shows the current or last instrument status.
Method & Accessory Control Enter the method name and the number of samples to be analysed.
Working Area Selection
Standard Toolbar
UVS Software for
UVIKON 900/XL/XS
Manual Version 2.20, Oct. 2007
Page 30 of 202
UVS SOFTWARE for UVIKON 900 / XS /XL
USER MANUAL
The list for selecting methods may be sorted alphabetically or by the access counts. The most used
method is on the top.
The sample description can be imported from a text file from the explorer via drag and drop.
Select the text file in the explorer and drag it with left mouse button pressed to the description grid.
Then release the mouse button, the text is dropped into the grid.
UVS Software for
UVIKON 900/XL/XS
Manual Version 2.20, Oct. 2007
Page 31 of 202
UVS SOFTWARE for UVIKON 900 / XS /XL
USER MANUAL
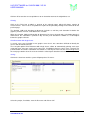
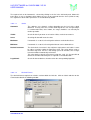
2.3.1.4.
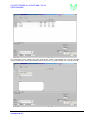
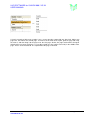
The Method Window
The Method page layout is similar for each mode and is shown below. Graphical display functions are
again only available in those measuring modes where graphics are actually used, e.g. Wavelength
Scanning. Other functions such as calibration definition are also not present in every window.
Working Area Selection
Selection Toolbar
Existing Method List
Parameter Definition
Current Method History
2.3.1.5.
Buttons for selection of working window, e.g. Method.
Contains buttons for navigating the current method list plus buttons to
allow addition or deletion of methods.
Contains a list of all methods used for the given measuring mode.
Scrolling through the list updates automatically the corresponding
fields in the parameter definition fields.
All parameters necessary for the method are defined and displayed
here.
Displays data relevant to the creation and history of each method in
the list.
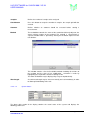
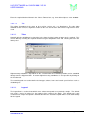
The Report Window
The Report page layout is similar for each mode and is shown below. Graphical display functions are
again only available in those measuring modes where graphics are actually used.
UVS Software for
UVIKON 900/XL/XS
Manual Version 2.20, Oct. 2007
Page 32 of 202
UVS SOFTWARE for UVIKON 900 / XS /XL
USER MANUAL
Working Area Selection
Selection Toolbar
Available Reports List
Curve Display Area
Comments Area
Electronic Signature
2.3.1.6.
Buttons for selection of working window, e.g. Method.
Contains buttons for navigating the current list plus buttons to allow
archiving or printing of reports.
Contains a list of all reports available used for the given measuring
mode. Scrolling through the list updates automatically the
corresponding fields in the results area fields.
Shows all curves available for the current report.
Displays data for the samples contained in the current report.
Shows details relating to status of electronic signature for a report.
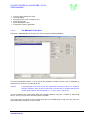
Quick Search Function and Row Colouring
In Methods and Reports a quick search function may be used to quickly find the required file.
Therefore, click on the fixed row to enter the name of the file. It will be highlighted automatically.
UVS Software for
UVIKON 900/XL/XS
Manual Version 2.20, Oct. 2007
Page 33 of 202
UVS SOFTWARE for UVIKON 900 / XS /XL
USER MANUAL
Also, by clicking on the small arrow in the left corner of the fixed row, the rows may be coloured.
2.3.2. Starting a measurement
The “Start” button on the main menu bar is used in all methods to start measurement of one to ten
samples. All parameters defined in the selected method are then used for a measurement.
Measurement can be stopped at any time by pressing the ”Stop” button on the main menu bar. All
data measured up to that point is valid and can be stored and used for further processing.
2.3.3. Recalculation
UVS Software for
UVIKON 900/XL/XS
Manual Version 2.20, Oct. 2007
Page 34 of 202
UVS SOFTWARE for UVIKON 900 / XS /XL
USER MANUAL
The calculations are made automatically as part of the acquisition process in the UVS software. In
cases where parameters are changed a recalculation can be forced as described below.
Clicking on the Calculator icon on the tool bar is used throughout the software package to initiate a recalculation of one to ten samples. Only the parameters in the calculate column and the display column
of the acquisition parameter set are used for calculation.
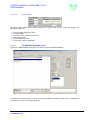
2.3.4. Saving data
Clicking on the “Save” button on the toolbar allows the currently displayed data to be saved. The
following dialogue box appears:
Enter the required file name in the input window , select a project if available and click on the OK
button.
2.3.5. Loading existing data files
Data which has already been acquired can be viewed via the main Report window in any of the
measuring modes.
UVS Software for
UVIKON 900/XL/XS
Manual Version 2.20, Oct. 2007
Page 35 of 202
UVS SOFTWARE for UVIKON 900 / XS /XL
USER MANUAL
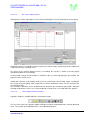
Select the Report window by clicking on the Report button. The left hand section of the window
contains a list of acquired data files which can be viewed and loaded by clicking on the appropriate
line.
2.3.6. Data conversion to EXCEL format
®
Data files can be converted directly to Excel (*.XLS) format to be read from Excel spreadsheet
programs. Excel must be installed for this function to be used. The data will be transferred directly to
Excel and can then only be saved and processed within Excel.
Caution:
This data cannot be re-imported into the UVS software and is not subject to any
further controls by the UVS software with respect to security considerations for
electronic documentation.
Click on the icon to transfer data to Excel. Excel is opened automatically and the data entered
in a worksheet.
2.3.7. Export to Clipboard
Data files in graph format can be exported to the Windows Clipboard to be immediately imported into
other running programs via the copy-paste mechanism.
Click on the clipboard icon in the graphics toolbar and the curve is exported automatically to the
clipboard for further processing.
2.3.8. ASCII Export
For interfacing with a LIMS system, ASCII export is possible from Acquisition and from Report mode.
If the sample set has been stored as a report then the ASCII file gets the same name as the report
itself – with the extension “.txt”.
These ASCII files can be directly read by the LIMS systems.
2.3.9. Methods
The system will always use a set of parameters called a “Method” to execute the data acquisition and
measurement step.
The method file for an acquisition is selected from a drop-down list in the main acquisition window as
described below each measuring mode. Simply click on the required method in the list.
Programming and viewing of methods is made from the Method screen for each measuring mode.
Existing methods are shown in a list in the left-hand window, clicking or scrolling through the list allows
an easy overview of the current method in this list.
UVS Software for
UVIKON 900/XL/XS
Manual Version 2.20, Oct. 2007
Page 36 of 202
UVS SOFTWARE for UVIKON 900 / XS /XL
USER MANUAL
A new method is programmed by removing the “write-protect” check box tick and clicking on the “ + “
icon. The available functions for each method type are described in the appropriate sections below.
UVS Software for
UVIKON 900/XL/XS
Manual Version 2.20, Oct. 2007
Page 37 of 202
UVS SOFTWARE for UVIKON 900 / XS /XL
USER MANUAL
2.3.10.
Saving methods
The system prompts for a name for the method to be stored whenever a new method is to be created.
Generally methods cannot be simply overwritten because of the tracking system used for CFR Part 11
therefore it is necessary to enter a new name and confirm with OK.
Once the parameters for the method have been entered the method is saved by clicking on the green
tick in the option tool bar:
2.3.11.
Cancel all current activities
Clicking on the Exit icon in the top left-hand corner of each screen will return automatically to the startup screen.
Clicking on the “Stop” button in the acquisition screen will cancel any currently running data acquisition
etc.
Caution
If you exit without having saved your data on disk you cannot restore the data. A
message will warn you if this situation occurs.
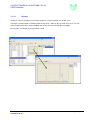
2.3.12.
Activate Cursor and Manual Peak Picking
The Activate Cursor icon can be used in Wavelength Scan, Time Drive and Auto Rate Assay methods
to quickly overview values of the sample curve on the screen.
In the Report Overview window click on the chart tab to obtain the curve display. Click on the Activate
Cursor icon. A vertical cursor can now be moved across the curve graph and the values for the
wavelength are continuously displayed on the cursor line. The arrow used to move the cursor is also
used for the position of the Y-axis and values for the current Y-position are continuously updated in
the legend window adjacent to the curve.
Additionally, by clicking on the right mouse button, you may add new comments, edit and delete
comments.
UVS Software for
UVIKON 900/XL/XS
Manual Version 2.20, Oct. 2007
Page 38 of 202
UVS SOFTWARE for UVIKON 900 / XS /XL
USER MANUAL
When the cursor is activated, you may manually pick peaks by clicking the right mouse button and
choose Peak Picking.
You can also activate or deactivate samples in the legend.
2.3.13.
Zooming
Zooming is available for all methods where graphical curve displays, e.g. Wavelength Scan, Time
Drive or Auto Rate Assay, are available and is used to magnify a section of the graph.
Simply move the cursor on the graph to the upper left corner of the rectangle to be magnified, press
the left button of the mouse and move it to the right while keeping the left button pressed. A rectangle
will be shown on the screen indicating the area that will be magnified.
When you reach the lower right corner of your area, release the button and the area selected is
zoomed to fill the graph area.
You can repeat the zooming function up to the maximum resolution by repeating the selection of the
zoomed area.
To unzoom simply position the cursor on the graph, press the left mouse key, move the cursor to the
left and release the left mouse key or double click with left mouse key.
UVS Software for
UVIKON 900/XL/XS
Manual Version 2.20, Oct. 2007
Page 39 of 202
UVS SOFTWARE for UVIKON 900 / XS /XL
USER MANUAL
2.3.14.
Adding comments to curves
You can add a comment at any point on a curve for documentation purposes. When a curve is
displayed on the screen, click the Activate Cursor icon in the Graphics toolbar, move the mouse cursor
to the point on the curve where the comment should be added and click the right mouse button. A
small dialogue box appears offering the choice of adding, editing or deleting a comment. Click on a
selection and the appropriate dialogue window will appear:
Input the desired comment text using alphanumeric characters and press “OK”. The comment will
appear directly linked to the curve at the cursor position on the X-axis.
More comments may be added by repeating the same procedure. The comments are numbered and
the spin selector by the Comment No box can be used when editing or deleting comments in order to
select the item to be used.
UVS Software for
UVIKON 900/XL/XS
Manual Version 2.20, Oct. 2007
Page 40 of 202
UVS SOFTWARE for UVIKON 900 / XS /XL
USER MANUAL
2.4. SYSTEM MODES
This section explains the parameters and gives a step by step measurement example for each system
mode. Many parameters are common to all methods but are explained separately for each mode in
the interests of clarity.
2.4.1. Fixed Wavelength
2.4.1.1.
The Acquisition Screen in Fixed Wavelength
Select “Fixed Wavelength” from the main menu to obtain the following display:
This is the acquisition window from which all measurements are started. In this window the following
parameters must be selected before starting a measurement:
Method to be used for the acquisition. The method contains all parameters necessary for the
execution of the measurement.
Numbers of samples to be measured.
Number of blank samples, measured as the first samples.
Autozero at start of measurement.
Load previous saved data from a report
UVS Software for
UVIKON 900/XL/XS
Manual Version 2.20, Oct. 2007
Page 41 of 202
UVS SOFTWARE for UVIKON 900 / XS /XL
USER MANUAL
If Individual Multiplier / Divisor is activated in the Method, you may add a multiplication / division factor
before the measurement values. Both, multiplier and divisor, have to be defined. The factor not used
should therefore be set to “1”. E.g. if you choose the multiplier of 1.7 for a sample, you have to set the
respective divisor to 1. The calculation will be applied by clicking on the Calculate icon in the selection
toolbar. You may also define a description for the factor by clicking on the fixed row to enter
description.
2.4.1.1.1.
Statistic
If Calculation is activated in the Method, the calculation of mean, standard deviation, RSD %, min.,
max. and the deviation percentage of the mean regarding sample no. 1 will be shown.
If Concentration is activated in the Method, a chart is shown with the concentration values and the
regression curve.
2.4.1.1.2.
Instrument Control
Autozero may be activated before starting a measurement.
2.4.1.1.3.
Run parameters
The run parameters are entered in the lower left section of the screen:
UVS Software for
UVIKON 900/XL/XS
Manual Version 2.20, Oct. 2007
Page 42 of 202
UVS SOFTWARE for UVIKON 900 / XS /XL
USER MANUAL
Samples
Defines the number of samples to be analysed.
Blank Samples
Defines the number of blank samples to be measured, blank samples are
always expected at the start of a run. The value of the measured blank is
subtracted from the actual measured value of the sample prior to calculation
of concentration etc. If more than one blank is defined then the system
calculates the average blank value for the blanks and then subtracts this
from the actual measured sample values.
Method
The method box contains the name of the method and, directly adjacent, the
actual revision number of that method. The method is selected from a
separate window which opened by clicking on the button adjacent to the
revision box.
Checkbutton
Press this button to accept the number of samples, the sample grid will also
created.
Thermo System
Surveys the temperature of the sample
This window contains a list of all available methods including all revisions of
the method and the date of last modification. The order of the shown
methods may be selected by ticking “by usage” or “alphabetically” in the
lower right corner of the screen. Selection is made by highlighting the
required line and then clicking on OK.
Cell Changer
The operating mode of the cell changer and the actual position can be
defined here before starting a measurement series.
Note :
During the Dialogbox ‘Please insert replicate’ it is possible to move the cell
changer with the ‘+’ and ‘-‘ key.
UVS Software for
UVIKON 900/XL/XS
Manual Version 2.20, Oct. 2007
Page 43 of 202
UVS SOFTWARE for UVIKON 900 / XS /XL
USER MANUAL
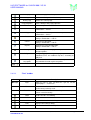
2.4.1.1.4.
System Status
The lower right section of the display contains the actual status of the system and displays the
following parameters:
Current sample being measured.
Actual wavelength.
Actual absorbance value.
Temperature (where applicable).
In addition the lower right panel also allows manual setting of wavelength in order to allow rapid
monitoring of the unit.
2.4.1.2.
Parameters in Fixed Wavelength Acquisition
Clicking on the parameter tab in the acquisition allows access to the following parameters:
Factor
The factor can be used to calculate concentrations or other values if the response of
the substance measured is known. In this case use of a calibration file would not be
necessary.
View
These checkboxes permit toggling between absorbance and transmission values for
the display of the acquired data. The data is always saved according to the definitions
in the method independent of this setting.
UVS Software for
UVIKON 900/XL/XS
Manual Version 2.20, Oct. 2007
Page 44 of 202
UVS SOFTWARE for UVIKON 900 / XS /XL
USER MANUAL
2.4.1.3.
The Method in Fixed Wavelength
Click on the Method button in the upper left corner to open the Method window:
The left-hand window contains a list of all existing methods including revisions and an indication of
whether they have been used already or not.
Caution:
If measurements have been used, the method will be locked and can no longer be
changed. However, they can be used for later measurements or modified with revision
control. Such methods are indicated by a “ * ” in the “ used ” column list.
A new method can be created from within the method section by using the '+' button. In order to do
this it is first necessary to uncheck the write-protect checkbox.
The system will first prompt for name under which the new method will be saved. Once this has been
defined all other parameters can be entered.
2.4.1.3.1.
Acquisition parameters
Method not active
UVS Software for
UVIKON 900/XL/XS
Inactivate, and thus hide the current Method by checking this box.
Manual Version 2.20, Oct. 2007
Page 45 of 202
UVS SOFTWARE for UVIKON 900 / XS /XL
USER MANUAL
Wavelength
Defines the wavelength to be used for the measurement.
Delay time
The instrument will wait for the selected delay time after the MEASURE key is
pressed to start the actual measurement.
Averaging time
Defines the time the instrument uses to collect data for calculation of a mean
value for one reading. A long averaging time is useful to reduce noise when
measuring at high absorbance values.
Decimals
Defines the amount of decimals for the measurement values.
Abs / %T
Selection permits definition of the mode to be used. The user can select between
either absorbance or transmission.
Replicates
Defines the number of acquisitions per sample to determine the resulting mean.
E.g.:
Replicates = 0 : only one acquisition per sample
Replicates = 1 : two acquisitions per sample
Individual Multiplier/Divisor
2.4.1.3.2.
By checking this box, a separate dilution factor (multiplier) and weight
factor (divisor) can be defined for each sample.
Common Parameters
The right-hand panel contains common parameters, which are required for every system and user
method. They will be stored and recalled along with all other parameters.
Lamp change
This parameter defines the lamp change wavelength. The deuterium lamp is used
for all wavelengths below the lamp change wavelength. The tungsten halogen
lamp is used for all wavelengths above the lamp change wavelength.
Tungsten lamp
When checked the tungsten lamp will be switched on and used according to the
setting for the lamp change.
Deuterium lamp
When checked the deuterium lamp will be switched on and used according to the
setting for the lamp change.
Filter change (1-5) This parameter defines the wavelength used to switch the filter.
Bandwidth
Selects the spectral bandwidth of the spectrophotometer.
Cell changer
Defines the operating mode of the cell changer (if fitted).
UVS Software for
UVIKON 900/XL/XS
Manual Version 2.20, Oct. 2007
Page 46 of 202
UVS SOFTWARE for UVIKON 900 / XS /XL
USER MANUAL
2.4.1.3.3.
Calculation
Calculation
Deactivate Calculation for normal acquisitions without any special calculation.
Activate Calculation for special calculations defined under Math Function.
Math Function
This function depends on the grid of absorbance values. Enter the calculation
desired.
Examples: ((A1-A2)-(A4-A3))*F ; ((A1-A2)-(A1,1-A2,1))*F
Table Matrix Example I:
Abs 1
Abs 2
A1
A2
Table Matrix Example II:
Abs 1
A1,1
A1,2
A1,3
A1,4
Abs 3
A3
Abs 2
A2,1
A2,2
A2,3
A2,4
Abs 4
A4
Abs 3
A3,1
A3,2
A3,3
A3,4
Result
V
Result
W
X
Y
Z
The first number indicates the different measurements of one sample, the second
number indicates the sample number. E.g.: A2,1 is the first replicate of the first
sample, A1,2 is the first measured value of sample no. 2.
F = factor given with the acquisition window
Other operators (*,/,+,sqr,...) may be entered.
Exclude rows
Enter the rows to be excluded. The calculation of results (mean, std dev,...) will
not use these rows for calculation.
Target value
This is a value for the statistics window. The deviation will be calculated with the
mean value and the target value.
Note:
Calculation and Concentration checkboxes cannot both be ticked at the same
time. An error message will be shown during saving of the method.
UVS Software for
UVIKON 900/XL/XS
Manual Version 2.20, Oct. 2007
Page 47 of 202
UVS SOFTWARE for UVIKON 900 / XS /XL
USER MANUAL
2.4.1.3.4.
Concentration
If the Concentration checkbox is ticked, the system will use the defined calibration reference for the
calculation of the concentration values based on the results of the measurement.
By clicking the “...”-button next to the Rev Box, you can select the calibration file to be used. The
boxes show the Reference name of the selected file and its revision number (Rev).
Note: Calculation and Concentration checkboxes cannot both be ticked at the same time. An error
message will be shown during saving of the method.
2.4.1.3.5.
Audit Trail in Fixed Wavelength Method
Click on the Audit Trail icon to view the audit trail window for the method.
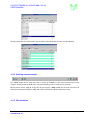
2.4.1.4.
The Report Screen in Fixed Wavelength
Click on the Report button in the upper left corner to open the Report window:
UVS Software for
UVIKON 900/XL/XS
Manual Version 2.20, Oct. 2007
Page 48 of 202
UVS SOFTWARE for UVIKON 900 / XS /XL
USER MANUAL
The left-hand window contains a list of all available reports, the right-hand window contains the results
in the upper section and the main parameters for the measurement in the lower part. Each report can
be viewed by scrolling through the left-hand list.
2.4.1.4.1.
Printing
Click on the Print icon to obtain a print preview of the selected report, which will always contain all
measurements. The report can be printed by clicking on the Print icon on the preview page.
2.4.1.4.2.
Importing a report
from the database
Click on the Import icon to access earlier reports in the extracted database. A dialogue window for
selection of the database will be opened:
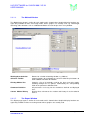
2.4.1.4.3.
Filtering the report list
The report list in the left window will become very long with time and it may be necessary to filter the
list so that only those files of interest to a user are actually shown. This is carried out using the Select
Report icon.
Click on the Select Report icon and a dialogue window appears, which allows selection of a
view by date, method, user or name:
UVS Software for
UVIKON 900/XL/XS
Manual Version 2.20, Oct. 2007
Page 49 of 202
UVS SOFTWARE for UVIKON 900 / XS /XL
USER MANUAL
The appropriate checkbox must be checked and, where applicable, either a date or name selected.
Clicking on OK will cause only those reports which satisfy all selected criteria to be shown in the list of
available reports.
2.4.1.4.4.
Audit Trail in Fixed Wavelength Report
Click on the Audit Trail icon to view the audit trail window for the report.
2.4.1.5.
Calculations in Fixed Wavelength
Fixed Wavelength contains four basic calculation methods for final result determination:
Linear regression
Quadratic regression
Blank
Factor
In Fixed Wavelength the Blank and Factor calculations are executed automatically without the need to
create a calibration file:
Blank
The measured values for sample blank is subtracted from the measured value of each
sample measured.
Factor
The actual value obtained from the measurement is always multiplied by the factor
parameter. This is accessible by clicking on the Parameter tab in the acquisition
screen.
The actual calculation is based on the following formula:
R = F * (VM sample – VM blank)
Where R = Result, F = Factor and VM represents the measured values obtained for sample and blank
respectively.
UVS Software for
UVIKON 900/XL/XS
Manual Version 2.20, Oct. 2007
Page 50 of 202
UVS SOFTWARE for UVIKON 900 / XS /XL
USER MANUAL
Recalculation after, for example, changing the factor value is possible at any time by clicking on the
Calculator icon.
2.4.1.6.
Concentration in Fixed Wavelength
In simple cases the Result obtained above can be used as a concentration value if the Factor has
been defined and zero concentration corresponds to zero absorbance.
Using the calibration function, it is possible to calculate concentration values based on a previously
determined calibration curve. This method offers the advantage that any absorbance offset is
compensated for and that the final result is given in the desired units in the report print-outs.
The calibration uses the value obtained for the Result (see above) and converts this value to a
corresponding concentration value in units, which are defined as part of the calibration file.
A more detailed description of the Calibration function is given in a separate section within this
document.
2.4.2. Wavelength Scan
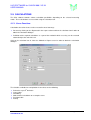
2.4.2.1.
The Acquisition Screen in Wavelength Scan
Select “Wavelength Scan” from the main menu to obtain the following display:
UVS Software for
UVIKON 900/XL/XS
Manual Version 2.20, Oct. 2007
Page 51 of 202
UVS SOFTWARE for UVIKON 900 / XS /XL
USER MANUAL
This is the acquisition window from which all measurements are started. In this window the following
parameters must be selected before starting a measurement:
Method to be used for the acquisition. The method contains all parameters necessary for the
execution of the measurement.
Numbers of samples to be measured.
Autozero at start of measurement.
Load previous saved data from a report
2.4.2.1.1.
Run parameters
The run parameters are entered in the “Method” panel and in the “Photometer control” panel:
Samples
Defines the number of samples to be analysed.
Checkbutton
Press this button to accept the number of samples, the sample grid will also
created.
Autozero
Defines whether an autozero should be executed prior to the start of a
measurement.
Method
The method box contains the name of the method and, directly adjacent, the
actual revision number of that method. The method is selected from a
separate window which opened by clicking on the button adjacent to the
revision box:
UVS Software for
UVIKON 900/XL/XS
Manual Version 2.20, Oct. 2007
Page 52 of 202
UVS SOFTWARE for UVIKON 900 / XS /XL
USER MANUAL
This window contains a list of all available methods including all revisions of
the method and the date of last modification. Selection is made by
highlighting the required line and then clicking on OK.
The order of Methods may be displayed by usage or alphabetically.
A certain wavelength may be chosen manually and set immediately in order
to allow rapid monitoring of the unit.
Wavelength
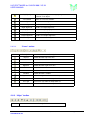
2.4.2.1.2.
System Status
The lower right section of the display contains the actual status of the system and displays the
following parameters:
Current sample being measured.
Actual wavelength.
Actual absorbance value.
Temperature (where applicable).
2.4.2.2.
The Method in Wavelength Scan
Click on the Method button in the upper left corner to open the Method window:
UVS Software for
UVIKON 900/XL/XS
Manual Version 2.20, Oct. 2007
Page 53 of 202
UVS SOFTWARE for UVIKON 900 / XS /XL
USER MANUAL
The left-hand window contains a list of all existing methods including revisions and an indication of
whether they have been used already or not.
Caution:
If measurements have been used, the method will be locked and can no longer be
changed. However, they can be used for later measurements or modified with revision
control. Such methods are indicated by a “ * ” in the “ used ” column list.
A new method can be created from within the method section by using the '+' button. In order to do
this it is first necessary to uncheck the write-protect checkbox.
The system will first prompt for name under which the new method will be saved. Once this has been
defined all other parameters can then be entered.
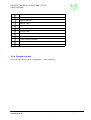
2.4.2.2.1.
Acquisition parameters
Method not active Inactivate, and thus hide the current Method by checking this box.
Lower Wavelength Defines the lower wavelength for the wavelength range to be used for the
measurement.
Upper Wavelength Defines the upper wavelength for the wavelength range to be used for the
measurement.
Scan Interval
UVS Software for
UVIKON 900/XL/XS
This parameter (also called sampling interval in other instruments) defines the
wavelength step between two measured data points.
Manual Version 2.20, Oct. 2007
Page 54 of 202
UVS SOFTWARE for UVIKON 900 / XS /XL
USER MANUAL
Scan Speed
Defines the wavelength drive speed to be used for the measurement. Scanning
speeds can be selected between 5 and 5000 nm/min. If you choose dynamic
scan speed, the instrument will automatically optimise the scan speed to suit the
slope of your sample.
Autozero
If checked, an autozero will be made for each sample beforestarting the scan.
Auto Calculation
If checked, the calculation for peak detection, smoothing etc. starts automatically
after acquisition using the defined parameters.
2.4.2.2.2.
Common Parameters
The right-hand panel contains common parameters, which are required for every system and user
method. They will be stored and recalled along with all other parameters.
Lamp change
This parameter defines the lamp change wavelength. The deuterium lamp is used
for all wavelengths below the lamp change wavelength. The tungsten halogen
lamp is used for all wavelengths above the lamp change wavelength.
Tungsten lamp
When checked, the tungsten lamp will be switched on and used according to the
setting for the lamp change.
Deuterium lamp
When checked, the deuterium lamp will be switched on and used according to the
setting for the lamp change.
Filter change (1-5) This parameter defines the wavelength used to switch the filter.
Bandwidth
Selects the spectral bandwidth of the spectrophotometer.
Cell changer
Defines the operating mode of the cell changer (if fitted).
2.4.2.2.3.
Calculation
The calculation selection permits definition of the mode of calculation to be used. The user can select
between either absorbance or transmission.
2.4.2.2.4.
Curve Parameters in the Wavelength Scan Method
Opens an edit dialogue for defining curve parameters and related formatting.
In Wavelength Scan the curve parameters can be linked to a method and then define the appearance
and properties of the curve such as colours, overlay format, scaling etc.
Functions defined here will be included and stored with the method and thus used for any acquisition
executed utilising that method.
UVS Software for
UVIKON 900/XL/XS
Manual Version 2.20, Oct. 2007
Page 55 of 202
UVS SOFTWARE for UVIKON 900 / XS /XL
USER MANUAL
Formatting options using this function are described in a separate section of this document.
2.4.2.2.5.
Calculation Parameters in the Wavelength Scan Method
Click on this icon to open the calculation dialogue window for the method:
By activating the Calculation box, a mathematical function or/and a wavelength function may be
implemented.
The Math Function may be defined with or without a reference file.
E.g.:
S-R
Subtract reference from all samples
S+R
Add reference to all samples
S*1.2 Multiply all samples with 1.2 (Format 1.2 or 1,2 depends on windows)
If individual references should be subtracted in WL Scan mode (e.g. to subtract the reference from the
same cuvette) then the Calculation can be defined in the following way:
•
Tick the “Calculation”
•
Define the Math. Function “S-R”
•
Under “No. of references” define the number of reference runs that should be
subtracted from the current runs.
Example:
When an automatic cell changer is in use, then 8 individual blank runs should be subtracted from 8
sample scans afterwards.
•
Select 8 references
•
Measure the 8 reference runs first
•
Add the samples into these 8 cuvettes
•
Start again using 8 samples
Then the first 8 references are being automatically subtracted from the following 8 samples.
UVS Software for
UVIKON 900/XL/XS
Manual Version 2.20, Oct. 2007
Page 56 of 202
UVS SOFTWARE for UVIKON 900 / XS /XL
USER MANUAL
To use the Wavelength Function, choose the number of functions and then enter the wavelength and
a mathematical function to have a calculated result.
E.g.:
W280/W260
W250*1.2
W300-W350
Nested functions are possible, too.
Some of the calculation functions shown in the dialogue above are described in more detail in the
section on Calculation within this document. Functions defined above will be included and stored with
the method and thus used for any acquisition executed utilising that method.
The wavelength range can be limited for the calculation of the maxima and minima.
Examples:
WL scan was executed in the wl range from 220 to 500 nm.
MIN[250;300] provides the lowest signal value within the WL range 250 to 300 nm, even if the scan
was executed from 220 to 500 nm.
MAX[250;300] provides the highest signal value within the WL range 250 to 300 nm, even if the scan
was executed from 220 to 500 nm.
MIN
provides the lowest signal value over the entire scan range from 220 to 500 nm.
MAX
provides the highest signal value over the entire scan range from 220 to 500 nm.
In addition the new functions MINL and MAXL indicate the related wavelength in a similar way:
Examples:
WL scan was executed in the wl range from 220 to 500 nm.
MINL[250;300] provides the wavelength for the lowest signal value within the WL range 250 to 300
nm, even if the scan was executed from 220 to 500 nm.
MAXL[250;300] provides the wavelength for the highest signal value within the WL range 250 to 300
nm, even if the scan was executed from 220 to 500 nm.
MINL
nm.
provides the wavelength for the lowest signal value over the entire scan range from 220 to 500
MAXL provides the wavelength for the highest signal value over the entire scan range from 220 to
500 nm.
2.4.2.2.6.
Audit Trail in Wavelength Scan Method
Click on the Audit Trail icon to view the audit trail window for the method.
2.4.2.3.
The Report Screens in Wavelength Scan
2.4.2.3.1.
The “Overview” Report Screen
Click on the Report button in the upper left corner to open the Report window:
UVS Software for
UVIKON 900/XL/XS
Manual Version 2.20, Oct. 2007
Page 57 of 202
UVS SOFTWARE for UVIKON 900 / XS /XL
USER MANUAL
The display obtained is the “Overview” screen, clicking on the “Chart” tab will display the chart as the
main item which can be manipulated or edited as required.
The left-hand window contains a list of all available reports, the right-hand window contains the results
in the upper section and the main parameters for the measurement in the lower part. Each report can
be viewed by scrolling through the left-hand list.
2.4.2.3.2.
Printing
Click on the Print icon to obtain a print preview of the selected report, which will always contain all
measurements. The report can be printed by clicking on the Print icon on the preview page.
2.4.2.3.3.
Importing a report from the database
Click on the Import icon to access earlier reports in the archived database. A dialogue window
for selection of the database will be opened:
UVS Software for
UVIKON 900/XL/XS
Manual Version 2.20, Oct. 2007
Page 58 of 202
UVS SOFTWARE for UVIKON 900 / XS /XL
USER MANUAL
2.4.2.3.4.
Filtering the report list
The report list in the left window will become very long with time and it may be necessary to filter the
list so that only those files of interest to a user are actually shown. This is carried out using the Select
Report icon.
Click on the Select Report icon and a dialogue window appears, which allows selection of a
view by date, method, user or name:
The appropriate checkboxes must be checked and, where applicable, either a date or name entered.
Clicking on OK will cause only those reports which satisfy all selected criteria to be shown in the list of
available reports.
2.4.2.3.5.
The “Chart” Report Screen
Clicking on the “Chart” tab will open a new screen containing the curve in a form which can be edited:
UVS Software for
UVIKON 900/XL/XS
Manual Version 2.20, Oct. 2007
Page 59 of 202
UVS SOFTWARE for UVIKON 900 / XS /XL
USER MANUAL
Curves may be displayed as overlays, individual curves can be removed from the overlay if required
by clicking the checkboxes shown as part of the legend on the right of the curve.
Navigation arrows are available to move between the various reports contained in the list without the
need to return to the Overview screen.
The name of the currently displayed curve set including the revision is shown in the box display
immediately above the curve display.
In Chart mode a range of new functions is available to the user for manipulating the presentation and
properties of the current curve.
2.4.2.3.6.
“Chart” Report Screen Functions
A graphics toolbar is available within the Chart report screen:
The use of the icons in the graphics toolbar allow direct manual manipulation of the currently displayed
chart. The function of the individual icons is described briefly below:
Shows position of values on X- and Y-axis and allows to manually pick peaks and to add,
edit or delete comments.
UVS Software for
UVIKON 900/XL/XS
Manual Version 2.20, Oct. 2007
Page 60 of 202
UVS SOFTWARE for UVIKON 900 / XS /XL
USER MANUAL
Opens the calculation dialogue window.
Exports a curve to the Windows clipboard for further processing.
Prints the curve as a single sheet report. Formatting of the report is described in a separate
section of this document dealing with curve format.
Opens the edit dialogue for formatting functions. See the separate section of this document
dealing with curve format for more details.
Converts chart format to a 3D display. The icon functions as a toggle switch between a 2D
and 3D display.
Click on this icon to control the depth of the 3D display using the mouse cursor. Clicking on
this icon automatically converts the display format to 3D, return to the 2D display via the 3D
icon button.
Double function icon allowing zooming of the complete curve.
Click on this icon to move the complete curve display using the mouse cursor. Clicking on
this icon automatically converts the display format to 3D, return to the 2D display via the 3D
icon button.
Click on this icon to rotate the complete curve display using the mouse cursor. Clicking on
this icon automatically converts the display format to 3D, return to the 2D display via the 3D
icon button.
Clicking on this icon will return the function of the mouse cursor to normal thus allowing use of
the normal zooming functions etc. in 3D displays.
2.4.2.3.7.
Audit Trail in Wavelength Scan Report
Click on the Audit Trail icon to view the audit trail window for the report.
2.4.2.4.
Calculations in Wavelength Scan
The curve calculation modes are generally embedded in the method and are described above and in
detail in the Calculation section.
Recalculation after, for example, changing a Peak Detection parameter is possible at any
time by clicking on the Calculator icon followed by election of the parameter within the
dialogue window.
UVS Software for
UVIKON 900/XL/XS
Manual Version 2.20, Oct. 2007
Page 61 of 202
UVS SOFTWARE for UVIKON 900 / XS /XL
USER MANUAL
2.4.2.5.
Peak Detection
Clicking on the peak detection tab will show the list of wavelength and absorbance values for the
detected peaks.
UVS Software for
UVIKON 900/XL/XS
Manual Version 2.20, Oct. 2007
Page 62 of 202
UVS SOFTWARE for UVIKON 900 / XS /XL
USER MANUAL
2.4.2.6.
Overlay
Overlay is a feature to collect several charts together, even the methods are not the same.
Clicking the overlay button a window called overlay opens. Move to the overview chart, press the left
mouse button, move to the overlay window and release the mouse button (drag and drop) .
Pressing the save button the overlay will be saved.
UVS Software for
UVIKON 900/XL/XS
Manual Version 2.20, Oct. 2007
Page 63 of 202
UVS SOFTWARE for UVIKON 900 / XS /XL
USER MANUAL
Another way to overlay is to start from the chart:
Press shift and left mouse button while dragging to the overlay window. Now you can modify the
chart and put the result into the overlay.
E.g original curve and derivate.
Drag and drop
Select derivate
Drag and drop
UVS Software for
UVIKON 900/XL/XS
Manual Version 2.20, Oct. 2007
Page 64 of 202
UVS SOFTWARE for UVIKON 900 / XS /XL
USER MANUAL
2.4.2.7.
Joined Reports
The “Joined Report” option offers the possibility the overlay of spectra from different runs of the same
method after the reports have been saved.
To use the Join Report Option click on “New Joined Report” icon and then choose the method that
you want to join your reports from. Please not that only data acquired with identical method and
revision of method can be overlayed and make sure that select and enter both values.
Select dataset from the Overview List and then add the file by using the right mouse button. The
selection of datasets can be monitored in the card “Joined Report” during the process. After the
completed selection of your datasets save the created Joined Report File.
The overlay is saved as a normal report, so that all mathematical and graphical functions are
available.
UVS Software for
UVIKON 900/XL/XS
Manual Version 2.20, Oct. 2007
Page 65 of 202
UVS SOFTWARE for UVIKON 900 / XS /XL
USER MANUAL
Add data with right mouse click
Double click to unselect
UVS Software for
UVIKON 900/XL/XS
Manual Version 2.20, Oct. 2007
Page 66 of 202
UVS SOFTWARE for UVIKON 900 / XS /XL
USER MANUAL
2.4.2.8.
Wavelength Scan Measurement Example
Scanning measurement of one blank and five samples using the cell changer.
Select the method to be used and set the number of samples to 6. Insert the samples into the cell
changer and start the measurement by pressing the Start button. The measured curves are displayed
in real time during acquisition. A 3D display (see below) may be used to give better clarity if the curves
are very similar for each sample. The final window will look similarly like this:
Note:
If you are not using a cell changer, you will be prompted for the next sample after each
sample has been measured. The final appearance of the screen remains unchanged.
Individual curves may be removed from the overlay display by clicking the checkboxes in the legend
on the right of the curve.
If you repeat the measurement you will always measure the selected number of samples (6 in our
example) until you change the Samples parameter. The system will prompt if the previously run
sample data has not been saved beforestarting a new run:
UVS Software for
UVIKON 900/XL/XS
Manual Version 2.20, Oct. 2007
Page 67 of 202
UVS SOFTWARE for UVIKON 900 / XS /XL
USER MANUAL
Click on OK to start the next acquisition run or on Cancel to return to the original data set.
Printing
Click on the Print icon to obtain a preview of the printed report, which will always contain all
measurements. If the result is acceptable the report can be printed by clicking on the Print icon on the
preview page.
The function “Add peak detection to document” includes as well the peak detection list before the
graphics printout, even for “small document” selection.
When the function “Add peak detection to document” has been selected and a calculation formula is
defined then the calculation is printed on top and the peak detection list follows as second object
before the graphic element.
Print Document with Single Curve
If several scans were included in one graphic curve then it was sometimes difficult to identify the
curves and all related elements.
The new print option “Print Document with Single Curve” allows to automatically printing each curve
separately (one sheet per curve) or per curve pair, if individual reference curves were selected. The
peak detection list and the calculations list contains as well only the values for the current single curve,
the next page contains then the next curve with the related peak detection and calculation results etc.
Saving
Click on the Save icon and the system will prompt for a file name:
Select the project, if availabe, enter the file name and click on OK.
UVS Software for
UVIKON 900/XL/XS
Manual Version 2.20, Oct. 2007
Page 68 of 202
UVS SOFTWARE for UVIKON 900 / XS /XL
USER MANUAL
2.4.3. Time Drive
2.4.3.1.
The Acquisition Screen in Time Drive
Select “Time Drive” from the main menu to obtain the following display:
This is the acquisition window from which all measurements are started. In this window the following
parameters must be selected before starting a measurement:
Method to be used for the acquisition. The method contains all parameters necessary for the
execution of the measurement.
Numbers of samples to be measured.
Autozero at start of measurement.
Load previous saved data from a report
2.4.3.1.1.
Run parameters
The run parameters are entered in the “Method” panel and in the “Photometer control” panel:
UVS Software for
UVIKON 900/XL/XS
Manual Version 2.20, Oct. 2007
Page 69 of 202
UVS SOFTWARE for UVIKON 900 / XS /XL
USER MANUAL
Samples
Defines the number of samples to be analysed.
Checkbutton
Press this button to accept the number of samples, the sample grid will also
created.
Autozero
Defines whether an autozero should be executed before starting a
measurement.
Method
The method box contains the name of the method and, directly adjacent, the
actual revision number of that method. The method is selected from a
separate window which is opened by clicking on the button adjacent to the
revision box:
This window contains a list of all available methods including all revisions of
the method and the date of last modification. Selection is made by
highlighting the required line and then clicking on OK.
The order of Methods may be displayed by usage or alphabetically.
A certain wavelength may be chosen manually and set immediately in order
to allow rapid monitoring of the unit.
Wavelength
2.4.3.1.2.
System Status
The lower right section of the display contains the actual status of the system and displays the
following parameters:
UVS Software for
UVIKON 900/XL/XS
Manual Version 2.20, Oct. 2007
Page 70 of 202
UVS SOFTWARE for UVIKON 900 / XS /XL
USER MANUAL
Current sample being measured.
No. of Readings
Remaining Time (also as progress bar)
Actual wavelength.
Actual absorbance value.
Temperature (where applicable).
2.4.3.2.
The Method in Time Drive
Click on the Method button in the upper left corner to open the Method window:
The left-hand window contains a list of all existing methods including revisions and an indication of
whether they have been used already or not.
Caution:
If measurements have been used, the method will be locked and can no longer be
changed. However, they can be used for later measurements or modified with revision
control. Such methods are indicated by a “ * ” in the “ used ” column list.
A new method can be created from within the method section by using the '+' button. In order to do
this it is necessary to uncheck the write-protect checkbox.
The system will first prompt for name under which the new method will be saved. Once this has been
defined all other parameters can be entered.
UVS Software for
UVIKON 900/XL/XS
Manual Version 2.20, Oct. 2007
Page 71 of 202
UVS SOFTWARE for UVIKON 900 / XS /XL
USER MANUAL
2.4.3.2.1.
Acquisition parameters
Method not active Inactivate, and thus hide the current Method by checking this box.
Wavelength
Defines the wavelength to be used for the measurement.
Delay time
The instrument will wait for the selected delay time after the MEASURE key is
pressed to start the actual measurement.
Averaging time
Defines the time the instrument uses to collect data for calculation of a mean
value for one reading. A long averaging time is useful to reduce noise when
measuring at high absorbance values.
Measure time
Defines the actual duration of the measurement in minutes.
Sampling rate
Defines the number of data points per minute for the measurement.
Autozero at start
Defines whether an autozero is to be executed beforeeach sample run.
Auto Calculation
If checked, the calculation for peak detection, smoothing etc. starts automatically
after acquisition using the defined parameters.
Calculation mode Calculation and curve portrayal can be in either Absorbance or Transmission
units.
2.4.3.2.2.
Common Parameters
The right-hand panel contains common parameters, which are required for every system and user
method. They will be stored and recalled along with all other parameters.
Lamp change
This parameter defines the lamp change wavelength. The deuterium lamp is used
for all wavelengths below the lamp change wavelength. The tungsten halogen
lamp is used for all wavelengths above the lamp change wavelength.
Tungsten lamp
When checked, the tungsten lamp will be switched on and used according to the
setting for the lamp change.
Deuterium lamp
When checked, the deuterium lamp will be switched on and used according to the
setting for the lamp change.
Filter change (1-5) This parameter defines the wavelength used to switch the filter.
Bandwidth
Selects the spectral bandwidth of the spectrophotometer.
Cell changer
Defines the operating mode of the cell changer (if fitted).
2.4.3.2.3.
Calculation
UVS Software for
UVIKON 900/XL/XS
Manual Version 2.20, Oct. 2007
Page 72 of 202
UVS SOFTWARE for UVIKON 900 / XS /XL
USER MANUAL
The calculation selection permits definition of the mode of calculation to be used. The user can select
between either absorbance or transmission.
2.4.3.2.4.
Curve Parameters in the Time Drive Method
Opens an edit dialogue for defining curve parameters and related formatting.
In Time Drive the curve parameters can be linked to a method and then define the appearance and
properties of the curve such as colours, overlay format, scaling etc.
Functions defined here will be included and stored with the method and thus used for any acquisition
executed utilising that method.
Formatting options using this function are described in a separate section in this document.
2.4.3.2.5.
Calculation Parameters in the Time Drive Method
Click on this icon to open the calculation dialogue window for the method:
The calculation functions shown in the dialogue above are described in more detail in the section on
Calculation within this document. Functions defined above will be included and stored with the method
and thus used for any acquisition executed utilising that method.
UVS Software for
UVIKON 900/XL/XS
Manual Version 2.20, Oct. 2007
Page 73 of 202
UVS SOFTWARE for UVIKON 900 / XS /XL
USER MANUAL
2.4.3.3.
The Report Screens in Time Drive
2.4.3.3.1.
The “Overview” Report Screen
Click on the Report button in the upper left corner to open the Report window:
The display obtained is the “Overview” screen, clicking on the “Chart” tab will display the chart as the
main item and this can be manipulated or edited as required.
The tabs for Activity and Peak Detection show a display in table form for the respective parameters
The left-hand window contains a list of all available reports, the right-hand window contains the results
in the upper section and the main parameters for the measurement in the lower part. Each report can
be viewed by scrolling through the left-hand list.
2.4.3.3.2.
Printing
Click on the Print icon to obtain a print preview of the selected report, which will always contain all
measurements. The report can be printed by clicking on the Print icon on the preview page.
UVS Software for
UVIKON 900/XL/XS
Manual Version 2.20, Oct. 2007
Page 74 of 202
UVS SOFTWARE for UVIKON 900 / XS /XL
USER MANUAL
2.4.3.3.3.
Importing a report from the database
Click on the import icon to access earlier reports in the archived database. A dialogue window
for selection of the database will be opened:
2.4.3.3.4.
Filtering the report list
The report list in the left window will become very long with time and it may be necessary to filter the
list so that only files of interest are shown to a user. This is carried out using the Select Report icon.
Click on the Select Report icon and a dialogue window appears, which allows selection of a
view by date, method, user or name:
The appropriate checkboxes must be checked and, where applicable, either a date or name selected.
Clicking on OK will cause only those reports which satisfy all selected criteria to be shown in the list of
available reports.
UVS Software for
UVIKON 900/XL/XS
Manual Version 2.20, Oct. 2007
Page 75 of 202
UVS SOFTWARE for UVIKON 900 / XS /XL
USER MANUAL
2.4.3.3.5.
The “Chart” Report Screen
Clicking on the “Chart” tab will open a new screen containing the curve in a form which can be edited:
To edit in cursor mode, uncheck the “write protect” checkbox first.
Navigation arrows are available to move between the various reports contained in the list without the
need to return to the Overview screen.
The name of the currently displayed curve set including the revision is shown in the box display
immediately above the curve display.
In Chart mode a range of new functions is available to the user for manipulating the presentation and
properties of the current curve.
Similar to the function “Peak Picking” in WL Scan, the new function “Time Picking” allows selecting the
time (using the hand symbol). With a right mouse click the absorbance values can be selected at the
cursor time position.
The manually selected list can be included into the document by selection the print option “Add peak
detection to document”. In this case a list including all selected values is inserted above the graphics.
2.4.3.3.6.
“Chart” Report Screen Functions
A graphics toolbar is available within the Chart report screen:
UVS Software for
UVIKON 900/XL/XS
Manual Version 2.20, Oct. 2007
Page 76 of 202
UVS SOFTWARE for UVIKON 900 / XS /XL
USER MANUAL
The use of the icons in the graphics toolbar allow direct manual manipulation of the currently displayed
chart. The function of the individual icons is described briefly below:
Shows position of values on X- and Y-axis and allows to manually pick peaks and to add,
edit or delete comments.
Opens the calculation dialogue window.
Exports a curve to the Windows clipboard for further processing.
Prints the curve as a single sheet report. Formatting of the report is described in a separate
section of this document dealing with curve format.
Opens the edit dialogue for formatting functions. See the separate section of this document
dealing with curve format for more details.
Converts chart format to a 3D display. The icon functions as a toggle switch between a 2D
and 3D display.
Click on this icon to control the depth of the 3D display using the mouse cursor. Clicking on
this icon automatically converts the display format to 3D, return to the 2D display via the 3D
icon button.
Double function icon allowing zooming of the complete curve.
Click on this icon to move the complete curve display using the mouse cursor. Clicking on
this icon automatically converts the display format to 3D, return to the 2D display via the 3D
icon button.
Click on this icon to rotate the complete curve display using the mouse cursor. Clicking on
this icon automatically converts the display format to 3D, return to the 2D display via the 3D
icon button.
Clicking on this icon will return the function of the mouse cursor to normal thus allowing use of
the normal zooming functions etc. in 3D displays.
2.4.3.4.
Calculations in Time Drive
The calculation modes for curves and activities are generally embedded in the method and are
described above and in detail in the Calculation section.
UVS Software for
UVIKON 900/XL/XS
Manual Version 2.20, Oct. 2007
Page 77 of 202
UVS SOFTWARE for UVIKON 900 / XS /XL
USER MANUAL
Recalculation after, for example, changing a Peak Detection parameter is possible at any
time by clicking on the Calculator icon followed by selection of the parameter within the
dialogue window.
2.4.3.5.
Time Drive Measurement Example
Measurement of a sample.
Select the method to be used and set the number of samples to 1.
Start the measurement by pressing the Start button and you will be prompted to insert the sample and
click on OK to start the measurement. Insert the sample in the correct position and click on OK. The
unit will now start to measure. The final windows will look like this:
The curve display is plotted during the acquisition and can be used to monitor the progress of the
measurement. If the auto-calculation box has been checked, the regression line for the Activity
calculation will be drawn immediately upon completion of the run.
Various tab functions in the acquisition screen allow quick overviews of the results in table format (as
shown below), activity etc.
UVS Software for
UVIKON 900/XL/XS
Manual Version 2.20, Oct. 2007
Page 78 of 202
UVS SOFTWARE for UVIKON 900 / XS /XL
USER MANUAL
Note:
If you have programmed more than one sample you will be prompted for the next
sample after each sample has been measured. The final appearance of the screen
remains unchanged.
If you repeat the measurement you will always measure the selected number of samples (1 in our
example) until you change the Samples parameter. The system will prompt if the previously run
sample data has not been saved before starting a new run:
Click on OK to start the next acquisition run or on Cancel to return to the original data set.
Printing
Click on the Print icon to obtain a preview of the printed report, which will always contain all
measurements. If the result is acceptable the report can be printed by clicking on the Print icon on the
preview page.
UVS Software for
UVIKON 900/XL/XS
Manual Version 2.20, Oct. 2007
Page 79 of 202
UVS SOFTWARE for UVIKON 900 / XS /XL
USER MANUAL
Saving
Click on the Save icon and the system will prompt for a file name:
Enter the file name and click on OK.
UVS Software for
UVIKON 900/XL/XS
Manual Version 2.20, Oct. 2007
Page 80 of 202
UVS SOFTWARE for UVIKON 900 / XS /XL
USER MANUAL
2.4.4. Auto Rate Assay
The Autorate Assay mode is only possible in conjunction with an automatic cell changer. Operation is
basically identical with that of Time Drive.
2.4.4.1.
The Acquisition Screen in Autorate Assay
Select “Autorate Assay” from the main menu to obtain the following display:
This is the acquisition window from which all measurements are started. In this window the following
parameters must be selected before starting a measurement:
Method to be used for the acquisition. The method contains all parameters necessary for the
execution of the measurement.
Numbers of samples to be measured.
Autozero at start of measurement.
Load previous saved data from a report
UVS Software for
UVIKON 900/XL/XS
Manual Version 2.20, Oct. 2007
Page 81 of 202
UVS SOFTWARE for UVIKON 900 / XS /XL
USER MANUAL
2.4.4.1.1.
Run parameters
The run parameters are entered in the “Method” panel and in the “Photometer control” panel:
Samples
Defines the number of samples to be analysed.
Checkbutton
Press this button to accept the number of samples, the sample grid will also
created.
Autozero
Defines whether an autozero should be executed before starting a
measurement.
Method
The method box contains the name of the method and, directly adjacent, the
actual revision number of that method. The method is selected from a
separate window which is opened by clicking on the button adjacent to the
revision box:
This window contains a list of all available methods including all revisions of
the method and the date of last modification. Selection is made by
highlighting the required line and then clicking on OK.
The order of Methods may be displayed by usage or alphabetically.
Wavelength
UVS Software for
UVIKON 900/XL/XS
A certain wavelength may be chosen manually and set immediately in order
to allow rapid monitoring of the unit.
Manual Version 2.20, Oct. 2007
Page 82 of 202
UVS SOFTWARE for UVIKON 900 / XS /XL
USER MANUAL
2.4.4.1.2.
System Status
The lower right section of the display contains the actual status of the system and displays the
following parameters:
Current sample being measured.
No. of Readings
Remaining Time (also as progress bar)
Actual wavelength.
Actual absorbance value.
Temperature (where applicable).
2.4.4.2.
The Method in Autorate Assay
Click on the Method button in the upper left corner to open the Method window:
The left-hand window contains a list of all existing methods including revisions and an indication of
whether they have been used already or not.
UVS Software for
UVIKON 900/XL/XS
Manual Version 2.20, Oct. 2007
Page 83 of 202
UVS SOFTWARE for UVIKON 900 / XS /XL
USER MANUAL
Caution:
If measurements have been used, the method will be locked and can no longer be
changed. However, they can be used for later measurements or modified with revision
control. Such methods are indicated by a “ * ” in the “ used ” column list.
A new method can be created from within the method section by using the '+' button. In order to do
this it is first necessary to uncheck the write-protect checkbox.
The system will first prompt for name under which the new method will be saved. Once this has been
defined all other parameters can then be entered.
2.4.4.2.1.
Acquisition parameters
Delay time
The instrument will wait for the selected delay time after the MEASURE key is
pressed to start the actual measurement.
Averaging time
Defines the time the instrument uses to collect data for calculation of a mean
value for one reading. A long averaging time is useful to reduce noise when
measuring at high absorbance values.
Measure time
Defines the actual duration of the measurement in minutes.
Sampling rate
Defines the number of data points per minute for the measurement.
Autozero at start
Defines whether an autozero is to be executed beforeeach sample run.
Auto Calculation
If checked, the calculation for peak detection, smoothing etc. starts automatically
after acquisition using the defined parameters.
Calculation mode Calculation and curve portrayal can be in either Absorbance or Transmission
units.
Wavelength mode Defines the amount and the wavelengths to be used during measurement.
2.4.4.2.2.
Common Parameters
The right-hand panel contains common parameters, which are required for every system and user
method. They will be stored and recalled along with all other parameters.
Lamp change
This parameter defines the lamp change wavelength. The deuterium lamp is used
for all wavelengths below the lamp change wavelength. The tungsten halogen
lamp is used for all wavelengths above the lamp change wavelength.
Tungsten lamp
When checked, the tungsten lamp will be switched on and used according to the
setting for the lamp change.
Deuterium lamp
When checked, the deuterium lamp will be switched on and used according to the
setting for the lamp change.
Filter change (1-5) This parameter defines the wavelength used to switch the filter.
Bandwidth
Selects the spectral bandwidth of the spectrophotometer.
Cell changer
Defines the operating mode of the cell changer (if fitted).
UVS Software for
UVIKON 900/XL/XS
Manual Version 2.20, Oct. 2007
Page 84 of 202
UVS SOFTWARE for UVIKON 900 / XS /XL
USER MANUAL
2.4.4.2.3.
Calculation
The calculation selection permits definition of the mode of calculation to be used. The user can select
between either absorbance or transmission.
2.4.4.2.4.
Wavelength
A maximum of six different wavelengths may be chosen. The λ of the wavelengths can be defined in
the rows below.
2.4.4.2.5.
Curve Parameters in the Auto Rate Assay Method
Opens an edit dialogue for defining curve parameters and related formatting.
In Auto Rate Assay the curve parameters can be linked to a method and then define the appearance
and properties of the curve such as colours, overlay format, scaling etc.
Functions defined here will be included and stored with the method and thus used for any acquisition
executed utilising that method.
Formatting options using this function are described in a separate section in this document.
UVS Software for
UVIKON 900/XL/XS
Manual Version 2.20, Oct. 2007
Page 85 of 202
UVS SOFTWARE for UVIKON 900 / XS /XL
USER MANUAL
2.4.4.2.6.
Calculation Parameters in the Auto Rate Assay Method
Click on this icon to open the calculation dialogue window for the method:
The calculation functions shown in the dialogue above are described in more detail in the section on
Calculation within this document. Functions defined above will be included and stored with the method
and thus used for any acquisition executed utilising that method.
UVS Software for
UVIKON 900/XL/XS
Manual Version 2.20, Oct. 2007
Page 86 of 202
UVS SOFTWARE for UVIKON 900 / XS /XL
USER MANUAL
2.4.4.3.
The Report Screens in Autorate Assay
2.4.4.3.1.
The “Overview” Report Screen
Click on the Report button in the upper left corner to open the Report window:
The display obtained is the “Overview” screen, clicking on the “Chart” tab will display the chart as the
main item which can be manipulated or edited as required.
The tabs for Activity and Peak Detection show a display in table form for the respective parameters
The left-hand window contains a list of all available reports, the right-hand window contains the results
in the upper section and the main parameters for the measurement in the lower part. Each report can
be viewed by scrolling through the left-hand list.
2.4.4.3.2.
Printing
Click on the Print icon to obtain a print preview of the selected report, which will always contain all
measurements. The report can be printed by clicking on the Print icon on the preview page.
UVS Software for
UVIKON 900/XL/XS
Manual Version 2.20, Oct. 2007
Page 87 of 202
UVS SOFTWARE for UVIKON 900 / XS /XL
USER MANUAL
2.4.4.3.3.
Importing a report from the database
Click on the import icon to access earlier reports in the archived database. A dialogue
window for selection of the database will be opened:
2.4.4.3.4.
Filtering the report list
The report list in the left window will become very long with time and it may be necessary to filter the
list so that only files of interest are shown to a user. This is carried out using the Select Report icon.
Click on the Select Report icon and a dialogue window appears, which allows selection of a
view by date, method, user or name:
The appropriate checkboxes must be checked and, where applicable, either a date or name selected.
Clicking on OK will show only those reports which match with selected criteria shown in the list of
available reports.
UVS Software for
UVIKON 900/XL/XS
Manual Version 2.20, Oct. 2007
Page 88 of 202
UVS SOFTWARE for UVIKON 900 / XS /XL
USER MANUAL
2.4.4.3.5.
The “Chart” Report Screen
Clicking on the “Chart” tab will open a new screen containing the curve in a form which can be edited:
Navigation arrows are available to move between the various reports contained in the list without the
need to return to the Overview screen.
The name of the currently displayed curve set including the revision is shown in the box display
immediately above the curve display.
In Chart mode a range of new functions is available to the user for manipulating the presentation and
properties of the current curve.
Similar to the function “Peak Picking” in WL Scan, the new function “Time Picking” allows selecting the
time (using the hand symbol). With a right mouse click the absorbance values can be selected at the
cursor time position.
The manually selected list can be included into the document by selection the print option “Add peak
detection to document”. In this case a list including all selected values is inserted above the graphics.
2.4.4.3.6.
“Chart” Report Screen Functions
A graphics toolbar is available within the Chart report screen:
The use of the icons in the graphics toolbar allow direct manual manipulation of the currently displayed
chart. The function of the individual icons is described briefly below:
UVS Software for
UVIKON 900/XL/XS
Manual Version 2.20, Oct. 2007
Page 89 of 202
UVS SOFTWARE for UVIKON 900 / XS /XL
USER MANUAL
Shows position of values on X- and Y-axis and allows to manually pick peaks and to add,
edit or delete comments.
Opens the calculation dialogue window.
Exports a curve to the Windows clipboard for further processing.
Prints the curve as a single sheet report. Formatting of the report is described in a separate
section of this document dealing with curve format.
Opens the edit dialogue for formatting functions. See the separate section of this document
dealing with curve format for more details.
Converts chart format to a 3D display. The icon functions as a toggle switch between a 2D
and 3D display.
Click on this icon to control the depth of the 3D display using the mouse cursor. Clicking on
this icon automatically converts the display format to 3D, return to the 2D display via the 3D
icon button.
Double function icon allowing zooming of the complete curve.
Click on this icon to move the complete curve display using the mouse cursor. Clicking on
this icon automatically converts the display format to 3D, return to the 2D display via the 3D
icon button.
Click on this icon to rotate the complete curve display using the mouse cursor. Clicking on
this icon automatically converts the display format to 3D, return to the 2D display via the 3D
icon button.
Clicking on this icon will return the function of the mouse cursor to normal thus allowing use of
the normal zooming functions etc. in 3D displays.
2.4.4.4.
Calculations in Autorate Assay
The calculation modes for curves and activities are generally embedded in the method and are
described above and in detail in the Calculation section.
UVS Software for
UVIKON 900/XL/XS
Manual Version 2.20, Oct. 2007
Page 90 of 202
UVS SOFTWARE for UVIKON 900 / XS /XL
USER MANUAL
Recalculation after, for example, changing a Peak Detection parameter is possible at any
time by clicking on the Calculator icon followed by selection of the parameter within the
dialogue window.
UVS Software for
UVIKON 900/XL/XS
Manual Version 2.20, Oct. 2007
Page 91 of 202
UVS SOFTWARE for UVIKON 900 / XS /XL
USER MANUAL
2.4.5. Wavelength Program
Wavelength Program mode permits measurements at different wavelengths and also calculations
such as wavelength ratios to be made automatically for a set of samples.
The first samples measured can be defined as Blanks and the values of these samples will be
averaged and then subtracted from each wavelength measurement of that particular sample.
2.4.5.1.
The Acquisition Screen in Wavelength Program
Select “Wavelength Program” from the main menu to obtain the following display:
This is the acquisition window from which all measurements are started. In this window the following
parameters must be selected before starting a measurement:
Method to be used for the acquisition. The method contains all parameters necessary for the
execution of the measurement.
Numbers of samples to be measured.
Number of blank samples, measured as the first samples.
Autozero at start of measurement.
UVS Software for
UVIKON 900/XL/XS
Manual Version 2.20, Oct. 2007
Page 92 of 202
UVS SOFTWARE for UVIKON 900 / XS /XL
USER MANUAL
2.4.5.1.1.
Run parameters
The run parameters are entered in the “Method” panel and in the “Photometer control” panel:
Samples
Defines the number of samples to be analysed.
Checkbutton
Press this button to accept the number of samples, the sample grid will also
created.
Blank Samples
Defines the number of blank samples to be measured, blank samples are
always expected at the start of a run. The value of the measured blank is
subtracted from the actual measured value of the sample prior to calculation
of concentration etc. If more than one blank is defined then the system
calculates the average blank value for the blanks and then subtracts this
from the actual measured sample values.
Method
The method box contains the name of the method and, directly adjacent, the
actual revision number of that method. The method is selected from a
separate window which is opened by clicking on the button adjacent to the
revision box:
This window contains a list of all available methods including all revisions of
the method and the date of last modification. Selection is made by
highlighting the required line and then clicking on OK.
The order of Methods may be displayed by usage or alphabetically.
Wavelength
UVS Software for
UVIKON 900/XL/XS
A certain wavelength may be chosen manually and set immediately in order
to allow rapid monitoring of the unit.
Manual Version 2.20, Oct. 2007
Page 93 of 202
UVS SOFTWARE for UVIKON 900 / XS /XL
USER MANUAL
2.4.5.1.2.
System Status
The lower right section of the display contains the actual status of the system and displays the
following parameters:
Current sample being measured.
Actual wavelength.
Actual absorbance value.
Temperature (where applicable).
2.4.5.2.
The Method in Wavelength Program
Click on the Method button in the upper left corner to open the Method window:
UVS Software for
UVIKON 900/XL/XS
Manual Version 2.20, Oct. 2007
Page 94 of 202
UVS SOFTWARE for UVIKON 900 / XS /XL
USER MANUAL
The left-hand window contains a list of all existing methods including revisions and an indication of
whether they have been used already or not.
Caution:
If measurements have been used, the method will be locked and can no longer be
changed. However, they can be used for later measurements or modified with revision
control. Such methods are indicated by a “ * ” in the “ used ” column list.
A new method can be created from within the method section by using the '+' button. In order to do
this it is necessary to uncheck the write-protect checkbox.
The system will first prompt for name under which the new method will be saved. Once this has been
defined all other parameters can then be entered.
2.4.5.2.1.
Acquisition parameters
Delay time
The instrument will wait for the selected delay time after the MEASURE key is
pressed to start the actual measurement.
Averaging time
Defines the time the instrument uses to collect data for calculation of a mean
value for one reading. A long averaging time is useful to reduce noise when
measuring at high absorbance values.
2.4.5.2.2.
Common parameters
The right-hand panel contains common and calculations parameters, which are required for every
system and user method. They will be stored and recalled along with all other parameters:
Lamp change
This parameter defines the lamp change wavelength. The deuterium lamp is used
for all wavelengths below the lamp change wavelength. The tungsten halogen
lamp is used for all wavelengths above the lamp change wavelength.
Tungsten lamp
When checked, the tungsten lamp will be switched on and used according to the
setting for the lamp change.
Deuterium lamp
When checked, the deuterium lamp will be switched on and used according to the
setting for the lamp change.
Filter change (1-5) This parameter defines the wavelength used to switch the filter.
Bandwidth
Selects the spectral bandwidth of the spectrophotometer.
Cell changer
Defines the operating mode of the cell changer (if fitted).
UVS Software for
UVIKON 900/XL/XS
Manual Version 2.20, Oct. 2007
Page 95 of 202
UVS SOFTWARE for UVIKON 900 / XS /XL
USER MANUAL
2.4.5.2.3.
Wavelength Program calculations
The right section of the method screen allows definition of the wavelengths to be used and also the
calculation modes:
The required number of both calculations and wavelengths to be used must first be defined using the
two spin boxes at the top of each entry window. This definition will open the appropriate number of
lines where the actual values can be entered directly:
Calculation:
Decimals:
Wavelengths are defined for calculation purposes as W(n) or w(n) respectively, where
(n) corresponds to actual number for a given wavelength as shown in the lower
window. In the example above the following calculations will be performed:
1.
Wavelength number 1, e.g. at 400 nm is added to
Wavelength 2.
2.
Wavelength number 3, e.g. at 600 nm, is added to
Wavelength 4
3.
Wavelength number 4, e.g. at 700 nm is divided by
Wavelength 1
4.
Wavelength number 2, e.g. at 500 nm, is multiplied by
Wavelength 3
The number of decimal places to be used for the calculation can also be defined. This
number should generally be consistent with the actual measured result, e.g. by
measurements to 4 decimal places, selection of a much higher number for the
calculation result will not increase the accuracy of a measurement or result and could
produce rounding errors.
UVS Software for
UVIKON 900/XL/XS
Manual Version 2.20, Oct. 2007
Page 96 of 202
UVS SOFTWARE for UVIKON 900 / XS /XL
USER MANUAL
2.4.5.2.4.
Calculation
The calculation selection permits definition of the mode of calculation to be used, the user can select
between either absorbance or transmission.
2.4.5.2.5.
Audit Trail in Wavelength Program Method
Click on the Audit Trail icon to view the audit trail window for a method.
2.4.5.3.
The Report Screen in Wavelength Program
Click on the Report button in the upper left corner to open the Report window:
The left-hand window contains a list of all available reports, the right-hand window contains the results
in the upper section and the main parameters for the measurement in the lower part. Each report can
be viewed by scrolling through the left-hand list. Data can be viewed in the right-hand window by
scrolling across the table using the mouse.
UVS Software for
UVIKON 900/XL/XS
Manual Version 2.20, Oct. 2007
Page 97 of 202
UVS SOFTWARE for UVIKON 900 / XS /XL
USER MANUAL
2.4.5.3.1.
Printing
Click on the Print icon to obtain a print preview of the selected report, which will always contain all
measurements. The report can be printed by clicking on the Print icon on the preview page.
2.4.5.3.2.
Importing a report from the database
Click on the import icon to access earlier reports in the extracted database. A dialogue
window for selection of the database will be opened:
2.4.5.3.3.
Filtering the report list
The report list in the left window will become very long with time and it may be necessary to filter the
list, so that only files of interest are shown to a user, using the Select Report icon:
Click on the Select Report icon and a dialogue window appears, which allows selection of a
view by date, method, user or name:
The appropriate checkbox must be checked and, where applicable, either a date or name selected.
Clicking on OK will cause only those reports which match with selected criteria shown in the list of
available reports.
UVS Software for
UVIKON 900/XL/XS
Manual Version 2.20, Oct. 2007
Page 98 of 202
UVS SOFTWARE for UVIKON 900 / XS /XL
USER MANUAL
2.4.5.3.4.
Audit Trail in Wavelength Program Report
Click on the Audit Trail icon to view the audit trail window for a report:
2.4.5.4.
Calculations in Wavelength Program
Wavelength Program contains, alongside the basic wavelength calculations described above, two
additional calculation methods for the final result determination:
Blank
Factor
In Wavelength Program the Blank and Factor calculations can be executed automatically without the
need to create a calibration file:
Blank
The measured values for sample blank at each wavelength is subtracted from the
measured value of each measured sample at the same wavelength.
Factor
The actual value obtained from the measurement is always multiplied by the factor
parameter. This is accessible by clicking on the Parameter tab in the acquisition
screen.
The actual calculation is based on the following formula at any given wavelength:
RW = F * (VM sample – VM blank)
Where RW = Result for wavelength W, F = Factor and VM represents the measured values obtained
for sample and blank respectively. The value RW is then used for the defined calculations for the
individual wavelengths.
Recalculation after, for example, changing the factor value is possible at any time by clicking
on the Calculator icon before the data has been saved..
UVS Software for
UVIKON 900/XL/XS
Manual Version 2.20, Oct. 2007
Page 99 of 202
UVS SOFTWARE for UVIKON 900 / XS /XL
USER MANUAL
2.4.5.5.
Wavelength Program Measurement Example
Wavelength Program measurement of 4 samples using an optional automatic 6+6 cell changer. Four
wavelengths are used (400, 500, 600 and 700 nm). The first sample is a Blank.
Define the method to be used:
Click on the Acquisition tab in the upper left corner and select a method by clicking on the button next
to the method window in the lower left of the screen:
UVS Software for
UVIKON 900/XL/XS
Manual Version 2.20, Oct. 2007
Page 100 of 202
UVS SOFTWARE for UVIKON 900 / XS /XL
USER MANUAL
Set the number of samples to 4 and the Blank Samples to 1. Enter descriptions if required and insert
the Blank sample in position 1 in the cell changer and the four samples in positions 2 to 5. Start the
measurement by pressing the Start button. The measured values will be displayed during acquisition:
UVS Software for
UVIKON 900/XL/XS
Manual Version 2.20, Oct. 2007
Page 101 of 202
UVS SOFTWARE for UVIKON 900 / XS /XL
USER MANUAL
The final window will look like this:
Note:
If you are not using a cell changer, you will be prompted for the next sample after each
sample has been measured. The final appearance of the screen remains unchanged.
If you repeat the measurement you will always measure the selected number of samples (3 in our
example) until you change the Samples parameter. The system will prompt if the previously run
sample data has not been saved before starting a new run:
Click on OK to start the next acquisition run or on Cancel to return to the original data set.
UVS Software for
UVIKON 900/XL/XS
Manual Version 2.20, Oct. 2007
Page 102 of 202
UVS SOFTWARE for UVIKON 900 / XS /XL
USER MANUAL
Printing
Click on the Print icon to obtain a preview of the printed report, which will always contain all
measurements. If the result is acceptable the report can be printed by clicking on the Print icon on
the preview page.
Saving
Click on the Save icon and the system will prompt for a file name:
Enter the file name and click on OK.
UVS Software for
UVIKON 900/XL/XS
Manual Version 2.20, Oct. 2007
Page 103 of 202
UVS SOFTWARE for UVIKON 900 / XS /XL
USER MANUAL
2.5. CALCULATIONS
The UVS software contains various calculation possibilities depending on the selected measuring
mode.. These calculations are accessible using the Calculator icon.
2.5.1. Curve Functions
Calculations based on charts can be executed in one of two ways:
Post-run by clicking on the Report tab in the report section and then the calculator icon in order to
obtain the calculation dialogue.
Definition of the required calculations as a part of the method in which case they can be executed
automatically at the end of the run.
Click on the calculator icon in either the Method or Report screen in order to obtain the calculation
dialogue:
The functions available for manipulation of curve data are the following:
th
Derivatives up to 4 derivative
Cross-points
Smoothing
Mathematical calculations on a complete curve
Peak detection
Activity
UVS Software for
UVIKON 900/XL/XS
Manual Version 2.20, Oct. 2007
Page 104 of 202
UVS SOFTWARE for UVIKON 900 / XS /XL
USER MANUAL
2.5.1.1.
Derivative
The software allows direct calculation of derivative orders 1 to 4 for Wavelength Scan and Time Drive
data. A separate optimised calculation algorithm is used for each order therefore the quality of the
result will be much improved if you calculate, for example, a fourth derivative directly from a loaded
zero order curve.
To display a derivative click on the “Show derivative” checkbox, which will open the spinbox for
selection of the required order.
Set the required derivative order in the spinbox and click on OK. The curve display will automatically
change to show the new derivative curve.
2.5.1.2.
Show cross-points
Selecting the Show cross-points parameter will display each data point collected on the curve as
shown in the zoomed example below:
2.5.1.3.
Smoothing
A filter can be introduced in the data acquisition in order to reduce noise. Smoothing can be selected
with as an averaging or a Bezier function.
High smoothing will reduce noise, however high smoothing will also reduce the amplitude of the peaks
obtained and can also result in distortion of peak shape.
Average
This is a rolling average function based on 3 calculated points. Only Y values are
calculated.
P(x) = [x(n-1)+x(n)+x(n+1)] / 3
UVS Software for
UVIKON 900/XL/XS
Manual Version 2.20, Oct. 2007
Page 105 of 202
UVS SOFTWARE for UVIKON 900 / XS /XL
USER MANUAL
Bezier
A Bezier curve is an approximation to a curve which would pass through all the control
points. The method used here for defining such a curve approximation is called the
Bezier-Bernstein approximation.
Savitzky-Golay
The fundamental idea is to fit a different polynomial to the data surrounding each data
point. The smoothed points are computed by replacing each data point with the value
of its fitted polynomial.
For the smoothing functions “Average” and “Savitzky-Golay” three smoothing degrees
can be selected:
Low – Medium – High
2.5.1.4.
Calculation
The calculation function allows definition of mathematical functions which can be used to modify the
curve data. “S” is used to denote the sample itself and calculations are defined simply using “S” and
the appropriate factor (F) and signs:
Addition:
Enter
F+S
Subtraction:
Enter
S-F
Multiplication:
Enter
F*S
Division:
Enter
S/F
For example it is also possible to subtract an offset from each point in the curve and then double the
signal level and this would be programmed as follows:
Click on the Calculation checkbox and then enter the required formula, in this example the formula
would simply be 2*(S-0.2).
Caution
Please note that spaces are not permitted in the formula.
2.5.1.5.
Peak Detection
This calculation mode can be used with the system methods: Wavelength Scan, Time Drive and Auto
Rate Assay.
Peak detection can be linked to a method and carried out during or after measurement. To activate
peak detection select “Peak detection” in the calculation parameter editor window.
A peak is detected when the slope of the curve changes from positive to negative, a valley is detected
when the slope changes from negative to positive.
After selecting “Peak detection” it is possible to set the following parameters:
Min. Abs
The Min. Abs. parameter defines the absolute minimum value for a
peak or valley to be detected, any peak or value with an absorbance
value lower than the defined value will be ignored.
Threshold
The threshold is the difference in height on the Y-axis between two
peaks or valleys. If the difference between valley and peak is lower
than the set threshold then the peaks/valleys will not be detected.
UVS Software for
UVIKON 900/XL/XS
Manual Version 2.20, Oct. 2007
Page 106 of 202
UVS SOFTWARE for UVIKON 900 / XS /XL
USER MANUAL
Peak / Valley
The selection defines whether the calculation is to be made for peaks
only, valleys only or both peaks and valleys.
If peak detection has been selected the results can be seen both in the peak detection table and
directly on the curve itself:
2.5.2. Activity
This calculation mode can be used in the system methods Time Drive and Auto Rate Assay. An
activity of the second reaction can be used exclusively in the system method Auto Rate Assay. It is
used to calculate the activity of reactions. Calculation of the activity is made using a linear regression
model.
The calculation can be embedded in the method such that it is performed automatically at run end or it
can be executed manually after acquisition.
Selection of the parameters for the Activity calculation is made, as above, by clicking on the Calculator
icon in either the Method or Report screens. Click on the Calculator icon to obtain the appropriate
dialogue box and then click on the Activity checkbox.
UVS Software for
UVIKON 900/XL/XS
Manual Version 2.20, Oct. 2007
Page 107 of 202
UVS SOFTWARE for UVIKON 900 / XS /XL
USER MANUAL
It is possible to define the section of the curve over which the calculation is to be made, a factor and
the units for the Activity value:
It is now possible to set directly the following parameters:
From
Defines the lower starting point on the curve time-scale for the range of the Activity
calculation.
to
Defines the upper starting point on the curve time-scale for the range of the Activity
calculation.
Factor
Activity is calculated by multiplying the slope of the regression line (Absorbance
change per minute) by the factor (F).
Units
Defines the units to used for reports etc., e.g. Abs/min., µmol/min
UVS Software for
UVIKON 900/XL/XS
Manual Version 2.20, Oct. 2007
Page 108 of 202
UVS SOFTWARE for UVIKON 900 / XS /XL
USER MANUAL
Using the above example the curve obtained would appear so:
All curve calculation functions described above can also be used to modify curves used for the activity
calculations.
For example it would be possible to subtract a pre-determined Blank value from the curve and then
multiply it by a different factor, in this example the formula could be 2*(S-0.2).
This would give the following result:
UVS Software for
UVIKON 900/XL/XS
Manual Version 2.20, Oct. 2007
Page 109 of 202
UVS SOFTWARE for UVIKON 900 / XS /XL
USER MANUAL
An example for defining two activities would appear so:
Move bounds
by cursor
The bounds for activity calculation may be moved by the cursor with real-time calculation. Activities
can be calculated with a mathematical function.
UVS Software for
UVIKON 900/XL/XS
Manual Version 2.20, Oct. 2007
Page 110 of 202
UVS SOFTWARE for UVIKON 900 / XS /XL
USER MANUAL
2.5.2.1.
Activity Results
The results of the activity calculation over the requested time period can be viewed by clicking on the
Activity tab in the Report screen. This displays the actual activity value for the sample plus the
calculated regression line and also the correlation coefficient.
In addition the Table tab will show the actual activity at each point on the curve with respect to the last
value. For the point n on the curve at a time tn and an absorbance value of Absn the activity is
calculated as
Activity = (Absn – Abs(n-1) ) / (tn – t(n-1) )
2.5.3. Concentration Factor
This is the most simple calculation method for concentration and is used in Fixed Wavelength. The
concentration factor must be determined in advance if this calculation is to be used. The system uses
this factor and performs the following calculation:
Concentration = Measured Absorbance value x Factor
The factor is entered as a parameter in the Acquisition screen. Click on the parameter tab to enter the
screen and then enter the required value for the factor.
In this case no calibration file is required and the factor used is recorded in the report.
2.5.4. Wavelength Program functions
The Wavelength Program calculation functions apply only to this mode of operation and are described
in the Wavelength Program section of this document. One more parameter appears in the calculation
column.
2.5.5. Linear Calibration
The Calibration mode is used to create standard calibration files for the Fixed Wavelength mode. The
Calibration uses a standard Fixed Wavelength method which must be created before running
Calibration mode.
Method creation is possible in both the Fixed Wavelength and Calibration method screens. A method
can be used to create as many calibration files as needed, the method and revision used is always
linked to the calibration and is traceable.
The Calibration procedure is best explained using an example. In this example we will use a blank and
two standards. The calibration can also be made using the cell changer.
2.5.5.1.
Creating a Calibration File
Select the Calibration mode by clicking on the Calibration icon in the main screen and insert the blank
and the two standards in the cell changer at positions 1, 2 and 3.
UVS Software for
UVIKON 900/XL/XS
Manual Version 2.20, Oct. 2007
Page 111 of 202
UVS SOFTWARE for UVIKON 900 / XS /XL
USER MANUAL
Enter the number of samples (3), the required method, a description of each sample and the
concentration in the main Acquisition screen.
Clicking on the Parameter tab will allow entry of the units to be used for the result and also definition
of an additional multiplier factor which will be used to multiply the value obtained to give the result..
The final screen will look like this:
Click on Start to start the acquisition. Once completed the system will automatically prompt for the
type of calibration required. Two possibilities are available using either a linear or quadratic
regression:
UVS Software for
UVIKON 900/XL/XS
Manual Version 2.20, Oct. 2007
Page 112 of 202
UVS SOFTWARE for UVIKON 900 / XS /XL
USER MANUAL
The Calibration parameter dialogue box can be recalled at any time by clicking on the calculation icon.
Click the Linear checkbox and then save the calibration under the name required.
UVS Software for
UVIKON 900/XL/XS
Manual Version 2.20, Oct. 2007
Page 113 of 202
UVS SOFTWARE for UVIKON 900 / XS /XL
USER MANUAL
Values may be invalidated by double-clicking them. Invalidated values and their respective measure
points in the Chart are marked red.
The data for a calibration can be viewed at any time by selecting the required report in the Report
screen. Click on the Chart icon and the calibration curve will be displayed together with the regression
values:
UVS Software for
UVIKON 900/XL/XS
Manual Version 2.20, Oct. 2007
Page 114 of 202
UVS SOFTWARE for UVIKON 900 / XS /XL
USER MANUAL
2.5.5.2.
Using a Calibration Curve
The calibration curve can now be used to measure a series of unknown samples:
Exit the Calibration mode and select Fixed Wavelength and then select the Method screen. Here you
should click the Active checkbox in the Concentration and then select the required Calibration as
Reference data. Save this method and the screen should look like this:
Select the Acquisition screen, insert the samples in the cell changer and set the number of samples to
the appropriate value.
Check whether an Autozero is required before starting the measurement If so, click the Autozero
checkbox in the Acquisition screen
Caution
Before executing the Autozero ensure that the cell changer (if used) is actually in the
correct position. The Autozero will be executed at the current position which may not
be position 1. Measurements with the cell changer always start from position 1.
Press Start, after measurement the Acquisition and Parameter screens obtained are shown below.
The main screen contains the measured absorbance values, the result and the calculated
concentration values:
UVS Software for
UVIKON 900/XL/XS
Manual Version 2.20, Oct. 2007
Page 115 of 202
UVS SOFTWARE for UVIKON 900 / XS /XL
USER MANUAL
The Parameter screen contains the value used for the Factor used to obtain the result, the formula
used to calculate the actual concentration and also the units (e.g.: µg/ml, mg/ml, etc.) may be entered:
UVS Software for
UVIKON 900/XL/XS
Manual Version 2.20, Oct. 2007
Page 116 of 202
UVS SOFTWARE for UVIKON 900 / XS /XL
USER MANUAL
2.5.6. Quadratic Calibration
(Calculation of concentration by quadratic regression using standards)
The practical use of this calculation mode is almost identical to linear interpolation (see above). One
additional parameter is used with the following formula:
Y = Ax2 + Bx + C
The process of obtaining the calibration data is identical for both the Linear and Quadratic calibration
methods until selection of the calibration order is made.
Select the Quad function in the Calibration parameter dialogue:
The calibration curve will now look like this:
UVS Software for
UVIKON 900/XL/XS
Manual Version 2.20, Oct. 2007
Page 117 of 202
UVS SOFTWARE for UVIKON 900 / XS /XL
USER MANUAL
2.6. REPORTING
This section deals only with the possibilities for formatting and printing reports in the UVS software.
The main focus is on the treatment of curves since all table format printouts are pre-defined.
2.6.1. Printing
The UVS software offers several possibilities for printing and formatting the various reports and data
available from the system. Individual print-outs are possible for method parameters, individual results
e.g. peak detection, complete reports and curve data. Each window contains its own Printer icon
which gives a preview of the print-out.
Within the preview page the user also has the possibility to save reports under user-defined names
and these reports can be viewed using the viewer of the UVS software. Click on the Print icon in the
report screens and you will be prompted for selection of the report type required:
The window appears – it is printing dialogue.
UVS Software for
UVIKON 900/XL/XS
Manual Version 2.20, Oct. 2007
Page 118 of 202
UVS SOFTWARE for UVIKON 900 / XS /XL
USER MANUAL
Let's look at options available in this dialogue.
The "Printer" group: you can select a printer via which you want to print a report; set printer
properties, for example, printing quality; and choose print to file.
The "Pages" group: you can select which pages to print (all, current, selected range).
The "Copies" group: you can set how many copies to print. If Collate flag is set and you
choose to print several copies, at first one report copy is printed, then – the next etc. If flag is disabled,
several copies of the first page are printed, then – several copies of the second one etc.
The "Other" group:
UVS Software for
UVIKON 900/XL/XS
Manual Version 2.20, Oct. 2007
Page 119 of 202
UVS SOFTWARE for UVIKON 900 / XS /XL
USER MANUAL
- Print - you can select which pages to print. Variants: All pages, Even pages, Odd pages.
- Order - print pages in direct or reverse order (from last to first page).
- Duplex - handle duplex by default (report settings are used) or choose one of duplex options:
vertical, horizontal, simplex.
The "Print mode" group: you can select one of the printing modes.
- Default mode. The printer prints on the sheet defined in a report. One preview page is printed on one
sheet.
- Split big pages. This mode is useful if you need to print A3 report on A4 sheet. One preview page is
printed on several sheets. If you choose this mode, you have to choose the sheet size ("Print on
sheet") as well.
- Join small pages. This mode is useful if you want to print A4 report on A3 sheet. Two or more
preview pages are printed on one sheet. If you choose this mode, you have to choose the sheet size
("Print on sheet") as well.
- Scale mode. Report is printed on specified sheet. All report output is scaled. One preview page is
printed on one sheet. If you choose this mode, you have to choose the sheet size ("Print on sheet") as
well.
After clicking on ОК report printing begins. If the “Print to file” flag is selected, file name is
called. And report is saved to this file (file with *.prn extension. It contains a copy of information sent to
printer).
UVS Software for
UVIKON 900/XL/XS
Manual Version 2.20, Oct. 2007
Page 120 of 202
UVS SOFTWARE for UVIKON 900 / XS /XL
USER MANUAL
2.7. REPORT MANAGER
The report manager is supplied with an embedded designer, which can be called in design-time by
double-clicking on templates. The designer provides the user with all the tools for designing a report’s
appearance. It contains several toolbars, which can be docked wherever you want.
The report manager takes the contents of the templates and join it with data from the application.
Select the print report type here
The list of available print
reports is defined in the
template groups
The layout of the print
report is defined in the
templates
UVS Software for
UVIKON 900/XL/XS
Manual Version 2.20, Oct. 2007
Page 121 of 202
UVS SOFTWARE for UVIKON 900 / XS /XL
USER MANUAL
Pre-define the print report types in
the methods
2.7.1. Templates
Application
select
Database view
Template group
Application select:
UVS Software for
UVIKON 900/XL/XS
You can choose between different applications, like Fix
Wavelength,Wavelength program, Scan, ....
Manual Version 2.20, Oct. 2007
Page 122 of 202
UVS SOFTWARE for UVIKON 900 / XS /XL
USER MANUAL
Database view:
Here you can select and add template groups.
To add a template group, please uncheck „Write protect“ on the top and push
the + button on the task bar.
To delete a template group push the – button on the task bar.
Template group:
For inserting a template group at the selected cell push the right + button
under „Report Templates“.
To delete a template group click on the right – button under „Report Templates“
To add a new template, please first select your template cell and now click the right mouse button to
show the selection possibilities. Choose „Select Template“.
UVS Software for
UVIKON 900/XL/XS
Manual Version 2.20, Oct. 2007
Page 123 of 202
UVS SOFTWARE for UVIKON 900 / XS /XL
USER MANUAL
Confirm wtih OK Button
Now you can see the templates in one print report
Confirm all your actions with the green post-button on the top!
confirmation
All the template cells are listed in the approbiated application
(you can add as many as you want to).
To select one please go to the application and click on the
report button and then on the print symbol.
UVS Software for
UVIKON 900/XL/XS
Manual Version 2.20, Oct. 2007
Page 124 of 202
UVS SOFTWARE for UVIKON 900 / XS /XL
USER MANUAL
2.7.1.1.1.
How to print single curves in the applications Scan, Timedrive, Auto Rate Assay
Define the apperance of 2 curves in the print report in one diagram or only a single curve in each
diagram. To have only one curve in your diagramm click with the right mouse tab on your template
and select „Check/Uncheck as single“. Now you have a new diagram for each curve in your print
report (see on the bottom).
Single curves are only possible in the following applications:
Scan, Auto Rate Assay and Timedrive!
UVS Software for
UVIKON 900/XL/XS
Manual Version 2.20, Oct. 2007
Page 125 of 202
UVS SOFTWARE for UVIKON 900 / XS /XL
USER MANUAL
2.7.1.2.
Create and select templates and template blocks
Kind of Templates
To edit and create new templates click on the tab „Templates“ and uncheck „Write protect“
To create a new template click on the +Button on the task bar. Then you are asked to give the
template e name.
UVS Software for
UVIKON 900/XL/XS
Manual Version 2.20, Oct. 2007
Page 126 of 202
UVS SOFTWARE for UVIKON 900 / XS /XL
USER MANUAL
New template
Choose the template you want to edit and double-click on it. A new window will be opened and
shows the report designer.
UVS Software for
UVIKON 900/XL/XS
Manual Version 2.20, Oct. 2007
Page 127 of 202
UVS SOFTWARE for UVIKON 900 / XS /XL
USER MANUAL
Edit the report options with clicking on the right mouse and select edit. Define now the page options
like size, margins, orientation.
UVS Software for
UVIKON 900/XL/XS
Manual Version 2.20, Oct. 2007
Page 128 of 202
UVS SOFTWARE for UVIKON 900 / XS /XL
USER MANUAL
Click on „File“ and after then on „LoadInheritance“ to
select the list of report blocks.
Here you can choose your report blocks.They
appear in the report page in small blocks.
If there are objects with the same name are already in the template please select ‘Rename
duplicates’ :
UVS Software for
UVIKON 900/XL/XS
Manual Version 2.20, Oct. 2007
Page 129 of 202
UVS SOFTWARE for UVIKON 900 / XS /XL
USER MANUAL
Add all the blocks onto the sheet you want to and click the save button for save and exit.
UVS Software for
UVIKON 900/XL/XS
Manual Version 2.20, Oct. 2007
Page 130 of 202
UVS SOFTWARE for UVIKON 900 / XS /XL
USER MANUAL
To import or export your templates please click on the following buttons
the top.
in the task bar on
import
export
2.7.1.3.
List of some predefined report templates
Print extended document
This will give a complete report which contains also details of the complete method used and the
signature box for electronic signature confirmation.
Print small document
This is a report which contains only the basic results of a measurement and some other limited
information regarding measuring conditions etc.
Print table
This report contains only the table of the measurement values and other data linked to the table.
UVS Software for
UVIKON 900/XL/XS
Manual Version 2.20, Oct. 2007
Page 131 of 202
UVS SOFTWARE for UVIKON 900 / XS /XL
USER MANUAL
2.8. Report design editor
The report component is supplied with an embedded designer, which can be called in design-time by
double-clicking on the TfrxReport component. The designer provides the user with all the tools for
designing a report’s appearance, along with the ability of simultaneous previewing. Designer’s
interface meets up-to-date requirements. It contains several toolbars, which can be docked wherever
you want.
In the picture, denoted with numbers:
1 – report design work space;
2 – menu bar;
3 – toolbars;
4 – object's toolbar;
5 – report pages’ tabs;
6 – “Report tree” window;
7 – “Object inspector” window;
8 – “Data tree” window. You can drag elements to a report page from this window;
9 – rulers. When dragging a ruler to a report page, the guide line (which objects can be adhered to)
appears;
10 – status line.
UVS Software for
UVIKON 900/XL/XS
Manual Version 2.20, Oct. 2007
Page 132 of 202
UVS SOFTWARE for UVIKON 900 / XS /XL
USER MANUAL
2.8.1. Controls
2.8.1.1.
Key control
Keys
Description
Ctrl+O
“File|Open…” menu command
Ctrl+S
“File|Save” menu command
Ctrl+P
“File|Preview” menu command
Ctrl+Z
“Edit|Undo”menu command
Ctrl+C
“Edit|Copy” menu command
Ctrl+V
“Edit|Paste” menu command
Ctrl+X
“Edit|Cut” menu command
Ctrl+A
“Edit|Select all” menu command
Arrow, Tab
Move between objects
Del
Delete of the selected objects
Enter
Call the editor of the selected object
Shift+arrows
Modify sizes of the selected objects
Ctrl+arrows
Move the selected objects
Alt+arrows
The selected object is adhered to the nearest one in the specified
direction.
2.8.1.2.
Mouse control
Operation
Description
Left button
Selecting an object; pasting a new object; moving and resizing
objects. For the selected objects, you can perform zooming in and
out by dragging the red square in the left bottom corner of the
selected objects’ group.
Right button
Selected object's contextual menu.
Double-click
Object editor call. Double-clicking on the white space of a page
calls the “Page Settings” dialogue box.
Mouse wheel
Scrolling a report page.
Shift + left button
Toggle object's selection.
Ctrl + right button
If you hold the left mouse button during moving a mouse, a frame
appears. As soon as you release the mouse button, all the objects
captured in the frame would be selected. This operation can also
be performed by clicking on the blank space on the page, and
moving the mouse cursor to the required position.
Ctrl + right button
If you hold the left mouse button during moving a mouse, a frame
UVS Software for
UVIKON 900/XL/XS
Manual Version 2.20, Oct. 2007
Page 133 of 202
UVS SOFTWARE for UVIKON 900 / XS /XL
USER MANUAL
appears. As soon as you release the mouse button, all the objects
captured in the frame would be selected. This operation can also
be performed by clicking on the blank space on the page, and
moving the mouse cursor to the required position.
Alt + left button
If the “Text” object is selected, it edits its contents in place.
2.8.2. Toolbars
2.8.2.1.
Designer mode bar
The bar is integrated with the object bar and has the following buttons:
Icon
2.8.2.2.
Name
Description
Object selecting
A standard mode of operation, in which a cursor allows
to select objects, modify their sizes, etc.
Hand
Clicking on this icon allows dragging a report page.
Zoom
Clicking on the left button doubles the zoom (adds
100%), while clicking the right one zooms out by 100%.
When holding the left mouse button while dragging, the
selected area would be zoomed.
Text editor
Clicking on the “Text” object allows editing its contents
right on the report page. If you hold the left mouse
button when moving the cursor, the “Text” object
appears in the selected place, and then its editor
launches.
Format copying
The button becomes enabled when the “Text” object is
selected. When clicking on the “Text” object with the left
button, it copies formatting, which has the previously
selected “Text” object, into the object.
“Standard” toolbar
Icon
Name
New report
Creates a new blank report.
Open report
Opens an existing report from the file. Hotkeys
combination – “Ctrl+O.”
Save report
Saves a report into the file.
Hotkeys combination – “Ctrl+S.”
Preview
UVS Software for
UVIKON 900/XL/XS
Description
Performs report constructing and its previewing.
Hotkeys combination – “Ctrl+P.”
Manual Version 2.20, Oct. 2007
Page 134 of 202
UVS SOFTWARE for UVIKON 900 / XS /XL
USER MANUAL
New page
New dialogue form
Delete page
Page properties
Variables
Adds a new dialogue form into the report.
Deletes the current page.
Calls a dialogue with page properties.
Calls the report variable’s editor.
Cut
Cuts the selected objects into the clipboard. Hotkeys
combination – “Ctrl+X.”
Copy
Copies the selected objects into the clipboard. Hotkeys
combination – “Ctrl+C.”
Paste
Pastes objects from the clipboard.
Hotkeys combination – “Ctrl+V.”
Cancel
Undo the last operation.
Hotkeys combination – “Ctrl+Z.”
Repeat
Redo the last cancelled operation.
Hotkeys combination – “Ctrl+Y.”
Show grid
Shows the grid on the page. Grid pitch can be set in
designer options.
Grid alignment
During dragging or during modifying object sizes, the
coordinates/sizes are modified step-wise, according to
grid pitch.
Locate in grid
crosspoints
Modifies sizes/location of the selected objects so that
they would be located at grid crosspoints.
Zoom
2.8.2.3.
Adds a new page into the report.
Sets the zoom.
“Text” toolbar
Icon
Name
Description
No style
Style
Allows to select a style. To define the style list, call the
“Report|Styles…” menu item.
Arial
Font
Allows to select font name from the drop-down list. Stores
last five fonts previously used.
10
Font size
Allows to select font size from the drop-down list. Size can
also be entered manually.
Bold
Enables/disables font bolding.
Italic
Enables/disables italics.
Underline
Font
Font color
UVS Software for
UVIKON 900/XL/XS
Enables/disables font underlining.
Displays Font settings dialog.
Selects font color from the drop-down list.
Manual Version 2.20, Oct. 2007
Page 135 of 202
UVS SOFTWARE for UVIKON 900 / XS /XL
USER MANUAL
Highlighting
Shows the dialogue with highlighting attributes for the
selected “Text” object.
Text rotation
Allows to select text rotation.
Left alignment
2.8.2.4.
Icon
Center alignment
Enables text center alignment.
Right alignment
Enables text right alignment..
Justify by width
Enables text justifying by width.
Top alignment
Enables text top alignment..
Height alignment
Enables text height alignment..
Bottom alignment
Enables text bottom alignment.
“Frame” toolbar
Description
Top line
Bottom line
Left line
Right line
Description
Enables/disables top frame line.
Enables/disables bottom frame line.
Enables/disables left frame line.
Enables/disables right frame line.
All lines
Enables all frame lines.
No lines
Disables all frame lines.
Shadow
Enables/disables shadow.
Background color
1
Enables text left alignment.
Selects background color from the drop-down list.
Line color
Selects line color from the drop-down list.
Line style
Selects line style from the drop-down list.
Line width
Selects line width from the drop-down list.
2.8.3. “Align” toolbar
Icon
UVS Software for
UVIKON 900/XL/XS
Description
Manual Version 2.20, Oct. 2007
Page 136 of 202
UVS SOFTWARE for UVIKON 900 / XS /XL
USER MANUAL
Align left edges.
Center across.
Align by right edges.
Align top edges.
Justify vertically.
Align bottom edges.
Justify by width.
Justify by height.
Center across in window.
Center vertically in window.
Set the same width as in the first selected object
Set the same height as in the first selected object
2.8.4. Designer options
Set the designer options via the “View|Options..." menu command.
UVS Software for
UVIKON 900/XL/XS
Manual Version 2.20, Oct. 2007
Page 137 of 202
UVS SOFTWARE for UVIKON 900 / XS /XL
USER MANUAL
Here you can set the desired units (centimeters, inches, pixels), and specify grid step for each unit.
Tip: You can also switch units in the designer by double-clicking on the left part of the status line
where the current units are displayed.
You can also specify whether grid should be displayed, and align to grid. This can be done by buttons
in the “Standard” toolbar of the designer as well.
You can set a font for the code editor window and for the “Text” object editor. If the “Use object's font
settings” option is enabled, the font in the text editor window would correspond with the font of the
object being edited.
The default white background of the designer
“Workspace” and the “Tool windows” buttons.
and service windows can be modified by the
The “LCD grid color” option increases contrast of the grid lines a little, and it improves their visibility on
LCD monitors.
UVS Software for
UVIKON 900/XL/XS
Manual Version 2.20, Oct. 2007
Page 138 of 202
UVS SOFTWARE for UVIKON 900 / XS /XL
USER MANUAL
The “Show editor after insert” option controls what happens when new objects are inserted. If the
option is enabled, its editor will be displayed each time an object is inserted. When creating a large
number of blank objects, it is recommended to disable the option.
Disabling the “Show band captions” option, you can disable bands’ captions in order to save some
place in a page. At that, the band’s captions would be written inside of it.
The “Show drop-down list of fields” option stops the drop-down list from displaying when pointing with
the mouse to a “Text” object which is connected to data fields. This may be necessary if there are
many narrow text objects in a band
The “Free band placement” option disables snapping of bands to the page. This option is disabled by
default and bands are automatically grouped in page according to their function. A gap between bands
can be set in the “Gap between bands” field.
2.8.5. Report settings
A window with report parameters is available from the “Report|Options...” menu. A dialogue has three
pages.
In the first page you can see the general settings of the report:
You can tie a report to one of the printers installed in the system. This means that report printing will
be performed by the selected printer by default. This might be useful in case when there are several
different printers in the system; e.g. text documents can be tied with monochrome printer, while
documents with graphics - to the color one. There is the “Default printer” item in the list of printers.
UVS Software for
UVIKON 900/XL/XS
Manual Version 2.20, Oct. 2007
Page 139 of 202
UVS SOFTWARE for UVIKON 900 / XS /XL
USER MANUAL
When this item is selected, the report will not be tied with any printer, and therefore printing will be
performed by a printer, which is set as the default one.
You can also set number of report copies to be printed and specify, whether it is necessary to perform
collation. The values, which a user sets in this dialogue, would be displayed in the “Print” window.
If the “Double pass” flag is selected, report’s formation will be performed in two steps. During the first
pass, a report is formed, and is divided into pages, but the result is not saved anywhere. In the second
pass a standard report formation with saving a result in the stream is performed.
Why two passes are necessary? Most often, this option is used in cases when in a report there is a
need for the total number of pages in it, i.e. the information of the “Page 1 of 15” type. The total
number of pages is calculated during the first pass and is available via the “TOTALPAGES” system
variable. The most frequent mistake is an attempt to use this variable in a single-pass report; in this
case it returns “0.”
Another use is to perform any calculations in the first pass and display the results in the second pass.
For example, when it is required to display a sum in the group header, which usually is calculated and
displayed in the group footer. Calculations of this type are accomplished by writing report script code
in the OnBeforePrint event of an object.
The “Print if empty” flag allows construction of a report, which contains no data lines. If this option is
disabled, blank reports would not be constructed.
The “Password” field enables setting of a password which must be entered before opening a report.
On the second page you can setup the report inheritance options:
UVS Software for
UVIKON 900/XL/XS
Manual Version 2.20, Oct. 2007
Page 140 of 202
UVS SOFTWARE for UVIKON 900 / XS /XL
USER MANUAL
You can learn about inheritance later in the "Report inheritance" chapter. In this dialog you can see the
base report's name (if report is inherited), detach the base report (in this case your report will be
standalone, non-inherited) and inherit the report from one of base reports.
Controls in the third page of the dialogue allows you to set report’s description properties..
All fields in this dialog are for information purposes only.
2.8.6. Page options
Page’s parameters are available via either the “File|Page settings...” menu, or by double-clicking on
page blank space. The dialogue has two pages:
UVS Software for
UVIKON 900/XL/XS
Manual Version 2.20, Oct. 2007
Page 141 of 202
UVS SOFTWARE for UVIKON 900 / XS /XL
USER MANUAL
On the first dialogue page, you can select size and alignment of paper, as well as set margins. In
“Paper source” drop-down lists you can select a printer tray for the first page and the rest of the report
pages.
UVS Software for
UVIKON 900/XL/XS
Manual Version 2.20, Oct. 2007
Page 142 of 202
UVS SOFTWARE for UVIKON 900 / XS /XL
USER MANUAL
On the second page, you can set the number of columns for multi-column reports’ printing. The
current settings are displayed in the designer.
The “Print to previous page” flag allows you to print pages, beginning from blank space of the previous
page. This option can be used in case when a report template consists of several pages or when
printing batch (composite) reports.
The “Mirror margins” option switches right and left margins of page for even pages during previewing
or printing a report.
The "Endless page width & height" option increases page's sizes depending on number of data
records on the page (when running a report). In this case you will see one big page in the preview
window instead of several standard size pages.
The “Large height in design mode” option increases page’s height several times more. This feature
can be useful if many bands are located in the page, and must be used when working with the overlay
band. This only effects the page height in design mode..
2.8.7. Creating reports
2.8.7.1.
Report objects
A blank report in Report Designer is presented as a paper page. At any place on the page, a user is
able to add objects, which can display different information (such as text and/or graphics), as well as
to define report’s appearance. Let us describe briefly the assignment of the Report Designer objects,
which are included in the standard package:
- “Band” object allows creation on a design page, of an area which has definite behaviour;
according to it’s type.
- “Text” object displays one or several text lines within the rectangular area;
- “Picture” object displays a graphic file in “BMP,” “JPEG,” “ICO,” “WMF,” or “EMF” format;
- “Line” object displays a horizontal or a vertical line;
- “System text” object displays service information (date, time, page number, etc), as well as
aggregate values;
- “Subreport” object allows inserting an additional report design page inside the basic one;
- the objects of “Draw” category represent different geometrical figures (diagonal line, rectangle,
rounded rectangle, ellipse, triangle, and diamond);
- “Chart” object displays data in the form of charts as shown on the monitor
- “RichText” object displays a formatted text in Rich Text Format (RTF);
- “CheckBox” object displays a checkbox with either a check or a cross;
- “String Grid” object displays data in the form of grid;
- “OLE” object is able to display any object using OLE technology.
The basic objects you most likely need to work with are the “Band” and “Text” objects. You will learn
about their capabilities in detail further in this chapter.
UVS Software for
UVIKON 900/XL/XS
Manual Version 2.20, Oct. 2007
Page 143 of 202
UVS SOFTWARE for UVIKON 900 / XS /XL
USER MANUAL
2.8.7.2.
“Hello, World!” report example
The report will contain one inscription only (“Hello, World!”). Open the report designer. After that, click
the “Text” button in the "Objects" designer panel. Move the mouse cursor to the desired place on the
page, and click again. The object has been inserted.
The text editor window will be displayed right away; if it does not appear (this can be set in the
designer settings), then doubleclick the object. Enter the “Hello, World!” text, and then click the “ОК”
button.
The report is created. To preview it, either select the "File|Preview" menu item, or click the
corresponding button in the toolbar. The preview window containing a report page with the “Hello,
World!” text will appear. This report can be printed out, saved to a file (*.fp3), or exported to one of the
supported export formats.
2.8.8. The “Text” object
The “Text” object has many features. Now we already know that it allows you to display text, a frame,
and fill color. The text can be displayed using any font of any size and style. All the parameters can be
set visually, with the help of the toolbars:
Here are some examples of text design:
UVS Software for
UVIKON 900/XL/XS
Manual Version 2.20, Oct. 2007
Page 144 of 202
UVS SOFTWARE for UVIKON 900 / XS /XL
USER MANUAL
Now let’s look at other features of this basic object. As an example, let us create a new text object and
put two lines into it:
This is a very, very, very long text line.
And this is another line, the shorter one.
Let us enable the object frame, and then resize the object up to 9x3 cm with the help of the mouse.
We see that the object can display not only a single line of text, but several lines as well. Now let us
reduce the object width up to 5cm. It is obvious that long lines did not find room in the object and
therefore were wrapped. This happens due to the “WordWrap” object property. If it is disabled (either
in inspector or in the object context menu), the long lines will be simply cut off.
Now let’s check how the text alignment inside the object works. Alignment buttons are located in the
“Text” toolbar and allows one to set horizontal or vertical text alignment. Pay attention to the “Block
Align” button; this button let’s you align the paragraph on both object edges. To do this, the
“WordWrap” property option must be enabled.
All the text in the memo can be rotated at any angle within the limit of 0.. 360 degrees. The
button
in the “Text” toolbar allows you to quickly rotate the text at 45, 90, 180 and 270 degrees. If you wish to
rotate the text at any other value, use the object inspector. The “Rotation” property sets the required
angle. When rotating a text, setting values other than 90, 180, 270 the text can exceed bounds of the
object, as in our case (see the picture below). Let us increase object height a little, so that the text
would fit the object.
UVS Software for
UVIKON 900/XL/XS
Manual Version 2.20, Oct. 2007
Page 145 of 202
UVS SOFTWARE for UVIKON 900 / XS /XL
USER MANUAL
Let us briefly examine some other “Text” object properties, which influence its appearance. Most of
these properties are available in the object inspector only:
- BrushStyle – type of object filling;
- CharSpacing – sрасe between symbols in pixels;
- GapX, GapY – text indents from object’s left and top boundaries (in pixels);
- LineSpacing – space between lines (in pixels);
- ParagraphGap – the first paragraph line indent (in pixels).
2.8.9. HTML-tags in the “Text” object
Yes, this object does understand some simple HTML tags. Tags can be located inside the text of an
object. Tags are disabled by default; to enable them, either select the “Allow HTML tags” item in the
object context menu, or enable the “AllowHTMLTags” property in the object inspector. Here is the list
of supported tags:
<b> - bold text
<i> - text in italic
<u> - underlined text
<sub> - subscript
<sup> - superscript
<font color> - font color
Notice that not too many tags are supported, but it is rather enough for the majority of applications. It
is impossible to modify font size and name; otherwise the text-rendering unit in Report Designer would
become very complex.
The following examples demonstrate how these tags can be used.
text <b>bold text</b> <i>text in italic</i> <b><i>bold and in italic</b></i>
E = mc<sup>2</sup>
A<sub>1</sub> = B<sup>2</sup>
UVS Software for
UVIKON 900/XL/XS
Manual Version 2.20, Oct. 2007
Page 146 of 202
UVS SOFTWARE for UVIKON 900 / XS /XL
USER MANUAL
this is a usual text, <font color=red>and this is a red one</font>
this is a usual text, <font color="#FF8030">and this is an orange one</font>
2.8.10.
Displaying expressions with the help of the “Text” object
One of the most important features of this universal object is it’s ability to display not only a static text,
but expressions as well. Expressions can be located in the object together with text. Let us examine a
simple example of how it can be performed. Put the following line into the object:
Hello, World! Today is [DATE].
Thus, when running the report, we can get something like follows:
Hello, World! Today is 01.01.2004.
What lead to such result? During Report Designer report building, if an expression enclosed in square
brackets is encountered, the engine calculates it’s value and inserts the value into the text (in place of
the expression). The “Text” object can contain any number of expressions, together with a usual text.
Both single variables and expressions can be enclosed in brackets (for example, [1+2*(3+4)]). Any
constants, variables, functions, and DB fields can be used in expressions. We will learn more about
these features later, in the chapter.
Report Designer automatically recognizes expressions enclosed in square brackets in the text. But
what should be done if our object contains square brackets, and we do not want them to be
considered as expressions? For example, if we need to display such text as following:
a[1] := 10
Report Designer considers [1] as an expression, and displays the following:
a1 := 10
that is not what we want, of course. One of the ways to avoid such a situation is to disable the
expression. Just disable the “AllowExpressions” property (“Allow Expressions” in the context menu),
therefore all the expressions in the text will be ignored. In our example, Report Designer would then
display exactly what we need:
a[1] := 10
Sometimes text is required to contain both an expression and a text in square brackets, for example:
a[1] := [myVar]
UVS Software for
UVIKON 900/XL/XS
Manual Version 2.20, Oct. 2007
Page 147 of 202
UVS SOFTWARE for UVIKON 900 / XS /XL
USER MANUAL
Disabling of an expression allows us to display square brackets in the required place, but it also
disables handling of expression. In this case, Report Designer allows you to use another set of
symbols to designate the expression. The “ExpressionDelimiters” property, which is equal to “[,]” by
default, is responsible for it. In this case, the user can use angular brackets for the expressions,
instead of square ones:
a[1] := <myVar>
The “<,>” value must be set in the “ExpressionDelimiters” property. As you can see, the comma
divides opening and closing symbols. There is one limitation however: the opening and closing
symbols cannot be similar, so “%,%” will not work. One can set several symbols, for example “<%,%>”
Thus, our example will look as follows:
a[1] := <%myVar%>
2.8.11.
Bands in Report Designer
Bands are used for logically placing the objects it contains at a location on the output page. When
placing an object in a band, such as “Page Header,” we tell the report engine that the given object
must be displayed at the top of each page of a finished report. Similarly, the “Page Footer” band is
displayed at the bottom of each page together with all the objects it contains. Let us demonstrate it
with an example. We’ll create a report, which contains the “Hello!” text at the top of the page, a current
date to the right of it, and a page number at the foot of the page (to the right).
Open the Report Designer designer and click the “New report” button in the toolbar. You will see a
report template, which already contains three bands: “Report title,” “Master data,” and “Page footer.”
Let us remove the “Master data” band for a while (to do that, click either on any free space inside the
band, or on its header, and then remove it by pressing the “delete” key or using the corresponding
section in the context menu). Now let us add a new band (“Page header”). To perform this, click the
“Add band” button and select “Page header” from the drop down list. We see that a new band is added
to the page. At the same time, the existing bands were moved down. Report Designer designer
automatically positions bands on the page, and, as a result, header-bands are positioned on the top,
data-bands are in the middle, and footer-bands are at the bottom.
Now let’s add some objects. Add a “System text” object in the “Page header” band and select “System
variable” in its editor “[DATE]” (you should remember that the date can be displayed in a “Text” object
by typing “[DATE]” in its editor). We add a “Text” object, which will contain the “Hello!” text in the
“Report title” band. Note you can see, the text object, which displays page number, is already added to
the “Pagefooter” band.
UVS Software for
UVIKON 900/XL/XS
Manual Version 2.20, Oct. 2007
Page 148 of 202
UVS SOFTWARE for UVIKON 900 / XS /XL
USER MANUAL
When running the report, you will see that the objects in the finished report are allocated on the page
in the appropriate position.
Thus, bands are responsible for object positioning in required places. Depending on band type, we
can add objects either at the top or at the bottom of the page, on the first page, or on the last one. The
basic bands, which we would need in most reports, work in the following way:
- “Page header” band is displayed at the very top of each page;
- “Page footer” band is displayed at the very bottom of each page;
- “Report title” band is displayed at the top of the first page, but below the “Page header” band
(depending upon the “TitleBeforeHeader” page property assigned in the object inspector);
UVS Software for
UVIKON 900/XL/XS
Manual Version 2.20, Oct. 2007
Page 149 of 202
UVS SOFTWARE for UVIKON 900 / XS /XL
USER MANUAL
- “Report summary” band is displayed at the very end of a report, at white space.
2.8.12.
“Picture” object
The next object to examine is the “Picture” object. It is also frequently used in reports. With the aid of
this object, you can insert a logo, a photo of an employee or any other graphical information. The
object is able to display graphics in “BMP,” “JPEG,” “ICO,” “WMF,” and “EMF” formats.
Let’s examine the capabilities of the object. Create a blank report and place a “Picture” object on the
report page. in the object editor (if it does not open automatically, then doubleclick on the object). Load
any desired picture and click “OK.” You can load a picture from a file or clear an existing picture
There are some options available in the object’s context menu, which correspond to names of the
properties in the object inspector.
- AutoSize
- Stretch – enabled by default
- Center
- KeepAspectRatio – enabled by default
If the “AutoSize” option is enabled, the object will be resized, according to the size of the picture it
contains. Sometimes such feature can be useful, if pictures of different sizes are to be displayed. This
option is disabled by default, for convenience.
The “Stretch” option is enabled by default. This option stretches the picture inside the object. Modify
the object’s size using the mouse and you will see, that the picture size always corresponds to the
object’s size. If this option is disabled, the picture will be displayed in its original size. This behaviour
differs from the “AutoSize” option because the object dimensions are not adjusted according to the
picture size, which means that the object can be larger or smaller than the picture it contains.
The “Center” option allows aligning a picture inside the object.
UVS Software for
UVIKON 900/XL/XS
Manual Version 2.20, Oct. 2007
Page 150 of 202
UVS SOFTWARE for UVIKON 900 / XS /XL
USER MANUAL
The “KeepAspectRatio” option is enabled by default it stops the picture from distorting when the
object’s sizes are modified. This option works only together with the “Stretch” option. Therefore, when
applying any object dimensions, a drawn circle will remain a circle, without turning into an oval. The
stretched picture then occupies only the part of the internal space of the object needed to display it
using correct ratios. If the option is disabled, a picture will be stretched to fill the object size, and if
object’s size does not correspond to the initial dimensions of the picture, it will be distorted.
Another useful property available in the Object inspector only - "FileLink". You can put a filename
(c:\picture.bmp) or variable containing a filename ([picture_file]) to this property. The picture will be
loaded from given filename when you run a report.
Note : If the name of the picture object is ‘Logo’ then the picture defined in the options was loaded !
2.8.13.
Chart object
Mostly used in scan and kinetik methods shows this object the chart of the data.
Please select the chart by clicking the right mouse button.
2.8.14.
Stringgrid object
The string grid object contains all numeric data shown as a grid table. Please select the string grid in
the combobox and set the other parameters
The text in the grid can be formated as left, right, center and automatic orientated. With automatic
orientated the text is left orientated if it is a alphanumerical text and right orientated if it is a numeric
only value.
Expand to full width : The grid was expanded to the whole width of the object, otherwise it is only
equal to the calculated size of the text.
Autosize : Must be checked if expand to full width is checked
Show title : A column and row header wll be shown. Must be enabled if show header is checked.
Show header : A header of he grid is visible.
UVS Software for
UVIKON 900/XL/XS
Manual Version 2.20, Oct. 2007
Page 151 of 202
UVS SOFTWARE for UVIKON 900 / XS /XL
USER MANUAL
2.8.15.
Data splitting
Let us pay attention to a peculiarity of this report: There is a lot of blank space at bottom of the pages.
Why does it happen? When a report is constructed, the Report Designer core fills whitespace of the
page with bands. After displaying each band, the current position shifts down. When Report Designer
finds out that there is not enough space to display the next band (its height is larger than white space
left on the page), then a new page is formed and band displaying continues there. This operation
continues being performed as many times as there are records in the dataset.
Our report contains an object with large text, and that is why the band height is rather large.
Furthermore, if a large band does not find room on a page, it is transferred to the next one, and much
unused space remains at the bottom of the page. This is shown at the following illustration:
To limit paper wastage, let us use a Report Designer feature, which paragraphs the band’s contents.
All we need do is to enable the “AllowSplit” option of the “First level data” band. You see that there is
less white space at the bottom of report pages:
UVS Software for
UVIKON 900/XL/XS
Manual Version 2.20, Oct. 2007
Page 152 of 202
UVS SOFTWARE for UVIKON 900 / XS /XL
USER MANUAL
How does band splitting work? There are some objects in Report Designer, which support this feature.
They are the “Text,” “Line,” and “RichEdit” objects. They can be “split,” while other objects cannot.
When Report Designer comes across the need to split a band, it performs it in the following way:
- displays the non-splittable objects, which find room on white space;
- partially displays splittable objects (text objects are displayed in a way that all lines find room in the
object);
- forms a new page and continues object displaying;
- if a non-splittable object does not find room on whitespace, it is transferred to the next page; at the
same time, all the objects located underneath, are shifted according to need;
- the process continues until all the band objects are fully displayed.
The splitting algorithm will become clearer if to look at the illustration:
It should be noted, that the splitting algorithm is not perfect and quality of the output report
may not be as expected. You should use this option very carefully in cases when objects on the split
band are grouped in a complicated way, and / or their font sizes differ. Here is the example of what
could be received:
UVS Software for
UVIKON 900/XL/XS
Manual Version 2.20, Oct. 2007
Page 153 of 202
UVS SOFTWARE for UVIKON 900 / XS /XL
USER MANUAL
2.8.16.
Child-bands
Let us examine the case when one of the lines in a report of “label” type, may have a variable size. To
simulate the situation using our example, let us reduce the “Bio.”Common Name”” object width to 2.5
cm, and enable the “Stretch” option for it. Let us also enable stretching in the “First level data” band.
Enable all the frame lines in all objects so that the principle of the stretching function will become
clear. This will output a report with the following appearance:
You see, that in the first case the first object contains longer text, and this is why it was stretched into
two lines. Thus, the object (located underneath it and linked to the Bio.”Length (cm)” field) was shifted
down. This happens because all the objects have the “Shift” property enabled by default (ShiftMode =
smAlways in the object inspector). Such objects shift downwards if there is a stretchable object above
UVS Software for
UVIKON 900/XL/XS
Manual Version 2.20, Oct. 2007
Page 154 of 202
UVS SOFTWARE for UVIKON 900 / XS /XL
USER MANUAL
them (a “Text” object with the “Stretch” property enabled). The height value, by which the object shifts,
depends on how the object from above is stretched.
However, it is unacceptable in this case, since we need the object with the “Length, cm.” text to be
shifted as well. To perform this, there is a special band type in Report Designer, the “Child-band.” It is
linked to (and is displayed after) it’s parent band. Add a “Child” band to our reports design layout and
move the 2 Text objects into it.
Link the Masterdata band to the Child band, by setting it’s “Child” property in the object inspector.
Now, each time the “Masterdata” band prints, the “Child” band will be printed immediately afterward:
As you can see, now the title is typed exactly where it is supposed to be. In order to avoid child-band’s
transferring to the next page (which basically means, it will be widowed from the parent band), enable
the “Keepchild” property for the parent band (“KeepChild” in the object inspector).
2.8.17.
Shifting objects
You have already seen how the “Shift” property works. Let us look at the next mode of shifting, “Shift
on overlapping.” In the object inspector, the “ShiftMode= smWhenOverlapped” property value
corresponds to this mode. Thus, object shifting will be performed in case, when the object from above
overlaps the given object during stretching. Three cases are shown in the illustration below. As you
see, the bottom object with the enabled “Shift when overlapped” option shifts only in the latter case,
i.e. when there is much text in the top object and it overlaps the bottom one.
UVS Software for
UVIKON 900/XL/XS
Manual Version 2.20, Oct. 2007
Page 155 of 202
UVS SOFTWARE for UVIKON 900 / XS /XL
USER MANUAL
If the “Shift” option is enabled, the bottom object will be shifted anyway:
This allows one to create rather complicated report output, by using the logic of the object’s design
properties, especially if an object overlaps several other objects at the same time. Thus, in the
following example both of the upper objects contain stretchable texts, and the bottom one has the
enabled “shifting when blocking” option. The bottom object will always be displayed closely to the
object, which contains more text, irrespective of text size in the upper objects:
In this example, if the “Shift” option is enabled for this object, the bottom object will shift twice, since it
is located underneath two objects and thus an unnecessary gap is formed.
2.8.18.
Headers and footers of a data band
Each data band may have header and footer. Headers are output before a data band, footers are
output after all data records are output. Here is an example of how the headers/footers working in
case of simple report:
UVS Software for
UVIKON 900/XL/XS
Manual Version 2.20, Oct. 2007
Page 156 of 202
UVS SOFTWARE for UVIKON 900 / XS /XL
USER MANUAL
A simple example of title page creation. Let us use our previous report with one data level. Add a new
page to it, this will be the second page. To move it to the front of the report, grab the page tab using
the mouse, and then drag it to the place near the first page. At that, the pages order will be changed.
Switch to the new page and place a “Text” object (with the “Our report” text inside) in the middle of the
page. That is all we need to do. The report with a title page is finished.
UVS Software for
UVIKON 900/XL/XS
Manual Version 2.20, Oct. 2007
Page 157 of 202
UVS SOFTWARE for UVIKON 900 / XS /XL
USER MANUAL
2.8.19.
Report viewing, printing and export
The built report can be displayed, printed or exported into one of the supported formats. Everything
can be performed in preview window.
On the picture with figures the following is displayed:
1 – ready report pages;
2 – toolbar;
3 – status line;
The following buttons are on the toolbar:
Icon
Name
Description
Icon
Name
Description
Print report
Prints report. Hotkey analogue – Ctrl+P.
Open report
Opens file with ready report (*.fp3).
Save report
Saves report to file (*.fp3).
UVS Software for
UVIKON 900/XL/XS
Manual Version 2.20, Oct. 2007
Page 158 of 202
UVS SOFTWARE for UVIKON 900 / XS /XL
USER MANUAL
Report export
Exports report to one of the supported formats.
Export to PDF
Exports report to Adobe Acrobat file (*.pdf). This button
is displayed if corresponding export filter is installed.
Send via e-mail
Exports report to one of the supported formats and
sends it via e-mail as enclosure. This button is
displayed, if corresponding export filter is installed.
Text search
Text search in report. Hotkey analogue – Ctrl+F.
Zoom in
Zooms in the preview.
Scale
Selects arbitrary scale.
Zoom out
Zooms out the preview.
Full screen
Displays report at full screen. For returning to normal
conditions perform double-click on report.
Outline
Shows or hides the report outline.
Thumbnails
Shows or hides the thumbnail view.
Page properties
Calls dialogue with page properties.
Edit page
Edits current page.
To beginning
Transfer to the first report page.
Previous page
Transfer to previous report page.
Page number
Transfer to report page with pointed number. Enter
number and click Enter.
Next page
Transfer to next report page.
To end
Transfer to the last report page.
Close window
Close preview window.
2.8.20.
Control keys
Keys
Description
Ctrl+S
Save report to *.fp3 file.
Ctrl+P
Print report.
Ctrl+F
Text search.
F3
Continue search.
Arrows
Smooth document scrolling.
PageUp,
PageDown
Up/down scrolling.
Ctrl+PageUp,
PageDown
Next/previous page scrolling.
UVS Software for
UVIKON 900/XL/XS
Manual Version 2.20, Oct. 2007
Page 159 of 202
UVS SOFTWARE for UVIKON 900 / XS /XL
USER MANUAL
Home
Document beginning.
End
Document end.
2.8.21.
Mouse control
Action
Description
Left button
Click on selected object (in interactive report); report scrolling in
“hand” mode (move mouse with pressed button); zoom in is
performed in “magnifier” mode.
Right button
Context menu; in “magnifier” mode zoom out is performed.
Double-click
It full screen mode it performs returning to normal conditions.
Mouse scroll
Report list scrolling.
2.8.22.
Report printing
To print a report click on
button (or Ctrl+P hotkey). The window appears – it is printing dialogue.
Let's look at options available in this dialogue.
UVS Software for
UVIKON 900/XL/XS
Manual Version 2.20, Oct. 2007
Page 160 of 202
UVS SOFTWARE for UVIKON 900 / XS /XL
USER MANUAL
The "Printer" group: you can select a printer via which you want to print a report; set printer properties,
for example, printing quality; and choose print to file.
The "Pages" group: you can select which pages to print (all, current, selected range).
The "Copies" group: you can set how many copies to print. If Collate flag is set and you choose to print
several copies, at first one report copy is printed, then – the next etc. If flag is disabled, several copies
of the first page are printed, then – several copies of the second one etc.
The "Other" group:
- Print - you can select which pages to print. Variants: All pages, Even pages, Odd pages.
- Order - print pages in direct or reverse order (from last to first page).
- Duplex - handle duplex by default (report settings are used) or choose one of duplex options:
vertical, horizontal, simplex.
The "Print mode" group: you can select one of the printing modes.
UVS Software for
UVIKON 900/XL/XS
Manual Version 2.20, Oct. 2007
Page 161 of 202
UVS SOFTWARE for UVIKON 900 / XS /XL
USER MANUAL
- Default mode. The printer prints on the sheet defined in a report. One preview page is printed on one
sheet.
- Split big pages. This mode is useful if you need to print A3 report on A4 sheet. One preview page is
printed on several sheets. If you choose this mode, you have to choose the sheet size ("Print on
sheet") as well.
- Join small pages. This mode is useful if you want to print A4 report on A3 sheet. Two or more
preview pages are printed on one sheet. If you choose this mode, you have to choose the sheet size
("Print on sheet") as well.
- Scale mode. Report is printed on specified sheet. All report output is scaled. One preview page is
printed on one sheet. If you choose this mode, you have to choose the sheet size ("Print on sheet") as
well.
After clicking on ОК report printing begins. If the “Print to file” flag is selected, file name is called. And
report is saved to this file (file with *.prn extension. It contains a copy of information sent to printer).
2.8.23.
Text search in report
Report Designer allows to search a set text line in a text in preview window. To perform that there is
button on toolbar (or its hotkey analogue - Ctrl+F). After that search dialogue appears:
Here you can set search line and options as well:
- Search from beginning – to search text from the beginning of document. Otherwise search will be
performed from current page;
- Case sensitive – to distinguish letter cases (lower-case and capital types) on searching.
On clicking ОК text search is performed and the first found element is highlighted.
To continue search click F3. The following element will be highlighted
UVS Software for
UVIKON 900/XL/XS
Manual Version 2.20, Oct. 2007
Page 162 of 202
UVS SOFTWARE for UVIKON 900 / XS /XL
USER MANUAL
2.8.24.
Report Export
Report Designer allows exporting a built (output) report to different formats for further editing,
archiving, sending via e-mail, etc... To export you must add the desired FR export components to the
Delphi form.
Export to 7 formats is supported. They are: PDF, Excel, XML, RTF, HTML, text, CSV. There is the
ability to send report via e-mail in any above-listed formats with Report Designer means.
Exports in Report Designer use one of the following three methods:
- Layer-by-layer – object transferring to resulting file is performed alternately. Expert accuracy is
approximated to original;
- Table – on object transferring transitional matrix of object allocation is used. There is high accuracy
to original based on the assumption that rules of creating correct report sample were followed (“Report
Design References” chapter);
- Enveloping – all report objects enveloping is performed on page image. There is full original
accuracy. It is used on export to graphic formats.
2.8.25.
Export to PDF Format
PDF (Portable Document Format): a platform-stand alone format of electronic documents created by
Adobe Systems. The free Acrobat Reader package is used for viewing. This format is rather flexible –
it allows inclusion of necessary fonts, vector and bitmapped images; it allows transferring and storage
of documents intended for viewing and further printing.
Export method is a layered one.
On exporting to PDF format the dialogue box for output file parameter settings appears.
UVS Software for
UVIKON 900/XL/XS
Manual Version 2.20, Oct. 2007
Page 163 of 202
UVS SOFTWARE for UVIKON 900 / XS /XL
USER MANUAL
Export parameters:
- Compressed – output file compressing. It reduces file size but increases export time;
- Embedded fonts – all fonts used in report will be contained in the PDF output file for correct file
displaying on computers where these fonts may be absent. Output file size increases considerably;
- Background – export of graphic image assigned to a page into PDF file. It considerably increases
output file size;
- Print optimized – output of graphic images in high resolution for further correct printing. This option
enabling is necessary only when the document contains graphics and its printing is necessary. It
considerably increases output file size;
- Outline – option is enabled when report outline is used. It enables export of the outline to the PDF
document;
- Open after export – resulting file is opened right after export via PDF files viewing program which
must be installed in OS by default (for example, Adobe Acrobat Reader).
Export peculiarities: RichText objects are exported as a graphic.
2.8.26.
Export to RTF Format
RTF (Rich Text Format) was developed by Microsoft as a standard for text documents interchange.
Now RTF documents are supported by many modern text editors and operating systems.
Export method is a table one.
On exporting to RTF format the dialogue box for output file parameter settings appears.
UVS Software for
UVIKON 900/XL/XS
Manual Version 2.20, Oct. 2007
Page 164 of 202
UVS SOFTWARE for UVIKON 900 / XS /XL
USER MANUAL
Export parameters:
- Pictures – enables graphic images export to output file;
- Page breaks – enables page breaks in RTF file;
- WYSIWYG – full compliance to report appearance. Disabling the option allows optimization, reducing
the number of lines and columns in the output file;
- Continuous - generate continuous document without page breaks and page headers/footers;
- Page header/footer - header/footer export mode. Variants are: Text (h/f exported as usual text),
Header/Footer (h/f inserted in the document) and None (h/f are not exported);
- Open after export – output file will be opened right after export via RTF files viewing program which
must be installed in OS (for example, Microsoft WordPad).
Export peculiarities: RichText objects are fully integrated into RTF format. File appearance and size
depend on report sample accuracy (“Report Design References” chapter);
2.8.27.
Export to Excel
Excel – application for working with electronic worksheets. It is included into Microsoft Office System.
Export method is a table/diagram one.
On exporting to Excel format the dialogue box for output file parameter settings appears.
UVS Software for
UVIKON 900/XL/XS
Manual Version 2.20, Oct. 2007
Page 165 of 202
UVS SOFTWARE for UVIKON 900 / XS /XL
USER MANUAL
Export parameters:
- Styles – transferring of text objects design styles into the table. Disabling increases exporting speed
but worsens document appearance;
- Pictures – includes graphic images export into output table;
- As text – all objects are transferred into table/diagram as text ones. This option may be useful when
transferring numeric fields with complicated formatting;
- Fast export – usage of optimized fast data transferring to Excel. This option disabling slows down
data transferring but increases export compatibility on any errors during data transferring;
- Merge cells – cells integration in resulting table/diagram for achieving maximum correspondence to
the original. Disabling increases exporting but reduces document appearance;
- WYSIWYG – full compliance to report appearance. On this option disabling the optimization for
reducing the number of lines and columns in resulting table is performed;
- Background – export of filling color assigned to report page;
- Page breaks – includes page breaks in Excel;
- Open Excel after export – resulting file will be opened right after exporting into Excel.
Export peculiarities: Excel program must be installed on your PC. RichText objects are transferred as
simple text, graphic images transference is supported.
2.8.28.
Export to XML Format
XML (Extensible Markup Language) is an expansible marking language. XML is intended for
structured data storage and also for information interchange between different programs. Report
Designer uses XML format for data transferring into Excel table/diagram editor ver. 2003 and later.
Export method is a table/diagram one.
On exporting to XML format the dialogue box for output file parameter settings appears.
UVS Software for
UVIKON 900/XL/XS
Manual Version 2.20, Oct. 2007
Page 166 of 202
UVS SOFTWARE for UVIKON 900 / XS /XL
USER MANUAL
Export parameters:
- Continuous - generate continuous document without page breaks and page headers/footers;
- Page breaks – includes page breaks in resulting document;
- WYSIWYG – full compliance to report appearance. Disabling allows reducing the number of lines
and columns in resulting table;
- Background – export of filling color assigned to report page;
- Open Excel after export – resulting file will be opened right after exporting into Excel.
Export peculiarities: Excel program must be installed on your PC. RichText objects are transferred as
a simple text; graphic images are not supported.
2.8.29.
Export to CSV Format
CSV-file contains values formatted in the form of a table/diagram and adjusted in such a way that
every value in column is divided from value in the next column be means of separator, and every new
row begins with new line. This format may be imported into different table/diagram editors.
Export method is a table/diagram one.
On exporting to CSV format the dialogue box for output file parameter settings appears.
UVS Software for
UVIKON 900/XL/XS
Manual Version 2.20, Oct. 2007
Page 167 of 202
UVS SOFTWARE for UVIKON 900 / XS /XL
USER MANUAL
Export parameters:
- OEM codepage – resulting file OEM coding selecting;
- Separator – values separator in files;
- Open after export – resulting file will be opened right after exporting via CSV files viewing program
which must be installed in OS.
Export peculiarities: on transferring into this format report design is not saved. Graphic images are not
supported.
2.8.30.
Export into HTML Format
HTML (Hypertext Markup Language) is regarded as standard language for document marking in the
Internet. HTML was created as a language for scientific and technical documentation interchange
suitable for usage by people who are not specialists in nesting. It is used for creating relatively simple
but nicely designed documents. Besides document structure simplification hypertext support is
included into HTML.
Export method is a table/diagram one.
On exporting to HTML format the dialogue box for output file parameter settings appears.
UVS Software for
UVIKON 900/XL/XS
Manual Version 2.20, Oct. 2007
Page 168 of 202
UVS SOFTWARE for UVIKON 900 / XS /XL
USER MANUAL
Export parameters:
- Styles – transferring of text objects design styles. Disabling increases exporting but worsens
document appearance;
- All in one folder – all additional files are saved in the same folder with main file;
- Page navigator – special navigator for fast shift between pages is created;
- Fixed width – blocking of automatic table/diagram width modifying on changing preview window size;
- Multipage – every page will be written to separate file;
- Background – export of graphic attributes assigned to report page;
- Pictures – includes graphic images exporting possibility;
- Open after export – resulting file will be opened right after exporting via HTML files viewing program
which is allocated in OS by default.
Export peculiarities: export may consist of several files. Each graphic image is supported and saved in
their own separate file, RichText objects are transferred as simple text. Appearance and file volume
depend greatly on report design (“Report Design References” chapter)
2.8.31.
Export to Text Format
Usual text file. It contains information from report. This information is optimized to the limit and
converted in accordance with the given format peculiarity.
Export method is a table/diagram one.
On exporting to text format the dialogue box for output file parameter settings appears.
UVS Software for
UVIKON 900/XL/XS
Manual Version 2.20, Oct. 2007
Page 169 of 202
UVS SOFTWARE for UVIKON 900 / XS /XL
USER MANUAL
Export parameters:
- Page breaks – export of page breaks to resulting file;
- Empty lines – export of empty lines;
- Frames – export of text objects frames;
- OEM codepage – resulting file OEM coding selecting;
- Open after export – resulting file will be opened right after exporting via default text files viewing
program which is installed in OS.
Export peculiarities: report design is not saved on transferring to this format, graphic images are not
supported, exported page width is figured automatically depending on type of text objects on report
page.
2.8.32.
Report Design References
It is significant that the quality of the export into any other format depends greatly on competent design
of initial report. Report Designer allows a great number of ways to manipulate objects during report
output creation. This gives the advantage of fast development of any reports and their further printing.
Printed document will look just as on display. And this is the primary intent of Report Designer report
generator usage. The downside of such development freedom is the complexity of exporting the
Report Designer document to different data formats, which have their own limits and requirements for
information presentation, and are sometimes rather complex. In this chapter, special design
requirements of reports intended for export to other data formats will be discussed.
Many formats use table data presentation. Formats such as HTML, XLS, XML, RTF and CSV, do. Not
allow cell crossing or arranging in layers when table marking, this concerns HTML and RTF. In
contrast to freedom of report development in Report Designer designer. Export filters, as a rule, take
into account these requirements when objects are transferred from Report Designer report to
necessary format. This is carried out by special algorithms which takes object crossings into account
and their optimal placing. At object crossing points new columns and lines in the resulting output table
appear. That is necessary for saving of the Report Designer transferable objects exact positioning and
for getting maximum resemblance between the result and original report. A large number of cross
UVS Software for
UVIKON 900/XL/XS
Manual Version 2.20, Oct. 2007
Page 170 of 202
UVS SOFTWARE for UVIKON 900 / XS /XL
USER MANUAL
objects in report design, leads to an increased number of columns and lines in the resulting table. This
leads to the need to edit the resulting file in its own editor for further use.
For example, on report design a slight crossing of two objects placed one under another on the same
band. The number of records on report forming was 150. On export to RTF format 450 lines will be
created (150 lines for each object and 150 ones for crossing). If we remove crossing there will be
already 300 lines. In large reports and on huge number of objects the difference will be really
tremendous. That, of course, will affect output file size.
Objects in the report
Export to Excel - result
Remember that during designing, if you want to export your reports in any table format.
On creating tables in report keep an eye on neighboring cell’s borders to adjoin each other. It is
important that cells do not cross and arrange in layers. Export filter algorithm will cut off cells but
export result may be far from desirable (you will see not exactly what you wanted to). Arrange objects
in such a way that they are placed in line vertically as well as horizontally. Guidelines can help to
perform this.
UVS Software for
UVIKON 900/XL/XS
Manual Version 2.20, Oct. 2007
Page 171 of 202
UVS SOFTWARE for UVIKON 900 / XS /XL
USER MANUAL
Using guidelines in the designer
To use guidelines in Report Designer designer just click on the horizontal or vertical ruler limiting
report page from the left and the top. Then, holding the mouse button down, drag the guideline to the
required position on the page. You will be able to place objects immediately along guidelines
horizontally and vertically.
Text objects grid alignment can also be helpful in case of cells overlapping. Keep an eye on enabling
grid alignment in designer options. In order to simplify alignment you can extend grid pitch. Setting of
grid pitch and alignment can be found in designer menu “View” – “Options” – “Grid”.
UVS Software for
UVIKON 900/XL/XS
Manual Version 2.20, Oct. 2007
Page 172 of 202
UVS SOFTWARE for UVIKON 900 / XS /XL
USER MANUAL
For text framing it is better to use text object embedded properties instead of single graphic objects –
lines, rectangles, etc. try not to use background objects under transparent text objects.
Keeping these simple rules in mind will help you to create a report which will look perfect after export
to any format using table (or table-based) marking for data presentation.
Below there are some examples of correct and undesirable object arrangement on report design
creation.
Bad
Good
Objects are displaced horizontally. It is necessary to use alignment according to extension lines as far
as possible for objects to have the same horizontal coordinate.
Bad
Good
Objects are overlapping. In such a case on export to table/diagram format additional useless lines and
columns and also 3 additional cells in crossing zone are created.
It is recommended to get acquainted with demo reports included with the Report Designer installation
for mastering basic methods of optimum report development.
UVS Software for
UVIKON 900/XL/XS
Manual Version 2.20, Oct. 2007
Page 173 of 202
UVS SOFTWARE for UVIKON 900 / XS /XL
USER MANUAL
2.9. Managing curves
2.9.1. Direct Printing of Curves
Clicking on the Chart tab in the Report screens of modes such as Wavelength Scan gives the user a
direct full screen display of the curves corresponding to the selected report. The appearance of the
curve may be modified using the Edit function which is described in a separate section below.
Prints the curve as a single sheet report. Click on this icon to obtain the formatting window
below. This method will only print the curve itself.
The upper bar in this dialogue box controls the actual operation and selection of the printer
parameters using the standard printer installation windows.
The left-hand section of the window contains formatting functions which directly influence the print-out
itself, e.g. margins, detail etc. Changes to these parameters directly influence the appearance of the
print-out preview in the dialogue window. These functions are explained briefly below:
Orientation
Selection of either landscape (horizontal) or portrait (vertical) format for the print-out.
Margins
Spin selection boxes allow direct setting of the individual page margins.
UVS Software for
UVIKON 900/XL/XS
Manual Version 2.20, Oct. 2007
Page 174 of 202
UVS SOFTWARE for UVIKON 900 / XS /XL
USER MANUAL
Reset Margins Changing the preset margins automatically activates the Reset Margins button, click
on this at any time to reset all margins to their default values. The button is not active
if the margins are already set to their default values.
View Margins This checkbox allows the margin display in the preview to be switched on or off as
required.
Detail
Moving the scroller between normal and more increases the degree of detail shown in
the curve display print-out. For example, for greater detail on the axis display move
the cursor towards more until the required detail is displayed.
Proportional
This returns the print-out to its original default settings without affecting the detail
selected in the detail scroll bar.
2.9.2. Editing and Formatting of Charts
The software uses a built-in editor which offers comprehensive formatting capabilities for both 2D and
3D reports. Access to this editor is obtained by clicking on the Edit icon. This icon is available in all
screens including the Acquisition screen. Use of the Edit facility when programming a method allows
immediate control of the appearance of the result without the need for time-consuming manual
manipulations.
A Help function is provided within the Editor and therefore this document will only describe the more
common needs with respect to formatting of charts, the user is referred to the Help function for
additional information.
2.9.2.1.
Changing the scaling (Axis)
The axis scaling is the first available tab in the Edit dialogue box when opened. Separate parameters
can be defined for each axis and normally users would only be concerned with the so-called left and
bottom axes (Y and X respectively).
UVS Software for
UVIKON 900/XL/XS
Manual Version 2.20, Oct. 2007
Page 175 of 202
UVS SOFTWARE for UVIKON 900 / XS /XL
USER MANUAL
The required axis to be formatted is selected by clicking in the list in the left-hand panel. Above this
panel there is also a checkbox which allows the axes to be removed from the chart (visible or not).
The significance of the other parameters is described briefly below:
2.9.2.1.1.
Scales
Automatic
The software uses dynamic scaling depending on the level of the signal
obtained. In many cases this can be confusing for the user and generally it
is recommended that, once known, the range should be set manually for
routine operation.
Visible
Check this box if you want an axis to be visible, uncheck to remove it.
Invert
Checking this box will invert the chart.
Maximum
If automatic is set to off, a fixed signal maximum can be defined here.
Minimum
If automatic is set to off, a fixed signal minimum can be defined here.
Desired increment
The desired axis increment is the minimum step between axis labels. It must
be either a positive number or DateTime value. This value will be used as
the initial step value. If there is not enough space for all labels, then a larger
increment will be automatically calculated.
This value defines only the increment used on the scale, it is also possible to
format the number of decimal places required as described below.
Logarithmic
Check this box to obtain a chart based on the corresponding logarithm.
2.9.2.1.2.
Decimal Format
The decimal format required can also be set from within the Axis tab. Click on Labels and then on the
Format tab to obtain the following window:
UVS Software for
UVIKON 900/XL/XS
Manual Version 2.20, Oct. 2007
Page 176 of 202
UVS SOFTWARE for UVIKON 900 / XS /XL
USER MANUAL
Enter the required decimal format in the “Values Format” box, e.g. for 4 decimal places enter “0.0000”.
2.9.2.1.3.
Title
This allows formatting of the name to be used for a given axis, e.g. Absorbance. The tabs allow
definition of the name, its alignment relative to the axis and also the font and test appearance to be
used.
2.9.2.2.
Titles
Normally only the definition of a chart titles in the form of either header or footer text is required. This
can be done by selecting the required function using the drop-down menu and entering the text in the
lower panel.
Alignment top or bottom is dependent on this selection while the horizontal position can be controlled
directly from the Alignment box. A custom alignment using coordinates is also possible by clicking on
the Position tab.
The remaining tabs are used to define the font type, colours, frame and certain special effects such as
shadowing etc.
2.9.2.3.
Legend
The legend box is used to show which curve colour corresponds to a particular sample. The default
text used is “Series N” where N is the number of the sample in the batch. This default text is only
used when no sample description is defined otherwise the actual description will be used automatically
for the legend.
UVS Software for
UVIKON 900/XL/XS
Manual Version 2.20, Oct. 2007
Page 177 of 202
UVS SOFTWARE for UVIKON 900 / XS /XL
USER MANUAL
The Style and Position tabs are most likely to be used. The remaining tabs control items such as size
and form of the displayed symbol and generally the applied default values will not need changing.
2.9.2.3.1.
Style
Visible
Unchecking this checkbox will remove the legend box from the chart.
Inverted
Checking this box will cause the legend order to invert, i.e. the last sample to
run will be shown at the top of the box.
Checkboxes
Unchecking this box will remove the checkboxes adjacent to the text in the
box. This is not recommended since the checkbox is very useful if a single
curve should be removed from the overlay for any reason.
Legend Style
It is recommended to maintain this setting as Automatic per default.
Text style
It is recommended to maintain this setting as Left Value per default.
Vert. Spacing
Controls the line spacing used within the legend box.
Dividing Lines
Allows definition of the format of lines used between the individual legend
entries within the box.
2.9.3. Audit Trail
The UVS software contains an integrated Audit Trail which tracks all changes made to all documents
after acquisition. This trail is applied to both methods and all reports and is linked to name and revision
of a document.
Click on the Audit Trail icon in any screen to view the audit trail window for the current
document and revision.
A prompt will appear asking whether you wish to view the “Report Trail”, which contains the current
reports, or “Deleted Reports”, which contain audit trails for all deleted reports.
UVS Software for
UVIKON 900/XL/XS
Manual Version 2.20, Oct. 2007
Page 178 of 202
UVS SOFTWARE for UVIKON 900 / XS /XL
USER MANUAL
It is possible to print a report of the highlighted trail by clicking on the print icon in the top menu bar or
alternatively the trail can be exported directly to Excel if required.
2.9.3.1.
Report Trail
2.9.3.2.
Deleted Reports
The deleted report trail screen is obtained by clicking on the deleted report selection:
The upper panel contains those reports contained in the list, by clicking on one of the reports the detail
for that highlighted report is shown in the lower panel.
2.9.4. Electronic Signature
The UVS software supports an electronic signature process as required under the CFR21 Part 11
Rule.
2.9.4.1.
Signing a Report
In order to sign a report the signee must have been assigned the correct permission rights for the
required action.
UVS Software for
UVIKON 900/XL/XS
Manual Version 2.20, Oct. 2007
Page 179 of 202
UVS SOFTWARE for UVIKON 900 / XS /XL
USER MANUAL
E.g.
In order to be able to approve a document the user must have been assigned Approver rights
by the administrator in the Login screen.
Reports can be signed even though the signees are not actually logged into the system at the time.
Entry of the password is however mandatory for acceptance of any signature for Approval or
Acceptance of a document.
Click on the Signature icon to open the following dialogue window for signing a document:
The process of signing is automated as far as is possible in order to speed up the process and support
the user, a minimum number of entries need to be made. The significance of the various fields in the
dialogue above are described briefly below:
Document
This box contains the name of the document to be signed together with its revision
number. This is entered automatically following selection of the report and the
signature icon in the previous Report screen.
The “Signed Rev” box is used for later reference and contains the revision number of
the signed report for a given document name.
UVS Software for
UVIKON 900/XL/XS
Manual Version 2.20, Oct. 2007
Page 180 of 202
UVS SOFTWARE for UVIKON 900 / XS /XL
USER MANUAL
Created
The Created information is entered automatically from the audit trail for the selected
report and is based on the time of last change and the currently logged in user who
made the changes.
Approval
The approval and acceptance areas are selectable using the check button
immediately adjacent to the respective dialogues. In order to approve a document
ensure that the approval button is active. All subsequent selections will be applied
then to the approval process.
Acceptance
The approval and acceptance areas are selectable using the check button
immediately adjacent to the respective dialogues. In order to accept a document
ensure that the acceptance button is active. All subsequent selections will be applied
then to the acceptance process.
Login Name
This is a drop-down selection list which allows selection of the user who is executing
the signature. Only those users with the appropriate rights are displayed in the list, i.e.
for acceptance only users with acceptance rights will be displayed. Select your user
name from the list.
Full Name
The full name is entered automatically once the user name has been selected as
described above. The full name is defined initially as part of the login definitions and
cannot be changed here.
Password
Entry of the user password is mandatory before any signature process can be
successfully concluded.
Comment
Here a comment relating to the signature can be entered and this will be stored with
the other signature details and also shown on all printed reports.
Once a document has been signed off and accepted it is no longer possible to change that document,
therefore there are a series of prompts appearing to ensure that the user is aware of this process
before actually proceeding. The final prompt appears after the signee has confirmed that the
document should be signed off and is the final safety check before closing the document:
Caution
Only click on OK here if you are absolutely certain that the document in its current
form is acceptable.
UVS Software for
UVIKON 900/XL/XS
Manual Version 2.20, Oct. 2007
Page 181 of 202
UVS SOFTWARE for UVIKON 900 / XS /XL
USER MANUAL
2.9.4.2.
Signature Status Indications
2.9.4.2.1.
Quick Overview
There are various indications to show the status of a report and whether it has in fact been signed off
and accepted.
All signed reports in the list are shown with a shaded background so that the user can immediately
identify those reports in the list which have been signed and accepted.
The status of a signed report in the report list is shown automatically when the report is selected in the
report list:
The Approval and Accepted checkboxes are only checked for a signed report. The Signed Rev field
always carries the revision number of the signed report, if there is no entry in this field then no signed
report exists for that particular named report.
It is also possible to partially sign a report, e.g. only approval, and in this case only the Approval box
would be checked.
2.9.4.2.2.
Detail Overview
UVS Software for
UVIKON 900/XL/XS
Manual Version 2.20, Oct. 2007
Page 182 of 202
UVS SOFTWARE for UVIKON 900 / XS /XL
USER MANUAL
By clicking on the Signature icon it is possible to see the complete details of the signature entries for
the given report. Select the report from the list and click on the icon to obtain the Signature
information:
2.9.4.2.3.
Signature Audit Trail
The signature details are also recorded as part of the audit trail process and can be viewed in the
report trail:
2.9.4.3.
Deleting a Signed Report
For a given report it is only possible to have one signed report with the respective report name. In rare
cases it may be necessary to correct a signed report after signature and then re-sign it.
The UVS software allows a signed report to be deleted by users with administrator rights only and the
deletion is recorded in a separate Deleted Reports Audit Trail.
A new report can be signed in the normal way as described above.
UVS Software for
UVIKON 900/XL/XS
Manual Version 2.20, Oct. 2007
Page 183 of 202
UVS SOFTWARE for UVIKON 900 / XS /XL
USER MANUAL
3. OPTIONS AND ACCESSORIES
3.1. AUTOMATIC CELL CHANGER
3.1.1. Installation
Switch off the instrument and plug in the cable on the accessory board connector in the sample
compartment. Switch on the instrument and start the UVS software. The cell changer will be
recognised by the software during the initialisation process.
Access to the cell changer is possible in all modes using either direct control in the acquisition screen
for single measurements or integration into a method for automatic processing of samples. The cell
changer mode can be set as described below during either of these processes..
3.1.2. Cell Changer Mode (only UVSX)
The cell changer allows three different operation modes and the mode is selectable via the Cell
Changer dialogue in, for example, the Acquisition screen:
Click on the drop-down menu in Mode to select the required mode from a list.
UVS Software for
UVIKON 900/XL/XS
Manual Version 2.20, Oct. 2007
Page 184 of 202
UVS SOFTWARE for UVIKON 900 / XS /XL
USER MANUAL
3.1.2.1.
6 samples / 1 reference.
This mode allows measurement of 6 samples in the sample cell holder against 1 reference in position
1 of the reference cell holder. Only the sample cell holder moves during measurement.
The figure below shows the cell holder positions at start and end of a measurement if all 6 cells are
measured.
UVS Software for
UVIKON 900/XL/XS
Manual Version 2.20, Oct. 2007
Page 185 of 202
UVS SOFTWARE for UVIKON 900 / XS /XL
USER MANUAL
3.1.2.2.
6 samples / 6 references.
This mode allows measurement of 6 samples in the sample cell holder against 6 references in the
reference cell holder. Both holders move simultaneously during measurement.
The figure below shows the cell holder positions at start and end of a measurement if all 6 cells are
measured.
UVS Software for
UVIKON 900/XL/XS
Manual Version 2.20, Oct. 2007
Page 186 of 202
UVS SOFTWARE for UVIKON 900 / XS /XL
USER MANUAL
3.1.2.3.
10 samples / 2 references.
This mode allows measurement of 10 samples (5 in the sample cell holder and 5 in the reference cell
holder) against 2 references:
Ref. 1 in position 1 of the ref. cell holder
Ref. 2 in position 6 of the sample cell holder
Both holders move independently during measurement:
If more than 5 samples are selected in the 10 samples against 2 references mode the sample and
reference beams are exchanged after the fifth sample has been measured. This unique 'beam
switching' is possible due to the fact that both beams have a fully symmetric optical layout combined
with symmetrical data acquisition electronics.
UVS Software for
UVIKON 900/XL/XS
Manual Version 2.20, Oct. 2007
Page 187 of 202
UVS SOFTWARE for UVIKON 900 / XS /XL
USER MANUAL
3.1.2.4.
Manual operation (only UVSX)
The cell changer can be moved manually using the Position spinbox in the Acquisition screen. The
sample position will be set automatically depending on the mode setting (see above).
Select the required sample position and the press the Set button, the cell changer will then move to
the required position for measurement.
3.1.3. Cell Changer operation in the different system methods
3.1.3.1.
Auto rate assay
In this method the instrument can measure up to ten samples simultaneously when the cell changer is
in use. Measurement starts with the first reading on sample 1. The cell changer then moves to the
next position and measures the first reading on sample 2. This process continues until all selected
samples (parameter No. OF SAMPLES) have been measured once. The instrument will then continue
measurement with the second reading on sample 1 and all other samples. The whole process is
repeated until the selected number of readings has been measured. Up to ten curves (depending on
the selected number of samples) can be displayed on the screen during measurement.
3.1.3.2.
Fixed Wavelength
Measurement starts with the first sample. After the selected Averaging Time the cell changer will move
to the second sample. Only one reading per sample is measured and displayed. The cell changer can
also be used to measure standards in Calibration mode.
3.1.3.3.
Wavelength Scan
The complete scan is carried out on the first sample before the cell changer moves to the second
position and measurement of sample 2 is carried out. This process continues until the selected No. of
samples has been measured.
3.1.3.4.
Time Drive
The complete Time Drive is carried out on the first sample before the cell changer moves to the
second position and measurement of sample 2 is carried out. This process continues until the selected
No. of samples has been measured.
3.1.3.5.
Wavelength Program
All samples are measured at the first wavelength, then the wavelength is changed to the second one
and all samples are measured again. This process will be repeated until all wavelengths for all
samples have been measured.
UVS Software for
UVIKON 900/XL/XS
Manual Version 2.20, Oct. 2007
Page 188 of 202
UVS SOFTWARE for UVIKON 900 / XS /XL
USER MANUAL
3.2. Maintenance
3.2.1. Service
Only available in UVS900 version.
This is a service function for checking the optical system.
3.2.2. Thermal sensor calibration
Define here the calibration curve if a thermo sensor is installed. If not please let all cells blank.
Set a number of nominal values and verify your thermo sensor with a calibrated thermometer.
Example : Let your temperature goto 30 °C, press Apply and fill the correct temperature of the
thermometer into the nominal value. Repeat this for 4 or 5 other temperatures and save it. Now your
thermo sensor is calibrated via the curve against the nominal values of the calibrated thermometer.
UVS Software for
UVIKON 900/XL/XS
Manual Version 2.20, Oct. 2007
Page 189 of 202
UVS SOFTWARE for UVIKON 900 / XS /XL
USER MANUAL
3.3. Thermosystem / Thermopack
3.3.1. Installation
Connect the thermosystem or thermopack
thermosystem / thermopack will be detected.
3.3.1.1.
the serial line COM 1. Start the UVS Software, the
Manual operation
If the thermosystem / thermopack is detected an additional window is shown in the control/display
area of the acquisition window.
Enter the required sample or reference value and the press the Set button, the thermosystem /
thermopack will then move to the required temperature value.
If a thermopack is detected only the sample is shown.
3.4. Stirrer (only UVSX)
3.4.1. Installation
Switch off the instrument and plug in the cable on the accessory board connector in the sample
compartment. Switch on the instrument and start the UVS software. The stirrer will be recognised by
the software during the initialisation process.
Access to the stirrer is possible in all modes using either direct control in the acquisition screen.
UVS Software for
UVIKON 900/XL/XS
Manual Version 2.20, Oct. 2007
Page 190 of 202
UVS SOFTWARE for UVIKON 900 / XS /XL
USER MANUAL
Move the track bar to set the stirrer speed, the stirrer will follow immediately.
3.5. Sipper
In the Method screen you can define the way for sipper handling
In addition to the volume and delay parameter the Rinse, Air and Return 90% was added.
After aqcuisition the system returns 90% if activated in the method.
UVS Software for
UVIKON 900/XL/XS
Manual Version 2.20, Oct. 2007
Page 191 of 202
UVS SOFTWARE for UVIKON 900 / XS /XL
USER MANUAL
Then ask the system ask for rinsing (if the rinse value > 0)
After confirming (you can use mouse or press ENTER or BLANK for yes, ESCAPE for no)
rinsing starts with the rinsing time.
After this the system ask for removing the tube for air segment (if the air value > 0)
After confirming (you can use mouse or press ENTER or BLANK for yes, ESCAPE for no)
rinsing starts with the air time.
Next Sample:
UVS Software for
UVIKON 900/XL/XS
Manual Version 2.20, Oct. 2007
Page 192 of 202
UVS SOFTWARE for UVIKON 900 / XS /XL
USER MANUAL
3.6. Liquid handler
The gilson liquid handler (221,221XL) can be controlled by the software if the module is installed.
Prepare operation of liquid handler:
Activate in options menu the liquid handler by ticking the checkbox. Select the serial port connected to
the liquid handler. Please check that this port is free and the baudrate of the 221 is set to 9600.
Select the type of the handler and the id.
UVS Software for
UVIKON 900/XL/XS
Manual Version 2.20, Oct. 2007
Page 193 of 202
UVS SOFTWARE for UVIKON 900 / XS /XL
USER MANUAL
Prepare method with liquid handler :
Activate the liquid handler in the method by ticking the checkbox.
If you want to add a new liquid handler method or link this method with a liquid handler method press
the button right of the box .
Liquid handler
For linking with a liquid handler method select the method and press ok.
Select a method
UVS Software for
UVIKON 900/XL/XS
Manual Version 2.20, Oct. 2007
Page 194 of 202
UVS SOFTWARE for UVIKON 900 / XS /XL
USER MANUAL
Create a new gilson method :
Press the ‘+’ button and fill the save name in the window.
Fill the parameter as decribed below:
1. X Position :
This is the first vial position in the upper left corner of the rack regarding the the
zero point position of the needle in x-direction.
1. Y Position :
This is the first vial position in the upper left corner of the rack regarding the the
zero point position of the needle in y-direction.
X Step
Y Step
Distance between 2 adjacent vial position in x direction
Distance between 2 adjacent vial position in y direction
No of Pos in X
No of Pos in Y
Number of positions per rack in x direction
Number of positions per rack in y direction
Rack width
Width of a rack in mm
No of racks
Total count of racks on the liquid handler
If you have a rinsing tube on the liquid handler, please fill the position of this tube in the rinsing station
section.
UVS Software for
UVIKON 900/XL/XS
Manual Version 2.20, Oct. 2007
Page 195 of 202
UVS SOFTWARE for UVIKON 900 / XS /XL
USER MANUAL
How to prepare the sample positions :
The sample position in the racks for acquisition must have the exact the same order as defined here.
Please check the positions before you start the acuisition otherwise the system get the wrong sample.
In this example the sample positions are filled with y-order.
th
Example of a sample with 2 replicates in a rack with 4 columns. The 4 column is free.
UVS Software for
UVIKON 900/XL/XS
Manual Version 2.20, Oct. 2007
Page 196 of 202
UVS SOFTWARE for UVIKON 900 / XS /XL
USER MANUAL
How to use it :
Create a method with 3 ‘No of pos in x’ and fill with x -order
Set ‘No of pos in x‘ to 4 positions and select an area of positions by pressing shift and left mouse
button on position 1-1. Then move to position 3-11 with holding down shift and left mouse button and
release the mouse button at the position 3-11. The selected area is marked as blue except the first
and the last position.
UVS Software for
UVIKON 900/XL/XS
Manual Version 2.20, Oct. 2007
Page 197 of 202
UVS SOFTWARE for UVIKON 900 / XS /XL
USER MANUAL
Copy the selected cells by pressing the right mouse button.
UVS Software for
UVIKON 900/XL/XS
Manual Version 2.20, Oct. 2007
Page 198 of 202
UVS SOFTWARE for UVIKON 900 / XS /XL
USER MANUAL
Set No of racks to 2, goto position 5-1 and paste the prior selected cells.
Note : The number of samples must be equal or higher than the number of samples of the
acquisitions, otherwise the handler is not able to find any position.
Save the method with the post button
UVS Software for
UVIKON 900/XL/XS
Manual Version 2.20, Oct. 2007
Page 199 of 202
UVS SOFTWARE for UVIKON 900 / XS /XL
USER MANUAL
3.7. Katalase
Katalase is a module for calculation a time by a given absorbance start and end point in time drive if
the module is installed.
A decreasing reaction will acquire in timedrive. If the absorption has reached two defined points, the
time between is calculated.
The parameters must be entered in the ‚Edit Calculation Parameter’.
Checkbox Katalase should be activated, Aktivity must be not activated.
From :
To
:
Decimals :
Calculation:
Absorbance value for start point.
Absorbance value for end point.
Decimal points of the result
Calulation formula
Possible variables :
F – individual factor per sample
T – calculated time from start to end point.
Example : 13*17*F/(T*0,05)
Time
Interval:
The result will be marked with * if the calculated time is outside.
Units:
Remark of the unit.
UVS Software for
UVIKON 900/XL/XS
Manual Version 2.20, Oct. 2007
Page 200 of 202
UVS SOFTWARE for UVIKON 900 / XS /XL
USER MANUAL
The results are shown in the result tab sheet.
A factor per sample can be entered, if the field is blanked a value of 1 will be calulated.
UVS Software for
UVIKON 900/XL/XS
Manual Version 2.20, Oct. 2007
Page 201 of 202
UVS SOFTWARE for UVIKON 900 / XS /XL
USER MANUAL
The linear regression curve is shown.
UVS Software for
UVIKON 900/XL/XS
Manual Version 2.20, Oct. 2007
Page 202 of 202