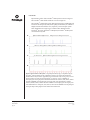
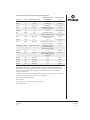
1
Technical Manual
PowerPlex® 16 HS System
INSTRUCTIONS FOR USE OF PRODUCTS DC2100 AND DC2101.
PRINTED IN USA
1/09
Part# TMD022
PowerPlex® 16 HS System
All technical literature is available on the Internet at: www.promega.com/tbs/
Please visit the web site to verify that you are using the most current version of this Technical Manual.
Please contact Promega Technical Services if you have questions on use of this system.
E-mail: [email protected]
1.
Description..................................................................................................................................2
2.
Product Components and Storage Conditions ....................................................................4
3.
Before You Begin .......................................................................................................................5
A. Precautions ........................................................................................................................5
B. Matrix Standardization or Spectral Calibration ..........................................................6
4.
Protocols for DNA Amplification Using the PowerPlex® 16 HS System ......................6
A. Amplification Setup.........................................................................................................7
B. Amplification Thermal Cycling .....................................................................................9
5.
Instrument Setup and Sample Preparation........................................................................11
A. Detection of Amplified Fragments Using the ABI PRISM®
3100 or 3100-Avant Genetic Analyzer with Data Collection
Software, Version 2.0, and the Applied Biosystems 3130 or 3130xl
Genetic Analyzer with Data Collection Software, Version 3.0 ...............................11
B. Detection of Amplified Fragments Using the ABI PRISM® 3100
Genetic Analyzer with Data Collection Software, Version 1.0.1 or 1.1 .................14
C. Detection of Amplified Fragments Using the ABI PRISM® 310
Genetic Analyzer............................................................................................................16
6.
Data Analysis ...........................................................................................................................19
A. PowerPlex® Panel and Bin Sets with GeneMapper® ID, Version 3.2.....................19
B. Creating a Casework Analysis Method with GeneMapper® ID Software............20
C. Creating a Databasing or Paternity Analysis Method
with GeneMapper® ID Software..................................................................................24
D. Sample Analysis Using the GeneScan® Software
and Windows® Operating Systems .............................................................................26
E. Sample Analysis Using the GeneScan® Software
and Macintosh® Operating Systems ...........................................................................27
F.
Sample Analysis Using the Genotyper® Software
and PowerTyper™ 16 Macro .......................................................................................29
G. Controls ...........................................................................................................................31
H. Results..............................................................................................................................32
7.
Troubleshooting.......................................................................................................................34
A. Amplification and Fragment Detection......................................................................34
B. GeneMapper® ID Analysis Software...........................................................................37
C. PowerTyper™ 16 Macro ...............................................................................................40
8.
References .................................................................................................................................41
Promega Corporation · 2800 Woods Hollow Road · Madison, WI 53711-5399 USA · Toll Free in USA 800-356-9526 · Phone 608-274-4330 · Fax 608-277-2516 · www.promega.com
Printed in USA.
1/09
Part# TMD022
Page 1
9.
1.
Appendix ...................................................................................................................................43
A. Preparing the PowerPlex® 16 HS System PCR Amplification Mix ........................43
B. Advantages of STR Typing...........................................................................................44
C. Advantages of Using the Loci in the PowerPlex® 16 HS System ...........................44
D. Power of Discrimination ...............................................................................................48
E. The Internal Lane Standard 600...................................................................................48
F.
Composition of Buffers and Solutions........................................................................49
G. DNA Extraction and Quantitation Methods..............................................................49
H. Related Products ............................................................................................................50
Description
STR (short tandem repeat) loci consist of short, repetitive sequence elements 3–7 base
pairs in length (1–4). These repeats are well distributed throughout the human genome
and are a rich source of highly polymorphic markers, which may be detected using
the polymerase chain reaction (5–9). Alleles of STR loci are differentiated by the
number of copies of the repeat sequence contained within the amplified region and
are distinguished from one another using radioactive, silver stain or fluorescence
detection following electrophoretic separation.
The PowerPlex® 16 HS System(a–e) allows co-amplification and three-color detection
of sixteen loci (fifteen STR loci and Amelogenin), including Penta E, D18S51, D21S11,
TH01, D3S1358, FGA, TPOX, D8S1179, vWA, Amelogenin, Penta D, CSF1PO,
D16S539, D7S820, D13S317 and D5S818. One primer for each of the Penta E, D18S51,
D21S11, TH01 and D3S1358 loci is labeled with fluorescein (FL); one primer for each
of the FGA, TPOX, D8S1179, vWA and Amelogenin loci is labeled with carboxytetramethylrhodamine (TMR); and one primer for each of the Penta D, CSF1PO,
D16S539, D7S820, D13S317 and D5S818 loci is labeled with 6-carboxy-4´,5´-dichloro2´,7´-dimethoxy-fluorescein (JOE). All sixteen loci are amplified simultaneously in a
single tube and analyzed in a single injection or gel lane.
The PowerPlex® 16 HS System is compatible with the ABI PRISM® 310, 3100 and
3100-Avant Genetic Analyzers and Applied Biosystems 3130 and 3130xl Genetic
Analyzers. The protocols presented in this manual were tested at Promega
Corporation. Amplification and detection instrumentation may vary. You may need
to optimize protocols including cycle number and injection time (or loading volume)
for each laboratory instrument. In-house validation should be performed.
The PowerPlex® 16 HS System provides all of the materials necessary for
amplification of STR regions of purified genomic DNA, including hot-start Taq DNA
polymerase. This manual contains separate protocols for use of the PowerPlex® 16
HS System with the Perkin-Elmer model 480 and GeneAmp® PCR system 9600 and
9700 thermal cyclers in addition to protocols to separate amplified products and
detect separated material (Figure 1). Protocols for operation of the fluorescencedetection instruments should be obtained from the instrument manufacturer.
Information on other Promega fluorescent STR systems, including the PowerPlex® 16
Monoplex Systems, and detection of amplified STR fragments using silver staining is
available upon request from Promega or online at: www.promega.com
Promega Corporation · 2800 Woods Hollow Road · Madison, WI 53711-5399 USA · Toll Free in USA 800-356-9526 · Phone 608-274-4330 · Fax 608-277-2516 · www.promega.com
Part# TMD022
Page 2
Printed in USA.
1/09
Amplification Setup
Section 4.A
Thermal Cycling
Section 4.B
GeneAmp® PCR System 9700
GeneAmp® PCR System 9600
Model 480 Thermal Cycler
Instrument Setup and Sample Preparation
Section 5.
Applied Biosystems 3130 or
3130xl Genetic Analyzer with
Data Collection Software,
Version 3.0
Section 5.A.
ABI PRISM® 3100 or
3100-Avant Genetic Analyzer
with Data Collection Software,
Version 2.0
Section 5.A.
ABI PRISM® 3100 Genetic
Analyzer with Data Collection
Software, Version 1.0.1 or 1.1
Section 5.B.
ABI PRISM® 310 Genetic
Analyzer
Section 5.C.
Data Analysis
Section 6.
GeneMapper® ID Software,
Versions 3.1 and 3.2
GeneScan® Software and
Windows® Operating
Systems
GeneScan® Software and
Macintosh® Operating
Systems
Figure 1. An overview of the PowerPlex® 16 HS System protocol
Promega Corporation · 2800 Woods Hollow Road · Madison, WI 53711-5399 USA · Toll Free in USA 800-356-9526 · Phone 608-274-4330 · Fax 608-277-2516 · www.promega.com
Printed in USA.
1/09
Part# TMD022
Page 3
2.
Product Components and Storage Conditions
Product
PowerPlex® 16 HS System
Size
100 reactions
Cat.#
DC2101
Not For Medical Diagnostic Use. This system contains sufficient reagents for 100 reactions
of 25μl each. Includes:
Pre-amplification Components Box (Blue Label)
1 × 500μl
PowerPlex® HS 5X Master Mix
1 × 250μl
PowerPlex® 16 HS 10X Primer Pair Mix
25μl
9947A DNA (10ng/μl)
5 × 1,250μl
Water, Amplification Grade
Post-amplification Components Box (Beige Label)
1 × 25μl
PowerPlex® 16 HS Allelic Ladder Mix
1× 150μl
Internal Lane Standard (ILS) 600
Product
PowerPlex® 16 HS System
Size
400 reactions
Cat.#
DC2100
Not For Medical Diagnostic Use. This system contains sufficient reagents for 400 reactions
of 25μl each. Includes:
Pre-amplification Components Box (Blue Label)
4 × 500μl
PowerPlex® HS 5X Master Mix
4 × 250μl
PowerPlex® 16 HS 10X Primer Pair Mix
25μl
9947A DNA (10ng/μl)
10 × 1,250μl
Water, Amplification Grade
Post-amplification Components Box (Beige Label)
4 × 25μl
PowerPlex® 16 HS Allelic Ladder Mix
4 × 150μl
Internal Lane Standard (ILS) 600
!
The PowerPlex® 16 HS Allelic Ladder Mix is provided in a separate, sealed bag for
shipping. This component should be moved to the post-amplification box after
opening.
Storage Conditions: Store all components at –20°C in a nonfrost-free freezer. The
PowerPlex® 16 HS 10X Primer Pair Mix, PowerPlex® 16 HS Allelic Ladder Mix and
Internal Lane Standard 600 are light-sensitive and must be stored in the dark. We
strongly recommend that pre-amplification and post-amplification reagents be stored
and used separately with different pipettes, tube racks, etc. For daily use, the
PowerPlex® 16 HS 10X Primer Pair Mix and PowerPlex® HS 5X Master Mix can be
stored at 4°C for up to a total of 1 week without loss of activity. The 9947A DNA and
Water, Amplification Grade, can be stored at 4°C long term.
Promega Corporation · 2800 Woods Hollow Road · Madison, WI 53711-5399 USA · Toll Free in USA 800-356-9526 · Phone 608-274-4330 · Fax 608-277-2516 · www.promega.com
Part# TMD022
Page 4
Printed in USA.
1/09
Available Separately
Product
PowerTyper™ Macros (Release 2.0)
Size
1 CD-ROM
Cat.#
DG3470
Not For Medical Diagnostic Use.
The PowerTyper™ Macros (Release 2.0), for use with Genotyper® software, are
available from Promega. This CD-ROM contains the file “PowerTyper™ 16 Macro
(Release 2.0)” for use with the PowerPlex® 16 HS System. The macros can be also
downloaded at: www.promega.com/geneticidtools/
The proper panel and bin files for use with GeneMapper® ID software can be obtained
from the Promega web site at: www.promega.com/geneticidtools/panels_bins/
Matrix standards are required for initial setup of the color separation matrix. The
matrix standards are sold separately and are available for the ABI PRISM® 310
Genetic Analyzer (PowerPlex® Matrix Standards, 310; Cat.# DG4640) and the
ABI PRISM® 3100 and 3100-Avant Genetic Analyzers and Applied Biosystems 3130
and 3130xl Genetic Analyzers (PowerPlex® Matrix Standards, 3100/3130; Cat.#
DG4650). See Section 9.H for ordering information.
3.
Before You Begin
3.A. Precautions
The application of PCR-based typing for forensic or paternity casework requires
validation studies and quality-control measures that are not contained in this
manual (10,11). Guidelines for the validation process are published in the
Internal Validation of STR Systems (12).
The quality of the purified DNA, as well as small changes in buffers, ionic
strength, primer concentrations, choice of thermal cycler and thermal cycling
conditions, can affect PCR success. We suggest strict adherence to
recommended procedures for amplification and fluorescence detection.
PCR-based STR analysis is subject to contamination by very small amounts of
human DNA. Extreme care should be taken to avoid cross-contamination when
preparing sample DNA, handling primer pairs, assembling amplification
reactions and analyzing amplification products. Reagents and materials used
prior to amplification (PowerPlex® HS 5X Master Mix, PowerPlex® 16 HS 10X
Primer Pair Mix, 9947A DNA and Water, Amplification Grade) are provided in
a separate box and should be stored separately from those used following
amplification (PowerPlex® 16 HS Allelic Ladder Mix and Internal Lane
Standard 600). Always include a negative control reaction (i.e., no template) to
detect reagent contamination. We highly recommend the use of gloves and
aerosol-resistant pipette tips (e.g., ART® tips, Section 9.H).
Some reagents used in the analysis of STR products are potentially hazardous
and should be handled accordingly. Formamide is an irritant and a teratogen;
avoid inhalation and contact with skin. Read the warning label, and take
appropriate precautions when handling this substance. Always wear gloves and
safety glasses when working with formamide.
Promega Corporation · 2800 Woods Hollow Road · Madison, WI 53711-5399 USA · Toll Free in USA 800-356-9526 · Phone 608-274-4330 · Fax 608-277-2516 · www.promega.com
Printed in USA.
1/09
Part# TMD022
Page 5
3.B. Matrix Standardization or Spectral Calibration
Proper generation of a matrix file is critical to evaluate multicolor systems with
the ABI PRISM® 310, 3100 and 3100-Avant Genetic Analyzers and Applied
Biosystems 3130 and 3130xl Genetic Analyzers. A matrix must be generated for
each individual instrument.
The PowerPlex® Matrix Standards, 310 (Cat.# DG4640), is required for matrix
standardization for the ABI PRISM® 310 Genetic Analyzer. For best results, the
PowerPlex® Matrix Standards, 3100/3130 (Cat.# DG4650), should not be used to
generate a matrix on the ABI PRISM® 310 Genetic Analyzer.
The PowerPlex® Matrix Standards, 3100/3130 (Cat.# DG4650), is required for
spectral calibration on the ABI PRISM® 3100 and 3100-Avant Genetic Analyzers
and Applied Biosystems 3130 and 3130xl Genetic Analyzers. The PowerPlex®
Matrix Standards, 310 (Cat.# DG4640), cannot be used to generate a matrix on
these instruments.
For protocols and additional information on matrix standardization, see the
PowerPlex ® Matrix Standards, 310, Technical Bulletin #TBD021. For protocols and
additional information on spectral calibration, see the PowerPlex ® Matrix
Standards, 3100/3130, Technical Bulletin #TBD022. These manuals are available
online at: www.promega.com/tbs/
4.
Protocols for DNA Amplification Using the PowerPlex® 16 HS System
Materials to Be Supplied by the User
• PerkinElmer model 480 or GeneAmp® PCR System 9600 or 9700 thermal cycler
(Applied Biosystems)
• microcentrifuge
• 0.5ml GeneAmp® or 0.2ml MicroAmp® reaction tubes or MicroAmp® optical
96-well reaction plate (Applied Biosystems)
• 1.5ml amber-colored microcentrifuge tubes (Fisher Cat.# 05-402-26)
• aerosol-resistant pipette tips (see Section 9.H)
• Mineral Oil (Cat.# DY1151, for use with the model 480 thermal cycler)
We routinely amplify 0.5ng of template DNA in a 25μl reaction volume using the
protocols detailed below. With >1ng of DNA, preferential amplification of smaller
loci may occur. Expect to see high peak heights at the smaller loci and relatively
lower peak heights at the larger loci if more than the recommended amount of
template is used. Reduce the amount of template DNA or the number of cycles to
correct this.
The PowerPlex® 16 HS System is optimized for the GeneAmp® PCR System 9700
thermal cycler. Amplification protocols for the GeneAmp® PCR Systems 9600
thermal cycler and Perkin-Elmer model 480 thermal cycler are provided.
Promega Corporation · 2800 Woods Hollow Road · Madison, WI 53711-5399 USA · Toll Free in USA 800-356-9526 · Phone 608-274-4330 · Fax 608-277-2516 · www.promega.com
Part# TMD022
Page 6
Printed in USA.
1/09
4.A. Amplification Setup
The use of gloves and aerosol-resistant pipette tips is highly recommended to
prevent cross-contamination. Keep all pre-amplification and post-amplification
reagents in separate rooms. Prepare amplification reactions in a room dedicated
for reaction setup. Use equipment and supplies dedicated for amplification setup.
!
Meticulous care must be taken to ensure successful amplification. A guide to
amplification troubleshooting is provided in Section 7.A.
1.
Thaw the PowerPlex® HS 5X Master Mix, PowerPlex® 16 HS 10X Primer
Pair Mix and 9947A DNA completely.
Note: Mix reagents by vortexing for 15 seconds before each use. Do not
centrifuge the 10X Primer Pair Mix, as this may cause the primers to be
concentrated at the bottom of the tube.
2.
Determine the number of reactions to be set up. This should include
positive and negative control reactions. Add 1 or 2 reactions to this
number to compensate for pipetting error. While this approach does
consume a small amount of each reagent, it ensures that you will have
enough PCR amplification mix for all samples. It also ensures that each
reaction contains the same PCR amplification mix.
3.
Place one clean, 0.2ml or 0.5ml reaction tube for each reaction into a rack,
and label appropriately. Alternatively, use a MicroAmp® plate, and label
appropriately.
Note: If using the GeneAmp® PCR System 9600 or 9700 thermal cyclers,
use 0.2ml MicroAmp® 8-strip reaction tubes or MicroAmp® plate. For the
Perkin-Elmer model 480 thermal cycler, we recommend 0.5ml GeneAmp®
thin-walled reaction tubes.
4.
Add the final volume of each reagent listed in Table 1 into a sterile, 1.5ml
amber-colored tube. Mix gently.
Table 1 shows the component volumes per reaction. A worksheet to
calculate the required amount of each PCR amplification mix component
is provided in Section 9.A (Table 2).
Note: In tests performed at Promega, we have found that reactions can
remain at room temperature for up to 8 hours after reaction assembly and
prior to thermal cycling with no adverse effect on amplification results.
!
Amplification of >1.0ng of DNA template may result in an imbalance in
peak heights from locus to locus. The smaller loci show greater
amplification yield than the larger loci. Reducing the number of cycles in
the amplification program by 2 to 4 cycles (i.e., 10/20 or 10/18 cycling)
can improve locus-to-locus balance.
Promega Corporation · 2800 Woods Hollow Road · Madison, WI 53711-5399 USA · Toll Free in USA 800-356-9526 · Phone 608-274-4330 · Fax 608-277-2516 · www.promega.com
Printed in USA.
1/09
Part# TMD022
Page 7
4.A. Amplification Setup (continued)
Table 1. PCR Amplification Mix for the PowerPlex® 16 HS System.
PCR Amplification Mix Component1
Water, Amplification Grade
Volume Per Reaction
to a final volume of 25.0μl
PowerPlex® HS 5X Master Mix
5.0μl
PowerPlex® 16 HS 10X Primer Pair Mix
2.5μl
template DNA (0.5–1ng) 2,3
up to 17.5μl
total reaction volume
25μl
1Add
Water, Amplification Grade, to the tube first, then add PowerPlex® HS 5X
Master Mix and PowerPlex® 16 HS 10X Primer Pair Mix. The template DNA will
be added at Step 6.
2Store DNA templates in nuclease-free water or TE-4 buffer (10mM Tris-HCl
[pH 8.0], 0.1mM EDTA). If the DNA template is stored in TE buffer that is not
pH 8.0 or contains a higher EDTA concentration, the volume of DNA added
should not exceed 20% of the final reaction volume. Amplification efficiency and
quality can be greatly altered by changes in pH (due to added Tris-HCl), available
magnesium concentration (due to chelation by EDTA) or other PCR inhibitors,
which may be present at low concentrations depending on the source of the
template DNA and the extraction procedure used.
3Apparent DNA concentrations can differ, depending on the DNA quantification
method used. The amount of DNA template recommended here is based on DNA
concentrations determined by measuring absorbance at 260nm. We strongly
recommend that you perform experiments to determine the optimal DNA amount
for your particular DNA quantification method.
5.
Vortex the PCR amplification mix for 5–10 seconds, then pipet PCR
amplification mix into each reaction tube.
!
6.
Failure to vortex the PCR amplification mix sufficiently can result in poor
amplification, peak height imbalance and extra peaks.
Pipet the template DNA (0.5ng) for each sample into the respective tube
containing PCR amplification mix.
Note: Apparent DNA concentrations can differ, depending on the DNA
quantification method used (13). The amount of DNA template
recommended here is based on DNA concentrations determined by
measuring absorbance at 260nm. We strongly recommend that you
perform experiments to determine the optimal DNA amount for your
particular DNA quantification method.
7.
For the positive amplification control, dilute 9947A DNA to 0.5–1.0ng in
the desired template DNA volume. Pipet 0.5–1.0ng of the diluted DNA
into a reaction tube containing PCR amplification mix.
Note: The 9947A DNA, which is cell line-derived, will show allelic
imbalance and imbalance between STR loci. We supply the 9947A DNA as
a positive control template to confirm that the correct STR profile is
obtained, not to show a balanced profile. Do not use cell line-derived
DNA to determine sensitivity or verify balance.
Promega Corporation · 2800 Woods Hollow Road · Madison, WI 53711-5399 USA · Toll Free in USA 800-356-9526 · Phone 608-274-4330 · Fax 608-277-2516 · www.promega.com
Part# TMD022
Page 8
Printed in USA.
1/09
8.
For the negative amplification control, pipet Water, Amplification Grade,
or TE–4 buffer (instead of template DNA) into a reaction tube containing
PCR amplification mix.
9.
If using the GeneAmp® PCR System 9600 or 9700 thermal cycler and
MicroAmp® reaction tubes or plates, no addition of mineral oil to the
reaction tubes is required. However, if using the model 480 thermal cycler
and GeneAmp® reaction tubes, add one drop of mineral oil to each tube
before closing.
Note: Allow the mineral oil to flow down the side of the tube and form an
overlay to limit sample loss or cross-contamination due to splattering.
4.B. Amplification Thermal Cycling
This manual contains protocols for use of the PowerPlex® 16 HS System with
the Perkin-Elmer model 480 and GeneAmp® PCR system 9600 and 9700 thermal
cyclers. For information on other thermal cyclers, please contact Promega
Technical Services by e-mail: [email protected]
Amplification and detection instrumentation may vary. You may need to
optimize protocols including cycle number and injection time (or loading
volume) for each laboratory instrument. Testing at Promega Corporation shows
that 10/22 cycles work well for 0.5ng of purified DNA templates. For higher
amounts of input DNA (i.e., FTA® paper) or to decrease sensitivity, fewer
cycles, such as 10/16, 10/18 or 10/20, should be evaluated. In-house validation
should be performed.
1.
Place the tubes or MicroAmp® plate in the thermal cycler.
2.
Select and run a recommended protocol. The preferred protocols for use
with the GeneAmp® PCR System 9600 and 9700 thermal cyclers and
Perkin-Elmer model 480 thermal cycler are provided below.
3.
After completion of the thermal cycling protocol, store the amplified
samples at –20°C in a light-protected box.
Note: Storage of amplified samples at 4°C or higher may produce
degradation products.
Promega Corporation · 2800 Woods Hollow Road · Madison, WI 53711-5399 USA · Toll Free in USA 800-356-9526 · Phone 608-274-4330 · Fax 608-277-2516 · www.promega.com
Printed in USA.
1/09
Part# TMD022
Page 9
Protocol for the GeneAmp® PCR
System 9600 Thermal Cycler
Protocol for the GeneAmp® PCR
System 9700 Thermal Cycler1
96°C for 2 minutes, then:
96°C for 2 minutes, then:
94°C for 30 seconds
ramp 68 seconds to 60°C (hold for 30 seconds)
ramp 50 seconds to 70°C (hold for 45 seconds)
for 10 cycles, then:
ramp 100% to 94°C for 30 seconds
ramp 29% to 60°C for 30 seconds
ramp 23% to 70°C for 45 seconds
for 10 cycles, then:
90°C for 30 seconds
ramp 60 seconds to 60°C (hold for 30 seconds)
ramp 50 seconds to 70°C (hold for 45 seconds)
for 22 cycles, then:
ramp 100% to 90°C for 30 seconds
ramp 29% to 60°C for 30 seconds
ramp 23% to 70°C for 45 seconds
for 22 cycles, then:
60°C for 30 minutes
60°C for 30 minutes
4°C soak
4°C soak
Protocol for the Perkin-Elmer
Model 480 Thermal Cycler
96°C for 2 minutes, then:
94°C for 1 minute
60°C for 1 minute
70°C for 1.5 minutes
for 10 cycles, then:
90°C for 1 minute
60°C for 1 minute
70°C for 1.5 minutes
for 22 cycles, then:
60°C for 30 minutes
4°C soak
1When
using the GeneAmp® PCR System 9700 thermal cycler, the ramp rates indicated in the
cycling program must be set, and the program must be run in 9600 ramp mode.
The ramp rates are set in the Ramp Rate Modification screen. While viewing the cycling program,
navigate to the Ramp Rate Modification screen by selecting "More", then "Modify". On the Ramp
Rate Modification screen the default rates for each step are 100%. The rate under each hold step is
the rate at which the temperature will change to that hold temperature. Figure 2 shows the
appropriate ramp rates for the GeneAmp® PCR System 9700 thermal cycler.
The ramp mode is set after “start” has been selected for the thermal cycling run. A Select Method
Options screen appears. Select 9600 ramp mode, and enter the reaction volume.
94.0°C
100%
70.0°C
23%
60.0°C
29%
3 tmp 22 cycles
90.0°C
100%
70.0°C
23%
60.0°C
29%
7486MA
3 tmp 10 cycles
Figure 2. The ramp rates for the GeneAmp® PCR System 9700 thermal cycler.
Promega Corporation · 2800 Woods Hollow Road · Madison, WI 53711-5399 USA · Toll Free in USA 800-356-9526 · Phone 608-274-4330 · Fax 608-277-2516 · www.promega.com
Part# TMD022
Page 10
Printed in USA.
1/09
5.
Instrument Setup and Sample Preparation
5.A. Detection of Amplified Fragments Using the ABI PRISM® 3100 or 3100-Avant
Genetic Analyzer with Data Collection Software, Version 2.0, and the Applied
Biosystems 3130 or 3130xl Genetic Analyzer with Data Collection Software,
Version 3.0
Materials to Be Supplied by the User
• 95°C dry heating block, water bath or thermal cycler
• crushed ice or ice-water bath
• centrifuge compatible with 96-well plates
• aerosol-resistant pipette tips
• 3100 or 3130 capillary array, 36cm
• performance optimized polymer 4 (POP-4™) for the 3100 or 3130
• 10X genetic analyzer buffer with EDTA
• MicroAmp® optical 96-well plate and septa
• Hi-Di™ formamide (Applied Biosystems Cat.# 4311320)
• PowerPlex® Matrix Standards, 3100/3130 (Cat.# DG4650)
!
The quality of formamide is critical. Use Hi-Di™ formamide with a conductivity
less than 100μS/cm. Freeze formamide in aliquots at –20°C. Multiple freeze-thaw
cycles or long-term storage at 4°C may cause a breakdown of the formamide.
Formamide with a conductivity greater than 100μS/cm may contain ions that
compete with DNA during injection, which results in lower peak heights and
reduced sensitivity. A longer injection time may not increase the signal.
!
Caution: Formamide is an irritant and a teratogen; avoid inhalation and contact
with skin. Read the warning label, and take appropriate precautions when
handling this substance. Always wear gloves and safety glasses when working
with formamide.
Sample Preparation
1.
Prepare a loading cocktail by combining and mixing Internal Lane
Standard 600 and Hi-Di™ formamide as follows:
[(0.5μl ILS 600) × (# injections)] + [(9.5μl Hi-Di™ formamide) × (# injections)]
Note: The volume of internal lane standard used in the loading cocktail can
be increased or decreased to adjust the intensity of the size standard peaks.
The optimal peak height for the 100-base fragment of the internal lane
standard is 500–1,000RFU. If peak heights are too low, we recommend
altering the formamide/internal lane standard mix to contain 1.0μl of ILS
600 and 9.0μl of Hi-Di™ formamide. If peak heights are too high, we
recommend altering the loading cocktail to contain 0.25μl of ILS 600 and
9.75μl of formamide.
2.
Mix for 10–15 seconds using a vortex mixer.
3.
Pipet 10μl of formamide/internal lane standard mix into each well.
Promega Corporation · 2800 Woods Hollow Road · Madison, WI 53711-5399 USA · Toll Free in USA 800-356-9526 · Phone 608-274-4330 · Fax 608-277-2516 · www.promega.com
Printed in USA.
1/09
Part# TMD022
Page 11
5.A. Detection of Amplified Fragments Using the ABI PRISM® 3100 or 3100-Avant
Genetic Analyzer with Data Collection Software, Version 2.0, and the Applied
Biosystems 3130 or 3130xl Genetic Analyzer with Data Collection Software
Version 3.0 (continued)
4.
Add 1μl of amplified sample (or 1μl of allelic ladder mix). Cover wells with
appropriate septa.
Note: Instrument detection limits vary; therefore, injection time or the
amount of product mixed with loading cocktail may need to be increased
or decreased. Use the “Module Manager” in the data collection software to
modify the injection time or voltage in the run module. If peak heights still
are higher than desired, use less DNA template in the amplification
reactions or reduce the number of cycles in the amplification program by
2–4 cycles to achieve the desired signal intensity.
5.
Centrifuge plate briefly to remove air bubbles from the wells if necessary.
6.
Denature samples at 95°C for 3 minutes, then immediately chill on crushed
ice or in an ice-water bath for 3 minutes. Denature samples just prior to
loading the instrument.
Instrument Preparation
Refer to the instrument users’ manual for instructions on cleaning, installing the
capillary array, performing a spatial calibration and adding polymer.
Analyze samples as described in the user’s manual for the ABI PRISM® 3100 or
3100-Avant Genetic Analyzer with data collection software, version 2.0, and the
Applied Biosystems 3130 or 3130xl Genetic Analyzer with the following
exceptions.
1.
In the Module Manager, select “New”. Select “Regular” in the Type dropdown list, and select “HIDFragmentAnalysis36_POP4” in the Template
drop-down list. Confirm that the injection time is 5 seconds and the
injection voltage is 3kV. Lengthen the run time to 1,800 seconds. Give a
descriptive name to your run module, and select “OK”.
Note: Instrument sensitivities can vary. The injection time and voltage
may be adjusted in the Module Manager. A suggested range for the
injection time is 3–22 seconds and for the injection voltage is 1–3kV.
2.
In the Protocol Manager, select “New”. Type a name for your protocol.
Select “Regular” in the Type drop-down list, and select the run module
you created in the previous step in the Run Module drop-down list.
Lastly, select “F” in the Dye-Set drop-down list. Select “OK.
Promega Corporation · 2800 Woods Hollow Road · Madison, WI 53711-5399 USA · Toll Free in USA 800-356-9526 · Phone 608-274-4330 · Fax 608-277-2516 · www.promega.com
Part# TMD022
Page 12
Printed in USA.
1/09
3.
In the Plate Manager, create a new plate record as described in the
instrument user’s manual. In the dialog box that appears, select
“GeneMapper—Generic” in the Application drop-down list, and select the
appropriate plate type (96-well). Add entries in the owner and operator
windows, and select “OK”.
Note: If autoanalysis of sample data is desired, refer to the instrument
user’s manual for instructions.
4.
In the GeneMapper® plate record, enter sample names in the appropriate
cells. Scroll to the right. In the Results group 1 column, select the desired
results group. In the “Instrument Protocol 1” column, select the protocol
you created in Step 2. Be sure this information is present for each row that
contains a sample name. Select “OK”.
Note: To create a new results group, select “New” in the drop-down menu
in the results group column. Select the General tab, and enter a name.
Select the Analysis tab, and select “GeneMapper—Generic” in the
Analysis type drop-down list.
5.
Place samples in the instrument, and close the instrument doors.
6.
In the spectral viewer, confirm that dye set F is active, and set the correct
active calibration for dye set F.
7.
In the run scheduler, locate the plate record that you just created in Steps 3
and 4, and click once on the name to highlight it.
8.
Once the plate record is highlighted, click the plate graphic that corresponds
to the plate on the autosampler that contains your amplified samples.
9.
When the plate record is linked to the plate, the plate graphic will change
from yellow to green, and the green Run Instrument arrow becomes
enabled.
10. Click on the green Run Instrument arrow on the toolbar to start the
sample run.
11. Monitor electrophoresis by observing the run, view, array or capillaries
viewer window in the data collection software. Each injection will take
approximately 45 minutes.
Promega Corporation · 2800 Woods Hollow Road · Madison, WI 53711-5399 USA · Toll Free in USA 800-356-9526 · Phone 608-274-4330 · Fax 608-277-2516 · www.promega.com
Printed in USA.
1/09
Part# TMD022
Page 13
5.B. Detection of Amplified Fragments Using the ABI PRISM® 3100 Genetic
Analyzer with Data Collection Software, Version 1.0.1 or 1.1
Materials to Be Supplied by the User
• 95°C dry heating block, water bath or thermal cycler
• crushed ice or ice-water bath
• centrifuge compatible with 96-well plates
• aerosol-resistant pipette tips
• 3100 capillary array, 36cm
• performance optimized polymer 4 (POP-4™) for the 3100
• 10X genetic analyzer buffer with EDTA
• MicroAmp® optical 96-well plate and septa for the 3100
• Hi-Di™ formamide (Applied Biosystems Cat.# 4311320)
• PowerPlex® Matrix Standards, 3100/3130 (Cat.# DG4650)
!
The quality of formamide is critical. Use Hi-Di™ formamide with a conductivity
less than 100μS/cm. Freeze formamide in aliquots at –20°C. Multiple freeze-thaw
cycles or long-term storage at 4°C may cause a breakdown of the formamide.
Formamide with a conductivity greater than 100μS/cm may contain ions that
compete with DNA during injection, which results in lower peak heights and
reduced sensitivity. A longer injection time may not increase the signal.
!
Caution: Formamide is an irritant and a teratogen; avoid inhalation and contact
with skin. Read the warning label, and take appropriate precautions when
handling this substance. Always wear gloves and safety glasses when working
with formamide.
Sample Preparation
1.
Prepare a loading cocktail by combining and mixing Internal Lane
Standard 600 and Hi-Di™ formamide as follows:
[(0.5μl ILS 600) × (# injections)] + [(9.5μl Hi-Di™ formamide) × (# injections)]
Note: The volume of internal lane standard used in the loading cocktail can
be increased or decreased to adjust the intensity of the size standard peaks.
The optimal peak height for the 100-base fragment of the internal lane
standard is 500–1,000RFU. If peak heights are too low, we recommend
altering the formamide/internal lane standard mix to contain 1.0μl of ILS
600 and 9.0μl of Hi-Di™ formamide. If peak heights are too high, we
recommend altering the loading cocktail to contain 0.25μl of ILS 600 and
9.75μl of formamide.
2.
Mix for 10–15 seconds using a vortex mixer.
3.
Pipet 10μl of formamide/internal lane standard mix into each well.
Promega Corporation · 2800 Woods Hollow Road · Madison, WI 53711-5399 USA · Toll Free in USA 800-356-9526 · Phone 608-274-4330 · Fax 608-277-2516 · www.promega.com
Part# TMD022
Page 14
Printed in USA.
1/09
4.
Add 1μl of amplified sample (or 1μl of allelic ladder mix). Cover wells
with appropriate septa.
Note: Instrument detection limits vary; therefore, injection time or the
amount of product mixed with loading cocktail may need to be increased
or decreased. Use the “Module Manager” in the data collection software to
modify the injection time or voltage in the run module. If peak heights are
higher than desired, use less DNA template in the amplification reactions
or reduce the number of cycles in the amplification program by 2–4 cycles
to achieve the desired signal intensity.
5.
Centrifuge plate briefly to remove air bubbles from the wells if necessary.
6.
Denature samples at 95°C for 3 minutes, then immediately chill on
crushed ice or in an ice-water bath for 3 minutes. Denature samples just
prior to loading the instrument.
Instrument Preparation
Refer to the ABI PRISM® 3100 Genetic Analyzer User’s Manual for instructions on
cleaning the blocks, installing the capillary array, performing a spatial calibration
and adding polymer to the reserve syringe.
1.
Open the ABI PRISM® 3100 data collection software.
2.
Change the “GeneScan36_POP4DefaultModule” module run time to
1,800 seconds.
3.
Change the injection voltage to 3kV.
4.
Change the injection time to 11 seconds.
Note: Instrument sensitivities can vary. Injection time and voltage may be
adjusted in the Module Manager. A suggested range for the injection time
is 3–22 seconds and for the injection voltage is 1–3kV.
5.
Save the module with a new name (e.g.,
GeneScan36_POP4PowerPlex16_3kV_11secs_1800). Use this as the initial
run module for all runs.
6.
Open a new plate record. Name the plate, and select “GeneScan”. Select
the plate size (96-well). Select “Finish”.
7.
Complete the plate record spreadsheet for the wells you have loaded. Enter
appropriate information into the sample name and color info columns. For
allelic ladder samples, insert the word “ladder” into the color info column
for the blue, yellow and green dye colors. This information must be entered
to successfully analyze data with the PowerTyper™ 16 Macro (Release 2.0).
8.
In the BioLIMS Project column, select “3100_Project1” from the pull-down
menu.
9.
In the Dye Set column, select “Z” from the pull-down menu.
10. When using the ABI PRISM® 3100 data collection software version 1.0.1 or
1.1, select “GeneScan36_POP4PowerPlex16_3kV_11secs_1800” from the
pull-down menu in the Run Module 1 column.
Promega Corporation · 2800 Woods Hollow Road · Madison, WI 53711-5399 USA · Toll Free in USA 800-356-9526 · Phone 608-274-4330 · Fax 608-277-2516 · www.promega.com
Printed in USA.
1/09
Part# TMD022
Page 15
5.B. Detection of Amplified Fragments Using the ABI PRISM® 3100 Genetic
Analyzer with Data Collection Software, Version 1.0.1 or 1.1 (continued)
11. To collect data without autoanalyzing, select “No Selection” in the
Analysis Module 1 column. Analysis parameters can be applied after data
collection and during data analysis using the GeneScan® analysis software.
12. Select “OK”. This new plate record will appear in the pending plate
records table on the plate setup page of the collection software.
13. Place samples in the instrument, and close the instrument doors.
14. Locate the pending plate record that you just created, and click once on the
name.
15. Once the pending plate record is highlighted, click on the plate graphic
that corresponds to the plate on the autosampler that contains your
amplified samples to link the plate to the plate record.
16. When the plate record is linked to the plate, the plate graphic will change
from yellow to green, the plate record moves from the pending plate
records table to the linked plate records table, and the Run Instrument
button becomes enabled.
17. Select “Run Instrument” on the toolbar to start the sample run.
18. Monitor electrophoresis by observing the run, status, array and capillary
views windows in the collection software. Each injection will take
approximately 45 minutes.
5.C. Detection of Amplified Fragments Using the ABI PRISM® 310 Genetic Analyzer
Materials to Be Supplied by the User
• 95°C dry heating block, water bath or thermal cycler
• 310 capillaries, 47cm × 50μm
• performance optimized polymer 4 (POP-4™)
• 10X genetic analyzer buffer with EDTA
• sample tubes and septa
• aerosol-resistant pipette tips
• Hi-Di™ formamide (Applied Biosystems Cat.# 4311320)
• PowerPlex® Matrix Standards, 310 (Cat.# DG4640)
• crushed ice or ice-water bath
!
The quality of formamide is critical. Use Hi-Di™ formamide with a conductivity
less than 100μS/cm. Freeze formamide in aliquots at –20°C. Multiple freeze-thaw
cycles or long-term storage at 4°C may cause a breakdown of the formamide.
Formamide with a conductivity greater than 100μS/cm may contain ions that
compete with DNA during injection, which results in lower peak heights and
reduced sensitivity. A longer injection time may not increase the signal.
!
Caution: Formamide is an irritant and a teratogen; avoid inhalation and contact
with skin. Read the warning label, and take appropriate precautions when
handling this substance. Always wear gloves and safety glasses when working
with formamide.
Promega Corporation · 2800 Woods Hollow Road · Madison, WI 53711-5399 USA · Toll Free in USA 800-356-9526 · Phone 608-274-4330 · Fax 608-277-2516 · www.promega.com
Part# TMD022
Page 16
Printed in USA.
1/09
Sample Preparation
1.
Prepare a loading cocktail by combining Internal Lane Standard 600
(ILS 600) and Hi-Di™ formamide as follows:
[(1.0μl ILS 600) × (# injections)] + [(24.0μl Hi-Di™ formamide) × (# injections)]
Note: The volume of internal lane standard used in the loading cocktail can
be increased or decreased to adjust the intensity of the size standard peaks.
The optimal peak height for the 100-base fragment of the internal lane
standard is 500–1,000RFU. If peak heights are too high, we recommend
altering the loading cocktail to contain 0.5μl of ILS 600 and 24.5μl of Hi-Di™
formamide.
2.
Mix for 10–15 seconds using a vortex mixer.
3.
Combine 25.0μl of prepared loading cocktail and 1.0μl of amplified sample.
Note: Instrument detection limits vary; therefore, injection time or the
amount of product mixed with loading cocktail may need to be increased
or decreased. Use the “Module Manager” in the data collection software to
modify the injection time or voltage in the run module. If peak heights still
are higher than desired, use less DNA template in the amplification
reactions or reduce the number of cycles in the amplification program by
2–4 cycles to achieve the desired signal intensity.
4.
Combine 25.0μl of prepared loading cocktail and 1.0μl of PowerPlex® 16 HS
Allelic Ladder Mix.
5.
Centrifuge tubes briefly to remove air bubbles from the wells if necessary.
6.
Denature samples and ladder by heating at 95°C for 3 minutes, and
immediately chill on crushed ice or in an ice-water bath for 3 minutes.
Denature samples just prior to loading.
7.
Assemble the tubes in the appropriate autosampler tray (48- or 96-tube).
8.
Place the autosampler tray in the instrument, and close the instrument
doors.
Instrument Preparation
Refer to the instrument users’ manual for instructions on cleaning the pump
block, installing the capillary, calibrating the autosampler and adding polymer
to the syringe.
1.
Open the ABI PRISM® 310 data collection software.
2.
Prepare a GeneScan® sample sheet as described in the ABI PRISM ® 310
Genetic Analyzer User’s Manual. Enter the appropriate sample information in
the sample info column.
For rows containing PowerPlex® 16 HS Allelic Ladder Mix, insert the word
“ladder” in the sample info column for the blue dye color, yellow dye color
and green dye color. This information must be entered to successfully
analyze your data using the PowerTyper™ 16 Macro (Release 2.0).
Promega Corporation · 2800 Woods Hollow Road · Madison, WI 53711-5399 USA · Toll Free in USA 800-356-9526 · Phone 608-274-4330 · Fax 608-277-2516 · www.promega.com
Printed in USA.
1/09
Part# TMD022
Page 17
5.C. Detection of Amplified Fragments Using the ABI PRISM® 310 Genetic Analyzer
(continued)
3.
Create a new GeneScan® injection list. Select the appropriate sample sheet
by using the pull-down menu.
4.
Select the “GS STR POP4 (1ml) A” Module using the pull-down menu.
Change the injection time to 3 seconds and the run time to 30 minutes.
Keep the settings for the remaining parameters as shown below:
Inj. Secs:
Inj. kV:
Run kV:
Run °C:
Run Time:
!
3
15.0
15.0
60
30
You may need to optimize the injection time for individual instruments.
Injection times of 2–5 seconds are suggested for samples that contain
0.5–1ng of template DNA.
Note: Migration of fragments may vary slightly over the course of a long
ABI PRISM® 310 Genetic Analyzer run. This may be due to changes in
temperature or changes in the column. When analyzing many samples,
injections of allelic ladder at different times throughout the run can aid in
accurately genotyping samples.
5.
Select the appropriate matrix file (Section 3.B).
6.
To analyze data automatically, select the auto analyze checkbox and the
appropriate analysis parameters and size standard. Refer to the ABI PRISM ®
310 Genetic Analyzer User’s Manual for specific information on these options.
7.
After loading the sample tray and closing the doors, select “Run” to start
the capillary electrophoresis system.
8.
Monitor electrophoresis by observing the raw data and status windows.
Each sample will take approximately 40 minutes for syringe pumping,
sample injection and sample electrophoresis.
Promega Corporation · 2800 Woods Hollow Road · Madison, WI 53711-5399 USA · Toll Free in USA 800-356-9526 · Phone 608-274-4330 · Fax 608-277-2516 · www.promega.com
Part# TMD022
Page 18
Printed in USA.
1/09
6.
Data Analysis
6.A. PowerPlex® Panel and Bin Sets with GeneMapper ® ID, Version 3.2
To facilitate analysis of data generated with the PowerPlex® 16 HS System, we
have created panel and bin files to allow automatic assignment of genotypes
using GeneMapper® ID software, version 3.2. We recommend that users of
GeneMapper ® ID software, version 3.2, complete the Applied Biosystems
GeneMapper ® ID Software Human Identification Analysis Tutorial to familiarize
themselves with proper operation of the software. For GeneMapper® ID
software, version 3.1, users we recommend upgrading to version 3.2.
Getting Started
1.
Obtain the proper panel and bin files for use with GeneMapper® ID from
the Promega web site at: www.promega.com/geneticidtools/panels_bins/
2.
Enter your contact information, and select “GeneMapper ID version 3.2”.
Select “Submit”.
3.
Select the “PowerPlex® Panels & Bin Sets” link, and save the .zip file to
your computer.
4.
Open the files using the Windows® WinZip program, and save the
unzipped files to a known location on your computer.
Importing Panel and Bin Files
These instructions loosely follow the Applied Biosystems GeneMapper® ID
software tutorial, pages 1–4.
1.
Open the GeneMapper® ID software, version 3.2.
2.
Select “Tools”, then “Panel Manager”.
3.
Highlight the Panel Manager icon in the upper left tile (navigation pane).
4.
Select “File”, then “Import Panels”.
5.
Navigate to the saved panel and bin files. Select
“Promega_Panels_ID3.2.X.txt”, where “X” refers to the most recent version
of the panel and bin files. Select “Import”.
6.
In the navigation pane, highlight the Promega_Panels_ID3.2.X folder that
you just imported.
7.
Select “File”, then “Import Bin Set”.
8.
Navigate to the saved panel and bin files. Select
“Promega_Bins_ID3.2.X.txt”, then “Import”.
9.
At the bottom of the Panel Manager window, select “Apply”, then “OK”.
The panel manager window will close automatically.
Promega Corporation · 2800 Woods Hollow Road · Madison, WI 53711-5399 USA · Toll Free in USA 800-356-9526 · Phone 608-274-4330 · Fax 608-277-2516 · www.promega.com
Printed in USA.
1/09
Part# TMD022
Page 19
6.B. Creating a Casework Analysis Method with GeneMapper ® ID Software
These instructions loosely follow the Applied Biosystems GeneMapper® ID
software tutorial, pages 1–11.
1.
Select “Tools”, then “GeneMapper Manager”.
2.
Select the Analysis Methods tab.
3.
Select “New”, and a new analysis method dialog box will open.
4.
Select “HID”, and select “OK”.
Note: If you do not see the HID option, you do not have the
GeneMapper® ID software. Contact Applied Biosystems.
Enter a descriptive name for the analysis method, such as “PowerPlex16
advanced”.
6.
Select the Allele tab (Figure 3).
7.
Select the bin set corresponding to the PowerPlex® System
“Promega_Bins_ID3.2.X”, where “X” refers to the most recent version of
the bin set.
5724TA
5.
Figure 3. The Allele tab. Select the bin set “Promega_Bins_ID3.2.X.txt”, where “X” refers
to the most recent version of the bin set.
Promega Corporation · 2800 Woods Hollow Road · Madison, WI 53711-5399 USA · Toll Free in USA 800-356-9526 · Phone 608-274-4330 · Fax 608-277-2516 · www.promega.com
Part# TMD022
Page 20
Printed in USA.
1/09
8.
Ensure that the “Use marker-specific stutter ratio if available” box is
checked.
9.
Enter the values shown in Figure 3 for proper filtering of stutter peaks
when using the PowerPlex® 16 HS System. For an explanation of the
proper usage and effects of these settings, refer to the Applied Biosystems
user bulletin titled “Installation Procedures and New Features for GeneMapper
ID Software 3.2”.
Note: Some of these settings have been optimized and are different from
the recommended settings in the user bulletin.
10. Select the Peak Detector tab. We recommend the settings shown in Figure 4.
Note: Select full range or partial range for the analysis range. When using
a partial range, choose an appropriate analysis range based on the data.
Choose a start point after the primer peak and just before the first defined
internal lane standard peak to help ensure proper sizing of the internal
lane standard.
11. Select the Peak Quality tab. You may change the settings for peak quality.
Note: For Steps 11 and 12, see the GeneMapper® ID user’s manual for
more information.
12. Select the Quality Flags tab. You may also change these settings.
5723TA
13. Select “OK” to save your settings.
Figure 4. The Peak Detector tab.
Promega Corporation · 2800 Woods Hollow Road · Madison, WI 53711-5399 USA · Toll Free in USA 800-356-9526 · Phone 608-274-4330 · Fax 608-277-2516 · www.promega.com
Printed in USA.
1/09
Part# TMD022
Page 21
6.B. Creating a Casework Analysis Method with GeneMapper ® ID Software
(continued)
Creating a Size Standard
1.
Select “Tools”, then “GeneMapper Manager”.
2.
Select the Size Standard tab.
3.
Select “New”.
4.
Select “Basic or Advanced” (Figure 5). The type of analysis method
selected must match the type of analysis method created earlier. Select “OK”.
5.
Enter a detailed name, such as “ILS 600 advanced”, in the Size Standard
Editor (Figure 6).
6.
Choose red as the color for the size standard dye.
7.
Enter the sizes of the internal lane standard fragments (see Section 9.E,
Figure 13).
8.
Select “OK”.
Processing Sample Data for Casework
1.
Import sample files into a new project as described in the Applied
Biosystems GeneMapper ® ID Software Human Identification Analysis Tutorial.
2.
In the Sample Type column, use the drop-down menu to select “Ladder”,
“Sample”, “Positive Control” or “Negative Control”. Every folder in the
project must contain at least one ladder that is designated as such for
proper genotyping.
3.
In the Analysis Method column, select the analysis method created
previously in the Creating a Casework Analysis Method section.
4.
In the Panel column, select “PowerPlex_16_ID3.2.X”, where “X” refers to
the most recent version of the panel files. This is the panel set that was
imported in Section 6.A.
5.
In the Size Standard column, select the size standard that was created in
the Creating a Size Standard section.
6.
If analyzing data from an ABI PRISM® 310 Genetic Analyzer, ensure that
the appropriate matrix file is selected in the Matrix column.
7.
Select “Analyze” (green arrow button) to start data analysis.
Promega Corporation · 2800 Woods Hollow Road · Madison, WI 53711-5399 USA · Toll Free in USA 800-356-9526 · Phone 608-274-4330 · Fax 608-277-2516 · www.promega.com
Part# TMD022
Page 22
Printed in USA.
1/09
5725TA
5726TA
Figure 5. The Select Dye and Analysis Method window.
Figure 6. The Size Standard Editor.
Promega Corporation · 2800 Woods Hollow Road · Madison, WI 53711-5399 USA · Toll Free in USA 800-356-9526 · Phone 608-274-4330 · Fax 608-277-2516 · www.promega.com
Printed in USA.
1/09
Part# TMD022
Page 23
6.C. Creating a Databasing or Paternity Analysis Method with GeneMapper ® ID
Software
1.
Select “Tools”, then “GeneMapper Manager”.
2.
Select the Analysis Methods tab.
3.
Select “New”, and a new analysis method dialog box will open.
4.
Select “HID”, and select “OK”.
Note: If you do not see the HID option, you do not have the
GeneMapper® ID software. Contact Promega Technical Services by
e-mail: [email protected] for assistance.
5.
Enter a descriptive name for the analysis method, such as
“PowerPlex16_20%filter”.
6.
Select the Allele tab.
7.
Select the bin set corresponding to the PowerPlex® System
“Promega_Bins_ID3.2.X”, where “X” refers to the most recent version of
the bin set.
8.
Ensure that the “Use marker-specific stutter ratio if available” box is
checked.
9.
Enter the values shown in Figure 7 for proper filtering of peaks when using
the PowerPlex® 16 HS System. For an explanation of the proper usage and
effect of these settings, refer to the Applied Biosystems user bulletin titled
“Installation Procedures and New Features for GeneMapper ID Software 3.2”.
Creating a Size Standard
1.
Select “Tools”, then “GeneMapper Manager”.
2.
Select the Size Standard tab.
3.
Select “New”.
4.
Select “Basic or Advanced” (Figure 5). The type of analysis method
selected must match the type of analysis method created earlier. Select “OK”.
5.
Enter a detailed name, such as “ILS 600 advanced”, in the Size Standard
Editor (Figure 6).
6.
Choose red as the color for the size standard dye.
7.
Enter the sizes of the internal lane standard fragments (see Section 9.E,
Figure 13).
8.
Select “OK”.
Promega Corporation · 2800 Woods Hollow Road · Madison, WI 53711-5399 USA · Toll Free in USA 800-356-9526 · Phone 608-274-4330 · Fax 608-277-2516 · www.promega.com
Part# TMD022
Page 24
Printed in USA.
1/09
5785TA
Figure 7. The Allele tab with settings for using a 20% peak filter. Select the bin set
“Promega_Bins_ID3.2.X.txt”, where “X” refers to the most recent version of the bin set.
Processing Data for Databasing or Paternity Samples
1.
Import sample files into a new project as described in the Applied Biosystems
GeneMapper ® ID Software Human Identification Analysis Tutorial.
2.
In the Sample Type column, use the drop-down menu to select “Ladder”,
“Sample”, “Positive Control” or “Negative Control”. Every folder in the
project must contain at least one ladder that is designated as such for
proper genotyping.
3.
In the Analysis Method column, select the analysis method created in the
Creating a Databasing or Paternity Analysis Method section.
4.
In the Panel column, select “PowerPlex_16_ID3.2.X”, where “X” refers to
the most recent version of the panel files. This is the panel set that was
imported in Section 6.A.
5.
In the Size Standard column, select the size standard that was created in
the Creating a Size Standard section.
6.
If analyzing data from an ABI PRISM® 310 Genetic Analyzer, ensure that
the appropriate matrix file is selected in the Matrix column.
7.
Select “Analyze” (green arrow button) to start the data analysis.
Promega Corporation · 2800 Woods Hollow Road · Madison, WI 53711-5399 USA · Toll Free in USA 800-356-9526 · Phone 608-274-4330 · Fax 608-277-2516 · www.promega.com
Printed in USA.
1/09
Part# TMD022
Page 25
6.D. Sample Analysis Using the GeneScan® Software and Windows® Operating
Systems
Analyze data using the GeneScan® analysis software.
2.
Review the raw data for one or more sample runs. Highlight the sample
file name, then in the Sample menu, select “raw data”. Move the cursor so
the crosshair is on the baseline to the right of the large primer peak (before
the first internal lane standard peak [red]). Use the X-value number shown
at the bottom left of the window for the start position in the analysis
parameters.
3.
The recommended analysis parameters are shown in Figure 8.
5684TA
1.
Figure 8. The Analysis Parameters window. The start point of the analysis range, which
will vary, is defined in Section 6.D, Step 2.
Promega Corporation · 2800 Woods Hollow Road · Madison, WI 53711-5399 USA · Toll Free in USA 800-356-9526 · Phone 608-274-4330 · Fax 608-277-2516 · www.promega.com
Part# TMD022
Page 26
Printed in USA.
1/09
4.
The analysis parameters can be saved in the Params folder; in most
installations this is located at:
C:\AppliedBio\Shared\Analysis\Sizecaller\Params
5.
Apply the stored analysis parameters file to the samples.
6.
Assign a new size standard. Select a sample file, and highlight the arrow
next to size standard. Select “define new”. Assign the size standard peaks
as shown in Figure 13 in Section 9.E. Store the size standard in the Size
Standards folder at:
C:\AppliedBio\Shared\Analysis\Sizecaller\SizeStandards\
7.
Apply the size standard file to the samples, then analyze the sample files.
See Section 6.F for additional information on the use of the PowerTyper™
16 Macro (Release 2.0) and Genotyper® software.
Notes:
1.
Peak heights outside the linear range of the instrument may generate
artifact peaks due to instrument saturation (i.e., overloading the sample).
Bleedthrough (pull-ups) from one color to another may be observed.
Saturated signal may also appear as two peaks (split peak).
2.
If peak heights are not within the linear range of detection of the
instrument, the ratio of stutter peaks to real allele peaks increases, and
allele designations become difficult to interpret. The balance of peak
heights may also appear less uniform.
3.
There can be variation between instruments regarding the relative
fluorescence levels detected using the same sample. Furthermore, different
instruments vary in the relative efficiency of color detection, affecting the
dye color-to-dye color balance.
6.E. Sample Analysis Using the GeneScan® Software and Macintosh® Operating
Systems
1.
Analyze data using the GeneScan® analysis software.
2.
Review the raw data for one or more sample runs. Highlight the sample
file name, then in the Sample menu, select “raw data”. Move the cursor so
the crosshair is on the baseline to the right of the large primer peak (before
the first internal lane standard peak [red]). Use the X-value number shown
at the bottom left of the window for the start position in the analysis
parameters.
Promega Corporation · 2800 Woods Hollow Road · Madison, WI 53711-5399 USA · Toll Free in USA 800-356-9526 · Phone 608-274-4330 · Fax 608-277-2516 · www.promega.com
Printed in USA.
1/09
Part# TMD022
Page 27
6.E. Sample Analysis Using the GeneScan® Software and Macintosh® Operating
Systems (continued)
3.
The recommended analysis parameters are:
Analysis Range
Data Processing
Peak Detection
Size Call Range
Size Calling Method
Split Peak Correction
Start: Defined in Step 2
Stop: 10,000
Baseline: Checked
Multicomponent: Checked
Smooth Options: Light1
Peak Amplitude Thresholds2:
B:
Y:
G:
R:
Min. Peak Half Width: 2pts
Min: 60
Max: 600
Local Southern Method
None
1Smooth options should be determined by individual laboratories. Occasionally the
TH01 alleles 9.3 and 10 will not be distinguished using heavy smoothing.
2The peak amplitude thresholds are the minimum peak heights that the software
will call as a peak. Values for peak amplitude thresholds are usually 50–200RFU
and should be determined by individual laboratories.
4.
The analysis parameters can be saved in the Params folder.
5.
Apply the stored analysis parameters file to the samples.
6.
Assign a new size standard. Select a sample file, highlight the arrow next
to size standard, then select “define new”. Assign the size standard peaks
as shown in Figure 13 in Section 9.E. Store the size standard in the Size
Standards folder.
7.
Apply the size standard file to the samples, then analyze the sample files.
See Section 6.F for additional information on the use of the PowerTyper™
16 Macro (Release 2.0) and Genotyper® software.
For additional information regarding the GeneScan® analysis software,
refer to the GeneScan® Analysis Software User’s Manual.
Notes:
1. Peak heights outside the linear range of the instrument may generate
artifact peaks due to instrument saturation (i.e., overloading the sample).
Bleedthrough (pull-ups) from one color to another may be observed.
Saturated signal may also appear as two peaks (split peak).
2. If peak heights are not within the linear range of detection of the
instrument, the ratio of stutter peaks to real allele peaks increases, and
allele designations become difficult to interpret. The balance of peak
heights may also appear less uniform.
3. There can be variation between instruments regarding the relative
fluorescence levels detected using the same sample. Furthermore, different
instruments vary in the relative efficiency of color detection, affecting the
dye color-to-dye color balance.
Promega Corporation · 2800 Woods Hollow Road · Madison, WI 53711-5399 USA · Toll Free in USA 800-356-9526 · Phone 608-274-4330 · Fax 608-277-2516 · www.promega.com
Part# TMD022
Page 28
Printed in USA.
1/09
6.F. Sample Analysis Using the Genotyper® Software and PowerTyper™ 16 Macro
To facilitate analysis of data generated with the PowerPlex® 16 HS System, we
have created a file to allow automatic assignment of genotypes using the
Genotyper ® software. After samples are amplified, detected using the ABI PRISM®
310 or 3100 Genetic Analyzer (using data collection software, version 1.0.1 or 1.1),
and analyzed using the GeneScan® analysis software, sample files can be
imported into the Genotyper ® program and analyzed using the PowerTyper™
16 Macro (Release 2.0).
The PowerTyper™ 16 Macro (Release 2.0) is available upon request from
Promega. The PowerTyper™ 16 Macro (Release 2.0) is provided on the
PowerTyper™ Macros CD-ROM (Cat.# DG3470). The PowerTyper™ Macros
can be also downloaded from the Promega web site at:
www.promega.com/geneticidtools/
The PowerTyper™ 16 Macro (Release 2.0) is used in conjunction with Macintosh®
Genotyper ® software, version 2.5, and Windows NT® Genotyper® software,
version 3.6, or later. The Genotyper ® software must be installed on your
computer before the PowerTyper™ 16 Macro (Release 2.0) can be used.
Be certain the sample info (Macintosh® computers) or color info (Windows NT®
operating systems) column for each lane containing allelic ladder mix contains
the word “ladder”. The macro uses the word “ladder” to identify the sample
file(s) containing allelic ladder. Sample info can be added or modified after
importing into the PowerTyper™ Macro. Highlight the sample, then select
“show dye/lanes window” in the Views menu.
1.
Transfer the PowerTyper™ 16 Macro (Release 2.0) from the PowerTyper™
Macros CD-ROM (Cat.# DG3470) to a designated location on your
computer hard drive. Alternatively, download the PowerTyper™ 16 Macro
(Release 2.0) from the Promega web site.
2.
Open the Genotyper ® software, then the PowerTyper™ 16 Macro (Release
2.0). For questions about the Genotyper ® software, refer to the Genotyper ®
Analysis Software User’s Manual.
3.
In the File menu, select “Import”, and import the GeneScan® project or
sample files to be analyzed. Import the blue, yellow, green and red dye
colors.
Note: To select the dye colors to be imported, select “Set Preferences” in
the Edit menu.
4.
Double-click on the Check ILS macro. The macros are listed at the bottom
left corner of the active window. A plots window will be displayed to
show the internal lane standard (i.e., ILS 600) in the red dye color. Scroll
down to view, and confirm that the internal lane standard fragment sizes
are correct. If necessary, re-analyze samples using the GeneScan® software
and redefine internal lane standard fragments.
Note: The software uses one ladder sample to determine allele sizes. The
macro uses the first ladder sample imported for allele designations.
Promega Corporation · 2800 Woods Hollow Road · Madison, WI 53711-5399 USA · Toll Free in USA 800-356-9526 · Phone 608-274-4330 · Fax 608-277-2516 · www.promega.com
Printed in USA.
1/09
Part# TMD022
Page 29
6.F. Sample Analysis Using the Genotyper® Software and PowerTyper™ 16 Macro
(continued)
5.
For casework, double-click on the POWER macro. The POWER macro
identifies alleles in the ladder sample and calculates offsets for all loci.
This process may take several minutes. When completed, a plots window
will open to display the allelic ladders (i.e., Penta E, D18S51, D21S11,
TH01 and D3S1358).
Alternatively, for databasing or paternity, double-click on the POWER 20%
Filter macro. This macro has a higher level of filtering than the standard
POWER macro to reduce the need for manual editing of peak labels. The
POWER 20% Filter should not be used if mixtures may exist.
In general, allelic ladders contain fragments of the same lengths as many
known alleles for the locus. Allelic ladder sizes and repeat units are listed
in Table 4 (Section 9.B). Analysis using GeneScan® analysis software and
Genotyper ® software allows allele determination by comparing amplified
sample fragments with allelic ladders and internal lane standards. When
using an internal lane standard, the calculated lengths of allelic ladder
components might differ from those listed in the table. This is due to
differences in migration resulting from sequence differences between the
allelic ladder fragments and internal size standard and is not a matter of
concern.
6.
Double-click on the Allelic Ladders macro. A plots window will open to
display the blue (fluorescein) dye allelic ladders (i.e., Penta E, D18S51,
D21S11, TH01 and D3S1358), green (JOE) dye allelic ladders (i.e., Penta E,
CSF1PO, D16S539, D7S820, D13S317 and D5S818) and yellow (TMR) dye
allelic ladders (i.e., FGA, TPOX, D8S1179, vWA and Amelogenin). Confirm
that the correct allele designations were assigned to the allelic ladders
(Figure 10 in Section 6.H).
Note: The software uses one ladder sample to determine allele sizes. The
macro uses the first ladder sample imported for allele designations. If the
POWER macro is run a second time, the software will use the second
ladder; if the POWER macro is run a third time, the software will use the
third ladder, etc., until all ladders in the project are used. If an allelic ladder
fails to be analyzed or if many off-ladder alleles are found in the samples,
samples should be re-analyzed using another ladder from the project.
7.
Double-click on the Display Fluorescein Data macro to display the blue
dye for all sample injections/lanes. Scroll down to observe and edit as
needed.
8.
Double-click on the Display TMR Data macro to display the yellow dye
for all sample injections/lanes. Scroll down to observe and edit as needed.
9.
Double-click on the Display JOE Data macro to display the green dye for
all sample injections/lanes. Scroll down to observe and edit as needed.
Promega Corporation · 2800 Woods Hollow Road · Madison, WI 53711-5399 USA · Toll Free in USA 800-356-9526 · Phone 608-274-4330 · Fax 608-277-2516 · www.promega.com
Part# TMD022
Page 30
Printed in USA.
1/09
10. Create the appropriate table by selecting the PowerTable, Make Allele
Table or Make CODIS Table macro. The three available table formats are
shown below. The PowerTable option allows up to four alleles per sample
file. Additional information such as low peak signal or high peak signal is
also included. The Allele Table and CODIS Table options include only two
alleles per locus. If more than two alleles are present at a locus, the
smallest alleles identified are included. The Allele Table format displays
the categories (loci) in columns, while the CODIS table format displays the
categories in rows. These tables can be customized to fit needs. To save
data in tables, go to the Table drop-down menu, highlight “Export to
File...” and save the file with the desired name and location. The saved file
can be viewed and analyzed using Microsoft® Excel.
11. Save the analyzed data. Go to the File menu and select “Save as”.
!
The PowerTyper™ Macro is a Genotyper ® file and can be overwritten if
“Save” is used instead of “Save as”.
PowerTable Format
Sample Sample
Peak Peak Peak Peak Over- Low Satura- Edited Edited
Info
Comment Category 1
2
3
4
flow Signal tion
Label Row
Allele Table Format
Sample Category Category Category Category Category Category Category Category
Info
Allele 1 Allele 2 Allele 1 Allele 2 Allele 1 Allele 2 Allele 1 Allele 2
CODIS Table Format
Sample Info Category Peak 1
Peak 2
6.G. Controls
1.
Observe the results for the negative control. The negative control should
be devoid of amplification products.
2.
Observe the results for the 9947A positive control DNA. Compare the
9947A DNA allelic repeat sizes with the locus-specific allelic ladder. The
expected 9947A DNA allele designations for each locus are listed in Table 5
(Section 9.B). The 9947A DNA, which is cell-line derived, will show allelic
imbalance and imbalance between STR loci.
Promega Corporation · 2800 Woods Hollow Road · Madison, WI 53711-5399 USA · Toll Free in USA 800-356-9526 · Phone 608-274-4330 · Fax 608-277-2516 · www.promega.com
Printed in USA.
1/09
Part# TMD022
Page 31
6.H. Results
Representative results of the PowerPlex® 16 HS System are shown in Figure 9.
The PowerPlex® 16 HS Allelic Ladder Mix is shown in Figure 10.
The PowerPlex® 16 Monoplex System, Penta E (Fluorescein) (Cat.# DC6591) and
PowerPlex® 16 Monoplex System, Penta D (JOE) (Cat.# DC6651) are available to
amplify the Penta E and Penta D loci, respectively. These monoplex systems
allow amplification of a single locus to confirm results obtained with the
PowerPlex® 16 System, PowerPlex® 16 HS System, PowerPlex® 16 BIO System
or PowerPlex® 2.1 System.
A.
B.
C.
7918TA
D.
Figure 9. The PowerPlex® 16 HS System. A single template DNA (0.5ng) was amplified using the
PowerPlex® 16 HS 10X Primer Pair Mix. Amplification products were mixed with Internal Lane
Standard 600 and analyzed with an Applied Biosystems 3130 Genetic Analyzer using a 3kV, 5-second
injection. Results were analyzed using GeneMapper ® ID software, version 3.2. Panel A. An
electropherogram showing the peaks of the fluorescein-labeled loci: D3S1358, TH01, D21S11, D18S51
and Penta E. Panel B. An electropherogram showing the peaks of the JOE-labeled loci: D5S818,
D13S317, D7S820, D16S539, CSF1PO and Penta D. Panel C. An electropherogram showing the peaks
of the TMR-labeled loci: Amelogenin, vWA, D8S1179, TPOX and FGA. Panel D. An electropherogram
showing the 60bp to 500bp fragments of the Internal Lane Standard 600.
Promega Corporation · 2800 Woods Hollow Road · Madison, WI 53711-5399 USA · Toll Free in USA 800-356-9526 · Phone 608-274-4330 · Fax 608-277-2516 · www.promega.com
Part# TMD022
Page 32
Printed in USA.
1/09
A.
B.
5682TA
C.
Figure 10. The PowerPlex® 16 HS Allelic Ladder Mix. The PowerPlex® 16 HS Allelic Ladder Mix was
analyzed with an Applied Biosystems 3130 Genetic Analyzer using a 3kV, 5-second injection. The
sample file was analyzed with the GeneMapper ® ID software, version 3.2, and PowerPlex® 16 panel
and bin files. Panel A. The fluorescein-labeled allelic ladder components and their allele designations.
Panel B. The JOE-labeled allelic ladder components and their allele designations. Panel C. The TMRlabeled allelic ladder components and their allele designations.
Artifacts and Stutter
Stutter bands are a common amplification artifact associated with STR analysis.
Stutter products are often observed one repeat unit below the true allele peak
and, occasionally, two repeat units smaller or one repeat unit larger than the
true allele peak. Frequently, alleles with a greater number of repeat units will
exhibit a higher percent stutter. The pattern and intensity of stutter may differ
slightly between primer sets for the same loci.
In addition to stutter peaks, other artifact peaks can be observed at some of the
PowerPlex® 16 HS System loci. Low-level products can be seen in the n–2 and
n+2 positions, (two bases below and above the true allele peak, respectively),
with some loci such as D21S11. Samples may show low-level artifacts in the
regions between D21S11 and D18S51, D7S820 and D16S539, and D8S1179 and
TPOX. Occasionally, an off-ladder artifact can be seen in the 690–691bp position
in the fluorescein dye channel. One or more extra peaks that are not directly
related to amplification may be observed in the D3S1358, TH01, D21S11 and
Penta E region of the fluorescein channel; D13S317 and D16S539 region of the JOE
channel; and vWA region of the TMR channel. These extra peaks occur when the
amplified peaks are particularly intense (high signal level or template amount);
formamide, polymer or capillary was of poor quality; or denaturation was
ineffective. See Section 7 for more information on how to minimize these artifacts.
Promega Corporation · 2800 Woods Hollow Road · Madison, WI 53711-5399 USA · Toll Free in USA 800-356-9526 · Phone 608-274-4330 · Fax 608-277-2516 · www.promega.com
Printed in USA.
1/09
Part# TMD022
Page 33
7.
Troubleshooting
For questions not addressed here, please contact your local Promega Branch Office or Distributor.
Contact information available at: www.promega.com. E-mail: [email protected]
7.A. Amplification and Fragment Detection
Symptoms
Faint or absent allele peaks
Causes and Comments
Impure template DNA. Because of the small amount of
template used, this is rarely a problem. Depending on the DNA
extraction procedure used and sample source, inhibitors might
be present in the DNA sample.
Insufficient template. Use the recommended amount of
template DNA.
Insufficient template. Low-copy-number (LCN) analysis using
capillary electrophoresis may benefit from reducing competing
charged particles during injection. This can be accomplished
with post-PCR cleanup or desalting, lower-conductivity
formamide or reduced amounts of ILS 600. In-house validation
should be performed for any of these methods.
Insufficient enzyme activity. Vortex the PowerPlex® HS 5X
Master Mix before use, and use the recommended amount.
Incorrect amplification program. Confirm the amplification
program.
The PowerPlex® HS 5X Master Mix was not vortexed well
before use. Vortex the 5X Master Mix for 5–10 seconds before
dispensing into reaction tubes or plates.
An air bubble formed at the bottom of the reaction tube. Use a
pipette to remove the air bubble, or centrifuge the reactions
briefly before thermal cycling
High salt concentration or altered pH. If the DNA template is
stored in TE buffer that is not pH 8.0 or contains a higher EDTA
concentration, the DNA volume should not exceed 20% of the
total reaction volume. Carryover of K+, Na+, Mg2+ or EDTA
from the DNA sample can negatively affect PCR. A change in
pH may also affect PCR. Store DNA in TE–4 buffer (10mM
Tris-HCl [pH 8.0], 0.1mM EDTA) or nuclease-free water.
Thermal cycler, plate or tube problems. Review the thermal
cycling protocols in Section 4.B. We have not tested other
reaction tubes, plates or thermal cyclers. Calibrate the thermal
cycler heating block if necessary.
Primer concentration was too low. Use the recommended
primer concentration. Mix the 10X PowerPlex® 16 HS Primer
Pair for 15 seconds using a vortex mixer before use.
Poor capillary electrophoresis injection (ILS 600 peaks also
affected). Re-inject the sample. Check the syringe for leakage.
Check the laser power.
Samples were not denatured completely. Heat-denature
samples for the recommended time, then cool on crushed ice
or in an ice-water bath immediately prior to loading the gel or
capillary.
Poor-quality formamide was used. Use only Hi-Di™ formamide
when analyzing samples.
Promega Corporation · 2800 Woods Hollow Road · Madison, WI 53711-5399 USA · Toll Free in USA 800-356-9526 · Phone 608-274-4330 · Fax 608-277-2516 · www.promega.com
Part# TMD022
Page 34
Printed in USA.
1/09
Symptoms
Extra peaks visible in one or
all color channels
Causes and Comments
Contamination with another template DNA or previously
amplified DNA. Cross-contamination can be a problem. Use
aerosol-resistant pipette tips, and change gloves regularly.
Samples were not denatured completely. Heat denature
samples for the recommended time, and cool on crushed ice
or in an ice-water bath immediately prior to loading the gel or
capillary.
Artifacts of STR amplification. PCR amplification of STR
systems sometimes generates artifacts that appear as faint
peaks one repeat unit smaller than the allele. Stutter band
peak heights can be high if the samples are overloaded. See
Section 6.H for additional information on stutter and artifacts.
Artifacts of STR amplification. PCR amplification of STR
systems can result in artifacts that appear as peaks one base
smaller than the allele due to incomplete addition of the 3´ A
residue. Be sure to perform the 30-minute extension step at
60°C after thermal cycling (Section 4.B).
High background. Load less amplification product, or decrease
injection time. See Section 5.
CE-related artifacts (“spikes”). Minor voltage changes or urea
crystals passing by the laser can cause “spikes” or unexpected
peaks. Spikes sometimes appear in one color but often are
easily identified by their presence in more than one color.
Re-inject samples to confirm.
Excessive amount of DNA. Amplification of >1ng template can
result in a higher number of stutter bands. Use less template
DNA, or reduce the number of cycles in the amplification
program by 2–4 cycles (10/20 or 10/18 cycling).
Pull-up or bleedthrough. Pull-up can occur when peak heights
are too high or if a poor or incorrect matrix has been applied
to the samples.
• For the ABI PRISM® 310 Genetic Analyzer, generate a new
matrix, and apply it to the samples. For the ABI PRISM®
3100 and 3100-Avant Genetic Analyzers and Applied
Biosystems 3130 and 3130xl Genetic Analyzers, perform a
new spectral calibration and re-run the samples.
• Instrument sensitivities can vary. Optimize the injection or
gel loading conditions. See Section 5.
CE-related artifacts (contaminants). Contaminants in the water
used with the instrument or to dilute the 10X genetic analyzer
buffer may generate peaks in the blue and green dye colors.
Use autoclaved water; change vials and wash buffer reservoir.
Long-term storage of amplified sample in formamide can
result in degradation. Repeat sample preparation using fresh
formamide.
The CE polymer was beyond its expiration date, or polymer
was stored at room temperature for more than one week.
Maintain instrumentation on a daily or weekly basis, as
recommended by the manufacturer.
Promega Corporation · 2800 Woods Hollow Road · Madison, WI 53711-5399 USA · Toll Free in USA 800-356-9526 · Phone 608-274-4330 · Fax 608-277-2516 · www.promega.com
Printed in USA.
1/09
Part# TMD022
Page 35
7.A. Amplification and Fragment Detection (continued)
Symptoms
Allelic ladder not running
the same as samples
Peak height imbalance
Causes and Comments
Allelic ladder and primer pair mix were not compatible. Ensure
that the allelic ladder is from the same kit as the primer pair
mix.
Poor-quality formamide. Use only Hi-Di™ formamide when
analyzing samples.
Be sure the allelic ladder and samples are from the same
instrument run.
Migration of samples changed slightly over the course of a
CE run with many samples. This may be due to changes in
temperature or the CE column over time. Use a different
injection of allelic ladder to determine sizes.
Poor injection of allelic ladder. Include more than one ladder
per instrument run.
Excessive amount of DNA. Amplification of >1ng of template
can result in an imbalance with smaller loci showing more
product than larger loci. Use less template, or reduce the
number of cycles in the amplification program by 2–4 cycles
(10/20 or 10/18 cycling) to improve locus-to-locus balance.
Note: Dilution of overamplified samples can result in dropout
of larger loci.
Use of FTA® paper. Results may be similar to those obtained
with excess amounts of DNA template. Reduce the number of
cycles in the amplification program by 2–4 cycles (10/20 or
10/18 cycling) to improve locus-to-locus balance.
Degraded DNA sample. DNA template is degraded, and
larger loci show diminished yield. Repurify the template DNA.
Insufficient template DNA. Use the recommended amount of
template DNA. Stochastic effects can occur when amplifying
low amounts of template.
Miscellaneous balance problems. Thaw the 10X Primer Pair
Mix and 5X Master Mix completely, and vortex for 15 seconds
before use. Do not centrifuge the 10X Primer Pair Mix after
mixing. Calibrate thermal cyclers and pipettes routinely.
Using a 59°C annealing temperature instead of 60°C has been
shown to improve balance in some instances.
Impure DNA template. Inhibitors that may be present in
forensic samples can lead to allele dropout or imbalance.
Impure DNA template. Include a proteinase K digestion prior
to DNA purification.
PCR amplification mix prepared in Section 4.A was not mixed
well. Vortex the PCR amplification mix for 5–10 seconds
before dispensing into the reaction tubes or plate.
Promega Corporation · 2800 Woods Hollow Road · Madison, WI 53711-5399 USA · Toll Free in USA 800-356-9526 · Phone 608-274-4330 · Fax 608-277-2516 · www.promega.com
Part# TMD022
Page 36
Printed in USA.
1/09
7.B. GeneMapper® ID Analysis Software
Symptoms
Alleles not called
5685TA
Off-ladder alleles
Causes and Comments
To analyze samples with GeneMapper ® ID software, the
analysis parameters and size standard must both have “Basic
or Advanced” as the analysis type. If they are different, an
error is obtained (Figure 11).
To analyze samples with GeneMapper ® ID software, at least
one allelic ladder must be defined.
An insufficient number of ILS 600 fragments was defined. Be
sure to define at least one ILS 600 fragment smaller than the
smallest sample peak and at least one ILS 600 fragment larger
than the largest sample peak.
Run was too short, and larger peaks in ILS were not captured.
Not all ILS 600 peaks defined in the size standard were
detected during the run.
• Create a new size standard using the internal lane standard
fragments present in the sample.
• Re-run samples using a longer run time.
An allelic ladder from a different run than the samples was
used. Re-analyze samples with an allelic ladder from the same
run.
The GeneMapper® ID software requires that the allelic ladder
be imported from the same folder as the sample. Be sure that
the allelic ladder is in the same folder as the sample. Create a
new project and re-analyze, as described in Section 6.B or 6.C.
Panel file selected for analysis was incorrect for the STR system
used. Assign correct panel file that corresponds to the STR
system used for amplification.
The allelic ladder was not identified as an allelic ladder in the
sample type column.
The wrong analysis type was chosen for the analysis method.
Be sure to use the HID analysis type.
The internal lane standard was not properly identified in the
sample. Manually redefine the sizes of the size standard
fragments in the sample.
Figure 11. The error message that appears in the GeneMapper® ID software when the
analysis parameters and size standard have different analysis types.
Promega Corporation · 2800 Woods Hollow Road · Madison, WI 53711-5399 USA · Toll Free in USA 800-356-9526 · Phone 608-274-4330 · Fax 608-277-2516 · www.promega.com
Printed in USA.
1/09
Part# TMD022
Page 37
7.B. GeneMapper® ID Analysis Software (continued)
Symptoms
Size standard not called
correctly (Figure 12)
Peaks in size standard missing
Error message:
“Either panel, size standard,
or analysis method is invalid”
5686TA
No alleles called, but no error
message appears
Causes and Comments
Starting data point was incorrect for the partial range chosen
in Section 6.B. Adjust the starting data point in the analysis
method. Alternatively, use a full range for the analysis.
Extra peaks in advanced mode size standard. Open the size
match editor. Highlight the extra peak, select “Edit” and select
“delete size label”. Select “auto adjust sizes”.
Run was too short, and larger peaks in ILS were not captured.
Not all ILS 600 peaks defined in the size standard were
detected during the run.
• Create a new size standard using the internal lane standard
fragments present in the sample.
• Re-run samples using a longer run time.
If peaks are below threshold, decrease the peak threshold in
the analysis method for the red channel to include peaks.
If peaks are low-quality, redefine the size standard for the
sample to skip these peaks.
The size standard and analysis method were not in the same
mode (“Classic” vs. “Basic or Advanced”). Be sure both files
are set to the same mode, either Classic or Basic or Advanced
mode.
Panel was not selected for sample. In the Panel column, select
the appropriate panel set for the STR system that was used.
No size standard was selected. In the size standards column,
be sure to select the appropriate size standard.
Size standard was not correctly defined, or size peaks were
missing. Redefine size standard to include only peaks present
in your sample. Terminating analysis early or using short run
times will cause larger ladder peaks to be missing. This will
cause your sizing quality to be flagged as “red”, and no allele
sizes will be called.
Figure 12. An example showing improper assignment of size standard fragments in the
GeneMapper® ID software.
Promega Corporation · 2800 Woods Hollow Road · Madison, WI 53711-5399 USA · Toll Free in USA 800-356-9526 · Phone 608-274-4330 · Fax 608-277-2516 · www.promega.com
Part# TMD022
Page 38
Printed in USA.
1/09
Symptoms
Error message:
“Both the Bin Set used in the
Analysis Method and the Panel
must belong to the same
Chemistry Kit”
Significantly raised baseline
Red bar appears during analysis
of samples, and the following
error message appears when data
are displayed: “Some selected
sample(s) do not contain analysis
data. Those sample(s) will not be
shown”.
Error message after attempting
to import panel and bin files:
“Unable to save panel data:
java.SQLEException:
ORA-00001: unique constraint
(IFA.CKP_NNN) violated”.
Allelic ladder peaks are
labeled off-ladder
Causes and Comments
The bin set assigned to the analysis method may have been
deleted. In the GeneMapper ® Manager, select the Analysis
Methods tab, and open the analysis method of interest. Select
the Alleles tab, and select an appropriate bin set.
The wrong bin set was chosen in the analysis method Allele
tab. Be sure to choose the appropriate bin set, as shown in
Figure 3.
• Poor spectral calibration for the ABI PRISM® 3100 and
3100-Avant Genetic Analyzers and Applied Biosystems 3130
and 3130xl Genetic Analyzers. Perform a new spectral
calibration and re-run the samples.
• Poor matrix for the ABI PRISM® 310 Genetic Analyzer.
Re-run and optimize the matrix.
Use of Classic mode analysis method. Use of Classic mode
analysis on samples can result in baselines with more noise
than those analyzed using the Basic or Advanced mode
analysis method. Advanced mode analysis methods and size
standards are recommended.
If none of the samples had matrices applied when run on the
ABI PRISM® 310 Genetic Analyzer, no data will be displayed.
Apply a matrix file during analysis in the GeneMapper ® ID
software and re-analyze.
There was a conflict between different sets of panel and bin
files. Delete all panel and bin sets, and re-import files in a
different order.
GeneMapper ® ID software was not used, or microsatellite
analysis settings were used instead of HID analysis settings.
GeneMapper ® software does not use the same algorithms as
GeneMapper ® ID software and cannot correct for sizing
differences using the allelic ladder. Promega recommends
using GeneMapper ® ID software to analyze PowerPlex®
reactions. If using GeneMapper ® ID software, version 3.2, be
sure that the analysis method selected is an HID method.
This can be verified by opening the analysis method using the
GeneMapper ® Manager, then selecting the General tab. The
analysis type cannot be changed. If the method is not HID, it
should be deleted and a new analysis method created.
Promega Corporation · 2800 Woods Hollow Road · Madison, WI 53711-5399 USA · Toll Free in USA 800-356-9526 · Phone 608-274-4330 · Fax 608-277-2516 · www.promega.com
Printed in USA.
1/09
Part# TMD022
Page 39
7.C. PowerTyper™ 16 Macro
Symptoms
File does not open
on your computer
Error message:
“Could not complete the
“Run Macro” command because
no dye/lanes are selected”
Error message:
“Could not complete the
“Run Macro” command
because the labeled peak
could not be found”
Causes and Comments
Genotyper ® software was not installed. Be certain that the
Genotyper ® software, version 2.5 (Macintosh®) or version 3.6
or higher (Windows NT®), is installed.
Incorrect version of Genotyper ® software. The PowerTyper™
16 Macro will not work with Genotyper ® software versions
prior to version 2.5.
The CD-ROM may have been damaged during shipment.
Contact Technical Services by e-mail: [email protected]
The file was corrupted during download or transfer. Download
the file again, or obtain the file on CD-ROM.
Allelic ladder sample files were not identified. Be certain the
sample info or color info column for each lane containing
PowerPlex® 16 HS Allelic Ladder Mix contains the word
“ladder”. The macro uses the word “ladder” to identify
sample files containing allelic ladder.
All four dye colors were not imported. For Genotyper ®
software, versions 2.5 and 3.5 or higher, set preferences (in the
Edit menu) to import the blue, green, yellow and red colors.
Peak heights for one or more alleles in the allelic ladder
sample file were below 150RFU. The allelic ladder categories
are defined as having a minimum peak height of 150RFU. If
peak heights of ladder alleles are below 150RFU, the software
will not be able to locate the allele peak. Re-run the allelic
ladder using more sample or longer injection time to assure
peak heights above 150RFU.
CE spikes in the allelic ladder sample were identified as alleles
by the macro. Use a different injection of allelic ladder.
TH01 9.3 and 10 alleles were not separated when using heavy
smoothing in the GeneScan® analysis parameters. Use light
smoothing in the GeneScan® analysis parameters.
Allelic ladder data were not compatible with the
PowerTyper™ file used. Confirm that the PowerTyper™
Macro file matches the allelic ladder being used.
The base-pair size of alleles in the allelic ladder are outside of
the defined category range. Be sure internal lane standard
fragments are correctly sized. Redefine internal lane standard
fragments, and re-analyze the sample using GeneScan®
software. Compare the size of the smallest allele in the allelic
ladder with the base-pair size and range listed in the
categories for the same alleles. If necessary, increase the
category start range (in the category window) to greater than
± 6bp, and save the macro under a new name.
Allelic ladder peaks were too high, causing stutter peaks to be
called as allele peaks. Use a shorter injection time, decrease
the amount of allelic ladder used or re-analyze the allelic
ladder sample using increased peak amplitude thresholds in
the GeneScan® analysis parameters.
Allelic ladder data were not compatible with the PowerTyper™
Macro file used. Confirm that the PowerTyper™ Macro file
matches the allelic ladder being used.
Promega Corporation · 2800 Woods Hollow Road · Madison, WI 53711-5399 USA · Toll Free in USA 800-356-9526 · Phone 608-274-4330 · Fax 608-277-2516 · www.promega.com
Part# TMD022
Page 40
Printed in USA.
1/09
Symptoms
The plots window or allele
table does not display all data
The Check ILS macro
displays an empty plot
window
Off-ladder peaks
8.
Causes and Comments
The macros were not run in the proper order. Use the POWER
or POWER 20% Filter macro option.
All four dye colors were not imported. For Genotyper ®
software, versions 2.5 and 3.5 or higher, set preferences (in the
Edit menu) to import the blue, green, yellow and red colors.
All four dye colors were not imported. For Genotyper ®
software, versions 2.5 and 3.5 or higher, set preferences (in the
Edit menu) to import the blue, green, yellow and red colors.
Migration of samples changed slightly over the course of a
CE run with many samples. This may be due to changes in
temperature or the CE column over time. Use a different
injection of allelic ladder to determine sizes in the
PowerTyper™ 16 Macro (Release 2.0). Do not use the first
injection on a new column for the ladder sample.
The base-pair size of alleles was incorrect because incorrect
fragment sizes were assigned to the internal lane standard.
Confirm that internal lane standard fragment sizes are
assigned correctly. Re-analyze the sample using GeneScan®
software, and redefine the internal lane standard fragments.
References
1.
Edwards, A. et al. (1991) DNA typing with trimeric and tetrameric tandem repeats: Polymorphic loci,
detection systems, and population genetics. In: The Second International Symposium on Human
Identification 1991, Promega Corporation, 31–52.
2.
Edwards, A. et al. (1991) DNA typing and genetic mapping with trimeric and tetrameric tandem
repeats. Am. J. Hum. Genet. 49, 746–56.
3.
Edwards, A. et al. (1992) Genetic variation at five trimeric and tetrameric tandem repeat loci in four
human population groups. Genomics 12, 241–53.
4.
Warne, D. et al. (1991) Tetranucleotide repeat polymorphism at the human β-actin related pseudogene 2
(actbp2) detected using the polymerase chain reaction. Nucleic Acids Res. 19, 6980.
5.
Ausubel, F.M. et al. (1996) Unit 15: The polymerase chain reaction. In: Current Protocols in Molecular
Biology, Vol. 2, John Wiley and Sons, NY.
6.
Sambrook, J., Fritsch, E.F. and Maniatis, T. (1989) Chapter 14: In vitro amplification of DNA by the
polymerase chain reaction. In: Molecular Cloning: A Laboratory Manual, Second Edition, Cold Spring
Harbor Laboratory Press, Cold Spring Harbor, New York.
7.
PCR Technology: Principles and Applications for DNA Amplification (1989) Erlich, H.A., ed., Stockton
Press, New York, NY.
8.
PCR Protocols: A Guide to Methods and Applications (1990) Innis, M.A. et al., eds., Academic Press, San
Diego, CA.
9.
Butler, J.M. (2005) Forensic DNA Typing, 2nd ed. Elsevier Academic Press, London.
10.
Presley, L.A. et al. (1992) The implementation of the polymerase chain reaction (PCR) HLA DQ alpha
typing by the FBI laboratory. In: The Third International Symposium on Human Identification 1992,
Promega Corporation, 245–69.
11.
Hartmann, J.M. et al. (1991) Guidelines for a quality assurance program for DNA analysis. Crime
Laboratory Digest 18, 44–75.
12.
Internal Validation of STR Systems Reference Manual GE053, Promega Corporation.
13.
Kline, M.C. et al. (2005) Results from the NIST 2004 DNA quantitation study. J. Forensic Sci. 50, 571–8.
Promega Corporation · 2800 Woods Hollow Road · Madison, WI 53711-5399 USA · Toll Free in USA 800-356-9526 · Phone 608-274-4330 · Fax 608-277-2516 · www.promega.com
Printed in USA.
1/09
Part# TMD022
Page 41
8.
References (continued)
14.
Budowle, B. et al. (1991) Analysis of the VNTR locus D1S80 by the PCR followed by high-resolution
PAGE. Am. J. Hum. Genet. 48, 137–44.
15.
Nakamura, Y. et al. (1987) Variable number of tandem repeat (VNTR) markers for human gene
mapping. Science 235, 1616–22.
16.
Budowle, B. and Monson, K.L. (1989) In: Proceedings of an International Symposium on the Forensic
Aspects of DNA Analysis, Government Printing Office, Washington, DC.
17.
Levinson, G. and Gutman, G.A. (1987) Slipped-strand mispairing: A major mechanism for DNA
sequence evolution. Mol. Biol. Evol. 4, 203–21.
18.
Schlotterer, C. and Tautz, D. (1992) Slippage synthesis of simple sequence DNA. Nucleic. Acids Res. 20,
211–5.
19.
Smith, J.R. et al. (1995) Approach to genotyping errors caused by nontemplated nucleotide addition by
Taq DNA polymerase. Genome Res. 5, 312–7.
20.
Magnuson, V.L. et al. (1996) Substrate nucleotide-determined non-templated addition of adenine by
Taq DNA polymerase: Implications for PCR-based genotyping. BioTechniques 21, 700–9.
21.
Walsh, P.S., Fildes, N.J. and Reynolds, R. (1996) Sequence analysis and characterization of stutter
products at the tetranucleotide repeat locus vWA. Nucleic. Acids Res. 24, 2807–12.
22.
Moller, A., Meyer, E. and Brinkmann, B. (1994) Different types of structural variation in STRs:
HumFES/FPS, HumVWA and HumD21S11. Int. J. Leg. Med. 106, 319–23.
23.
Brinkmann, B., Moller, A. and Wiegand, P. (1995) Structure of new mutations in 2 STR systems.
Int. J. Leg. Med. 107, 201–3.
24.
Griffiths, R. et al. (1998) New reference allelic ladders to improve allelic designation in a multiplex
STR system. Int. J. Legal Med. 111, 267–72.
25.
Bär, W. et al. (1997) DNA recommendations: Further report of the DNA Commission of the ISFH
regarding the use of short tandem repeat systems. Int. J. Legal Med. 110, 175–6.
26.
Gill, P. et al. (1997) Considerations from the European DNA Profiling Group (EDNAP) concerning
STR nomenclature. Forensic Sci. Int. 87, 185–92.
27.
Frégeau, C.J. et al. (1995) Characterization of human lymphoid cell lines GM9947 and GM9948 as
intra- and interlaboratory reference standards for DNA typing. Genomics 28, 184–97.
28.
Levadokou, E.N. et al. (2001) Allele frequencies for fourteen STR loci of the PowerPlex® 1.1 and 2.1
multiplex systems and Penta D locus in Caucasians, African-Americans, Hispanics, and other
populations of the United States of America and Brazil. J. Forensic Sci. 46, 736–61.
29.
Lins, A.M. et al. (1998) Development and population study of an eight-locus short tandem repeat
(STR) multiplex system. J. Forensic Sci. 43, 1168–80.
30.
Puers, C. et al. (1993) Identification of repeat sequence heterogeneity at the polymorphic STR locus
HUMTH01[AATG]n and reassignment of alleles in population analysis using a locus-specific allelic
ladder. Am. J. Hum. Genet. 53, 953–8.
31.
Hammond, H. et al. (1994) Evaluation of 13 short tandem repeat loci for use in personal identification
applications. Am. J. Hum. Genet. 55, 175–89.
32.
Bever, R.A. and Creacy, S. (1995) Validation and utilization of commercially available STR multiplexes
for parentage analysis. In: Proceedings from the Fifth International Symposium on Human Identification
1994. Promega Corporation, 61–8.
33.
Sprecher, C.J. et al. (1996) General approach to analysis of polymorphic short tandem repeat loci.
BioTechniques 20, 266–76.
34.
Lins, A.M. et al. (1996) Multiplex sets for the amplification of polymorphic short tandem repeat loci—
silver stain and fluorescent detection. BioTechniques 20, 882–9.
Promega Corporation · 2800 Woods Hollow Road · Madison, WI 53711-5399 USA · Toll Free in USA 800-356-9526 · Phone 608-274-4330 · Fax 608-277-2516 · www.promega.com
Part# TMD022
Page 42
Printed in USA.
1/09
35.
Jones, D.A. (1972) Blood samples: Probability of discrimination. J. Forensic Sci. Soc. 12, 355–9.
36.
Brenner, C. and Morris, J.W. (1990) In: Proceedings from the International Symposium on Human
Identification 1989, Promega Corporation, 21–53.
37.
Mandrekar, P.V., Krenke, B.E. and Tereba, A. (2001) DNA IQ™: The intelligent way to purify DNA.
Profiles in DNA 4(3), 16.
38.
Greenspoon, S. and Ban, J. (2002) Robotic extraction of sexual assault samples using the Biomek® 2000
and the DNA IQ™ System. Profiles in DNA 5(1), 3–5.
39.
McLaren, B., Bjerke, M. and Tereba, A. (2006) Automating the DNA IQ™ System on the Biomek® 3000
Laboratory Automation Workstation. Profiles in DNA 9(1), 11–13.
40.
Cowan, C. (2006) The DNA IQ™ System on the Tecan Freedom EVO® 100. Profiles in DNA 9(1), 8–10.
41.
Bjerke, M. et al. (2006) Forensic application of the Maxwell™ 16 Instrument. Profiles in DNA 9(1), 3–5.
42.
Mandrekar, P. et al. (2007) Introduction to Maxwell® 16 low elution volume configuration for forensic
casework. Profiles in DNA 10(2), 10–12.
43.
Gill, P., Jeffreys, A.J. and Werrett, D.J. (1985) Forensic application of DNA 'fingerprints'. Nature 318,
577–9.
44.
Krenke, B.E. et al. (2005) Development of a novel, fluorescent, two-primer approach to quantitative
PCR. Profiles in DNA 8(1), 3–5.
45.
Krenke, E. et al. (2008) Developmental validation of a real-time PCR assay for the simultaneous
quantification of total human and male DNA. Forensic Sci. Int. Genet. 3, 14–21.
Additional STR references can be found at: www.promega.com/geneticidentity/
9.
Appendix
9.A. Preparing the PowerPlex® 16 HS System PCR Amplification Mix
A worksheet to calculate the required amount of each PCR amplification mix
component is provided in Table 2. Multiply the volume (μl) per reaction by the
total number of reactions to obtain the final PCR amplification mix volume (μl).
Table 2. PCR Amplification Mix for the PowerPlex® 16 HS System.
PCR Amplification
Mix Component
PowerPlex® HS 5X Master Mix
PowerPlex® 16 HS 10X
Primer Pair Mix
Water, Amplification
Grade1
Per tube
template DNA volume1
(0.25–1ng)
total reaction volume
Volume Per
Reaction
×
Number of
Reactions
5.0μl
×
=
2.5μl
×
=
μl
×
=
×
=
up to 17.5μl
×
=
25μl
×
=
=
Final Volume
(μl)
1The
PCR amplification mix volume and template DNA volume should total 25μl.
Consider the volume of template DNA, and add Water, Amplification Grade, to the PCR
amplification mix to bring the final volume of the final reaction to 25μl.
Promega Corporation · 2800 Woods Hollow Road · Madison, WI 53711-5399 USA · Toll Free in USA 800-356-9526 · Phone 608-274-4330 · Fax 608-277-2516 · www.promega.com
Printed in USA.
1/09
Part# TMD022
Page 43
9.B. Advantages of STR Typing
STR typing is more tolerant of degraded DNA templates than other typing
methods because amplification products are less than 500bp long, much smaller
than material detected using AMP-FLP (14) or VNTR (15) analysis. STR typing
is also amenable to a variety of rapid DNA purification techniques that are
compatible with PCR but do not provide enough DNA of appropriate quality
for Southern blot-based analyses.
Amplification products generated with Promega STR products are generally of
discrete and separable lengths. This allows construction of allelic ladders
containing fragments of the same lengths as several or all known alleles for
each locus. Visual or software-based comparison between the allelic ladder and
amplified samples of the same locus allows rapid and precise assignment of
alleles. Results obtained using the PowerPlex® 16 HS System can be recorded in
a digitized format, allowing direct comparison with stored databases.
Population analyses do not require the use of arbitrarily defined fixed bins for
population data (16).
9.C. Advantages of Using the Loci in the PowerPlex® 16 HS System
The loci included in the PowerPlex® 16 HS System (Tables 3 and 4) have been
selected because they satisfy the needs of several major standardization bodies
throughout the world. For example, the United States Federal Bureau of
Investigation (FBI) has selected 13 STR core loci for typing prior to searching or
including (submitting) samples in CODIS (Combined DNA Index System), the
U.S. national database of convicted offender profiles. The PowerPlex® 16 HS
System amplifies all CODIS core loci in a single reaction.
The PowerPlex® 16 HS System also contains two low-stutter, highly
polymorphic pentanucleotide repeat loci, Penta E and Penta D. These additional
loci add significantly to the discrimination power of the system, making the
PowerPlex® 16 HS System a single-amplification system with a power of
exclusion sufficient to resolve paternity disputes definitively. In addition, the
extremely low level of stutter seen with Penta E and Penta D makes them ideal
loci to evaluate DNA mixtures often encountered in forensic casework. Finally,
the Amelogenin locus is included in the PowerPlex® 16 HS System to allow
gender identification of each sample. Table 5 lists the PowerPlex® 16 HS System
alleles revealed in commonly available standard DNA templates.
We have carefully selected STR loci and primers to avoid or minimize artifacts,
including those associated with Taq DNA polymerase, such as repeat slippage
and terminal nucleotide addition. Repeat slippage (17,18), sometimes called
“n–4 bands”, “stutter” or “shadow bands”, is due to the loss of a repeat unit
during DNA amplification, somatic variation within the DNA, or both. The
amount of this artifact observed depends primarily on the locus and the DNA
sequence being amplified.
Promega Corporation · 2800 Woods Hollow Road · Madison, WI 53711-5399 USA · Toll Free in USA 800-356-9526 · Phone 608-274-4330 · Fax 608-277-2516 · www.promega.com
Part# TMD022
Page 44
Printed in USA.
1/09
Table 3. The PowerPlex® 16 HS System Locus-Specific Information.
STR Locus
Label
Chromosomal Location
GenBank® Locus and
Locus Definition
Repeat Sequence1
→ 3´
5´→
Penta E
FL
15q
NA
AAAGA
D18S51
FL
18q21.3
HUMUT574
AGAA (24)
D21S11
FL
21q11–21q21
HUMD21LOC
TCTA Complex (24)
TH01
FL
11p15.5
HUMTH01, human tyrosine
hydroxylase gene
NA
AATG (24)
D3S1358
FL
3p
FGA
TMR
4q28
TPOX
TMR
2p24–2pter
D8S1179
TMR
8q
vWA
TMR
12p12–pter
Amelogenin2
TMR
Xp22.1–22.3 and Y
Penta D
JOE
CSF1PO
JOE
D16S539
JOE
D7S820
JOE
D13S317
D5S818
TCTA Complex
HUMFIBRA, human
TTTC
fibrinogen alpha chain gene
Complex (24)
HUMTPOX, human thyroid
AATG
peroxidase gene
NA
TCTA Complex (24)
HUMVWFA31, human von
Willebrand factor gene
HUMAMEL, human Y
chromosomal gene for
Amelogenin-like protein
TCTA
Complex (24)
NA
21q
NA
AAAGA
5q33.3–34
HUMCSF1PO, human c-fms
proto-oncogene for CSF-1
receptor gene
AGAT
16q24–qter
NA
GATA
7q11.21–22
NA
GATA
JOE
13q22–q31
NA
TATC
JOE
5q23.3–32
NA
AGAT
1The
August 1997 report (25,26) of the DNA Commission of the International Society for Forensic
Haemogenetics (ISFH) states, “1) for STR loci within coding genes, the coding strand shall be used
and the repeat sequence motif defined using the first possible 5´ nucleotide of a repeat motif; and
2) for STR loci not associated with a coding gene, the first database entry or original literature
description shall be used”.
2Amelogenin
is not an STR but displays a 106-base, X-specific band and a 112-base, Y-specific band.
9947A DNA (female) displays only the 106-base, X-specific band.
TMR = carboxy-tetramethylrhodamine
FL = fluorescein
JOE = 6-carboxy-4´,5´-dichloro-2´,7´-dimethoxyfluorescein
NA = not applicable
Promega Corporation · 2800 Woods Hollow Road · Madison, WI 53711-5399 USA · Toll Free in USA 800-356-9526 · Phone 608-274-4330 · Fax 608-277-2516 · www.promega.com
Printed in USA.
1/09
Part# TMD022
Page 45
9.C. Advantages of Using the Loci in the PowerPlex® 16 HS System (continued)
Table 4. The PowerPlex® 16 HS System Allelic Ladder Information.
Label
Size Range of Allelic Ladder
Components1,2 (bases)
Penta E
FL
379–474
5–24
D18S51
FL
290–366
8–10, 10.2, 11–13, 13.2, 14–27
D21S11
FL
203–259
24, 24.2, 25, 25.2, 26–28, 28.2, 29, 29.2,
30, 30.2, 31, 31.2, 32, 32.2, 33, 33.2, 34,
34.2, 35, 35.2, 36–38
TH01
FL
156–195
4–9, 9.3, 10–11, 13.3
D3S1358
FL
115–147
12–20
FGA
TMR
322–444
16–18, 18.2, 19, 19.2, 20, 20.2, 21, 21.2,
22, 22.2, 23, 23.2, 24, 24.2, 25, 25.2,
26–30, 31.2, 43.2, 44.2, 45.2, 46.2
TPOX
TMR
262–290
6–13
D8S1179
TMR
203–247
7–18
vWA
TMR
123–171
10–22
Amelogenin4
TMR
106, 112
X, Y
Penta D
JOE
376–449
2.2, 3.2, 5, 7–17
CSF1PO
JOE
321–357
6–15
D16S539
JOE
264–304
5, 8–15
D7S820
JOE
215–247
6–14
D13S317
JOE
176–208
7–15
D5S818
JOE
119–155
7–16
STR Locus
1The
Repeat Numbers of Allelic Ladder
Components3
length of each allele in the allelic ladder has been confirmed by sequence analyses.
2When
using an internal lane standard, such as the Internal Lane Standard 600, the calculated sizes
of allelic ladder components may differ from those listed. This occurs because different sequences in
allelic ladder and ILS components may cause differences in migration. The dye label also affects
migration of alleles.
3For
a current list of microvariants, see the Variant Allele Report published at the U.S. National
Institute of Standards and Technology (NIST) web site at: www.cstl.nist.gov/div831/strbase/
4Amelogenin
is not an STR but displays a 106-base, X-specific band and a 112-base, Y-specific band.
Promega Corporation · 2800 Woods Hollow Road · Madison, WI 53711-5399 USA · Toll Free in USA 800-356-9526 · Phone 608-274-4330 · Fax 608-277-2516 · www.promega.com
Part# TMD022
Page 46
Printed in USA.
1/09
Table 5. The PowerPlex® 16 HS System Allele Determinations in Commonly Available Standard
DNA Templates.
Standard DNA Templates1
STR Locus
K5622
9947A
99483
Penta E
5, 14
12, 13
11, 11
D18S51
15, 16
15, 19
15, 18
D21S11
29, 30, 31
30, 30
29, 30
TH01
9.3, 9.3
8, 9.3
6, 9.3
D3S1358
16, 16
14, 15
15, 17
FGA
21, 24
23, 24
24, 26
TPOX
8, 9,
8, 8
8, 9
D8S1179
12, 12
13, 13
12, 13
vWA
16, 16
17, 18
17, 17
Amelogenin
X, X
X, X
X, Y
Penta D
9, 13
12, 12
8, 12
CSF1PO
9, 10,
10, 12
10, 11, 12
D16S539
11, 12
11, 12
11, 11
D7S820
9, 11
10, 11
11, 11
D13S317
8, 8
11, 11
11, 11
D5S818
11, 12
11, 11
11, 13
1Information on strains 9947A, 9948 and K562 is available online at: locus.umdnj.edu/nigms/
Strain K562 is available from the American Type Culture Collection: www.atcc.org (Manassas, VA).
Information about the use of 9947A and 9948 DNA as standard DNA templates can be found in
reference 27.
2Strain
K562 displays three alleles at the D21S11 locus.
3Strain
9948 displays three alleles at the CSF1PO locus. The peak height for allele 12 is much lower
than those for alleles 10 and 11.
Terminal nucleotide addition (19,20) occurs when Taq DNA polymerase adds a
nucleotide, generally adenine, to the 3´ ends of amplified DNA fragments in a
template-independent manner. The efficiency with which this occurs varies with
different primer sequences. Thus, an artifact band one base shorter than expected
(i.e., missing the terminal addition) is sometimes seen. We have modified primer
sequences and added a final extension step of 60°C for 30 minutes (21) to the
amplification protocols to provide conditions for essentially complete terminal
nucleotide addition when recommended amounts of template DNA are used.
The presence of microvariant alleles (alleles differing from one another by
lengths other than the repeat length) complicates interpretation and assignment
of alleles. There appears to be a correlation between a high degree of
polymorphism, a tendency for microvariants and increased mutation rate
(22,23). Thus, FGA and D21S11 display numerous, relatively common
microvariants. For reasons yet unknown, the highly polymorphic Penta E locus
does not display frequent microvariants (Table 4).
Promega Corporation · 2800 Woods Hollow Road · Madison, WI 53711-5399 USA · Toll Free in USA 800-356-9526 · Phone 608-274-4330 · Fax 608-277-2516 · www.promega.com
Printed in USA.
1/09
Part# TMD022
Page 47
9.D. Power of Discrimination
The fifteen STR loci amplified with the PowerPlex® 16 HS System provide
powerful discrimination. Population statistics for these loci and their various
multiplex combinations are displayed in Table 6. These data were generated as
part of a collaboration (28) with The Bode Technology Group (Springfield, VA),
North Carolina Bureau of Investigation (Raleigh, NC), Palm Beach County
Sheriff’s Office (West Palm Beach, FL), Virginia Division of Forensic Science
(Richmond, VA) and Charlotte/Mecklenburg Police Department Laboratory
(NC). Data generation included analysis of over 200 individuals from AfricanAmerican, Caucasian-American and Hispanic-American populations. Data for
Asian-Americans include analysis of more than 150 individuals. For additional
population data for STR loci, see references 29–34 and the Short Tandem Repeat
DNA Internet DataBase at: www.cstl.nist.gov/div831/strbase/
Table 6 shows the matching probability (35) for the PowerPlex® 16 HS System in
various populations. The matching probability of the PowerPlex® 16 HS System
ranges from 1 in 1.83 × 10¹⁷ for Caucasian-Americans to 1 in 1.41 × 10¹⁸ for
African-Americans.
A measure of discrimination often used in paternity analyses is the paternity
index (PI), a means for presenting the genetic odds in favor of paternity given
the genotypes for the mother, child and alleged father (36). The typical paternity
indices for the PowerPlex® 16 HS System are shown in Table 6. The PowerPlex®
16 HS System provides typical paternity indices exceeding 500,000 in each
population group. An alternative calculation used in paternity analyses is the
power of exclusion (36). This value, calculated for the PowerPlex® 16 HS System,
exceeds 0.999998 in all populations tested (Table 6).
Table 6. Matching Probabilities, Paternity Indices and Power of Exclusion of the PowerPlex® 16 HS
System in Various Populations.
African-American Caucasian-American Hispanic-American Asian-American
Matching
Probability
Paternity Index
Power of
Exclusion
1 in 1.41 × 10¹⁸
1 in 1.83 × 10¹⁷
1 in 2.93 × 10¹⁷
1 in 3.74 × 10¹⁷
2,510,000
1,520,000
522,000
4,110,000
0.9999996
0.9999994
0.9999983
0.9999998
9.E. The Internal Lane Standard 600
The Internal Lane Standard (ILS) 600 contains 22 DNA fragments of 60, 80, 100,
120, 140, 160, 180, 200, 225, 250, 275, 300, 325, 350, 375, 400, 425, 450, 475, 500,
550 and 600 bases in length (Figure 13). Each fragment is labeled with carboxyX-rhodamine (CXR) and can be detected separately (as a fourth color) in the
presence of PowerPlex® 16 HS-amplified material. The ILS 600 is designed for
use in each gel lane or CE injection to increase precision in analyses when using
the PowerPlex® 16 HS System. Protocols for preparation and use of this internal
lane standard are provided in Section 5.
Promega Corporation · 2800 Woods Hollow Road · Madison, WI 53711-5399 USA · Toll Free in USA 800-356-9526 · Phone 608-274-4330 · Fax 608-277-2516 · www.promega.com
Part# TMD022
Page 48
Printed in USA.
1/09
1,200
100
200
400
300
600
500
1,000
800
600
60 80
120 140 160 180
225 250 275
325 350 375
425 450 475
550
400
5751TA
200
0
Figure 13. Internal Lane Standard 600. An electropherogram showing Internal Lane
Standard 600 fragments.
9.F. Composition of Buffers and Solutions
TE-4 buffer (10mM Tris-HCl, 0.1mM
EDTA [pH 8.0])
2.21g
0.037g
Tris base
EDTA
(Na2EDTA • 2H2O)
Dissolve Tris base and EDTA in
900ml of deionized water. Adjust to
pH 8.0 with HCl. Bring the final
volume to 1 liter with deionized
water.
9.G. DNA Extraction and Quantitation Methods
The DNA IQ™ System (Cat.# DC6700) is a DNA isolation and quantitation
system designed specifically for forensic and paternity samples (37). This novel
system uses paramagnetic particles to prepare clean samples for STR analysis
easily and efficiently and can be used to extract DNA from stains or liquid
samples, such as blood or solutions. The DNA IQ™ Resin eliminates PCR
inhibitors and contaminants frequently encountered in casework samples. With
larger samples, the DNA IQ™ System delivers a consistent amount of total
DNA. The system has been used to isolate and quantify DNA from routine
sample types including buccal swabs, stains on FTA® paper and liquid blood.
Additionally, DNA has been isolated from casework samples such as tissue,
differentially separated sexual assault samples and stains on support materials.
The DNA IQ™ System has been tested with the PowerPlex® Systems to ensure
a streamlined process. See Section 9.H for ordering information.
The DNA IQ™ System has been fully automated on the Beckman Coulter
Biomek® 2000 Laboratory Automation Workstation (38), Biomek® 3000
Laboratory Automation Workstation (39) and Tecan Freedom EVO® Liquid
Handler (40). In addition, the DNA IQ™ Reference Sample Kit for Maxwell® 16
(Cat.# AS1040) and DNA IQ™ Casework Sample Kit for Maxwell® 16 are
available (41,42). For information on automation of laboratory processes on
automated workstations, contact your local Promega Branch Office or
Distributor (contact information available at: www.promega.com/worldwide/)
or e-mail: [email protected]
Promega Corporation · 2800 Woods Hollow Road · Madison, WI 53711-5399 USA · Toll Free in USA 800-356-9526 · Phone 608-274-4330 · Fax 608-277-2516 · www.promega.com
Printed in USA.
1/09
Part# TMD022
Page 49
9.G. DNA Extraction and Quantitation Methods (continued)
To process sexual assault samples, differential extraction can be used to enrich
for sperm cells in the presence of an excess of epithelial cells (43). Traditionally,
these samples are processed by performing a controlled lysis of epithelial cells
in the absence of a reducing agent and centrifuging the samples to separate the
pellet of intact sperm and cell debris from the buffer containing the DNA from
lysed epithelial cells. However, this method is time-consuming and labor
intensive, and several washings and recentrifugations often are required to
obtain sperm free of epithelial DNA. The Differex™ System simplifies
differential extraction. This system uses a standard proteinase K digestion and a
combination of phase separation and differential centrifugation to separate
sperm and epithelial DNA quickly and easily. The Differex™ System offers
similar recovery as the standard method commonly used for differential
extraction. The Differex™ System, in combination with the DNA IQ™ System,
can be automated to extract up to 48 differential extractions in less than 5 hours,
including incubation time, and less than 1 hour of hands-on laboratory time.
For applications requiring human-specific DNA quantification, the Plexor® HY
System (Cat.# DC1000) has been developed (44, 45). See Section 9.H for
ordering information.
9.H. Related Products
Fluorescent STR Multiplex Systems
Product
PowerPlex® 16 Monoplex System, Penta E
(Fluorescein)
PowerPlex® 16 Monoplex System, Penta D (JOE)
PowerPlex® ES Monoplex System, SE33 (JOE)
PowerPlex® 1.2 System
PowerPlex® 16 BIO System
PowerPlex® ES System
PowerPlex® Y System
Size
Cat.#
100 reactions
100 reactions
100 reactions
100 reactions
100 reactions
400 reactions
100 reactions
400 reactions
50 reactions
200 reactions
DC6591
DC6651
DC6751
DC6101
DC6541
DC6540
DC6731
DC6730
DC6761
DC6760
Not for Medical Diagnostic Use.
Promega Corporation · 2800 Woods Hollow Road · Madison, WI 53711-5399 USA · Toll Free in USA 800-356-9526 · Phone 608-274-4330 · Fax 608-277-2516 · www.promega.com
Part# TMD022
Page 50
Printed in USA.
1/09
Accessory Components
Product
PowerPlex® Matrix Standards, 310*
PowerPlex® Matrix Standards, 3100/3130*
PowerTyper™ Macros*
Internal Lane Standard 600**
Mineral Oil
Water, Amplification Grade**
Size
50μl (each dye)
25μl (each dye)
1 CD-ROM
150μl
12ml
5 × 1,250μl
Cat.#
DG4640
DG4650
DG3470
DG1071
DY1151
DW0991
Size
100 reactions
400 reactions
50 samples
200 samples
each
48 preps
48 preps
800 reactions
200 reactions
10 pack
Cat.#
DC6701
DC6700
DC6801
DC6800
AS2000
AS1040
AS1210
DC1000
DC1001
V1391
*Not for Medical Diagnostic Use.
**For Laboratory Use.
Sample Preparation Systems
Product
DNA IQ™ System**
Differex™ System*
Maxwell® 16 Instrument**
DNA IQ™ Reference Sample Kit for Maxwell® 16***
DNA IQ™ Casework Sample Kit for Maxwell® 16***
Plexor® HY System*
Slicprep™ 96 Device**
*Not for Medical Diagnostic Use.
**For Laboratory Use.
***For Research Use Only. Not for use in diagnostic procedures.
ART® Aerosol-Resistant Tips
Product
ART® 10 Ultramicro Pipet Tip
ART® 20E Ultramicro Pipet Tip
ART® 20P Pipet Tip
ART® GEL Gel Loading Pipet Tip
ART® 100 Pipet Tip
ART® 100E Pipet Tip
ART® 200 Pipet Tip
ART® 1000E Pipet Tip
Volume
0.5–10μl
0.5–10μl
20μl
100μl
100μl
100μl
200μl
1,000μl
Size (tips/pack)
960
960
960
960
960
960
960
800
Cat.#
DY1051
DY1061
DY1071
DY1081
DY1101
DY1111
DY1121
DY1131
Promega Corporation · 2800 Woods Hollow Road · Madison, WI 53711-5399 USA · Toll Free in USA 800-356-9526 · Phone 608-274-4330 · Fax 608-277-2516 · www.promega.com
Printed in USA.
1/09
Part# TMD022
Page 51
(a)STR
loci are the subject of U.S. Pat. No. RE 37,984, German Pat. No. DE 38 34 636 C2 and other
patents issued to the Max-Planck-Gesellschaft zur Förderung der Wissenschaften, e.V.,
Germany. The development and use of STR loci are covered by U.S. Pat. No. 5,364,759,
Australian Pat. No. 670231 and other pending patents assigned to Baylor College of Medicine,
Houston, Texas.
Patents for the foundational PCR process, European Pat. Nos. 201,184 and 200,362, expired on
March 28, 2006. In the U.S., the patents covering the foundational PCR process expired on
March 29, 2005.
(b)U.S.
Pat. Nos. 6,238,863 and 6,767,703, Korean Pat. No. 691195 and other patents pending.
(c)U.S.
Pat. Nos. 5,843,660, 6,479,235, 6,221,598 and 7,008,771, Australian Pat. No. 724531,
Chinese Pat. No. 10366753, Canadian Pat. No. 2,118,048, Korean Pat. No. 290332, Singapore
Pat. No. 57050, Japanese Pat. No. 3602142, European Pat. No. 0960207 and other patents
pending.
(d)Licensed
under U.S. Pat. Nos. 5,338,671 and 5,587,287 and corresponding patents in other
countries.
(e)Allele
sequences for one or more of the loci vWA, FGA, D8S1179, D21S11 and D18S51 in
allelic ladder mixtures is licensed under U.S. Pat. No. 7,087,380, Australia Pat. No. 2003200444
and corresponding patent claims outside the US.
© 2009 Promega Corporation. All Rights Reserved.
Maxwell, Plexor and PowerPlex are registered trademarks of Promega Corporation. Differex,
DNA IQ, PowerTyper and Slicprep are trademarks of Promega Corporation.
ABI PRISM, GeneMapper, GeneScan, Genotyper and MicroAmp are registered trademarks of
Applera Corporation. ART is a registered trademark of Molecular Bio-Products, Inc. Biomek is
a registered trademark of Beckman Coulter, Inc. Freedom EVO is a registered trademark of
Tecan AG Corporation. FTA is a registered trademark of Flinders Technologies, Pty, Ltd., and
is licensed to Whatman. GenBank is a registered trademark of the U.S. Dept. of Health and
Human Services. GeneAmp is a registered trademark of Roche Molecular Systems, Inc. Hi-Di
and POP-4 are trademarks of Applera Corporation. Macintosh is a registered trademark of
Apple Computer, Inc. Microsoft, Windows and Windows NT are registered trademarks of
Microsoft Corporation.
Products may be covered by pending or issued patents or may have certain limitations. Please
visit our Web site for more information.
All prices and specifications are subject to change without prior notice.
Product claims are subject to change. Please contact Promega Technical Services or access the
Promega online catalog for the most up-to-date information on Promega products.
Promega Corporation · 2800 Woods Hollow Road · Madison, WI 53711-5399 USA · Toll Free in USA 800-356-9526 · Phone 608-274-4330 · Fax 608-277-2516 · www.promega.com
Part# TMD022
Page 52
Printed in USA.
1/09