1
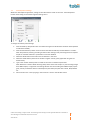
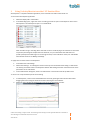
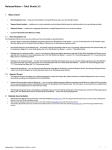
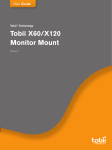
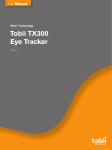
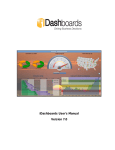
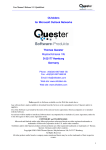
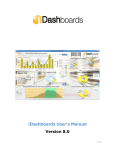
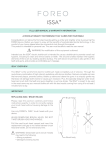
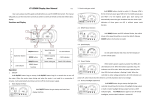
Tobii studio analysis software User Guide Tobii® Technology VelocityChart Version 1.0 W Leading Eye Tracking technology ©TOBII® Trademark is the property of Tobii Technology Preface VelocityChart is a separate application, complementary to Tobii Studio. The main purpose of VelocityChart is to help the user set the parameters in the data processing functions, particularly when using the I‐VT fixation filter in Tobii Studio. VelocityChart plots the angular eye velocity, gaze coordinates (raw or processed), and the classified fixation coordinates of a recording. VelocityChart can only be applied on recordings made with Tobii Studio 2.3 or later. The menu option Launch VelocityChart will appear grey for recordings made with previous versions of Tobii Studio. Important notifications: • VelocityChart is a separate application, adjustments to the fixation filter parameters within VelocityChart need to be transferred to Tobii Studio to have an impact on replay, visualizations, statistics and text export. The transfer procedure is described in the Using the Velocity Chart to tune the I‐VT fixation filter section. • VelocityChart can only be applied on recordings made with Tobii Studio 2.3 or later. The menu option Launch VelocityChart will appear grey for recordings made with previous versions of Tobii Studio. • VelocityChart only supports the Raw data filter and the I‐VT fixation filter. • VelocityChart plots one recording at the time. Adjusting the data processing parameters to fit all recordings while still preserving fine grained fixations is a complex task that requires training and experience. The default values have been set to work in most cases. Software Release 1.0 This document contains information proprietary to Tobii Technology AB . The contents are confidential and any disclosure to persons other than officers, employees, agents or subcontractors of the owner or licensee of this document, without the prior written consent of Tobii Technology AB, is strictly prohibited. No part of this publication may be reproduced, stored in retrieval system, or transmitted in any form or by any means, electronic or mechanical, including photocopying and recording, without the prior consent of the copyright holder. User Guide release 1.0, May 2011 Tobii Technology AB reserves the right to change the content of this user guide without prior notice. Changes due to typographical errors, inaccuracies or modifications in programs and/or equipment might be implemented at any time. Please check the Tobii web site www.tobii.com for updated versions of this document. All rights reserved. © Tobii Technology AB Table of Contents 1 VelocityChart ‐ Overview ............................................................................................................................ 3 1.1 VelocityChart settings ........................................................................................................................... 4 2 Using VelocityChart to tune the Raw data filter ......................................................................................... 5 3 Using VelocityChart to tune the I‐VT fixation filter .................................................................................... 7 4 Exporting gaze, velocity and fixation data from VelocityChart .................................................................. 9 4.1 Export columns ................................................................................................................................... 10 © 2011 Tobii Technology ‐ All rights reserved. Tobii Technology and the Tobii logo are either registered trademarks or trademarks of Tobii Technology in the United States and/or other countries. www.tobii.com 2 1 VelocityChart Overview VelocityChart in Tobii Studio plots the angular eye velocity, gaze coordinates (raw or processed), and the classified fixation coordinates of a recording. The main purpose of VelocityChart is to help the user set the parameters in the data processing functions, particularly when using the I‐VT fixation filter. Below, a VelocityChart showing eye tracking data on a timeline. The straight red line in VelocityChart above shows the Velocity threshold in the I‐VT fixation classifier. The other lines described on the chart legend are: X/Y: gaze coordinates (raw or processed) (mm). Fixation X/Fixation Y: Fixation coordinates (mm). Fixation: Indicates fixations found. Velocity: Absolute value of the eyes angular velocity (degree/second). © 2011 Tobii Technology ‐ All rights reserved. Tobii Technology and the Tobii logo are either registered trademarks or trademarks of Tobii Technology in the United States and/or other countries. www.tobii.com 3 1.1 VelocityChart settings Within the VelocityChart application, settings control what data is shown in the chart. The VelocityChart Fixation Filter dialog is launched through the settings menu. To change the Velocity Chart settings: 1. Click the Show X/Y drop‐down menu and select what gaze coordinate data should be shown (fixation coordinates included). 2. Click the Gaze data drop‐down menu and select how data should be processed before it is shown. Note: Preprocessed, meaning according to fixation filter settings. Data processing functions implied: Gap fill‐in and Noise reduction. Eye Selection cannot be disabled. 3. Select the Show Fixations check box to show fixations in the chart. 4. Select the Show Velocity check box to show the angular velocity. (Only applicable using the I‐VT fixation filter). 5. Type in the number of data points to include in the chart in the Max samples field. Note: Maximum number is 4000. Charting always starts at the first sample. To plot recordings longer than 4000 samples, or segments of recordings further into the recording than 4000 samples, export gaze, velocity and fixation data from VelocityChart (see below) and plot data in Excel, SPSS, Matlab etc. 6. Set the scale on the Y axis by typing in the maximum Y value in the Set Max Y field. © 2011 Tobii Technology ‐ All rights reserved. Tobii Technology and the Tobii logo are either registered trademarks or trademarks of Tobii Technology in the United States and/or other countries. www.tobii.com 4 2 Using VelocityChart to tune the Raw data filter VelocityChart is a separate software application, but is launched from within Tobii Studio 2.3. To launch the VelocityChart application 1. 2. Select the Replay tab in Tobii Studio. In the Recordings pane, right‐click on the recording you want to open in VelocityChart. Click Launch VelocityChart. The VelocityChart opens in a new window. Note: Consider using a recording where the level of noise is relatively high. An indication of noise level may be the percentage of samples that was collected, or if you noticed that the calibration of a specific participant showed long error vectors (green lines) in the calibration results, see Tobii Studio User Manual section 4.3.2 Making recordings. To apply the Raw data filter in VelocityChart 1. 2. 3. In the Menu bar click Settings. Select Filter Settings… The dialog box has the same layout as the Fixation filter dialog in Tobii Studio. The startup parameter values in VelocityChart fixation filter dialog have been retrieved from the same parameters set in Tobii Studio. In the Fixation filter dialog box, select Raw data filter in the Fixation filter drop‐down menu. To zoom‐in to a representative part of the recording 1. 2. In VelocityChart, create a zoom window with the mouse by pressing the left mouse button while dragging the mouse along the timeline and then releasing the mouse button. Adjust the zoom window by dragging the scroll box in the horizontal scroll bar. © 2011 Tobii Technology ‐ All rights reserved. Tobii Technology and the Tobii logo are either registered trademarks or trademarks of Tobii Technology in the United States and/or other countries. www.tobii.com 5 To adjust the parameters in VelocityChart fixation dialog box 1. 2. In VelocityChart Fixation filter dialog box, adjust the parameters to obtain suitable data processing. Finding the best parameters values to fit all recordings while still preserving fine grained eye tracking data is a complicated task that requires training and experience. The default values have been set to work in most cases. These release notes will not cover the methods of evaluating different parameter settings. Click Apply to apply the changes in VelocityChart. Fixation filter parameters in VelocityChart do not affect fixation filter parameters in Tobii Studio. To apply VelocityChart’s Raw filter parameters values in Tobii studio. 1. In VelocityChart’s Fixation Filter settings dialog, click Save filter config. The Save fixation filter configuration to file dialog opens. 2. Select location and enter a file name for the filter configuration file. 3. Click save. 4. Open the Fixation filter dialog in Tobii Studio. The Fixation filter dialog is found in the Settings dialog, in the Tools menu. 5. Click Load filter config. Note: Make sure you are in the Fixation filter dialog in Tobii studio and not the one in VelocityChart. 6. Locate the configuration file in the Load fixation filter configuration from file dialog. 7. Double‐click the filter configuration file to open it in Tobii Studio. 8. Click Apply. (The settings can also be transferred simply by entering the parameter values from the fixation filter dialog in VelocityChart into the Fixation filter dialog in Tobii Studio by hand.) © 2011 Tobii Technology ‐ All rights reserved. Tobii Technology and the Tobii logo are either registered trademarks or trademarks of Tobii Technology in the United States and/or other countries. www.tobii.com 6 3 Using VelocityChart to tune the IVT fixation filter VelocityChart is a separate software application, but is launched from within Tobii Studio 2.3. To launch the VelocityChart application 1. 2. Select the Replay tab in Tobii Studio. In the Recordings pane, right‐click on the recording you want to open in VelocityChart. Click Launch VelocityChart. The VelocityChart opens in a new window. Note: Consider using a recording where the level of noise is relatively high. An indication of noise level may be the percentage of samples that was collected, or if you noticed that the calibration of a specific participant showed long error vectors (green lines) in the calibration results, see Tobii Studio User Manual section 4.3.2 Making recordings. To apply the I‐VT fixation filter in VelocityChart 1. 2. 3. In the Menu bar click Settings. Select Filter Settings… The dialog box has the same layout as the Fixation filter dialog in Tobii Studio. The startup parameter values in VelocityChart fixation filter dialog have been retrived from the same parameters set in Tobii Studio. In the Fixation filter dialog box, select I‐VT fixation filter in the Fixation filter drop‐down menu. To zoom‐in to a representative part of the recording 1. 2. In VelocityChart, create a zoom window with the mouse by pressing the left mouse button while dragging the mouse along the timeline and then releasing the mouse button. Adjust the zoom window by dragging the scroll box in the horizontal scroll bar. © 2011 Tobii Technology ‐ All rights reserved. Tobii Technology and the Tobii logo are either registered trademarks or trademarks of Tobii Technology in the United States and/or other countries. www.tobii.com 7 To adjust the parameters in VelocityChart fixation dialog box 1. 2. In the VelocityChart Fixation filter dialog box, adjust the parameters to obtain a suitable fixation classification. Finding the best parameters values to fit all recordings while still preserving fine grained fixations is a complicated task that requires training and experience. The default values have been set to work in most cases. These release notes will not cover the methods of evaluating different parameter settings. Click Apply to apply the changes in VelocityChart. Fixation filter parameters in VelocityChart do not affect fixation filter parameters in Tobii Studio. To apply VelocityChart’s Raw filter parameters values in Tobii studio. 1. In VelocityChart’s Fixation Filter settings dialog, click Save filter config. The Save fixation filter configuration to file dialog opens. 2. Select location and enter a file name for the filter the configuration file. 3. Click save. 4. Open the Fixation filter dialog in Tobii Studio. The Fixation filter dialog is found in the Settings dialog, in the Tools menu. 5. Click Load filter config. Note: Make sure you are in the Fixation filter dialog in Tobii studio and not the one in VelocityChart. 6. Locate the configuration file in the Load fixation filter configuration from file dialog. 7. Double‐click the filter configuration file to open it in Tobii Studio. 8. Click Apply. (The settings can also be transferred simply by entering the parameter values from the fixation filter dialog in VelocityChart into the Fixation filter dialog in Tobii Studio by hand.) © 2011 Tobii Technology ‐ All rights reserved. Tobii Technology and the Tobii logo are either registered trademarks or trademarks of Tobii Technology in the United States and/or other countries. www.tobii.com 8 4 Exporting gaze, velocity and fixation data from VelocityChart The VelocityChart application enables velocity data to be exported. All data processing function parameters are presented in the header of the text export. The output format of the text export is a tab separated text file. This format can be opened using Excel, SPSS, Matlab or any other text editor of your choice. To export gaze, velocity and fixation data from VelocityChart. 1. 2. 3. Open the File menu and click “Text Export…” In the Save fixation filter configuration to file dialog, select location and enter the file name for text export file. Click save. Text can also be exported by simply clicking “Text export to clipboard” and then paste copied data in Excel, SPSS, Matlab or any other text editor. © 2011 Tobii Technology ‐ All rights reserved. Tobii Technology and the Tobii logo are either registered trademarks or trademarks of Tobii Technology in the United States and/or other countries. www.tobii.com 9 4.1 Export columns The table below shows the data exported. VelocityChart text export columns Column name Index TimeStampMilliSec ScreenX ScreenY Velocity FixationX FixationY IsFixation Description Indexes for the data points (values corresponding to the order of the data point). Absolute timestamp in server time. This timestamp is not synchronized with the local time and should only be used to relate one gaze data point to another in time. X coordinate for the processed data point, mapped to the media coordinate system, where the origin for the coordinate system is the lower left corner of the tracking plane. Y coordinate for the processed data point, mapped to the media coordinate system, where the origin for the coordinate system is the lower left corner of the tracking plane. Estimated velocity of data points measured in degrees/second. X coordinate for classified fixation point, mapped to the media coordinate system, where the origin for the coordinate system is the lower left corner of the tracking plane. Y coordinate for classified fixation point, mapped to the media coordinate system, where the origin for the coordinate system is the lower left corner of the tracking plane. Data field showing “‐1” where a data point has been classified “fixation” Unit ms mm mm degrees/second mm mm © 2011 Tobii Technology ‐ All rights reserved. Tobii Technology and the Tobii logo are either registered trademarks or trademarks of Tobii Technology in the United States and/or other countries. www.tobii.com 10 Tobii Support contact: SWEDEN/GLOBAL +46 8 522 950 10 Phone [email protected] www.tobii.com Support hours: 9 am - 5 pm (Central European Time, GMT+1) GERMANY +49 69 2475 034-27 Phone [email protected] www.tobii.com Support hours: 9 am - 5 pm (Central European Time, GMT+1) NORTH AMERICA +1 703 738 1320 Phone [email protected] www.tobii.com Support hours: 8 am - 5 pm (US Eastern Standard Time, GMT-6) JAPAN +81-3-5793-3316 Phone [email protected] www.tobii.co.jp Support hours: 9 am - 5.30 pm (GMT+9) © Tobii®. Illustrations and specifications do not necessarily apply to products and services offered in each local market. Technical specifications are subject to change without prior notice. All other trademarks are the property of their respective owners. HEADQUARTERS, SWEDEN Tobii Technology AB Karlsrovägen 2D Box 743 S-182 17 Danderyd Sweden +46 8 663 69 90 Phone +46 8 30 14 00 Fax [email protected] central Europe Tobii Technology GmbH Niedenau 45 D-60325 Frankfurt am Main Germany +49 69 24 75 03 40 Phone +49 69 24 75 03 429 Fax [email protected] North America Tobii Technology, Inc. 510 N. Washington Street Suite 200 - Falls Church, VA 22046 - USA +1-703-738-1300 Phone +1-888-898-6244 Phone +1-703-738-1313 Fax [email protected] JAPAN Tobii Technology, Ltd. 3-4-13 Takanawa, Minato-ku Tokyo 108-0074 Japan +81-3-5793-3316 Phone +81-3-5793-3317 Fax [email protected] CHINA Tobii Electronics Technology Suzhou Co., Ltd No. 678, Fengting Avenue Land Industrial Park Weiting, Suzhou Post code: 215122 China +86 13585980539 Phone [email protected] www.tobii.com