1
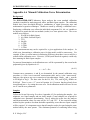
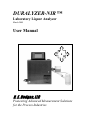
DURALYZER-NIR ™
Laboratory Liquor Analyzer
March 2009
User Manual
R
E
H
R. E. Hodges, LLC
Pioneering Advanced Measurement Solutions
for the Process Industries
DURALYZER-NIR™ Laboratory Liquor Analyzer Manual
Company Profile
R. E. Hodges, LLC (hereafter referred to as REH, LLC) was formed in 2001 as a
manufacturer of online and laboratory spectroscopic based measurement solutions for the
process industries. The equipment and instrumentation developed by REH, LLC is
specifically designed to be easily incorporated into a control strategy.
In general, spectroscopic based measurements hold the key to unlocking the majority of
difficult measurement applications in the process industries. REH, LLC was created to
replace or reduce traditional laboratory based testing for quality control by implementing
real time online measurements coupled with practical control strategies. Unlike
traditional spectrometer manufacturers, REH, LLC provides turnkey sampling and
measurement solutions that are tailored to suit the specific application. In addition to
accuracy and reliability, our analyzers are characterized by minimal installation and
continuing maintenance requirements.
At REH, LLC, we take great pride in the innovation and quality of our products and the
continuing service and support we provide for each product. We are unique in our ability
to work with the customer to develop a customized online or laboratory measurement
solution. Our overall goal is to continually improve and expand our product line,
capabilities, and service to meet the evolving challenges of current and future customers.
It is our firm belief that the customer’s success translates into our success.
R. E. Hodges, LLC
2217 Pumphrey Avenue
Auburn, AL 36832
Phone: (334) 466-0057
Fax: (334) 466-0058
R. E. Hodges, LLC
ii
DURALYZER-NIR™ Laboratory Liquor Analyzer Manual
About This Manual
This manual provides information necessary for proper operation and care of the
DURALYZER-NIR™ laboratory liquor analyzer. The subject matter is divided into four
main headings.
1.
2.
3.
4.
Introduction and Specifications
Principle of Operation
Installation
Operation and Maintenance
The manual is more than a simple set of instructions. Specific topics covered include the
following:
•
•
•
•
•
•
•
•
•
Comparison between the DURALYZER-NIR™ and other current solutions
(Chapter 1).
General specifications (Chapter 1)
NIR spectroscopy and its implementation (Chapter 2)
Installation guidelines and procedure (Chapter 3)
Startup and normal operation (Chapter 4)
Customizing the analyzer settings (Chapter 4)
MODBUS configuration (Chapter 4)
Calibration model tuning (Chapter 4)
Maintenance requirements and procedure (Chapter 4)
Information contained in the main body of the manual is further detailed in the
appendices.
Careful attention has been paid to accuracy of the contents of this manual. R. E. Hodges
welcomes any recommendations, suggestions or corrections that would serve to improve
the quality and utility of this literature.
R. E. Hodges, LLC
iii
DURALYZER-NIR™ Laboratory Liquor Analyzer Manual
Disclaimer
The information given herein, including drawings, images, illustrations, and schematics
(intended for illustration purposes), is believed to be reliable and accurate. However, R.
E. Hodges, LLC makes no warranties to its accuracy or completeness and disclaims any
liability in connection with its use. R. E. Hodges, LLC’s only obligation shall be as set
forth in R. E. Hodges, LLC’s standard terms and conditions of sale for this product and in
no way will R. E. Hodges, LLC be liable for any incidental, indirect or consequential
damages arising out of the use or misuse of this product. Users of R. E. Hodges, LLC
products should make their own evaluation to determine the suitability of each product
for the specific application.
R. E. Hodges, LLC
iv
DURALYZER-NIR™ Laboratory Liquor Analyzer Manual
Table of Contents
Company Profile ........................................................................ ii
About This Manual ................................................................... iii
Disclaimer ................................................................................. iv
List of Figures .......................................................................... vii
List of Tables............................................................................. ix
1 Introduction and Specifications.................................................. 1
1.1
1.2
1.3
Introduction........................................................................................................1
DURALYZER-NIR™ vs. Current Solutions.......................................................2
Specifications.....................................................................................................3
2 Principle of Operation ................................................................ 4
2.1
2.2
Concept ..............................................................................................................4
Implementation ..................................................................................................8
3 Installation.................................................................................. 9
3.1
3.2
3.3
3.4
General...............................................................................................................9
Tubing Connections ...........................................................................................9
Air and Water Requirements ...........................................................................10
Power and Wiring Connections .......................................................................10
4 Operation and Maintenance ..................................................... 11
4.1
4.2
4.3
4.4
4.5
General.............................................................................................................11
Startup ..............................................................................................................12
Normal Operation ............................................................................................12
Settings.............................................................................................................15
4.4.1 Accessing the Main Menu....................................................................15
4.4.2 Labeling Submenus..............................................................................17
4.4.3 Configuration Submenus .....................................................................19
4.4.4 Informative Submenus .........................................................................26
4.4.5 Model Tuning Submenus.....................................................................29
Maintenance.....................................................................................................31
Appendix ...................................................................................... 34
A.1
A.2
Dimensions and Additional Images .................................................................35
Nomenclature...................................................................................................42
R. E. Hodges, LLC
v
DURALYZER-NIR™ Laboratory Liquor Analyzer Manual
A.3
A.4
A.5
A.6
A.7
A.8
A.9
A.10
A.11
A.12
A.13
A.14
Useful Equations..............................................................................................43
Setup Cautions .................................................................................................44
Normal Operating Procedure ...........................................................................45
Manual Calibration Curve Determination .......................................................48
Automated Calibration Curve Determination..................................................57
Bias Adjustment...............................................................................................63
Printer Details ..................................................................................................69
NIR Light Source Replacement .......................................................................71
MODBUS ........................................................................................................75
Troubleshooting ...............................................................................................78
Replacement Parts............................................................................................79
Warranty and Notices ......................................................................................80
R. E. Hodges, LLC
vi
DURALYZER-NIR™ Laboratory Liquor Analyzer Manual
List of Figures
1-1
2-1
2-2
2-3
2-4
2-5
2-6
2-7
3-1
3-2
4-1
4-2
4-3
4-4
4-5
4-6
4-7
4-8
4-9
4-10
4-11
4-12
4-13
4-14
4-15
4-16
4-17
4-18
4-19
4-20
4-21
4-22
4-23
4-24
4-25
4-26
4-27
4-28
4-29
4-30
4-31
4-32
4-33
4-34
DURALYZER-NIR™ laboratory liquor analyzer..........................................1
Electromagnetic spectrum related to optical spectroscopy.............................4
Basic transmission cell configuration .............................................................5
Sample cuvette ................................................................................................5
Sample cuvette holder.....................................................................................6
The Beer-Lambert law ....................................................................................7
Simplified view of regression modeling and prediction .................................8
DURALYZER-NIR™ laboratory liquor analyzer (syringe setup).................9
External connection locations .......................................................................10
Internal connections and components...........................................................11
LCD “BOOT” screen....................................................................................12
Operator Screen............................................................................................13
“Set Zero” screens.........................................................................................13
“Analyze Sample” screens............................................................................14
Analysis results .............................................................................................14
“About” screen..............................................................................................16
LCD touch screen keyboard..........................................................................16
Main Menu screen.........................................................................................16
Blank Sample Point Labels screen................................................................18
Sample Point 1 labeled as “GREEN-LIQ” ...................................................18
All sample points labeled..............................................................................18
Component Labels screen with default values..............................................19
Customized EA, AA, and TTA labels ..........................................................19
Display Units screen with default units (lb/100gal as Na2O) .......................20
Display units in lb/ft3 as Na2O ......................................................................21
Time and Date Adjustments screen ...............................................................21
Example of setting time and date..................................................................22
MODBUS Configuration screen ...................................................................22
Scan Parameters screen with default values for each sample point.............23
Custom scan parameters applied to each sample point.................................23
Change Password screen where current password is “TIGERS”.................24
Password is changed to “LIQTEST” ............................................................24
Contrast & Backlight Adjust screen..............................................................25
Saving the current analyzer configuration ....................................................25
Utilizing the “Restore” function ...................................................................26
Analyzer Status screen ..................................................................................26
Typical transmission water spectrum............................................................27
Unsaturated water spectrum..........................................................................27
Saturated water spectrum..............................................................................28
Analyzer Info. Screen ....................................................................................28
“Print Cfg.” Notification screen....................................................................29
Component Curves, Slopes and Offsets screen .............................................30
Calibrate Curve, Slope and Offset screen.....................................................30
Bias Adjustments screen with Sample Point 1 selected ................................31
R. E. Hodges, LLC
vii
DURALYZER-NIR™ Laboratory Liquor Analyzer Manual
4-35
4-36
4-37
A.1-1
A.1-2
A.1-3
A.1-4
A.1-5
A.1-6
A.1-7
A.1-8
A.1-9
A.1-10
A.1-11
A.6-1
A.6-2
A.6-3
A.7-1
A.8-1
A.8-2
A.8-3
A.8-4
A.9-1
A.10-1
A.10-2
A.10-3
A.10-4
A.10-5
A.10-6
A.11-1
A.11-2
Edit Bias Values screen with default values .................................................31
NIR light source enclosure............................................................................32
NIR light source removal..............................................................................33
DURALYZER-NIR™ laboratory liquor analyzer dimensions.....................35
LCD panel dimensions..................................................................................36
Printer dimensions ........................................................................................37
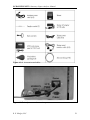
System setup .................................................................................................38
NIR Quartz-Tungsten-Halogen (QTH) light source .....................................38
Accessories and cables..................................................................................39
Analyzer external connection ports ..............................................................39
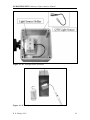
Analyzer internal components ......................................................................40
Sample cuvette and light source enclosure ...................................................40
NIR light source enclosure............................................................................41
Analyzer side view........................................................................................41
Calibration curves for Example A.6-1 ..........................................................52
Menu sequence for manual entry of calibration curve parameters ...............53
Calibration curves for Example A.6-2 ..........................................................55
Menu sequence for automated calibration curve determination ...................61
Bias adjustment determination for Example A.8-1.......................................65
Bias adjustment parameters for Example A.8-1 ...........................................65
Bias adjustment determination for Example A.8-2.......................................66
Menu sequence for implementing bias adjustments .....................................68
Printer images ...............................................................................................70
Power switch and light source enclosure locations.......................................71
Light source enclosure cover removal ..........................................................72
NIR light source removal..............................................................................72
Unsaturated water spectrum..........................................................................73
Saturated water spectrum..............................................................................73
Menu sequence for the “New Bulb” function...............................................74
MODBUS Configuration screen ...................................................................75
Menu sequence for MODBUS configuration ...............................................76
R. E. Hodges, LLC
viii
DURALYZER-NIR™ Laboratory Liquor Analyzer Manual
List of Tables
1-1
1-2
4-1
4-2
4-3
A.6-1
A.8-1
A.11-1
A.12-1
A.13-1
DURALYZER-NIR™ vs Current Solutions ..................................................2
General Specifications ....................................................................................3
Startup Procedure..........................................................................................12
Main Menu Summary ...................................................................................17
Typical Units and Conversion Factors..........................................................20
Comparison of Analyzer Values with Lab Values (Ex. A.6-1) ....................54
Bias Adjustment Method Comparison for Example A.8-2...........................67
MODBUS Register Addresses......................................................................77
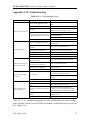
Troubleshooting Guide .................................................................................78
Replacement Parts List .................................................................................79
R. E. Hodges, LLC
ix
DURALYZER-NIR™ Laboratory Liquor Analyzer Manual
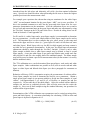
1 Introduction and Specifications
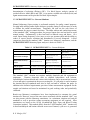
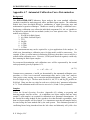
1.1 Introduction
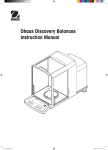
The DURALYZER-NIR™ laboratory liquor analyzer has been engineered to provide
fast, reliable and accurate measurements while avoiding the negative issues associated
with manual testing and laboratory autotitrators. The laboratory liquor liquid analyzer
shares the near-infrared (NIR) technology utilized by our online liquor analyzers and is
specifically designed to function in the somewhat harsh laboratory environments in the
pulping and recovery areas. Maintenance requirements have been held to a minimum,
consisting of periodic acid cleaning of the sample cuvette and annual light source
replacement. The DURALYZER-NIR™ laboratory liquor analyzer is shown in Figure 11.
Figure 1-1. DURALYZER-NIR™ laboratory liquor analyzer.
Effective alkali (EA), active alkali (AA), total titratable alkali (TTA), total dissolved
solids (TDS), and total dissolved dead load (TDD) are computed for white liquor, green
liquor, and weak wash. Additionally, Na2SO4 is measured for green liquor to allow for
R. E. Hodges, LLC
1
DURALYZER-NIR™ Laboratory Liquor Analyzer Manual
determination of reduction efficiency (RE). For black liquors, analysis consists of
residual effective alkali (REA) and TDS. As an option, residual active alkali (RAA) and
lignin measurements can be provided for black liquor samples.
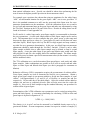
1.2 DURALYZER-NIR™ vs. Current Solutions
Manual (laboratory) liquor testing is performed routinely for quality control purposes.
For pulp mills utilizing online liquor analyzers, periodic testing is still necessary in order
to validate the online measurements. Frequently, lab tests are the only source of
measurements for process control decisions. The rather tedious and cumbersome nature
of the standard “ABC” testing procedure for process liquors does not lend itself to rapid
manual testing. Unfortunately, it does lend itself to induced errors and biases. As a
result, liquor testing frequency is low (once or twice per operator shift) and the ability to
reduce or correct process variations and disturbances is severely hampered. A brief
comparison between the standard “ABC” titration test, laboratory autotitrators, and the
DURALYZER-NIR™ laboratory liquor analyzer is shown in Table 1-1.
Table 1-1. DURALYZER-NIR™ vs. Current Solutions.
Characteristic
STD "ABC" Titration
Autotitrator
DURALYZER-NIR™
7 (EA, AA, TTA, TDS, TDD,
Lignin, Na2SO4)
Available Measurements
3 (EA, AA, TTA)
Measurement Technique
Direct: volumetric analysis
Measurement Accuracy
Factors
Potential volumetric errors
Analysis Speed
Slow: minutes to 10's of minutes Slow: minutes to 10's of minutes Fast: 20 to 60 seconds
Maintenance
Low: maintain glassware and
chemicals
3 (EA, AA, TTA)
Inferred: inflection pt. method
based on pH titration curve
(SCAN method)
Potential volumetric errors,
difficulties in pinpointing
inflection pts. (especially for
AA)
Inferred: regression model
relating NIR spectral signature to
chemical composition
no volumetric errors
Moderate: acid replacement, pH Low: annual light source
probe calibration, occasional lab replacement, occasional lab
validation
validation
The standard “ABC” titration test requires multiple chemicals and lab equipment to
implement.
Titration chemicals such as certified hydrochloric acid solution,
formaldehyde, barium chloride and various color indicators can be inconvenient (in terms
of cost and space) to maintain in the process testing lab. If a pH probe is used to monitor
the titration then pH standards must also be kept on hand to calibrate the probe. In
addition to the chemical requirements, precision volume measurement equipment for the
sample and titration acid must be maintained in good working order and periodically
calibrated.
Bench top (laboratory) autotitrators have been implemented to automate the actual
titration test. However, most of the same issues associated with the standard “ABC” test
are also present with the laboratory autotitrator. At a minimum, titration acid and pH
standards as well as precision volume measuring equipment are still required. Most
autotitrators are based on the SCAN (Scandinavian Pulp, Paper and Board Testing
Committee) method. This method differs from the TAPPI standard “ABC” titration test
in that formaldehyde and barium chloride are not used. Instead, a pH curve is generated
R. E. Hodges, LLC
2
DURALYZER-NIR™ Laboratory Liquor Analyzer Manual
as a function of the added titration acid The inflection points on the titration curve are
used to estimate the EA, AA and TTA values of the liquor sample. Problems can arise
from difficulties in pinpointing the inflection points, especially for the AA. The inflection
point locations can vary with changes in dead load concentrations, leading to erroneous
concentration estimates. This effect is especially pronounced on the AA inflection point.
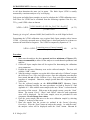
1.3 Specifications
The general specifications of the DURALYZER-NIR™ laboratory liquor analyzer are
contained in Table 1-2. Certain specifications may differ from Table 1-2 if unique
installation and operating conditions require deviation from the standard setup.
Table 1-2. General Specifications.
EA: ± 0.50 lb/100gal as Na2O
AA: ± 0.75 lb/100gal as Na2O
TTA: ± 0.75 lb/100gal as Na2O
Accuracy
%TDS: ± 0.50
%TDD: ± 0.50
Lignin: ± 1.00 lb/100gal
Na2SO4: ± 0.5 lb/100gal as Na2O
Repeatabilty
Analyzer Internal
Operating
Temperature
Sample Cuvette
Tubing
Analyzer Housing
Connections
Power Input
R. E. Hodges, LLC
± 0.2 % of full scale
40 °C
Fused Silica, 1.0 mm path length
Silicone
NEMA 4X, 304 SS
RJ11 (remote support modem)
Cat-5 RJ45 Ethernet (MODBUS TCP)
Printer (RS232 9 pin D-sub)
LCD touch screen panel (4 pin)
RS422/485 MODBUS RTU (5 pin)
120 - 240 VAC, 1.6A, 50/60 Hz
3
DURALYZER-NIR™ Laboratory Liquor Analyzer Manual
2 Principle of Operation
2.1 Concept
The DURALYZER-NIR™ laboratory liquor analyzer is based on the implementation of
NIR spectroscopy to determine the chemical composition of process liquors. This
spectroscopic technique is a subset of a larger class of analytical techniques that fall
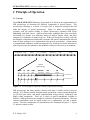
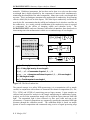
under the category of optical spectroscopy. Figure 2-1 shows the electromagnetic
spectrum, with the portion relating to optical spectroscopy expanded (NIR region
highlighted with black arrow). Optical spectroscopic techniques have been used quite
successfully for decades in a laboratory setting to analyze liquids, solids, and gases
composed of a multitude of chemical species. In the past twenty five to thirty years, the
development of miniaturized and durable electronic and optical components has allowed
many of these techniques to be implemented in the process environment. Advancements
in computational techniques and microcomputers have fueled the increased utilization of
optical spectroscopy for qualitative and quantitative analysis in the process environment.
Cosmic-Rays γ-Rays
X-Rays
10-13 10-12 10-11 10-10 10-9
UV Vis. Infrared
10-8
10-7
10-6
10-5
10-4
Microwaves
10-3
10-2
UHF
10-1
Radio
100
101
102
103
104
Wavelength (m)
Optical
Spectroscopy
Vacuum
UV
Far
UV
Near
UV
Visible
Light
Short Wave
Near Infrared
Near
Infrared
Mid
Infrared
Wavelength (µm)
0.1
0.2
0.3
0.4
0.5
0.75 0.8
1.1
2.5
4
40
250
2,500
4,000
9,100
13,300
12,500
20,000
25,000
30,000
50,000
100,000
Wavenumber (cm-1)
Figure 2-1. Electromagnetic spectrum related to optical spectroscopy.
NIR spectroscopy has many attractive features that make it ideally suited for process
analysis. Key features include: minimal sample preparation, remote sensing through the
use of fiber optic cables, and simple implementation using relatively inexpensive and
highly robust components. There are a variety of optical attachments available to
interface a NIR spectrometer to a sample for collection of spectral information. The most
common attachments used for liquid analysis are a transmission cell and a sample
cuvette. The basic configuration of a transmission cell is illustrated in Figure 2-2. Figure
2-3 depicts a sample cuvette.
R. E. Hodges, LLC
4
DURALYZER-NIR™ Laboratory Liquor Analyzer Manual
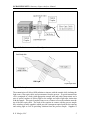
Figure 2-2. Basic transmission cell configuration.
Figure 2-3. Sample cuvette.
The transmission cell allows NIR radiation to interact with the sample while isolating the
light source, fiber optic cable, and spectrometer from the process. A typical transmission
cell is composed of a body (with appropriate sample inlet and outlet connections) and a
pair of optical couplers to deliver light to the sample and collect light after interaction
with the sample. The optical couplers house a set of lenses to focus the radiation onto the
tip of the fiber optic cable. The ends of the couplers in contact with the process sample
have windows (usually sapphire) which provide a transparent optical path for the entering
and exiting light as well as providing isolation from the process sample. Sapphire is
R. E. Hodges, LLC
5
DURALYZER-NIR™ Laboratory Liquor Analyzer Manual
usually the material of choice for the coupler windows due to its combination of
hardness, chemical and heat resistance, and inherent transparency over a broad range of
wavelengths.
A sample cuvette functions as a sample cell and is used in a laboratory environment.
Obviously, it would not hold up to the rigors of a process environment. Implementation
of a cuvette requires a cuvette holder (shown in Figure 2-4) that allows the delivery of
NIR light and collection of the transmitted light.
Figure 2-4. Sample cuvette holder.
Light interaction with the sample is described by the Beer-Lambert law (also referred to
as Beer’s law and Lambert-Beer’s decay). This law states that absorbance is directly
proportional to the concentration of the absorbing species. Details of this relation are
shown in Figure 2-5. According to Beer’s law, light intensity decays exponentially as it
passes through the material. The rate of decay depends on the concentrations of the
constituent species of the material and their corresponding absorption coefficients. The
total amount of decay depends on the length of material the light crosses. Equations
describing this phenomenon are displayed within Figure 2-5. Total absorption at a
particular wavelength can be computed by applying a logarithm to the initial equation.
The key observation to be made from this equation is that absorption (A) at a particular
wavelength varies linearly with the concentrations of the constituent species (Ck). With
the path length (L) fixed by the transmission cell, the absorption coefficients (εik) depend
only on the wavelength i and the molecular structure of species k in the material under
test. Thus, the absorption will change only when the concentrations of the constituent
species change. Additionally, absorption at a particular wavelength depends on the
concentration of all of the species that make up the sample under test. This is a major
drawback for single wavelength instruments that are used to analyze multi-component
R. E. Hodges, LLC
6
DURALYZER-NIR™ Laboratory Liquor Analyzer Manual
materials. With these instruments, the best that can be done is to select an observation
wavelength that is highly absorbed by the component of interest while simultaneously
minimizing the absorption of the other components. Many times such a wavelength does
not exist. This is an analogous situation to the application of conductivity for measuring
effective alkali (EA) levels in white liquors. The white liquor conductivity is affected the
most by the EA concentration but the sulfide and carbonate levels also have an affect on
the conductivity. As a result, periodic recalibration of the conductivity meter is required
to compensate for the effects of changing sulfide and carbonate levels. The
DURALYZER-NIR™ analyzers (laboratory and online) do not have these drawbacks or
shortcomings since the measurement is taken over a continual range of wavelengths.
⎧ ⎛ N
⎞ ⎫
I (λi ) = I 0 (λi ) exp⎨− ⎜ ∑ ε ik Ck ⎟ L ⎬
⎠ ⎭
⎩ ⎝ k
Material Under Test
I0(λi)
Light
I (λi)
C1, C2, …, CN
⎧ ⎛ N
I (λi )
⎞ ⎫
= exp⎨− ⎜ ∑ ε ik Ck ⎟ L ⎬
I 0 (λi )
⎠ ⎭
⎩ ⎝ k
εi1, εi2, …, εiN
L
⎧ I (λi ) ⎫ ⎛ N
⎞
A(λi ) = − ln ⎨
⎬ = ⎜ ∑ ε ik Ck ⎟ L
⎠
⎩ I 0 (λi )⎭ ⎝ k
I0(λi) = Entering light intensity for wavelength λi
I(λi) = Exiting light intensity for wavelength λi
C1, C2, …, CN = Concentration of species 1, 2, …, N
εi1, εi2, …, εiN = Absorption coefficients for species 1, 2, …, N for wavelength λi
L = Path length of sample
A(λi) = Total absorption for wavelength λi
Figure 2-5. The Beer-Lambert law.
The general concept is to utilize NIR spectroscopy (via a transmission cell or sample
cuvette) in conjunction with software to determine the chemical composition (EA, AA,
TTA, %TDS, and %TDD) of causticizing process liquor streams. Liquor samples are
collected and prepared for analysis in the sample multiplexing & conditioning system.
Analysis occurs in the transmission sample cell in which the liquor interacts with NIR
light. The transmitted light is then collected via fiber optic cable and sent to the
spectrometer. Chemical compositions are computed by passing the transmitted NIR light
spectrum through the calibration model. The calibration model is based on sample
spectra of known composition and constructed using a series of signal processing steps
R. E. Hodges, LLC
7
DURALYZER-NIR™ Laboratory Liquor Analyzer Manual
and employing a variation of partial least squares (PLS) or other regression techniques.
A simplified flow diagram of the regression analysis is contained in Figure 2-6.
Figure 2-6. Simplified view of regression modeling and prediction.
2.2 Implementation
Direct implementation of NIR spectroscopy for laboratory liquor analysis requires an
analyzer able to withstand long term use in the harsh lab environments of the pulping and
recovery areas. The DURALYZER-NIR™ laboratory liquor analyzer is housed in a 304
SS NEMA 4X enclosure which provides protection from corrosive agents, moisture, and
dust. Attaching the sample cuvette holder and light source directly to the enclosure
serves to eliminate the need for fiber optic cables and minimize the overall footprint
(which is important due to the lack of work space in most pulp mill laboratories). Test
results are displayed on the LCD touch screen panel and can also be printed via the
accompanying thermal printer. Results can also be sent directly to the DCS through the
MODBUS connection.
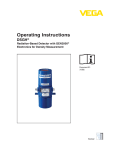
Delivery of the sample to the cuvette is simple. Silicone tubing is attached to the cuvette,
with one end placed in the sample container and the other end attached to a syringe (or
similar device). Currently, the analyzer is shipped with a 60 mL pipetting bulb. The
design of the DURALYZER-NIR™ laboratory liquor analyzer allows for custom
arrangements. Figure 2-7 shows the syringe setup.
R. E. Hodges, LLC
8
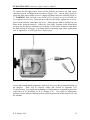
DURALYZER-NIR™ Laboratory Liquor Analyzer Manual
Figure 2-7. DURALYZER-NIR™ laboratory liquor analyzer (syringe setup).
3 Installation
3.1 General
The DURALYZER-NIR™ laboratory liquor analyzer is designed for straightforward
installation (setup) while minimizing the associated costs (monetary and time).
Highlights and key components are identified in Figure 2-7. The setup location should be
in an area safely away from continual exposure to acid vapor. Care should be taken to
avoid moisture exposure to the LCD panel and the thermal printer (panel and printer are
attached via cables so this should not be too difficult). A detailed listing of environments
to avoid is given in Appendix A.4 Setup Cautions. The analyzer comes delivered in a
foam shell within a reinforced box that should be stored and used to ship the analyzer
back to REH, LLC if the need arises for any major repairs.
3.2 Tubing Connections
Silicone tubing and a 60 mL rubber pipetting bulb are supplied to allow for drawing the
sample into the cuvette and ejecting it after analysis (8-12′′ for cuvette-to-bulb section
and 18-22′′ for sample bottle-to-cuvette section). This was previously mentioned and
R. E. Hodges, LLC
9
DURALYZER-NIR™ Laboratory Liquor Analyzer Manual
shown in Figure 2-7. Alternatively, custom configurations can be employed. An
example would be a “flow-through” arrangement, whereby the sample is poured into a
funnel, flows downward through the cuvette to a collection container. As the sample is
flowing, the tubing section downstream of the cuvette would be temporarily clamped for
the duration of the analysis.
3.3 Air and Water Requirements
Instrument air is not required for operation. Mill water is required for flushing out the
sample cuvette and occasional spectrometer baseline referencing. Deionized water is not
needed unless the mill water is of unusually poor quality. If mill water quality is an
issue, a suitable solution will be proposed.
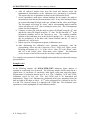
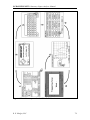
3.4 Power and Wiring Connections
The analyzer is equipped with a detachable power cord connectable to any standard
(120V, 60 Hz, single phase 10A) outlet with line, neutral, and ground connections. The
thermal printer is connected to the analyzer via the RS232 port and is equipped with its
own power unit and power cord which also connects to any standard 3 prong outlet.
Further details concerning the thermal printer are located in Appendix A.9 Printer
Details. The LCD touch screen cable is plugged in to the 4-pin connector located next to
the RS232 printer connection. A MODBUS RTU 5-pin connection port is also available
externally. All external connection locations are on the side of the analyzer opposite the
cuvette and exhibited in Figure 3-1.
Figure 3-1. External connection locations.
Two internal connections are also present. Remote modem support is provided through
the RJ11 connection, enabling software updates and an ability to assist mill personnel in
R. E. Hodges, LLC
10
DURALYZER-NIR™ Laboratory Liquor Analyzer Manual
troubleshooting (if the need arises). A Cat-5 RJ45 ethernet connection is available for
MODBUS TCP. The internal connections as well as key internal components are
identified in Figure 3-2.
Figure 3-2. Internal connections and components.
4 Operation and Maintenance
4.1 General
The DURALYZER-NIR™ laboratory liquor analyzer has been designed for ease of
operation and minimization of short and long-term maintenance requirements. This has a
net effect of minimizing the overall cost of ownership. Scheduled operation and
maintenance requirements have been kept to a minimum. These include annual bulb
replacement in the light source enclosure and occasional acid cleaning of the sample
cuvette. Periodic validation with lab tests should be performed as well. Unscheduled
maintenance has been greatly reduced by minimizing the system component count. As
with any sophisticated hardware, common sense care will aid in extending the lifetime of
the analyzer. Follow standard laboratory safety protocols when using the analyzer, such
as wearing protective eyewear and clothing.
R. E. Hodges, LLC
11
DURALYZER-NIR™ Laboratory Liquor Analyzer Manual
4.2 Startup
Startup is straightforward, entailing setup tasks and power up. In some cases, R.E.
Hodges, LLC personnel can be on hand to perform and oversee startup operations. The
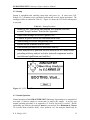
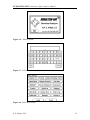
startup procedure is outlined in Table 4-1. Figure 4-1 shows the LCD screen when power
is activated.
Table 4-1. Startup Procedure
1.
Identify a safe, convenient, and hazzard free location (take into
account "Setup Cautions" listed in the Appendix)
2.
3.
4.
5.
6.
Unpack and arrange accessories (printer, etc.)
Connect all power cables and communication cords
Attach tubing to cuvette and pipetting bulb
Secure cuvette in holder with set screw
Turn on analyzer and close SS enclosure with key
Allow analyzer to be powered on for a MINIMUM of 2 hours before
7. proceding with any analysis activities (internal components need to
reach thermal equilibrium and stabilize)
Figure 4-1. LCD “BOOT” screen.
4.3 Normal Operation
Normal operation of the DURALYZER-NIR™ laboratory liquor analyzer is comprised of
two steps: (1) deliver sample to cuvette and (2) analyze the sample. A step by step
normal operating procedure is in Appendix A.5 Normal Operating Procedure. Before
performing any analysis, the analyzer must be powered on for a minimum of 2 hours
(12 or more hours would be ideal). Once powered “on”, the analyzer should only be
R. E. Hodges, LLC
12
DURALYZER-NIR™ Laboratory Liquor Analyzer Manual
turned off when it is being moved to another location or serviced. Initially, operation will
be outlined using the “default” settings from REH, LLC. Procedures concerning
calibration model tuning and configuration settings are detailed in subsequent sections.
The LCD should reflect Figure 4-2 at this point, showing the Operator Screen.
Figure 4-2. Operator Screen.
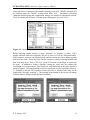
Before initiating sample analysis, a water “reference” or “baseline” is taken. Fill a
sample container with water (typically 200 mL of water in a 250 mL Nalgene® bottle).
Fully compress (squeeze) the pipetting bulb and then insert the silicon tubing (pickup
tube) into the water. Draw the water into the cuvette by slowly releasing the bulb and
then let it hang freely. Select “Set Zero” on the LCD touch screen (finger or stylus may
be used). In addition to setting a baseline, setting the water zero also ensures the
wavelength axis of spectrometer (specifically the monochromator in the optics bench) is
properly aligned. The corresponding screens for setting the zero are depicted in Figure 43. Scanning is delayed 120 seconds to ensure the water is stabilized (the delay can be
bypassed by selecting “continue”). The message at the bottom of the screen will change
when the water is being scanned (spectrum acquired).
Figure 4-3. “Set Zero” screens.
R. E. Hodges, LLC
13
DURALYZER-NIR™ Laboratory Liquor Analyzer Manual
The “zero” should be set once per day, plus every time the analyzer is turned on (once
stabilized), and after acid cleaning the cuvette. This can be done manually (outlined
above) or by selecting the “auto zero” check box (see Figure 4-2). When sitting idle,
water is to be in the cuvette at all times. The “auto zero” function takes advantage of this,
setting the zero every 2 hours.
Before analyzing a liquor sample, place the silicon tube in a sample waste bottle and eject
the water. Hold the pipetting bulb in an upright (elevated) position and squeeze. Do this
several times to thoroughly evacuate the water (note: the silicon tubing should be held
while doing this to avoid the possibility of uncontrolled spray). Fully compress the
pipetting bulb and place the silicon tubing in the liquor sample. Draw the liquor into the
cuvette by slowly releasing the bulb and then let it hang freely. Select the sample point
for testing and “Analyze Sample” on the Operator Screen (Figure 4-2). The current
status of the LCD screen is reflected in Figure 4-4. Scanning is delayed 120 seconds
(default value) to ensure the sample is stabilized (the delay can be bypassed by selecting
“continue”). The message at the bottom of the screen will change when the sample is
being scanned (spectrum acquired).
Figure 4-4. “Analyze Sample” screens.
Figure 4-5. Analysis results.
R. E. Hodges, LLC
14
DURALYZER-NIR™ Laboratory Liquor Analyzer Manual
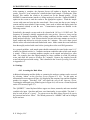
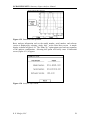
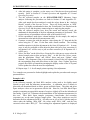
After scanning is complete, the Operator Screen will update to display the analysis
results. Figure 4-5 is an example for a clarified white liquor sample. Checking the “Print
Results” box enables the results to be printed out via the thermal printer. If the
MODBUS communications interface is being employed, select the “Update MODBUS”
option on the screen to send the results to the appropriate registers. Flush the sample
cuvette with water and eject into the waste bottle. Draw water into the cuvette, letting it
remain until the next round of liquor testing. Items such as labels and display units can
be customized (edited) to suit the user. Customization options are detailed in the
following section.
Periodically, the sample cuvette needs to be cleaned with 1.0 N or 0.1 N HCl acid. The
frequency of cleaning is initially suggested to be once per day. However, it may end up
being more infrequent depending on the scaling conditions and the number of samples
being analyzed each day. Acid is drawn into the cuvette in the same manner as water or a
liquor sample and allowed to sit in the cuvette for 2 minutes. The acid is then ejected
into the waste collection bottle and flushed with water. Make certain the waste bottle has
been thoroughly washed with water before ejecting the acid to avoid H2S generation.
As a general guideline, each sample point should consistently be tested in the same 10 °C
window for optimal results (i.e., maintain consistent conditions under which each sample
is tested). If this is a recurring problem, samples can be capped and placed in a water
bath. For example, place the capped samples in a large container in a sink, fill with tap
water, and allow the water to overflow for 2 minutes. Remove the samples from the
water bath and proceed with testing. This is detailed in the Normal Operating Procedure
in Appendix A.5.
4.4 Settings
4.4.1 Accessing the Main Menu
Additional information and the ability to customize the analyzer settings can be accessed
by selecting “About” on the Operator Screen (Figures 4-2, 4-5). At this point, an
informational screen appears (Figure 4-6) displaying the company logo and the telephone
number for support. Selecting “OK” will return the user to the Operator Screen.
Touching the trademark (gray shaded region in Figure 4-6) will access a virtual keyboard
on the LCD screen (Figure 4-7).
The “QWERTY” virtual keyboard allows upper case letters, numerals, and some standard
symbols to be input. Spacebar and lower case functionality is not available. The dash “-“
may be used in lieu of a “space”. To gain access to the Main Menu (Figure 4-8) type in
the password and select “Enter”. The default password is “ADMIN” and can be changed
by the end user.
R. E. Hodges, LLC
15
DURALYZER-NIR™ Laboratory Liquor Analyzer Manual
Figure 4-6. “About” screen.
Figure 4-7. LCD touch screen keyboard.
Figure 4-8. Main Menu screen.
R. E. Hodges, LLC
16
DURALYZER-NIR™ Laboratory Liquor Analyzer Manual
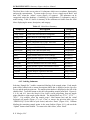
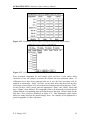
The Main Menu is the access point to 18 submenus which serve to enhance functionality
and provide customization. To return to the Operator Screen, simply touch “Back” and
then “OK” when the “About” screen (Figure 4-5) appears. The submenus can be
categorized under four headings: (1) labeling, (2) configuration, (3) informative, and (4)
model tuning. Table 4-2 shows a summary of the submenus accessible from the Main
Menu displaying the name, description, and category.
Table 4-2. Main Menu Summary.
Submenu
Sample Pts.
Comp. Labels
Display Units
Time/Date
Slope/Offset
Set Bias
MODBUS
Scan Params
Password
Status
Spectra
Display
New Bulb
Analy. Info.
Print Cfg.
Calibrate
Backup
Restore
Description
Define each sample point label
Custom label each measured component
Define units for each sample point
Change analyzer time and date
Access component curve,slope, and offset
Adjust biases to match lab tests
Configure MODBUS/TCP parameters
Change scan count and time delay
Change current password
Display internal analyzer sensor readings
Display spectral signature of current sample
Adjust brightness and contrast of LCD panel
Check for saturation on a new bulb change
Display model#, serial#, and software version
Print analyzer configuration
Perform analyzer calibration function
Backup current configuration
Restore last saved configuration
Category
Labeling
Labeling
Configuration
Configuration
Model Tuning
Model Tuning
Configuration
Configuration
Configuration
Informative
Informative
Configuration
Informative
Informative
Informative
Model Tuning
Configuration
Configuration
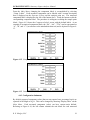
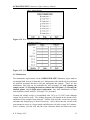
4.4.2 Labeling Submenus
Selecting “Sample Pts.” enables customized labeling of the sample points. Each sample
point can be labeled with a custom description (label) that is displayed on the Operator
Screen and the analysis print out. The sample point number is displayed to the left of the
editable label. Touch the button to edit the corresponding sample point label. Figures 49, 4-10, and 4-11 show the Sample Point Labels screen progressing from no sample
points labeled to eight sample points labeled. The default labels are “PT-1”, “PT-2”, ···,
“PT-8”. For example, select the sample point 1 label button (box) and the virtual
keyboard will appear (Figure 4-7), use “Clear” to remove the previous label, type in
“GREEN-LIQ” (or the label of your choice) and select “Enter” (Figure 4-10). Continue
labeling the remaining sample points in the same fashion (Figure 4-11) and touch the
“Update” button when finished. To return to the Main Menu, select “Back”.
R. E. Hodges, LLC
17
DURALYZER-NIR™ Laboratory Liquor Analyzer Manual
Figure 4-9. Blank Sample Point Labels screen.
Figure 4-10. Sample Point 1 labeled as “GREEN-LIQ”.
Figure 4-11. All sample points labeled.
R. E. Hodges, LLC
18
DURALYZER-NIR™ Laboratory Liquor Analyzer Manual
From the Main Menu, changing the component labels is accomplished by selecting
“Comp. Labels”. Each measured component can be labeled with a custom description
that is displayed on the Operator Screen and the analysis print out. The measured
component label is displayed to the left of the button (box). Touch the button to edit the
corresponding component label. The procedure is analogous to editing the sample point
labels. Figure 4-12 shows the Component Labels screen with the default labels. As an
example of customized component labels, the “EA”, “AA”, “TTA” can be represented as
“A”, “B”, and “C” (in reference to the standard titration test) and is depicted in Figure 413.
Figure 4-12. Component Labels screen with default values.
Figure 4-13. Customized EA, AA, and TTA labels.
4.4.3 Configuration Submenus
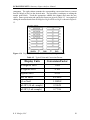
By default, measured component values (that are not reported on a percentage basis) are
reported in lb/100gal as Na2O. This can be changed by choosing “Display Units” on the
Main Menu. Each measured component (value) can have custom units defined.
Referring to Figure 4-14, the left column contains the unit labels for each measured
R. E. Hodges, LLC
19
DURALYZER-NIR™ Laboratory Liquor Analyzer Manual
component. The right column contains the corresponding conversion factor to convert
from lb/100gal as Na2O to the desired units. The procedure is analogous to editing the
sample point labels. Touch the appropriate editable box (button) and enter the new
values. Some typical units and conversion factors are given in Table 4-3. An example of
editing the measured units from lb/100gal as Na2O to lb/ft3 as Na2O is shown in Figure 415.
Figure 4-14. Display Units screen with default units (lb/100gal as Na2O).
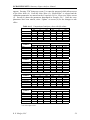
Table 4-3. Typical Units and Conversion Factors.
Display Units
Conversion Factor
lb/100gal as Na2O
1.000
lb/10gal as Na2O
0.100
lb/gal as Na2O
0.010
lb/ft3 as Na2O
0.074805
g/L as Na2O
1.198262
mL/HCl (10 mL sample)
0.38658
mL/HCl (5 mL sample)
0.77316
R. E. Hodges, LLC
20
DURALYZER-NIR™ Laboratory Liquor Analyzer Manual
Figure 4-15. Display units in lb/ft3 as Na2O.
Setting or adjusting the analyzer time and date that is displayed on the Operator Screen
and the analysis print out is performed by selecting “Time/Date”. The Time and Date
Adjustments screen would then appear (Figure 4-16); touch the appropriate box to edit.
Time (military, hh:mm) and date (dd/mm/yy) must be entered in the exact format shown
on the screen for the changes to take effect. For the changes to be accepted, both the time
and the date must be entered. For example, setting the time and date to 12:01 January 5,
2009 is shown in Figure 4-17. Press the “Update” button for the changes to take effect
and then the “Back” button to return to the Main Menu.
Figure 4-16. Time and Date Adjustments screen.
R. E. Hodges, LLC
21
DURALYZER-NIR™ Laboratory Liquor Analyzer Manual
Figure 4-17. Example of setting the time and date.
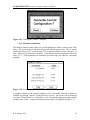
If the MODBUS communications interface is to be utilized, configure it by selecting
“MODBUS” on the Main Menu. This will pull up the MODBUS Configuration screen,
shown in Figure 4-18 with example settings. The settings on this screen are used to
configure the MODBUS TCP interface to the analyzer. Simply touch the box to be
edited and enter the new value using the virtual LCD keyboard. Entries must conform to
the format displayed above each box. A detailed description of this interface and how to
configure it is documented in the Appendix A.11 MODBUS.
Figure 4-18. MODBUS Configuration screen.
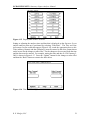
Adjusting the number of spectral scans to be averaged and the settling time for sample
analysis is accomplished by selecting “Scan Params” on the Main Menu. Custom scan
parameters can be specified for each sample point. Figure 4-19 shows the Scan
Parameters screen with the default values of “1” and “120” for each sample point. The
left column specifies the number of scans (spectra) to average for a sample analysis and
the right column specifies the settling time (in seconds) for the sample once it has been
drawn into the cuvette. Typically, for white and green liquor, 2 to 3 scans are averaged
and a settling time of 120 seconds is used. Black liquor samples may need 5 or more
R. E. Hodges, LLC
22
DURALYZER-NIR™ Laboratory Liquor Analyzer Manual
scans to be averaged and 180 to 300 seconds of settling time. The settling behavior and
nature of each liquor sample will dictate the optimal scan parameters used at a particular
mill. Figure 4-20 illustrates custom scan parameters applied to all eight sample points.
Figure 4-19. Scan Parameters screen with default values for each sample point.
Figure 4-20. Custom scan parameters applied to each sample point.
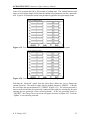
Selecting the “Password” option form the Main Menu allows the user to change the
current password. The analyzer ships with the default password “ADMIN”. Consider
the case where the current password is “TIGERS” (Figure 4-21). The current password is
shown on the left and the new password is entered on the right (by selecting the box and
entering the new password on the virtual keyboard). If the new password chosen is
“LIQTEST”, the Change Password screen will appear as shown in Figure 4-22. Press the
“Update” to save the new password.
R. E. Hodges, LLC
23
DURALYZER-NIR™ Laboratory Liquor Analyzer Manual
Figure 4-21. Change Password screen where the current password is “TIGERS”.
Figure 4-22. Password is changed to “LIQTEST”.
The “Display” option on the Main Menu allows the user to adjust the contrast and
backlighting of the LCD screen. Figure 4-23 shows the Contrast & Backlight Adjust
screen where the adjustments are made by manipulating the appropriate touch screen
sliders. To accept the changes, press “Save”, otherwise select “Cancel”.
R. E. Hodges, LLC
24
DURALYZER-NIR™ Laboratory Liquor Analyzer Manual
Figure 4-23. Contrast & Backlight Adjust screen.
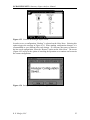
In order to save a configuration, “Backup” is selected on the Main Menu. Selecting this
option triggers the message in Figure 4-24. When making configuration changes, it is
recommended to save (backup) after each change. If it becomes necessary to return to
the last saved configuration, select the “Restore” option on the Main Menu. The screen
(Figure 4-25) will give the option of canceling the operation or to continue and overwrite
the current configuration.
Figure 4-24. Saving the current analyzer configuration.
R. E. Hodges, LLC
25
DURALYZER-NIR™ Laboratory Liquor Analyzer Manual
Figure 4-25. Utilizing the “Restore” function.
4.4.4 Informative Submenus
The analyzer internal sensor values are viewed through the “Status” option on the Main
Menu. The screen (Figure 4-26) shows the current internal sensor values. The 5V source
should read from 4.8 to 5.2 volts and the TEC set point should be between 1.48 and 1.51
volts. Detector bias should be less than 0.1 volts and the internal temperature should be
below 35 °C. If the parameters are within the specified range, the analyzer is operating
normally.
Figure 4-26. Analyzer Status screen.
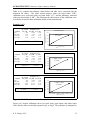
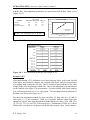
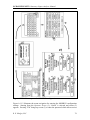
A graphical display of the spectral signature of the last sample analyzed (scanned) is
available by pressing “Spectra” on the Main Menu screen. The spectra can be displayed
in terms of Transmission % or Absorbance % by selecting the appropriate option on the
left side of the screen. A typical transmission water spectra is displayed in Figure 4-27.
R. E. Hodges, LLC
26
DURALYZER-NIR™ Laboratory Liquor Analyzer Manual
Figure 4-27. Typical transmission water spectrum.
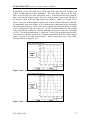
Replacement of the NIR light source (QTH light bulb with reflective coating) may
require a slight adjustment after installation. The “New Bulb” function on the Main
Menu will access the New Bulb Adjustment screen. After the bulb has been replaced,
draw water into the sample cuvette. Select the “Trigger Scan” option on the left side of
the screen to check if the new bulb saturates the detector. Figures 4-28 and 4-29 show a
water scan without saturation and a water scan in which the detector is saturated. An
unsaturated water scan (Figure 4-28) indicates the replacement bulb is positioned and
functioning correctly. If the water scan resembles the spectrum shown in Figure 4-29
(top portion of the two peaks are “cut off” meaning transmission has reached 100%), the
detector is saturated. Detector saturation occurs even if only one wavelength is 100%.
The desired transmission % is between 75 and 85 for the highest spectral peak. The
remedy for detector saturation is to slightly reposition the bulb (by rotation and/or
relative location in the light source holder). Details on removal and replacement of the
light source are discussed in Section 4.5 Maintenance and Appendix A.10 NIR Light
Source Replacement.
Figure 4-28. Unsaturated water spectrum.
R. E. Hodges, LLC
27
DURALYZER-NIR™ Laboratory Liquor Analyzer Manual
Figure 4-29. Saturated water spectrum.
Basic analyzer information such as the model number, serial number, and software
version is displayed by selecting “Analy. Info.” on the Main Menu screen. A sample
display is shown in Figure 4-30. The “Print Cfg.” option prints out a hard copy summary
of the analyzer configuration. Selecting this option will briefly cause a notification
screen (Figure 4-31) to appear.
Figure 4-30. Analyzer Info. screen.
R. E. Hodges, LLC
28
DURALYZER-NIR™ Laboratory Liquor Analyzer Manual
Figure 4-31. “Print Cfg.” notification screen.
4.4.5 Model Tuning Submenus
The DURALYZER-NIR™ laboratory liquor analyzer has seven standard calibration
(predictive) models for analyzing green, white, and black liquor samples. The calibration
models have been developed through a combination of signal processing steps and
mathematical regression techniques. In some cases, the models need to be tuned by
utilizing a calibration curve. The seven models are as follows: EA (REA for black
liquor), AA (RAA for black liquor), TTA, Na2SO4, %TDS, %TDD, and %TDO. Each
model will have a separate calibration curve and be represented by a second order
polynomial. The curve “tunes” (adjusts) the model in a least squares manner to agree
more precisely with lab tests (measurements). There are two methods for determining
calibration curves: manual and automated.
Calibration curve parameters can be computed (through the use of a spreadsheet) and
entered manually on the Component Curves, Slopes and Offsets screen (accessed by
selecting “Slope/Offset” on the Main Menu). The default values for the calibration
curves are shown in Figure 4-32. Each particular component calibration model has a box
for entering the “Curve”, “Slope”, and “Offset” parameters. Due to the water zero
function (sets the baseline), the offset will always be zero. Alternatively, the
“Calibration” function on the Main Menu can be used to bypass manual computation and
parameter entry. This is accomplished on the Calibrate Curve, Slope and Offset screen
(Figure 4-33). Values for determining calibration curves for EA, AA, TTA, and Na2SO4
must be in lbs/100gal as Na2O. At least two liquor samples and one water sample (3 total
samples) are required for calibration curve parameter determination. This is true for both
the manual and automated curve determination methods. In obtaining lab test values for
each sample, extra care should be taken to ensure the results are as accurate as possible.
The repeatability of some testing methods can be less than desirable in many instances.
If this is the case, it is recommended that more than three liquor samples are used and that
each one is tested multiple times. Procedures and details concerning calibration curves
are located in Appendices A.6 Manual Calibration Curve Determination and A.7
Automated Calibration Curve Determination.
R. E. Hodges, LLC
29
DURALYZER-NIR™ Laboratory Liquor Analyzer Manual
Figure 4-32. Component Curves, Slopes and Offsets screen with default values.
Figure 4-33. Calibrate Curve, Slope and Offset screen.
Every measured component for each sample point can have a scale and/or offset
correction to bias the analyzer to match the manual lab tests performed onsite. If
calibration curves have been generated and are in use, the bias corrections will be
minimal or nonexistent. Select “Set Bias” on the Main Menu and then from the Bias
Adjustments screen (Figure 4-34) select the desired sample point to bias and press “Edit”.
At the Edit Bias Values screen, enter the appropriate “Slope” and “Offset” biases and
press “Update” when finished. The component (value to be measured) is listed in the left
column with the corresponding slope and offset biases to the right. Default values for the
Edit Bias Values screen are displayed in Figure 4-35. Bias adjustments (slope and/or
offset) are made based on the current display units. An example of bias adjustment is
given in Appendix A.8 Bias Adjustment.
R. E. Hodges, LLC
30
DURALYZER-NIR™ Laboratory Liquor Analyzer Manual
Figure 4-34. Bias Adjustments screen with Sample Point 1 selected.
Figure 4-35. Edit Bias Values screen with default values.
4.5 Maintenance
The maintenance requirements for the DURALYZER-NIR™ laboratory liquor analyzer
are minimal both in terms of time and cost. Maintenance tasks should only be performed
by qualified personnel that have read and understand this manual. There are four
maintenance tasks that can be undertaken by mill personnel: (1) Acid cleaning the
sample cuvette, (2) Cleaning the analyzer cabinet and LCD panel, (3) Cleaning the
thermal printer, and (4) Light source replacement. Any other maintenance or repair
tasks should be carried out by R. E. Hodges, LLC personnel.
Cleaning the sample cuvette is accomplished with 1.0 N or 0.1 N HCl acid (although
vinegar can be used as well). The cleaning frequency will depend on the amount of use
and nature of the samples being analyzed. Initially acid clean the cuvette once per day
and adjust the frequency up or down if necessary. Acid is drawn into the cuvette in the
same manner as water or a liquor sample and allowed to sit in the cuvette for 2 minutes.
After 2 minutes, eject the acid into the waste collection bottle and flush with water.
R. E. Hodges, LLC
31
DURALYZER-NIR™ Laboratory Liquor Analyzer Manual
Make certain the waste bottle has been thoroughly washed with water before ejecting the
acid to avoid H2S generation. This procedure is summarized in Appendix A.5 Normal
Operating Procedure.
The analyzer cabinet and LCD panel should be cleaned monthly or whenever there is
noticeable dust, moisture, etc. present. Simply wipe the stainless steel cabinet with a
moist cloth or paper towel. A mild cleaner can be used as well. When cleaning the LCD
panel, disconnect it from the analyzer. Use a soft, dry cloth for the actual screen; the
LCD panel housing may be cleaned similar to the cabinet.
The presence of accumulated dust will adversely affect printer performance, possibly
causing the printout to be unreadable or not to function at all. Cleaning the printer is a
three part process: (1) Cleaning the thermal head, (2) Cleaning the paper holder, and (3)
Cleaning the paper housing. Care must be taken when cleaning the thermal head since it
is easy to damage. Use isopropyl alcohol and a soft, clean cloth. A soft cloth is
sufficient for removal of dust from the paper holder. The external housing of the printer
can be wiped off with a moist cloth.
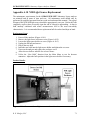
The typical lifespan of the QTH light source should be approximately one year. Before
the bulb completely expires, there are usually signs the end of the lifespan is approaching.
A drop in bulb intensity combined with erratic measurements will be the most
noteworthy characteristics. A good rule of thumb is to order a replacement QTH NIR
light source after 11 months of operation and install the new bulb after 12 months.
Figure 4-36. NIR light source enclosure.
R. E. Hodges, LLC
32
DURALYZER-NIR™ Laboratory Liquor Analyzer Manual
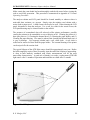
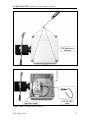
To replace the NIR light source, power off the analyzer and remove the light source
enclosure lid with a Phillips head screwdriver (Figure 4-36). Use an Allen wrench to
loosen the light source holder set screw, unplug and then remove the old bulb (Figure 437, WARNING: Bulb and light source holder will be extremely hot if the old bulb was
not completely burned out). Insert the new bulb into the holder, tighten the set screw,
power on the analyzer, and replace the cover. Allow the new bulb to stabilize for two
hours before using the analyzer. Utilize the “New Bulb” function on the Main Menu
screen to test for detector saturation (see Section 4.4.4 Informative Submenus) and adjust
the bulb position if necessary. For further details concerning light source replacement
refer to Appendix A.10 NIR Light Source Replacement.
Figure 4-37. NIR light source removal.
Certain other unscheduled maintenance tasks may occur over the operational lifetime of
the analyzer. These will be relatively simple and covered in Appendix A.12
Troubleshooting. Any significant maintenance or major analyzer component replacement
would have to be performed by R. E. Hodges, LLC. Any repair or maintenance
performed on the analyzer that has not been explicitly discussed in this manual will void
the warranty.
R. E. Hodges, LLC
33
DURALYZER-NIR™ Laboratory Liquor Analyzer Manual
Appendix
R. E. Hodges, LLC
34
DURALYZER-NIR™ Laboratory Liquor Analyzer Manual
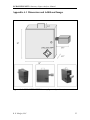
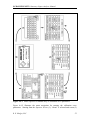
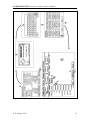
Appendix A.1 Dimensions and Additional Images
Figure A.1-1. DURALYZER-NIR™ laboratory liquor analyzer dimensions.
R. E. Hodges, LLC
35
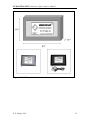
DURALYZER-NIR™ Laboratory Liquor Analyzer Manual
Figure A.1-2. LCD panel dimensions.
R. E. Hodges, LLC
36
DURALYZER-NIR™ Laboratory Liquor Analyzer Manual
Figure A.1-3. Printer dimensions.
R. E. Hodges, LLC
37
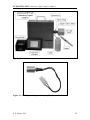
DURALYZER-NIR™ Laboratory Liquor Analyzer Manual
Figure A.1-4. System setup.
Figure A.1-5. NIR Quartz-Tungsten-Halogen (QTH) light source.
R. E. Hodges, LLC
38
DURALYZER-NIR™ Laboratory Liquor Analyzer Manual
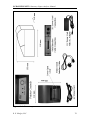
Figure A.1-6. Accessories and cables.
Figure A.1-7. Analyzer external connection ports.
R. E. Hodges, LLC
39
DURALYZER-NIR™ Laboratory Liquor Analyzer Manual
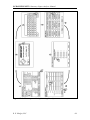
Figure A.1-8. Analyzer internal components.
Figure A.1-9. Sample cuvette and light source enclosure.
R. E. Hodges, LLC
40
DURALYZER-NIR™ Laboratory Liquor Analyzer Manual
Figure A.1-10. NIR light source enclosure.
Figure A.1-11. Analyzer side view.
R. E. Hodges, LLC
41
DURALYZER-NIR™ Laboratory Liquor Analyzer Manual
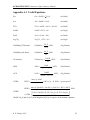
Appendix A.2 Nomenclature
AA
CE
DCS
EA
KCl
LCD
MODBUS
Na2CO3
Na2S
Na2S2O3
Na2SO3
Na2SO4
NaCl
NaOH
NEMA
NIR
QTH
RAA
RE
REA
REH
RTU
SCAN
SS
TAPPI
TCP
TDD
TDS
TDO
TEC
TTA
VAC
A
B
C
V
S0
S1
m
xb
xcc
xnz
xra
ρ
Active Alkali
Causticizing Efficiency
Digital Control System
Effective Alkali
Potassium Chloride
Liquid Crystal Display
Modicon Communications Bus
Sodium Carbonate
Sodium Sulfide
Sodium Thiosulfate
Sodium Sulfite
Sodium Sulfate
Sodium Chloride
Sodium Hydroxide
National Electrical Manufacturers Association
Near Infrared
Quartz Tungsten Halogen
Residual Active Alkali
Reduction Efficiency
Residual Effective Alkali
R. E. Hodges, LLC
Remote Terminal Unit
Scandinavian Pulp, Paper and Board Testing Committee
Stainless Steel
Technical Association of the Pulp and Paper Industry
Transmission Control Protocol
Total Dissolved Dead Load
Total Dissolved Solids
Total Dissolved Organics
Thermoelectric Cooler
Total Titratable Alkali
Volts Alternating Current
Second Order Calibration Curve Parameter
First Order Calibration Curve Parameter
Offset Calibration Curve Parameter
Volume of Sample
Bias Offset Parameter
Bias Slope Parameter
Mass of sample
Bias Adjusted Analyzer Value
Curve Corrected Analyzer Value
Analyzer Water Zeroed Value Prior to Curve Correction
Raw Analyzer Value Prior to Water Zero and Curve Correction
Density (m/V)
R. E. Hodges, LLC
42
DURALYZER-NIR™ Laboratory Liquor Analyzer Manual
Appendix A.3 Useful Equations
EA:
EA = NaOH + 12 Na 2 S
(as Na2O)
AA:
AA = NaOH + Na 2 S
(as Na2O)
TTA:
TTA = NaOH + Na 2 S + Na 2 CO3
(as Na2O)
NaOH:
NaOH = 2 EA − AA
(as Na2O)
Na2S:
Na 2 S = 2( AA − EA)
(as Na2O)
Na2CO3:
Na 2 CO3 = TTA − AA
(as Na2O)
%Sulfidity (TTA-basis):
% Sulfidity =
Na 2 S
⋅ 100%
TTA
(Na2O basis)
%Sulfidity (AA-basis):
% Sulfidity =
Na 2 S
⋅ 100%
AA
(Na2O basis)
%Causticity:
%Causticity =
%RE:
% RE =
Na 2 S
⋅ 100%
Na 2 S + Na 2 SO4
(Na2O basis)
%CE:
%CE =
NaOH
⋅ 100%
NaOH + Na 2 CO3
(Na2O basis)
%TDS:
NaOH
⋅ 100%
AA
(Na2O basis)
%TDS =
mass of solids
⋅ 100% = (ρ − 1) ⋅ 100%
mass of solution
%TDD =
mass of ( Na 2 SO4 + Na 2 SO3 + Na 2 S 2 O3 + KCl + NaCl )
⋅ 100%
mass of solution
%TDD:
(ρ is in g/cm3)
⎡ (1.291 * NaOH ) + (1.259 * Na 2 S ) + (1.710 * Na 2 CO3 )⎤
= %TDS − ⎢
⎥
ρ *1000 * 0.834
⎣
⎦
3
(NaOH, Na2S, and Na2CO3 in lb/100gal as Na2O, ρ is in g/cm in the bottom equation)
R. E. Hodges, LLC
43
DURALYZER-NIR™ Laboratory Liquor Analyzer Manual
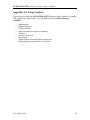
Appendix A.4 Setup Cautions
When using (or storing) the DURALYZER-NIR™ laboratory liquor analyzer, be sensible
with regard to the setup location. Care should be taken to avoid the following
conditions:
•
•
•
•
•
•
•
•
•
High humidity
High temperatures
Volatile materials
Areas susceptible to wetness or splashing
Vibration
Excessive dust levels
Open flames
Abrupt changes in humidity and/or temperature
Direct exposure to strong acids or acid vapors
R. E. Hodges, LLC
44
DURALYZER-NIR™ Laboratory Liquor Analyzer Manual
Appendix A.5 Normal Operating Procedure
Supplies Required:
1. 1.0 N or 0.1 N HCl acid for cleaning sample cuvette.
2. 250 mL (or larger) Nalgene® sample bottles.
3. Sample waste collection bottle (1.0 L Nalgene® sample bottle).
4. Container with room temperature potable water (for zeroing the analyzer
and flushing the sample cell).
Cleaning Procedure:
1. Acid wash the sample cuvette with 1.0 or 0.1 N HCl once per day (the
frequency of cleaning may be relaxed depending on scaling conditions and
the number of samples being analyzed each day). Draw in the acid and let
sit for approximately 2 minutes.
2. Eject the acid from the sample cuvette and flush with water. If samples
are not going to be analyzed immediately, draw water into the cuvette and
let remain until samples are to be tested. Otherwise, proceed with sample
testing procedure.
3. When ejecting acid into the waste collection bottle, make certain the
bottle has been thoroughly washed with water to avoid H2S
generation.
“Set Zero” Procedure:
1. Fill a sample bottle/container with water.
2. Fully compress the pipetting bulb and then insert the tubing into the water.
Draw the water into the cuvette by slowly releasing the bulb. Allow the
bulb to hang freely when uncompressed (fully expanded).
3. Select (touch) “Set Zero” on the Operator Screen. After a 2 minute count
down, the analyzer will scan (acquire spectrum) the water. The “Zero”
has now been set. (The baseline has been set and the internal spectrometer
optical alignment has been checked.)
4. Eject the water into the sample waste bottle by holding the bulb in an
upright position and compressing (squeezing) several times to eject all the
water. The tubing should be held or secured when doing this to avoid the
possibility of uncontrolled spray. Note: if samples are not to be analyzed
immediately, leave the water in the cuvette (i.e., do not eject the water
until ready to test samples). The “Zero” should be set at least once per day
and every time following an acid cleaning or after powering on the
analyzer.
Sample Testing Procedure:
1. Collect all samples to be tested from the field. Samples need to be large
enough to allow for at least a 200 mL viable sample after any settling or
filtering (see below).
R. E. Hodges, LLC
45
DURALYZER-NIR™ Laboratory Liquor Analyzer Manual
2. For slurry samples (such as the No. 1 causticizer) and raw green liquor
samples, allow ample settling time before transferring the settled (clear)
liquor to a new (clean) 250 mL sample bottle.
3. For black liquor samples containing chip and/or fiber debris, pour the
sample through a 100 mesh strainer into a new (clean) 250 mL sample
bottle. This will remove all of the debris that could possibly interfere with
the analysis.
4. Optional: Samples can be capped and placed in a water bath to bring them
closer to room temperature. Place the capped samples in a large container
(such as a pot). Put the large container in a sink and fill with tap water.
Keep the water running and allow the water to overflow from the
container for at least 2 minutes before removing the sample containers
from the water bath and proceed with testing. Cooling the samples can
stability and repeatability in the analysis results. As a general rule of
thumb, each sample point should consistently be tested in the same 10 °C
window for optimal results.
5. If the “Auto Zero” function is being used, uncheck the corresponding box
on the Operator Screen (to disable the function) until sample testing is
complete.
6. Select (touch) the circle next to corresponding sample point for testing on
the Operator Screen. (If water is still in the cuvette, eject into the sample
waste bottle by holding the bulb in an upright position and compressing
(squeezing) several times to eject all the water. The tubing should be held
or secured when doing this to avoid the possibility of uncontrolled spray.)
7. Fully compress the bulb and then place the sample pickup tube in the
sample bottle corresponding to the sample point selected in step 6.
8. With the tube in the sample bottle, slowly release the bulb until
completely expanded and then allow it to hang freely. Make certain that
the end of the sample pickup tube is not in contact with the bottom of the
bottle in a manner that will interfere with suction of the sample. For
slurry samples, the very bottom should be avoided if a detectable amount
of residual lime mud has settled. For black liquor samples, ensure the
pickup tube end is below the soap layer of liquor to minimize the amount
of soaps and extractives pulled into the cuvette.
9. Select “Analyze Sample” on the Operator Screen. The sample will be
analyzed after the delay time (default is 120 seconds). The delay is
necessary to ensure the sample has stabilized in the cuvette (an in some
cases will need to be increased beyond the default value of 120 seconds).
When the analysis is complete, the Operator Screen will update,
displaying the current results.
10. If the MODBUS communication interface is being used, select “Update
MODBUS” on the Operator Screen to send the analysis results to the
appropriate registers.
11. For a hard copy printout of the analysis results (via the thermal printer),
check the “Print Results” box.
R. E. Hodges, LLC
46
DURALYZER-NIR™ Laboratory Liquor Analyzer Manual
12. Place the pickup tubing in the sample waste collection bottle and eject the
liquor by holding the bulb in an upright position and compressing
(squeezing) several times to eject all the liquor. The tubing should be held
or secured when doing this to avoid the possibility of uncontrolled spray.
Thoroughly flush the sample cuvette with water and eject into the waste
bottle.
13. If analyzing (testing) more samples, repeat steps 6-12.
14. When the testing session is complete (all samples acquired from the field
have been analyzed), fill a clean container with water and draw it into the
sample cuvette. Allow the water to remain in the cuvette until the next
series of samples are to be tested.
R. E. Hodges, LLC
47
DURALYZER-NIR™ Laboratory Liquor Analyzer Manual
Appendix A.6 Manual Calibration Curve Determination
Background:
The DURALYZER-NIR™ laboratory liquor analyzer has seven standard calibration
(predictive) models for analyzing green, white, and black liquor samples. The calibration
models have been developed through a combination of signal processing steps and
mathematical regression techniques. Models are tuned by utilizing a calibration curve.
Employing a calibration curve allows the individual component (EA, AA, etc.) models to
be adjusted to match the lab test method (results) in a least squares sense. The seven
models are as follows:
1. EA (REA for black liquor)
2. AA (RAA for black liquor)
3. TTA
4. Na2SO4
5. % TDS
6. % TDD
7. % TDO
Certain measurements may not be required for a given application of the analyzer. In
which case, determining a calibration curve for that model would be unnecessary. For
example, if there is not an interest in Reduction Efficiency then there is not a need for a
sodium sulfate calibration curve. Likewise, %TDO (total dissolved organics) would only
have meaning for black liquor samples.
For manual determination, each calibration curve will be represented by the second order
polynomial given by Equation A.6-1.
x cc = Ax nz2 + Bx nz
(A.6-1)
Constant curve parameters, A and B, are determined by the manual calibration curve
procedure, xcc is the “curve corrected” measurement value, and xnz is the “water-zeroed”
analyzer value prior to any curve correction or bias adjustment. Both xcc and xnz must be
in lb/100gal as Na2O. The base units for the EA, AA, TTA, and Na2SO4 models are
lb/100gal. There is not a “C” term in Equation A.6-1 because that has already been
incorporated into xcc by setting the water zero. Each calibration model will have its own
set of A and B curve parameters.
Samples:
Follow the Normal Operating Procedure (Appendix A.5) for analyzing the samples. At a
minimum, two liquor samples and one water sample (3 total samples) are required for
calibration curve parameter determination. Due to setting the water zero, the analyzer
and lab measurement values for water will be “0.0” and “0.0”. If, the current lab testing
method in place produces less than desirable repeatability, more than two liquor samples
will be required. It is important to note that all samples need to be tested using the same
method and by the same person. This eliminates potential of conflicting biases being
R. E. Hodges, LLC
48
DURALYZER-NIR™ Laboratory Liquor Analyzer Manual
introduced into the lab values and ultimately will yield a less than optimal calibration
curve. Special care should be taken when performing the lab tests to ensure the highest
possible precision in the measurement values.
For example, past experience has shown that using an autotitrator for the white liquor
“ABC” test and manual titration for the green liquor “ABC” test is not a good idea. If
this is the standard treatment at a mill, run the green and white liquor tests for curve
parameter determination on the autotitrator. After the calibration curves are set and in
use, go back and run manual tests on the green liquor and make any adjustments by using
the “Set Bias” function on the LCD panel Main Menu. Details on setting biases can be
found in Section 4.4.5 and Appendix A.8.
For EA and AA, a white liquor and a green liquor sample is recommended to determine
the curve parameters. A weak wash sample and/or a black liquor sample can be used as
well. The important idea is to have samples that give values across a wide range and
between the upper and lower values (i.e., green liquor EA and AA falls between water
and white liquor). Black liquor with very low REA or high organic and soap content is
not ideal for curve parameter determination. In this case, any black liquor measurement
adjustments should be made through the “Set Bias” function. If there is only a white
liquor sample available, then a white liquor sample may be diluted to form a second
liquor sample. A one part white liquor to one part water dilution ratio would work fine
and yield an EA and AA value roughly half of the undiluted sample. The dilute sample
must still be tested to obtain a precise lab measurement value (do not assume it is exactly
half the undiluted value).
The TTA calibration curve can be determined from green liquor, weak wash, and white
liquor samples. Other combinations are possible as well, such as weak wash and white
liquor or white liquor and diluted white liquor (see above paragraph for comments on
dilution).
Reduction efficiency (RE%) computation requires the measurement of sodium sulfate.
Green liquor samples are used to determine the Na2SO4 curve parameters. Obtain a
single green liquor sample in an amount suitable to divide into three samples of equal
volume. Add approximately 5 g/L and 10 g/L of Na2SO4(s) to samples one and two
respectively. Do not add any to the third sample. Allow the sodium sulfate added to
samples one and two to completely dissolve (this will take more time the cooler the
sample is). Next, test all three samples using the standard laboratory test procedure for
sodium sulfate in green liquor.
Determination of the %TDS calibration curve parameters can be carried out using white,
green and black liquors. A convenient relationship for calculating %TDS in white and
green liquor is depicted in Equation A.6-2.
%TDS = (ρ − 1.000) ⋅ 100%
R. E. Hodges, LLC
(A.6-2)
49
DURALYZER-NIR™ Laboratory Liquor Analyzer Manual
The density (ρ) is in g/cm3 and can be measured by a handheld density meter or by a
gravimetric method. At room temperature, measure out a precise volume of sample (V)
in mL then determine the mass (m) in grams. The black liquor %TDS is usually
measured by a moisture analyzer or by oven drying.
Only green and white liquor samples are used to calculate the %TDD calibration curve.
Lab values for %TDD can be calculated from the following equation if the EA, AA,
TTA, ρ, and %TDS values are known.
⎡ (1.291 * NaOH ) + (1.259 * Na 2 S ) + (1.710 * Na 2 CO3 )⎤
%TDD = %TDS − ⎢
⎥
ρ *1000 * 0.834
⎣
⎦
(A.6-3)
Density (ρ) is in g/cm3, whereas NaOH, Na2S, and Na2CO3 are in lb/100gal as Na2O.
Determining the %TDO calibration curve requires black liquor samples with a known
%TDS. A precisely measured mass of black liquor is dried and burned in a furnace to
measure the total dissolved organics. The %TDO is computed by Equation A.6-4.
⎛ remaining mass of burned sample ⎞
⎟⎟ ⋅ 100
%TDO = %TDS − ⎜⎜
mass of wet sample
⎠
⎝
(A.6-4)
Procedure:
1. Make sure the analyzer has been powered on for a minimum of 2 hours (12+
hours recommended) to allow for the analyzer to reach thermal equilibrium and
stabilize. Confirm that “Curve”, “Slope”, and “Offset” on the Component Curves,
Slopes and Offsets screen are set to “0”, “1”, and “0” respectively for each
component model requiring a calibration curve. Do the same on the Edit Bias
Values screen, setting the “Slope” and “Offset” to “1” and “0” respectively (this
must be done for each sample point). Accessing these screens was detailed in
Section 4.4.5 Model Tuning Submenus. It is also helpful to set the display units to
lb/100gal for EA, AA, TTA, and Na2SO4 (refer to Section 4.4.3 Configuration
Submenus).
2. Collect all liquor samples that will be required for determining the calibration
curve parameters.
3. Perform the necessary laboratory tests on the collected samples. The tests will
yield the “LAB” values.
4. After lab testing is complete, set the water zero. Refer to Section 4.3 Normal
Operation and Appendix A.5 Normal Operating Procedure.
5. Test the collected samples on the DURALYZER-NIR™ laboratory liquor
analyzer following the procedures set forth in Section 4.3 and Appendix A.5.
After each sample has been analyzed, record the values shown in the “Analysis
Results” section of the Operator Screen. These will be the analyzer or “NIR”
values. It is highly recommended to have the “Print Results” box checked on the
Operator Screen and the printer connected prior to analyzing the samples.
R. E. Hodges, LLC
50
DURALYZER-NIR™ Laboratory Liquor Analyzer Manual
6. After all collected samples have been lab tested and analyzer tested, the
mathematical determination of the calibration curve parameters is performed.
This requires the use of spreadsheet software such as Microsoft® Excel.
7. On the spreadsheet, make three column headings for the sample, the analyzer
measurement value and the lab measurement value. If any of the measured values
are in units other than lb/100gal, make new columns with the values in lb/100gal.
The first sample will always be “water” and its corresponding analyzer and lab
values will always be “0.00” (due to setting the water zero). This is arrangement
is done for each component.
8. Construct a scatter plot with the analyzer values (lb/100gal) being the “X” data
and the lab values (lb/100gal) being the “Y” data. Fit the data with a 2nd order
polynomial trendline and set the intercept to zero. The resulting trendline
equation is the calibration curve in the form of Equation A.6-1. In some cases, it
may be preferable to fit the data with a linear trendline (and the “A” term in
Equation A.6-1 will be zero).
9. Repeat step 8 for all components requiring a calibration curve.
10. After determining the calibration curve equations (parameters), enter the
corresponding values into the Component Curves, Slopes and Offsets screen.
Referring to Equation A.6-1, “A” is the “Curve” value, “B” is the “Slope” value,
and “0.0” is the “Offset” value. When done, select “Update”. The calibration
curves are now set and will be in use the next time a sample is analyzed.
Two examples are presented to further highlight and explain the procedure and concepts
presented above.
Example A.6-1:
In the following example, the DURALYZER-NIR™ laboratory liquor analyzer is
operated in causticizing area of the mill. The following samples will be analyzed on a
regular basis: #1 causticizer, #3 causticizer, white liquor, weak wash, and green liquor.
Measurements of particular interest are EA, AA, TTA, %Sulfidity, %CE, and %TDS.
Calibration curves for EA, AA, TTA, and %TDS need to be determined and
implemented. Figure A.6-1 illustrates the calculation of the curve parameters based on
data provided in lb/100gal as Na2O. A 2nd order polynomial fit is utilized for the EA,
AA, and TTA, whereas a linear fit is applied to the %TDS data. The calibration curve
equations are clearly highlighted for each calibration model.
R. E. Hodges, LLC
51
DURALYZER-NIR™ Laboratory Liquor Analyzer Manual
lb/100gal as Na2O
EA_NIR
EA_LAB
0.00
0.00
67.36
71.11
69.02
73.50
69.61
74.14
15.98
17.03
23.57
24.21
EA Calibration Curve
100.00
2
LAB (lb/100gal as Na2O)
SAMPLE
Water
#1 Causticizer
#3 Causticizer
White Liquor
Weak Wash
Green Liquor
20.00
30.00
40.00
50.00
60.00
70.00
80.00
80.00
y = -7E-05x2 + 1.082x
2
R = 0.9999
60.00
40.00
20.00
0.00
0.00
20.00
40.00
60.00
80.00
NIR (lb/100gal as Na2O)
TTA Calibration Curve
120.00
2
100.00
y = 0.001x + 0.8487x
2
R = 0.9999
80.00
60.00
40.00
20.00
0.00
0.00
20.00
40.00
60.00
80.00
100.00
120.00
25.00
30.00
NIR (lb/100gal as Na2O)
%TDS Calibration Curve
30.00
25.00
LAB (%)
%
TDS_NIR TDS_LAB
0.00
0.00
20.48
17.98
19.89
17.24
19.51
16.94
N/A
N/A
22.94
20.39
10.00
100.00
2
x cc ,TTA = 0 .001 x nz
,TTA + 0 . 8487 x nz ,TTA
SAMPLE
Water
#1 Causticizer
#3 Causticizer
White Liquor
Weak Wash
Green Liquor
20.00
AA Calibration Curve
LAB (lb/100gal as Na2O)
lb/100gal as Na2O
TTA_NIR TTA_LAB
0.00
0.00
108.52
103.75
107.98
102.40
106.69
101.91
31.83
27.88
101.01
96.12
40.00
NIR (lb/100gal as Na2O)
2
x cc , AA = −0 .00007 x nz
, AA + 1 . 082 x nz , AA
SAMPLE
Water
#1 Causticizer
#3 Causticizer
White Liquor
Weak Wash
Green Liquor
60.00
0.00
LAB (lb/100gal as Na2O)
lb/100gal as Na2O
AA_NIR AA_LAB
0.00
0.00
79.70
85.09
80.40
87.07
80.94
87.24
19.18
20.47
32.73
35.56
y = 0.0005x + 1.0294x
2
R = 0.9999
0.00
2
x cc , EA = 0 .0005 x nz
, EA + 1 . 0294 x nz , EA
SAMPLE
Water
#1 Causticizer
#3 Causticizer
White Liquor
Weak Wash
Green Liquor
80.00
y = 0.8766x
2
R = 0.9995
20.00
15.00
10.00
5.00
2
xcc,%TDS = 0.000xnz
,%TDS + 0.8766xnz,%TDS
0.00
0.00
5.00
10.00
15.00
20.00
NIR (%)
Figure A.6-1. Calibration curves for Example A.6-1.
R. E. Hodges, LLC
52
DURALYZER-NIR™ Laboratory Liquor Analyzer Manual
Figure A.6-2. Menu sequence for manual entry of calibration curve parameters.
Figure A.6-2 illustrates the menu navigation for entering the calibration curve
parameters. Starting from the Operator Screen (1), “About” is selected and screen (2)
R. E. Hodges, LLC
53
DURALYZER-NIR™ Laboratory Liquor Analyzer Manual
appears. Pressing “TM” brings up screen (3) to enter the password which allows access
to the Main Menu (4). From the Main Menu (4), “Slope/Offset” is selected and the
calibration parameters are entered on the Component Curves, Slopes and Offsets screen
(5). Screen (6) shows the parameters determined in Example A.6-1. Once the curve
parameters have been entered, select “Update” on screen (6) for the changes to take
effect.
Table A.6-1. Comparison of analyzer values with lab values.
SAMPLE
Water
#1 Causticizer
#3 Causticizer
White Liquor
Weak Wash
Green Liquor
SAMPLE
Water
#1 Causticizer
#3 Causticizer
White Liquor
Weak Wash
Green Liquor
SAMPLE
Water
#1 Causticizer
#3 Causticizer
White Liquor
Weak Wash
Green Liquor
SAMPLE
Water
#1 Causticizer
#3 Causticizer
White Liquor
Weak Wash
Green Liquor
SAMPLE
Water
#1 Causticizer
#3 Causticizer
White Liquor
Weak Wash
Green Liquor
*
NIR
0.00
67.36
69.02
69.61
15.98
23.57
EA*
CC
0.00
71.61
73.43
74.08
16.58
24.54
NIR
0.00
108.52
107.98
106.69
31.83
101.01
TTA*
CC
0.00
103.88
103.30
101.93
28.03
95.93
NIR
0.00
55.02
57.64
58.28
12.78
14.41
NaOH*
CC
0.00
57.43
60.32
61.04
12.43
13.74
NIR
0.00
28.82
27.58
25.75
12.65
68.28
Na2CO3*
CC
0.00
18.09
16.76
14.81
7.30
60.59
LAB
0.00
71.11
73.50
74.14
17.03
24.21
NIR
0.00
79.70
80.40
80.94
19.18
32.73
AA*
CC
0.00
85.79
86.54
87.12
20.73
35.34
LAB
0.00
85.09
87.07
87.24
20.47
35.56
NIR
0.00
20.48
19.89
19.51
N/A
22.94
%TDS
CC
0.00
17.95
17.44
17.10
N/A
20.11
LAB
0.00
17.98
17.24
16.94
N/A
20.39
LAB
0.00
57.13
59.93
61.04
13.59
12.86
NIR
0.00
24.68
22.76
22.66
6.40
18.32
Na2S*
CC
0.00
28.36
26.22
26.08
8.30
21.60
LAB
0.00
27.96
27.14
26.20
6.88
22.70
LAB
0.00
18.66
15.33
14.67
7.41
60.56
%Sufidity (AA-basis)
NIR
CC
LAB
⎯
⎯
⎯
30.97
33.06
32.86
28.31
30.30
31.17
28.00
29.93
30.03
33.37
40.04
33.61
55.97
61.11
63.84
LAB
0.00
103.75
102.40
101.91
27.88
96.12
%Sufidity (TTA-basis)
NIR
CC
LAB
⎯
⎯
⎯
22.74
27.30
26.95
21.08
25.38
26.50
21.24
25.58
25.71
20.11
29.61
24.68
18.14
22.51
23.62
NIR
⎯
65.63
67.64
69.36
50.26
17.43
%CE
CC
⎯
76.05
78.25
80.47
63.00
18.49
LAB
⎯
75.38
79.63
80.62
64.71
17.52
Units in lb/100gal as Na2O
R. E. Hodges, LLC
54
DURALYZER-NIR™ Laboratory Liquor Analyzer Manual
Table A.6-1 compares the analyzer values before and after curve correction with the
measured lab values. The water zeroed analyzer values are listed under “NIR”,
calibration curve corrected values are listed under “CC”, and the laboratory measured
values are listed under “LAB”. This illustrates the effectiveness of the calibration curve
in its ability to tune the base calibration models to lab measurements.
Example A.6-2:
g/L as Na2O
EA_LAB
0.00
11.22
21.77
81.70
x cc , EA = − 0 .0053 x
lb/100gal as Na2O
EA_NIR
EA_LAB
0.000
0.00
7.216
9.36
12.631
18.17
59.733
68.18
2
nz , EA
+ 1 .4605 x nz , EA
EA Calibration Curve
80.00
LAB (lb/100gal as Na2O)
SAMPLE
Water
Weak Wash
Green Liquor
White Liquor
y = -0.0053x2 + 1.4605x
R2 = 0.9996
60.00
40.00
20.00
0.00
0.000
10.000
20.000
30.000
40.000
50.000
60.000
70.000
NIR (lb/100gal as Na2O)
g/L as Na2O
AA_LAB
0.00
12.81
35.24
95.30
lb/100gal as Na2O
AA_NIR AA_LAB
0.000
0.00
7.534
10.69
19.152
29.41
64.179
79.53
2
x cc , AA = −0.0059 x nz
, AA + 1 .6184 x nz , AA
AA Calibration Curve
100.00
LAB (lb/100gal as Na2O)
SAMPLE
Water
Weak Wash
Green Liquor
White Liquor
80.00
y = -0.0059x2 + 1.6184x
R2 = 0.9995
60.00
40.00
20.00
0.00
0.000 10.000 20.000 30.000 40.000 50.000 60.000 70.000 80.000
NIR (lb/100gal as Na2O)
lb/100gal as Na2O
g/L as Na2O
TTA_LAB TTA_NIR TTA_LAB
0.00
0.000
0.00
14.42
11.718
12.03
114.05
89.713
95.18
110.95
85.918
92.59
2
xcc ,TTA = 0.0002 x nz
,TTA + 1 .0485 x nz ,TTA
TTA Calibration Curve
120.00
LAB (lb/100gal as Na2O)
SAMPLE
Water
Weak Wash
Green Liquor
White Liquor
100.00
80.00
y = 0.0002x2 + 1.0485x
R2 = 0.9998
60.00
40.00
20.00
0.00
0.000
20.000
40.000
60.000
80.000
100.000
NIR (lb/100gal as Na2O)
Figure A.6-3. Calibration curves for Example A.6-2.
Figure A.6-3 depicts calibration curves for weak wash, green liquor, and white liquor
where the lab values are initially reported in g/L as Na2O. The procedure is analogous to
R. E. Hodges, LLC
55
DURALYZER-NIR™ Laboratory Liquor Analyzer Manual
the previous example except the lab values are converted from g/L as Na2O to lb/100gal
as Na2O. XY scatter plots are generated for EA, AA, and TTA where the “NIR” values
and “LAB” values in lb/100gal as Na2O are used for the “X” and “Y” values respectively.
Final Notes:
•
•
•
•
•
Since laboratory measurements can have a significant amount of variability (in
terms of repeatability), better calibration curves will be achieved by utilizing more
calibration samples.
Make sure the Normal Operating Procedure is followed when analyzing samples.
Sometimes a linear fit is better than a 2nd order polynomial.
In the absence of values that fall between the minimum and maximum, it is best to
use a linear fit.
Contact R. E. Hodges, LLC for any further assistance.
R. E. Hodges, LLC
56
DURALYZER-NIR™ Laboratory Liquor Analyzer Manual
Appendix A.7 Automated Calibration Curve Determination
Background:
The DURALYZER-NIR™ laboratory liquor analyzer has seven standard calibration
(predictive) models for analyzing green, white, and black liquor samples. The calibration
models have been developed through a combination of signal processing steps and
mathematical regression techniques. Models are tuned by utilizing a calibration curve.
Employing a calibration curve allows the individual component (EA, AA, etc.) models to
be adjusted to match the lab test method (results) in a least squares sense. The seven
models are as follows:
1. EA (REA for black liquor)
2. AA (RAA for black liquor)
3. TTA
4. Na2SO4
5. % TDS
6. % TDD
7. % TDO
Certain measurements may not be required for a given application of the analyzer. In
which case, determining a calibration curve for that model would be unnecessary. For
example, if there is not an interest in Reduction Efficiency then there is not a need for a
sodium sulfate calibration curve. Likewise, %TDO (total dissolved organics) would only
have meaning for black liquor samples.
For automated determination, each calibration curve will be represented by the second
order polynomial given by Equation A.7-1.
x cc = Ax ra2 + Bx ra + C
(A.7-1)
Constant curve parameters, A and B, are determined by the automated calibration curve
procedure, xcc is the “curve corrected” measurement value, and xra is the “raw” analyzer
value prior to water zeroing, curve correction and bias adjustment. Both xcc and xra must
be in lb/100gal as Na2O. The base units for the EA, AA, TTA, and Na2SO4 models are
lb/100gal. Water sets the zero value for each curve, which is the C parameter in Equation
A.7-1. Each calibration model will have its own set of A, B and C curve parameters.
Samples:
Follow the Normal Operating Procedure (Appendix A.5) relating to preparing and
drawing samples into the cuvette. At a minimum, two liquor samples and one water
sample (3 total samples) are required for calibration curve parameter determination. If,
the current lab testing method in place produces less than desirable repeatability, more
than two liquor samples will be required. It is important to note that all samples need to
be tested using the same method and by the same person. This eliminates potential of
conflicting biases being introduced into the lab values and ultimately will yield a less
R. E. Hodges, LLC
57
DURALYZER-NIR™ Laboratory Liquor Analyzer Manual
than optimal calibration curve. Special care should be taken when performing the lab
tests to ensure the highest possible precision in the measurement values.
For example, past experience has shown that using an autotitrator for the white liquor
“ABC” test and manual titration for the green liquor “ABC” test is not a good idea. If
this is the standard treatment at a mill, run the green and white liquor tests for curve
parameter determination on the autotitrator. After the calibration curves are set and in
use, go back and run manual tests on the green liquor and make any adjustments by using
the “Set Bias” function on the LCD panel Main Menu. Details on setting biases can be
found in Section 4.4.5 and Appendix A.8.
For EA and AA, a white liquor and a green liquor sample is recommended to determine
the curve parameters. A weak wash sample and/or a black liquor sample can be used as
well. The important idea is to have samples that give values across a wide range and
between the upper and lower values (i.e., green liquor EA and AA falls between water
and white liquor). Black liquor with very low REA or high organic and soap content is
not ideal for curve parameter determination. In this case, any black liquor measurement
adjustments should be made through the “Set Bias” function. If there is only a white
liquor sample available, then a white liquor sample may be diluted to form a second
liquor sample. A one part white liquor to one part water dilution ratio would work fine
and yield an EA and AA value roughly half of the undiluted sample. The dilute sample
must still be tested to obtain a precise lab measurement value (do not assume it is exactly
half the undiluted value).
The TTA calibration curve can be determined from green liquor, weak wash, and white
liquor samples. Other combinations are possible as well, such as weak wash and white
liquor or white liquor and diluted white liquor (see above paragraph for comments on
dilution).
Reduction efficiency (RE%) computation requires the measurement of sodium sulfate.
Green liquor samples are used to determine the Na2SO4 curve parameters. Obtain a
single green liquor sample in an amount suitable to divide into three samples of equal
volume. Add approximately 5 g/L and 10 g/L of Na2SO4(s) to samples one and two
respectively. Do not add any to the third sample. Allow the sodium sulfate added to
samples one and two to completely dissolve (this will take more time the cooler the
sample is). Next, test all three samples using the standard laboratory test procedure for
sodium sulfate in green liquor.
Determination of the %TDS calibration curve parameters can be carried out using white,
green and black liquors. A convenient relationship for calculating %TDS in white and
green liquor is depicted in Equation A.7-2.
%TDS = (ρ − 1.000) ⋅ 100%
(A.7-2)
The density (ρ) is in g/cm3 and can be measured by a handheld density meter or by a
gravimetric method. At room temperature, measure out a precise volume of sample (V)
R. E. Hodges, LLC
58
DURALYZER-NIR™ Laboratory Liquor Analyzer Manual
in mL then determine the mass (m) in grams. The black liquor %TDS is usually
measured by a moisture analyzer or by oven drying.
Only green and white liquor samples are used to calculate the %TDD calibration curve.
Lab values for %TDD can be calculated from the following equation if the EA, AA,
TTA, ρ, and %TDS values are known.
⎡ (1.291 * NaOH ) + (1.259 * Na 2 S ) + (1.710 * Na 2 CO3 )⎤
%TDD = %TDS − ⎢
⎥
ρ *1000 * 0.834
⎣
⎦
(A.7-3)
Density (ρ) is in g/cm3, whereas NaOH, Na2S, and Na2CO3 are in lb/100gal as Na2O.
Determining the %TDO calibration curve requires black liquor samples with a known
%TDS. A precisely measured mass of black liquor is dried and burned in a furnace to
measure the total dissolved organics. The %TDO is computed by Equation A.7-4.
⎛ remaining mass of burned sample ⎞
⎟⎟ ⋅ 100
%TDO = %TDS − ⎜⎜
mass of wet sample
⎠
⎝
(A.7-4)
Procedure:
1. Make sure the analyzer has been powered on for a minimum of 2 hours (12+
hours recommended) to allow for the analyzer to reach thermal equilibrium and
stabilize.
2. Collect all liquor samples that will be required for determining the calibration
curve parameters.
3. Perform the necessary laboratory tests on the collected samples. The tests will
yield the “LAB” values.
4. After lab testing is complete, access the Main Menu and select “Calibrate” to open
the Calibrate Curve, Slope and Offset screen. Once the calibration procedure has
been started, do not exit the Calibrate Curve, Slope and Offset screen until the
procedure is completed. Otherwise, sample spectral data and component values
will be lost.
5. Test the collected samples on the DURALYZER-NIR™ laboratory liquor
analyzer following basically the same procedures set forth in Section 4.3 and
Appendix A.5. Start with the water sample (make sure “Water” is selected on the
top section of the screen). With water in the sample cuvette, press the “Scan”
button. The current “Curve”, “Slope”, and “Offset” values for each component
curve will be displayed. For the water sample, zeros are preloaded for each
component. Do not change these values.
6. Eject the water sample and move to the next calibration sample by selecting
“Sample 1” at the top of the screen.
7. Draw the sample into the cuvette (as outlined in the Normal Operating
Procedure). Press the “Scan” button to analyze the sample. As with the water,
the analyzer values will be displayed under the “Scan” button. Do not be
R. E. Hodges, LLC
59
DURALYZER-NIR™ Laboratory Liquor Analyzer Manual
concerned if the analyzer values look odd (possibly negative numbers). The
calibration procedure will take care of positioning the calibration curve and
adjusting its shape.
8. Enter the available lab measured values for sample 1 by pressing the
corresponding button to the immediate right of the component. If a value is not
available for a particular component, “NA” must be entered. Entered
concentration values must be in units of lb/100gal as Na2O. These are the base
units for the EA, AA, TTA, and Na2SO4 calibration models. Conversion factors
are provided on the “Help” screen for some commonly used units.
9. Repeat steps 6 – 8 until all of the calibration samples have been processed.
10. Entered lab test values can be reviewed for any sample by by pressing the
corresponding button. Samples can also be rescanned if needed by selecting the
corresponding sample button (at the top of the screen) , drawing the sample into
the cuvette, and then pressing “Scan”.
11. After all collected samples have been processed, select “Calibrate” at the bottom
of the screen. New “Curve” “Slope” and “Offset” values will be calculated and
displayed along with the correlation coefficient. Additionally, a hard copy
summarizing the calibration data and results will be printed out (provided the
printer is connected and powered on).
12. Review the results. If necessary, make changes such as rescanning a sample or
changing entered values. Press the “Calibrate” button again to generate updated
calibration curves if any changes were made.
13. Once the calibration curve procedure is complete, press the “Back” button to
return to the Main Menu screen. The calibration curve parameters can be
accessed and viewed by selecting “Slope/Offset” from the Main Menu.
Figure A.7-1 illustrates the menu navigation for automated calibration curve
determination. Starting from the Operator Screen (1), “About” is selected and screen (2)
appears. Pressing “TM” brings up screen (3) to enter the password which allows access
to the Main Menu, screen (4). From the Main Menu (4), “Calibrate” is selected and the
calibration parameters are calculated using the Calibrate Curve, Slope and Offset screen
(5). The current sample is selected at (A) and then scanned (B). After the NIR spectrum
has been acquired, the lab measured values are entered (C). Once all of the collected
samples have been processed, “Calibrate” is pressed (D).
Understanding of the inner workings of the automated calibration curve determination
can be reinforced by examining the examples in Appendix A.6 Manual Calibration Curve
Determination. This basically illustrates the calculations that occur “behind the scenes”
in the automated procedure. The examples also highlight the improvements made after
calibration curves are implemented.
R. E. Hodges, LLC
60
DURALYZER-NIR™ Laboratory Liquor Analyzer Manual
Figure A.7-1. Menu sequence for automated calibration curve determination.
R. E. Hodges, LLC
61
DURALYZER-NIR™ Laboratory Liquor Analyzer Manual
Final Notes:
•
•
•
•
•
•
Since laboratory measurements can have a significant amount of variability (in
terms of repeatability), better calibration curves will be achieved by utilizing more
calibration samples.
Make sure the Normal Operating Procedure for preparing and drawing samples
into the cuvette.
In the absence of values for a particular component, remember to enter “NA”.
Once the calibration procedure has been started, do not exit the Calibrate Curve,
Slope and Offset screen until the procedure is completed.
Entered concentration values must be in units of lb/100gal as Na2O. These are
the base units for the EA, AA, TTA, and Na2SO4 calibration models.
Contact R. E. Hodges, LLC for any further assistance.
R. E. Hodges, LLC
62
DURALYZER-NIR™ Laboratory Liquor Analyzer Manual
Appendix A.8 Bias Adjustment
Background:
Another method for tuning of the DURALYZER-NIR™ laboratory liquor analyzer
measurements is implementing bias adjustments. Bias adjustments can be used in
conjunction with calibration curves or as a standalone tuning method. Every measured
component for each sample point can have a scale and/or offset correction to bias the
analyzer in order to match the manual lab tests performed onsite. If calibration curves
have been generated and are in use, the bias corrections will usually be minimal or
nonexistent. Bias adjustment is represented by the following equation
xb = S1 xcc + S 0
(A.8-1)
where xb is the bias corrected (adjusted) value, xcc is the calibration curve corrected value,
S1 is the bias slope, and S0 is the bias offset (S1 and S0 are the bias adjustment
parameters). Both xb and xcc are in the current display units (unlike calibration curves,
which must be determined based on lb/100gal). Bias adjustments can be applied in three
ways: (1) slope and offset, (2) slope only (S0 = 0), and (3) offset only (S1 = 0). The data
will dictate the best choice. Two examples are presented to highlight the bias adjustment
procedure.
Samples:
Follow the Normal Operating Procedure (Appendix A.5) for analyzing the samples. At a
minimum, three liquor samples are required to determine the bias adjustment for a
particular sample point. Water is not used when determining bias adjustments. If, the
current lab testing method in place produces less than desirable repeatability, more than
three liquor samples will be required. It is important to note that all samples need to be
tested using the same method and by the same person. This eliminates potential of
conflicting biases being introduced into the lab values. Special care should be taken
when performing the lab tests to ensure the highest possible precision in the measurement
values.
Procedure:
1. Make sure the analyzer has been powered on for a minimum of 2 hours (12+
hours recommended) to allow for the analyzer to reach thermal equilibrium and
stabilize. If calibration curves are to be used, perform that procedure before
attempting any bias adjustment. Set the desired analyzer display units and make
sure the current bias values are set to the default values (slope = 1 and offset = 0).
See Sections 4.4.3 and 4.4.4 respectively.
2. Collect all liquor samples that will be required for determining the bias
adjustment for a particular sample point.
3. Perform the necessary laboratory tests on the collected samples. The tests will
yield the “LAB” values.
R. E. Hodges, LLC
63
DURALYZER-NIR™ Laboratory Liquor Analyzer Manual
4. After lab testing is complete, set the water zero if this has not been performed
recently. Refer to Section 4.3 Normal Operation and Appendix A.5 Normal
Operating Procedure.
5. Test the collected samples on the DURALYZER-NIR™ laboratory liquor
analyzer following the procedures set forth in Section 4.3 and Appendix A.5.
After each sample has been analyzed, record the values shown in the “Analysis
Results” section of the Operator Screen. These will be the analyzer or “NIR”
values. It is highly recommended to have the “Print Results” box checked on the
Operator Screen and the printer connected prior to analyzing the samples.
6. After all collected samples have been lab tested and analyzer tested, the
mathematical determination of the bias adjustment parameters is performed. This
requires the use of spreadsheet software such as Microsoft® Excel.
7. On the spreadsheet, make three column headings for the sample, the analyzer
measurement value and the lab measurement value.
8. Construct a scatter plot with the analyzer values being the “X” data and the lab
values being the “Y” data. Fit the data with a linear trendline. The resulting
trendline equation is the bias adjustment in the form of Equation A.8-1. In some
cases, it may be preferable to bias adjust the data with just a slope correction (S0
in Equation A.8-1 will be zero) or just an offset correction (S1 in Equation A.8-1
will be zero).
9. Select “Set Bias” on the Main Menu. From the Bias Adjustments screen select the
desired sample point to bias and press “Edit”. At the Edit Bias Values screen,
enter the appropriate “Slope” and “Offset” biases and press “Update” when
finished. The component (value to be measured) is listed in the left column with
the corresponding slope and offset biases to the right. Once “Update” has been
pressed, the effects are immediate (meaning the display results on the LCD panel
will be updated to reflect the new bias adjustment).
10. Repeat steps 2 – 9 for all sample points requiring a bias adjustment.
Two examples are presented to further highlight and explain the procedure and concepts
presented above.
Example A.8-1:
In the following example, the black REA analyzer values need to be slightly tuned
(biased) to agree with the laboratory measurements. A calibration curve is already in
place and was determined based on white, green, and black liquor. The white and green
liquor analyzer values are in agreement with the lab. However, low REA black liquor
samples (containing an appreciable amount of soap) are slightly off from the lab and need
fine tuning. Figure A.8-1 illustrates the determination of bias adjustment parameters for
this case. Three black liquor samples (evaporator, chemiwasher, and secondary
evaporator) are on the same analyzer sample point. Thus, these samples are used to
determine the bias adjustment for REA. All values are in g/L as Na2O, with the analyzer
values under the heading “REA_NIR”, lab values under “REA_LAB”, and the bias
corrected values under “REA_B”. The resulting bias adjustment equation is displayed
R. E. Hodges, LLC
64
DURALYZER-NIR™ Laboratory Liquor Analyzer Manual
with the data. Bias adjustment parameters are entered into the Edit Bias Values screen
(Figure A.8-2).
REA_NIR
3.14
2.34
2.58
g/L as Na2O
REA_LAB
4.03
3.04
3.41
REA_B
4.04
3.07
3.37
xb , REA = 1 .2154 xcc , REA + 0 .2271
REA Bias Adjustment
5.00
LAB (g/L as Na2O)
SAMPLE
Evaporator
Chemiwasher
Secondary Evaporator
4.00
3.00
y = 1.2154x + 0.2271
R2 = 0.9937
2.00
1.00
1.00
2.00
3.00
4.00
5.00
NIR (g/L as Na2O)
Figure A.8-1. Bias adjustment determination for Example A.8-1.
Figure A.8-2. Bias adjustment parameters for Example A.8-1.
Example A.8-2:
After implementing a TTA calibration curve based on green liquor, weak wash, clarified
white liquor, and causticizer samples, the clarified white liquor analyzer measurements
were slightly high compared to the lab. The TTA analyzer measurements for the other
sample points were in agreement with the lab. Thus a bias adjustment was implemented
on the clarified white liquor TTA measurement. Six total clarified white liquor samples
were collected and tested over a 3 to 4 day period. The bias adjustment determination for
this data set is illustrated in Figure A.8-3.
The three bias adjustment methods (1) slope and offset, (2) slope only (S0 = 0), and (3)
offset only (S1 = 0) are considered. Table A.8-1 compares analyzer values before bias
adjustment with the three bias adjustment methods and the lab values (TTA_NIR, TTA
(1), TTA (2), TTA (3), and TTA_LAB respectively). Examination of Table A.8-1 shows
all three bias corrections are in agreement with the lab measured values. In this instance,
R. E. Hodges, LLC
65
DURALYZER-NIR™ Laboratory Liquor Analyzer Manual
all three would be an acceptable choice. Other cases may point favorably to a particular
method.
TTA Bias Adjustment
8
LAB (lb/ft3 as Na2O)
SAMPLE
White Liquor 1
White Liquor 2
White Liquor 3
White Liquor 4
White Liquor 5
White Liquor 6
lb/ft3 as Na2O
TTA_NIR TTA_LAB
7.71
7.63
7.72
7.62
7.79
7.69
7.86
7.75
7.73
7.64
7.85
7.75
xb ,TTA = 0.8821x cc ,TTA + 0.8203
SAMPLE
White Liquor 1
White Liquor 2
White Liquor 3
White Liquor 4
White Liquor 5
White Liquor 6
SAMPLE
White Liquor 1
White Liquor 2
White Liquor 3
White Liquor 4
White Liquor 5
White Liquor 6
7.6
7.5
7.6
7.7
7.8
7.9
8
7.9
8
Slope and Offset
lb/ft3 as Na2O
TTA_NIR TTA_LAB
7.71
7.63
7.72
7.62
7.79
7.69
7.86
7.75
7.73
7.64
7.85
7.75
TTA Bias Adjustment
8
y = 0.9876x
2
R = 0.9732
7.9
7.8
7.7
7.6
7.5
7.5
7.6
7.7
7.8
NIR (lb/ft3 as Na2O)
Slope Only
lb/ft3 as Na2O
TTA_NIR TTA_LAB
7.71
7.63
7.72
7.62
7.79
7.69
7.86
7.75
7.73
7.64
7.85
7.75
xb ,TTA = x cc ,TTA − 0.0967
(3)
7.7
NIR (lb/ft3 as Na2O)
xb ,TTA = 0.9876 x cc ,TTA
(2)
7.8
7.5
LAB (lb/ft3 as Na2O)
(1)
y = 0.8821x + 0.8203
2
R = 0.9873
7.9
lb/ft3 as Na2O
∆TTA (LAB-NIR)
-0.08
-0.10
-0.10
-0.11
-0.09
-0.10
Avg. ∆
-0.0967
Offset Only
Figure A.8-3. Bias adjustment determination for Example A.8-2.
R. E. Hodges, LLC
66
DURALYZER-NIR™ Laboratory Liquor Analyzer Manual
Table A.8-1. Bias adjustment method comparison for Example A.8-2.
lb/ft3 as Na2O
SAMPLE
TTA_NIR TTA (1)
TTA (2)
TTA (3) TTA_LAB
White Liquor 1
7.71
7.62
7.61
7.61
7.63
White Liquor 2
7.72
7.63
7.62
7.62
7.62
White Liquor 3
7.79
7.69
7.69
7.69
7.69
White Liquor 4
7.86
7.75
7.76
7.76
7.75
White Liquor 5
7.73
7.64
7.63
7.63
7.64
White Liquor 6
7.85
7.74
7.75
7.75
7.75
Figure A.8-4 illustrates the menu navigation for entering the bias adjustment parameters.
Starting from the Operator Screen (1), “About” is selected and screen (2) appears.
Pressing “TM” brings up screen (3) to enter the password which allows access to the
Main Menu (4). From the Main Menu (4), “Set Bias” is selected and the sample point (to
be biased) is chosen on the Bias Adjustments screen (5). The bias adjustment parameters
are entered at point (A) on the Edit Bias Values screen (6). Once the bias parameters
have been entered, press “Update” (B) for the changes to take effect.
Final Notes:
•
•
•
•
•
•
Since laboratory measurements can have a significant amount of variability (in
terms of repeatability), optimal bias adjustments will be achieved by utilizing
more samples.
Make sure the Normal Operating Procedure is followed when analyzing samples.
Sometimes only a slope or offset correction is required.
In the absence of values that fall over a wide range, it may be safer to employ
only a slope or offset.
In most cases, bias adjustment will not be needed if calibration curves are in
place.
Contact R. E. Hodges, LLC for any further assistance.
R. E. Hodges, LLC
67
DURALYZER-NIR™ Laboratory Liquor Analyzer Manual
Figure A.8-4. Menu sequence for implementing bias adjustments.
R. E. Hodges, LLC
68
DURALYZER-NIR™ Laboratory Liquor Analyzer Manual
Appendix A.9 Printer Details
The DURALYZER-NIR™ laboratory liquor analyzer includes a Star Micronics TSP600
Series Thermal Printer. Connection to the analyzer is accomplished via the RS232 port.
The printer is equipped with its own power unit and power cord which connects to any
standard 3 prong outlet. Further details not described in this appendix can be found on
the Star Micronics webpage.
Connecting:
The printer connections should be made in the following order before engaging the power
switch (located on the lower left side): (1) connect to the analyzer via the RS232 port, (2)
plug the DC end of the power cord into the printer, and (3) plug the 3 prong AC end into
a standard wall outlet. Cables and other images of the printer are shown in Figure A.9-1.
Paper Roll Installation:
The thermal paper roll must have a width of 80 mm, thickness of 65 to 85 µm, and a roll
diameter of 90 mm (or less).
1. Open the printer cover by pushing the lever on the top front of the printer
(highlighted in Figure A.9-1).
2. Place the paper roll in and pull the leading edge of the paper towards the front of
the printer (paper direction should be such that the leading edge is coming from
under the roll, not over top).
3. Close the printer cover by pressing down on both sides.
Cleaning and Care:
The presence of accumulated dust will adversely affect printer performance, possibly
causing the printout to be unreadable or not to function at all. Cleaning the printer is a
three part process: (1) Cleaning the thermal head, (2) Cleaning the paper holder, and (3)
Cleaning the paper housing. Care must be taken when cleaning the thermal head since it
is easy to damage. Use isopropyl alcohol and a soft, clean cloth. A soft cloth is
sufficient for removal of dust from the paper holder. The external housing of the printer
can be wiped off with a moist cloth.
Specifications:
•
•
•
•
•
•
•
Dimensions: 199 mm × 142 mm × 132 mm (see Figure A.9-1)
Weight: 1.4 kg
Paper width: 80 mm
Maximum print speed: 100 mm/s (800 dots/s)
Dot density: 8 dots/mm (203 dpi)
Input Voltage: 24 Volts DC
Power Unit Input Voltage: 100 to 240 Volts (50 to 60 Hz)
R. E. Hodges, LLC
69
DURALYZER-NIR™ Laboratory Liquor Analyzer Manual
Figure A.9-1. Printer images.
R. E. Hodges, LLC
70
DURALYZER-NIR™ Laboratory Liquor Analyzer Manual
Appendix A.10 NIR Light Source Replacement
The maintenance requirements for the DURALYZER-NIR™ laboratory liquor analyzer
are minimal both in terms of time and cost. All maintenance tasks should only be
performed by qualified personnel that have read and understand this manual. The typical
lifespan of the QTH NIR light source should be approximately one year. Before the bulb
completely expires, there are usually signs the end of lifespan is approaching. A drop in
bulb intensity combined with erratic measurements will be the most noteworthy
characteristics. It is recommended that a replacement bulb be ordered and kept on hand.
Replacement Steps:
1.
2.
3.
4.
5.
6.
7.
8.
9.
Power off the analyzer (Figure A.10-1)
Remove the light source enclosure cover (Figure A.10-2)
Loosen the light source holder set screw (Figure A.10-3)
Unplug the old bulb and remove
Plug in the new bulb
Insert the new bulb into the light source holder and tighten the set screw
Power on the analyzer and replace the enclosure cover
Allow the new bulb to stabilize for at least 2 hours
Utilize the “New Bulb” function from the Main Menu to test for detector
saturation. Adjust the bulb position in the light source holder if necessary.
Further Details:
Figure A.10-1. Power switch and light source enclosure locations.
R. E. Hodges, LLC
71
DURALYZER-NIR™ Laboratory Liquor Analyzer Manual
Figure A.10-2. Light source enclosure cover removal.
Figure A.10-3. NIR light source removal.
R. E. Hodges, LLC
72
DURALYZER-NIR™ Laboratory Liquor Analyzer Manual
Replacement of the NIR light source (QTH light bulb with reflective coating) may
require a slight adjustment after installation. The “New Bulb” function on the Main
Menu will access the New Bulb Adjustment screen. After the bulb has been replaced,
draw water into the sample cuvette. Select the “Trigger Scan” option on the left side of
the screen to check if the new bulb saturates the detector. Figures A.10-4 and A.10-5
show a water scan without saturation and a water scan in which the detector is saturated.
An unsaturated water scan (Figure A.10-4) indicates the replacement bulb is positioned
and functioning correctly. If the water scan resembles the spectrum shown in Figure
A.10-5 (top portion of the two peaks are “cut off” meaning transmission has reached
100%), the detector is saturated. Detector saturation occurs even if only one wavelength
is 100%. The desired transmission % is between 75 and 85 for the highest spectral peak.
The remedy for detector saturation is to slightly reposition the bulb (by rotation and/or
relative location in the light source holder). Menu sequencing for the “New Bulb”
function is shown in Figure A.10-6.
Figure A.10-4. Unsaturated water spectrum.
Figure A.10-5. Saturated water spectrum.
R. E. Hodges, LLC
73
DURALYZER-NIR™ Laboratory Liquor Analyzer Manual
Figure A.10-6. Menu sequence for the “New Bulb” function.
R. E. Hodges, LLC
74
DURALYZER-NIR™ Laboratory Liquor Analyzer Manual
Appendix A.11 MODBUS
The DURALYZER-NIR™ laboratory liquor analyzer is equipped with MODBUS
communications ability. It is configured by selecting “MODBUS” on the Main Menu.
This will pull up the MODBUS Configuration screen, shown in Figure A.11-1 with
example settings. The settings on this screen are used to configure the MODBUS TCP
interface to the analyzer. Simply touch the box to be edited and enter the new value
using the virtual LCD keyboard. Entries must conform to the format displayed above
each box. Figure A.11-2 illustrates the LCD menu sequencing for configuring the
MODBUS and Table A.11-1 lists the MODBUS register addresses.
Figure A.11-1. MODBUS Configuration screen.
•
•
•
•
•
•
“IP Address”:
refers to the IP address assigned to the analyzer (Class C
address,32 bit)
“Net Mask”:
mask for the IP address (255.255.255.000)
“Gateway”:
IP address assigned to device with which analyzer is
communicating (without the presence of a router, this will
usually be 000.000.000.000)
“Slave ID”:
the analyzer will always be the “slave” or “server” and can
have an ID ranging from 001 to 247 (as defined by
MODBUS specifications)
“Integer Encoding”: will be 16 unless the DCS interprets the higher order bit as a
sign bit, in which case it will be 15
“Register Offset”:
will be 0 if register 1 is address 0 for the MODBUS driver
used by the DCS, otherwise this will be 1 or -1 (some devices
refer to address instead of register number)
R. E. Hodges, LLC
75
DURALYZER-NIR™ Laboratory Liquor Analyzer Manual
Figure A.11-2. Menu sequence for MODBUS configuration.
Figure A.11-2 illustrates the menu navigation for entering the MODBUS configuration
settings. Starting from the Operator Screen (1), “About” is selected and screen (2)
appears. Pressing “TM” brings up screen (3) to enter the password which allows access
R. E. Hodges, LLC
76
DURALYZER-NIR™ Laboratory Liquor Analyzer Manual
to the Main Menu (4). From the Main Menu (4), “MODBUS” is selected and the
MODBUS settings are entered on the MODBUS Configuration screen (5). Screen (5) is
divided into steps A through G. Once the settings have been entered (A – F), select
“Update” (G) for the changes to take effect.
Table A.11-1. MODBUS Register Addresses.
Cl- Word
Sample Temperature Word
Reserved Word
Reserved Word
Reserved Word
Reserved Word
Cl- Word
Sample Temperature Word
Reserved Word
Reserved Word
Reserved Word
Reserved Word
EA/REA Word
AA/RAA Word
TTA Word
TDS Word
TDD Word
TDO Word
Na2SO4 Word
Na2SO3 Word
Na2S2O3 Word
Cl- Word
Sample Temperature Word
Reserved Word
Reserved Word
Reserved Word
Reserved Word
Description
EA/REA Word
AA/RAA Word
TTA Word
TDS Word
TDD Word
TDO Word
Na2SO4 Word
Na2SO3 Word
Na2S2O3 Word
Cl- Word
Sample Temperature Word
Reserved Word
Reserved Word
Reserved Word
Reserved Word
EA/REA Word
AA/RAA Word
TTA Word
TDS Word
TDD Word
TDO Word
Na2SO4 Word
Na2SO3 Word
Na2S2O3 Word
Cl- Word
Sample Temperature Word
Reserved Word
Reserved Word
Reserved Word
Reserved Word
Alarm Bit Field (Bits 15-0)
Alarm Bit Field (Bits 31-16)
Status Bit Field (Bits 15-0)
Status Bit Field (Bits 31-16)
Status Bit Field (Bits 47-32)
Status Bit Field (Bits 63-48)
DCS Control Bit Field (Bits 15-0)
LCD Control Bit Field (Bits 15-0)
Sample Point 7
Register
40090
40091
40092
40093
40094
40095
40096
40097
40098
40099
40100
40101
40102
40103
40104
40105
40106
40107
40108
40109
40110
40111
40112
40113
40114
40115
40116
40117
40118
40119
40120
40121
40122
40123
40124
40125
40126
40127
Sample Point 8
Cl- Word
Sample Temperature Word
Reserved Word
Reserved Word
Reserved Word
Reserved Word
EA/REA Word
AA/RAA Word
TTA Word
TDS Word
TDD Word
TDO Word
Na2SO4 Word
Na2SO3 Word
Na2S2O3 Word
Sample Point 4
Description
EA/REA Word
AA/RAA Word
TTA Word
TDS Word
TDD Word
TDO Word
Na2SO4 Word
Na2SO3 Word
Na2S2O3 Word
Sample Point 5
Register
40045
40046
40047
40048
40049
40050
40051
40052
40053
40054
40055
40056
40057
40058
40059
40060
40061
40062
40063
40064
40065
40066
40067
40068
40069
40070
40071
40072
40073
40074
40075
40076
40077
40078
40079
40080
40081
40082
40083
40084
40085
40086
40087
40088
40089
Sample Point 6
Cl- Word
Sample Temperature Word
Reserved Word
Reserved Word
Reserved Word
Reserved Word
EA/REA Word
AA/RAA Word
TTA Word
TDS Word
TDD Word
TDO Word
Na2SO4 Word
Na2SO3 Word
Na2S2O3 Word
Sample Point 2
Cl- Word
Sample Temperature Word
Reserved Word
Reserved Word
Reserved Word
Reserved Word
EA/REA Word
AA/RAA Word
TTA Word
TDS Word
TDD Word
TDO Word
Na2SO4 Word
Na2SO3 Word
Na2S2O3 Word
Sample Point 3
Description
EA/REA Word
AA/RAA Word
TTA Word
TDS Word
TDD Word
TDO Word
Na2SO4 Word
Na2SO3 Word
Na2S2O3 Word
Sample Point 1
MODBUS Register Addresses ('4XXXX')
Register
40000
40001
40002
40003
40004
40005
40006
40007
40008
40009
40010
40011
40012
40013
40014
40015
40016
40017
40018
40019
40020
40021
40022
40023
40024
40025
40026
40027
40028
40029
40030
40031
40032
40033
40034
40035
40036
40037
40038
40039
40040
40041
40042
40043
40044
Notes:
1. Offset is assumed to be ZERO but can be set to any value.
2. Function Code 3 & Function Code 16 are the only codes that are recognized.
3. Function Code 16 can only access register 126.
4. LCD Control Bit Field (Register 127) is a read-only register
5. Floating Point numbers are encoded in an n -bit integer where n is normally 16 but can be changed to a lower resolution if desired
6. Engineering units can be changed to whatever is desired through the LCD touch panel interface
Ranges For Floating Point Numbers
Parameter
EA
AA
TTA
Na2SO4
TDS
TDD
TDO
Low Val.
0
0
0
0
0
0
0
R. E. Hodges, LLC
Hi Val.
200
200
200
200
100
100
100
Units
lb/100gal
lb/100gal
lb/100gal
lb/100gal
%
%
%
Low Int.
0
0
0
0
0
0
0
Hi Int.
2n - 1
2n - 1
2n - 1
2n - 1
2n - 1
2n - 1
2n - 1
77
DURALYZER-NIR™ Laboratory Liquor Analyzer Manual
Appendix A.12 Troubleshooting
Table A.12-1. Troubleshooting Guide.
PROBLEM
POSSIBLE CAUSE
SOLUTION
Check insertion of power cord at analyzer and
outlet
Power is not supplied to outlet
Verify power is being supplied to outlet
Check fuse (fuse holder located next to analyzer
Blown fuse
power switch), if blown replace (3.5 A)
Analyzer will not power on
Check internal cooling fan
Internal analyzer temperature too high Relocate analyzer to a location with a cooler
(triggering thermal shut down switch) ambient temperature
Repower once the analyzer has cooled down
Power cord not plugged in securely
Other
Power cord not plugged in securely
Printer not working
LCD panel does not power
on or display correctly
Interface cable not connected properly
Check interface cable connection
or securely
Interface cable connection pins have
Clean connection pins on interface cable
developed a layer of corrosion
Out of paper
Replace paper roll (Appendix A.9)
Printer needs cleaning
Clean printer (Appendix A.9)
Other
LCD panel connection cable not
plugged in properly
LCD cable connection pins have
developed a layer of corrosion
Contact R. E. Hodges, LLC
Analyzer needs to "REBOOT"
Other
Difficult to draw sample
into cuvette
Flow restriction
Other
Cuvette needs to be acid cleaned
Sample needs to settle longer in
cuvette
Measurements become
erratic or unstable
Contact R. E. Hodges, LLC
Check insertion of power cords at outlet, power
unit, and printer
Disconnect and reconnect LCD panel cable
Clean connection pins of cable
Switch analyzer power OFF, wait 15 seconds,
switch power ON
Contact R. E. Hodges, LLC
Inspect tubing and cuvette for obstruction or
buildup, clean or replace if necessary
Inspect pipetting bulb, clean or replace if
necessary
Contact R. E. Hodges, LLC
Acid clean cuvette (Appendix A.5)
Adjust scan parameters (Sec. 4.4.3)
Ensure bulb is secure in holder and wire
Light source (bulb or connection) may
connection is secure and making good contact
be loose
(Caution: light source and holder will be HOT)
Light source may be nearing end of
lifespan
Other
Check bulb intensity and replace if necessary
(Appendix A.10)
Contact R. E. Hodges, LLC
Table A.12-1 is a troubleshooting guide for some problems that are easily remedied.
Other problems could arise that will likely be hardware related and require servicing by
R. E. Hodges, LLC.
R. E. Hodges, LLC
78
DURALYZER-NIR™ Laboratory Liquor Analyzer Manual
Appendix A.13 Replacement Parts
Table A.13-1. Replacement Parts List.
PART
DESCRIPTION
REH PART NO.
Analyzer Power Cord
AC, 6 ft
LLA-001
Enclosure Key
Key for opening/closing SS analyzer cabinet
LLA-002
LCD Control Panel
Touch screen user interface
LLA-003
MODBUS Com. Device
MODBUS TCP → MODBUS RTU
LLA-004
NIR Light Source
QTH NIR reflectorized bulb
LLA-005
Pipetting Bulb
60 mL, rubber
LLA-006
Printer
Thermal printer (includes printer power unit)
LLA-007
Printer Cable
Serial interface cable
LLA-008
Printer Paper
Thermal paper, 80 mm width
LLA-009
Printer Power Unit
Power unit, AC power cord, DC power cord
LLA-010
Sample Cuvette
1 mm path length, fused silica
LLA-011
Silicon Tubing
6 mm ID, 4 ft
LLA-012
R. E. Hodges, LLC
79
DURALYZER-NIR™ Laboratory Liquor Analyzer Manual
Appendix A.14 Warranty and Notices
Warranty
The DURALYZER-NIR™ laboratory liquor analyzer is warranted by R. E. Hodges, LLC
against defects in material and construction for one year from the date of shipment. Our
liability shall be limited to parts repair or replacement. For warranty repair or
replacement, the customer shall pay for shipping charges to our facility or travel charges
if warranty work is performed at the customer’s plant or facility. This warranty does not
cover damages or defects caused by improper use, neglect, accidents, wear, inadequate
maintenance, poor site preparation, or modifications and repairs not authorized by R. E.
Hodges, LLC or explicitly described in this manual. R. E. Hodges, LLC will assume no
liability for any incidental, indirect, or consequential damages arising out of the use or
misuse of this product.
Notices
•
•
•
•
Information contained in this manual is subject to change without notice.
R. E. Hodges, LLC makes no warranty as to the accuracy or completeness of this
manual and disclaims any liability in connection with its use.
Service/maintenance agreements are available, contact R. E. Hodges, LLC for
details and pricing.
No part of this manual may be reproduced without prior written consent of R. E.
Hodges, LLC.
R. E. Hodges, LLC
80