1
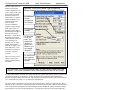
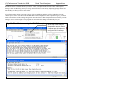
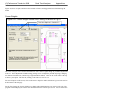
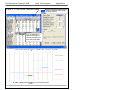
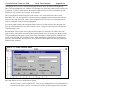
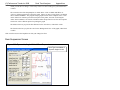
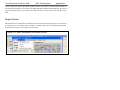
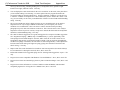
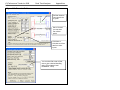
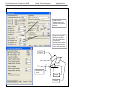
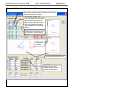
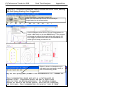
(C) Performance Trends Inc 2008
Circle Track Analyzer
Appendicies
Appendix 4: New Features in
Version 3.5
Here is a brief listing of some of the features added since v3.2 was released. Some we added to later
versions of v3.2 and some are new in Version 3.5:
•
A major new feature is the concept of balancing the Front Lateral Load Distribution (FLLD)
with the rear lateral load distribution. This concept can be used to find a “balanced” setup by
adjusting spring and roll bar rates, and roll center heights. This is discussed in detail below.
•
The ‘Rule of Thumb’ Suggestions for a good starting point for a setup now includes a
suggestion for the rear roll center height. This is based on obtaining a recommended FLLD.
See details below.
•
The program can now do an angled, symmetric 4 link rear suspension, as used in the late model
Mustangs and GM Metric chassis.
•
Added the ability to do Camber Change and Roll Center Migration tables and graphs in the
Front Suspension Screen.
•
The Front Suspension Screen now calculates and displays 2 additional suspension
characteristics: 1) Tire track change (tire scrub) as the front suspension goes through dive and
roll. 2) Swing Arm lengths, the length from the tire center to its instant center.
•
Changed the name of the Corner Jacking button at top right of main screen to Corner Weights.
That’s because 2 new options have been added, letting you do Tire Diameter/Circumference
changes and weight/ballast movement to check the affect on corner weights
•
Screen colors are now more compatible with Windows XP.
•
Added ability to save a vehicle file to or open a vehicle file from a floppy disk or CD, with a
default drive letter from A to Z, selectable in Preferences.
•
New Example files have been added, like GM Metric 4 Link Rear Suspension..
•
Added 'Edit' options to the 'Calculate' menu item in the Engine Specs screen. The new Edit
options let you factor the power curves up or down, or re-sort the table if there are blank rows or
RPM increments out of order.
FLLD (Front Lateral Load Distribution)
When a car makes a turn, weight is transferred from the inside tires to the outside tires. However, how
this weight transfer is split between the front and rear has a huge impact on the feel and handling of the
car. If more weight transfer occurs on the front of the car, the outside front tire is being “overworked”
more than the rear outside tire, causing less cornering traction at the front. This is more likely to produce
understeer or a push. Very simplistically, if the Front Lateral Load Distribution is 50%, that means the
(C) Performance Trends Inc 2008
Circle Track Analyzer
Appendicies
weight transfer split between front and rear is the same, and that should produce neutral handling. The
book “Race Car Vehicle Dynamics” by Milliken and Milliken (with assistance by Terry Satchell)
discusses this concept in detail. This concept is similar to the idea of balancing the front and rear roll
angles presented in recent magazine articles.
Figure A7 shows the program displaying the FLLD for the current vehicle (currently 43.4%, which
would tend to oversteer) during the transition between releasing the brakes and going to the throttle, at
the apex of the turn (transistion between braking and power). During braking and under acceleration, the
weight transfer is much more complicated, and the FLLD concept can not be as easily applied.
Figure A7 New Options at Main Screen
Corner Jacking brings up screen of Figure A10
FLLD value for this car is shown
here, with a description of what it
means. Click on details for more
info on this tuning parameter,
including more complete vehicle
calculations.
Find button brings up screen of Figure A8, to let you
quickly find combinations producing different FLLDs.
Figure A8 is displayed if you click on the “Find” button shown in Figure A7. This “Find FLLD” screen
lets you find a certain Front Lateral Load Distribution (FLLD), which can be a good indication of how
the car will handle at the apex or transistion of the turn (no power, no braking).
(C) Performance Trends Inc 2008
Pick the 'Adjust' factor to
tell the program what
vehicle component(s) you
want to adjust. Enter your
desired 'For This FLLD',
then click on the 'Find
Now' button. For perfect
theoretical 'Balance', the
FLLD should be 50%.
However, from
experience, Milliken
suggests a target 'starting
point' FLLD value of 5
percentage points higher
than the percent weight on
the front tires (100% Rear Wt % = Front Wt %).
By default, the program
will load in this value, but
you can change it to
anything else you want.
Higher FLLDs tend to
make the car tighter, with
more understeer. Lower
FLLDs tend to make the
car looser, with more
oversteer.
There are several ways to
obtain a certain Front
Lateral Load Distrbution
percentage.
Circle Track Analyzer
Appendicies
Figure A8 Find Front Lateral Load Distribution
Screen obtained by clicking on Find button in Fig A7.
3) Click here
to have
program find
new settings.
1) Pick what
to Adjust.
2) Select the
FLLD you
want. The
program will
default to a
typical value
based on your
car’s weight
distribution.
4) Click here to
have program
save these new
settings.
The new settings you find using this feature MAY NOT BE THE BEST AND COULD BE
UNSAFE. USE YOUR JUDGEMENT when making adjustments based on this concept.
To reduce the possibility of using very strange settings, the program will calculate the average front and
rear natural frequencies for the springs. If these frequencies are significantly different than those
typically used, the program will warn you. Typically, the front natural frequency will be in the range of
1.4 to 2.0 and the rear will be .1 to .5 points lower than the front.
For many vehicle combinations, the program can not find settings to match your requirements. Many
times this is due to the Front or especially the Rear roll centers being too high. High roll centers transfer
more weight laterally through the suspension linkages and less through the springs, making the springs
and roll bar have less effect on this tuning factor. You may then want to have the program adjust the
(C) Performance Trends Inc 2008
Circle Track Analyzer
Appendicies
Rear Roll Center to find the FLLD you desire. After you adjust the Rear Roll Center and keep this
change (click on OK/Keep), then you can go back into this screen and try adjusting springs and/or roll
bar and they are likely to have more affect.
If you find settings which you want to keep, click on OK/Keep and they will be loaded back to the
vehicle specs screen. For the Front and Rear Roll Center Heights for some suspension types, you must
make a mental note of this setting and go back into the Front or Rear Suspension Screen and try various
setting to arrive at this height. The program can not make this change automatically for you.
Fig A9 Other Features using the FLLD Concept
At the top of the Analyze
Suspension screen, these
3 reports are all improved
using the FLLD concept.
(C) Performance Trends Inc 2008
Circle Track Analyzer
Appendicies
Figure A9 shows 2 reports which now also include references and suggestions based on balancing the
FLLD.
Corner Weights
Figure A10 Corner Weight Screen from Clicking On Button in Fig A7
Two New Options in Version 3.5
The screen in Figure A10 is used to determine how static corner weights change as you make adjustments
to the car. These adjustments include turning 'jacking screws' to adjust the preload on springs, changing
tire diameter/circumference, and moving weight around like ballast. Click on one of the 3 tabs at the top
to choose your option. The first tab, Jacking, is the same as it was in v3.2.
For most all inputs on this screen, click on the name or input box and its definition is given in the section
at the bottom of the tab page.
For the Tire Change tab, choose which tire to change and which dimension you want to work with. The
program will then display the Current Tire dimension from the Vehicle specs screen. You are allowed to
(C) Performance Trends Inc 2008
Circle Track Analyzer
Appendicies
change this should it not be set exactly as you want. Then enter the New Tire dimension and see the
effect on Cross Weight. Rear and Left percents are not affected by changing tire diameter.
For the Move Weight tab, choose the type of weight change, and the amount of weight to change. Then
type in the Current Location of the weight and/or the New Location of the weight after the move. Cross,
Rear and Left percents can all be affected by moving weight.
Click on Back (keep changes) at upper left of this screen to return to the main screen while keeping your
changes to corner weights, tire sizes, vehicle weight, etc.
Front Suspension Screen
Figure A11 shows some of the new features for the Front Suspension Screen. Figure A12 shows an
example of the new “Table & Graph” feature for calculating Roll Center “migration” for various amounts
of dive and roll.
Figure A 11 New Front Suspension Screen Features
New Table & Graph features are
explained in Figure A12.
Swing Arm Length and
Scrub are displayed here.
(C) Performance Trends Inc 2008
Circle Track Analyzer
Appendicies
Lt and Rt Scrub shows in Figure A11 is the amount the tire moves out from the center of the car as it
goes through the amount of dive and roll you have specified.
Lt and Rt Swing Arm Length is the distance from the center of the wheel/tire to its instant center. Long
lengths indicate that camber will change little with dive and/or roll (Camber Gain will be low).
Table & Graph
If you click on Table & Graph at the Front Suspension Screen, you will obtain a screen similar to to the
top picture in Figure A12. This screen shows you 2 tables of Roll Center Height and Roll Center Left
(distance left of center) for a set on Dive and Roll combinations. Distances right of center are labeled as
“negative”. (Negative in not “bad”, it is just a way to indicate right, the opposite of Left.) You could
have also chosen to do a Camber Table. Then the top table would be for the Right side and the bottom
would be for the Left side.
You can also select to have a Baseline condition displayed in the Table (Show Baseline Data). This is
useful to compare 2 different suspension layouts. A Baseline is some previous condition which was
shown in the Table.
To save the current Table as a Baseline, click on 'Baseline', then 'Save This Data as Baseline'. The
program will ask you for a Comment to describe the Baseline condition. This Comment will be printed
with the Table when you print it if you are Showing the Baseline condition. This comment can also be
edited by clicking on 'Baseline' and then 'Baseline Comment'.
After saving a baseline Table, you could close the Table by clicking on Back in the Menu Bar, make a
change in the suspension and create the table again by clicking on Table & Graph. You would produce a
Table like in the upper left of Figure A12.
Click on the Options menu item and select 'Specs for Table Rows & Columns' to change the Dive and
Roll increments, and which is used for rows and which is used for columns. You will obtain the menu
shown in the upper right of Figure A12.
As you change the specs in this menu, the Preview at the bottom changes to show what the Roll and Dive
increments, and the general layout of the Camber Table will look like. The program allows only up to 10
rows and 11 columns. Your inputs may be changed if a combination produces more than these limits.
When you are satisfied with the Preview, click on OK/Exit. Click on Cancel to close this menu and
return to the original Table layout.
Note: If you change the Table specs, any previously saved baseline conditions will be lost because that
baseline has different increments for columns and rows, which would not match up to the new increments
you have selected.
(C) Performance Trends Inc 2008
Circle Track Analyzer
Figure A 12 Roll Center Table and Graph
Appendicies
Click on Graph to make graph
as shown below.
Click on Options for
screen to the right to
choose increments for
dive and roll for table.
Click on the Graph menu item and you can Graph the selected data from the Table. To select data,
(C) Performance Trends Inc 2008
Circle Track Analyzer
Appendicies
you highlight various rows by clicking and dragging the mouse in the top Table for the Right Side.
These selected (highlighted) rows, AND the corresponding rows in the bottom table for the Left side, will
be graphed. If you have selected more data than the Graph can hold, you will be told and the top and
bottom rows only of what you’ve selected will be graphed.
This screen graphs of Camber in degrees on the vertical Y axis versus either Roll or Dive on the
horizontal X axis. The data graph here is based on what was highlighted in the Camber table when you
clicked on the Graph menu item. Data is always graphed for the Left side as well as the Right side for
whatever conditions you have selected (highlighted).
If you make graphs of Roll Center Height and Roll Center Left, as done if Figure A12, this graph will
show the actual location of the roll center and how it moves. Height is on the vertical Y axis and Left is
on the horizontal X axis.
Read the labels in the "legend" at the right side of the graph to see which lines are which colors. The
graph is always "autoscaled" which means the program picks the scales for drawing it to display all data
with good detail. Print the graph on your printer using your Windows default printer by clicking on the
"Print" menu command. You can change settings, labels and Windows printer setup by clicking on the
"Options" menu command. See Figure A13. You can return to the Camber Table screen by clicking on
the Back menu command.
Figure A 13 Graph Options Menu
The Graph Options screen is divided into 4 sections.
The first section is called "Graph Labels": Click on "Use Standard Labels" for standard labels to
be printed on the graph. Click on "Use Labels Given Here" and the program will use the labels
(C) Performance Trends Inc 2008
Circle Track Analyzer
Appendicies
which you can enter or change. Click on any of the 3 text boxes and type in your chosen titles
or labels.
The second section of the Graph Options is called "Print": Click on "Black and White" or
"Color" to tell the program how to print the graph. Unless you have a color printer, you should
choose "Black and White". The program always graphs in color on the computer screen. Click
on the "Print Now" button to print the current plot on the printer, the same as selecting the
"Print" menu command. Click on the "Windows Printer Setup" button to see the current printer
selection or select a different printer for printing the graph.
The third section lets you pick the line thickness for the "Plot Lines", either thick or thin.
The fourth section lets you pick the color for the "Background Color" of the graph, either black
or white.
Click on OK to return to the Graph Screen with your changes in effect.
Rear Suspension Screen
Figure A14 Symmetric, Angled 4 Link Rear Suspension
New Type is available of
Symetric Angled 4 Link
(C) Performance Trends Inc 2008
Circle Track Analyzer
Appendicies
The new Suspension Type of Symmetric Angled 4 Link lets you find the roll center and roll stiffness of
rear suspensions found in several vehicles, including GM Metric and later model Mustangs. Because it is
only for symmetric layouts, you will only enter measurements for 1 side, and they will be used for both
sides.
Engine Screen
Edit options have been added to the Calculate menu item to allow factoring the power curve up or down
by a certain percent. The option is also available to “clean up” the power curve should you enter RPM
increments out of order, or leave blank rows in the data.
Figure A13 New Commands in the Engine Screen
(C) Performance Trends Inc 2008
Circle Track Analyzer
Appendicies
Appendix 5: New Features in
Version 3.6
In Version 3.6 we’ve broken the Circle Track Analyzer into 3 different programs:
•
Roll Center Calculator (RCC), which does the Front Suspension only.
•
Roll Center Calculator Plus (RCC+), which does the Front Suspension and Rear Suspension,
plus some front to rear “balance” analysis.
•
The full Circle Track Analyzer (CTA), which does everything the old Circle Track Analyzer
v3.5 did plus all these new features.
Here is a listing of the major new features added in Version 3.6 of full Circle Track Analyzer. Note that
unless these new features specifically mention Roll Center Calculator, they do NOT apply to the Roll
Center Calculator versions.
•
The program now lets you enter a rear anti-roll bar. This input changes the front to rear roll
stiffness, which affects most all of the handling ratings the program will calculate. RCC+, CTA.
•
The program now lets you enter both a front and rear aerodynamic Lift Coefficient. Many times
when you make an aerodynamic adjustment, you only affect 1 end of the car, like a rear spoiler
adjustment. This adjustment not only affects overall “road holding” ability of the car, and
therefore lap times, it also affects handling, the tendency to oversteer or understeer. CTA only.
•
The program has a new Calculation Menu utility called “Adjust” for the front and rear Lift
Coefficient and Drag Coefficient. You can choose a type of vehicle modification, enter the
starting and modified condition, and the program shows you how the current lift and drag
coefficients would change. This way you have an estimate of how certain vehicle modifications
would affect the entire aerodynamics of the vehicle. CTA only.
•
You can now enter more details about the front suspension, both for Double A Arms and
McPhearson Strut suspensions. This added detail lets you locate both the front and rear A Arm
mounts on the frame, and the angle of the McPhearson Strut when viewed from the side. These
details let the program more precisely locate where the A Arm attaches to the frame in the 2
dimensional layout. They also determine how much Anti-Dive is built into the front suspension.
Anti-Dive is the vehicle’s resistance to diving the front end due to braking. Reasonable starting
points for Anti-Dive for most all circle track asphalt cars in the 2000-3500 lb range are 10% on
the Right Front and 5% on the Left Front. RCC, RCC+ and CTA.
•
We’ve taken the concept of balancing the Front Lateral Load Distribution (FLLD) with the rear
lateral load distribution a step farther. We’ve developed a Performance Trends exclusive called
Oversteer/Understeer rating. It is based on how evenly the tires on the 4 corners of the car are
loaded. If they are equally loaded left to right, and loaded front to back the same as the front to
back weight distribution, we say that is a 0 Oversteer rating, or Neutral handling. Several
(C) Performance Trends Inc 2008
Circle Track Analyzer
Appendicies
factors go into this rating, including banking forces, aerodynamic forces, dynamic weight
transfer left to right, and front to back. CTA only.
•
You can display the actual wheel loads for the car in “transition” on the track, at the point where
you are neither braking or accelerating. It is at this point where the program determines the
Oversteer/Understeer rating described above. For this “transition” condition, you can also save
a “baseline” condition for comparison to some modification you have made to the vehicle. This
way you can actually see the effect you modifications will have on wheel loads and the handling
rating. CTA only.
•
The oversteer/understeer rating is displayed as the car goes around the track on the Analyze
Suspension screen. By saving a condition as a Baseline, you can compare your current
conditions to a saved Baseline. This is the same as what is described in the preceeding
paragraph except it is done at all locations on the track. This is also the same as the “Analyze
Suspension” feature in previous versions, except now it includes the front and rear aerodynamic
downforce, and the handling rating. CTA only.
•
The ‘Rule of Thumb’ Suggestions for a good starting point for a setup now includes suggestions
for a “Big Bar Soft Spring” (BBSS) setup. The BBSS theory is you use significantly softer
front springs to better handle bumps in the track, and to lower the car in the corners for less
aerodynamic drag and less weight transfer inside to outside. Then to counteract the additional
roll these soft springs would allow, the anti-roll bar is stiffened significantly. Other adjustments
include a much stiffer than typical right rear spring, paying more attention to Anti-Dive and
shock valving. CTA only.
•
Improved the Tire Scrub calculation for a Double A Arm front suspension (how much sideways
tire movement there is during dive and roll). RCC, RCC+ and CTA.
•
Refined the calculations for suggested spring rates for “Starting Point Suggestions” report. CTA
only.
•
Program is now more compatible with Windows Vista and Windows 7. RCC, RCC+ and CTA.
•
Program is now better at remembering a printer or printer orientation changes. RCC, RCC+ and
CTA.
•
Program is now better at find newer versions of Adobe Acrobat and Reader, and other PDF
compatible programs for viewing the User’s Manual. RCC, RCC+ and CTA.
(C) Performance Trends Inc 2008
Circle Track Analyzer
Appendicies
Figure A15 Rear Anti-Rollbar
Roll bar drawn to
your specs here
in green.
Set to Yes and
you can enter
rear roll bar
specs.
Click here to
Calculate a roll bar
rate from other
inputs
You can also find a rear roll bar
rate to give a desired handling
rating (Front Lateral Load
Distribution, FLLD)
(C) Performance Trends Inc 2008
Circle Track Analyzer
Appendicies
Figure A16 Front and Rear Aerodynamic Lift Coefficients
Click on the
Adjust button for
the screen shown
below.
Program now has
both a front and
rear lift coefficient,
to split the
aerodynamic down
force between the
front and rear tires.
Height
Rear deck
of car
Angle
Length
(C) Performance Trends Inc 2008
Circle Track Analyzer
Appendicies
Figure A17 More Front Suspension Details
Enter both measurements for both front and rear
attachment points on frame.
The calculated 2-D mounting
point (used by program) is
shown here, with the current
2-D mounting point used by
the program from the screen
below.
Click here to use these new
2-D points in screen below
Calculated
Anti-Dive
Arrows showing front of car.
Click here on Show
Details button to open
screen shows above
(C) Performance Trends Inc 2008
Circle Track Analyzer
Appendicies
Figure A18 Oversteer/Understeer Rating
Dynamic Handling rating of 2.74%
Understeer, which includes cross weight,
aerodynamic, and other effects. Note that
this is completely different than the
“Classic” handling rating which only
considers lateral load (weight) transfer.
Click here to update the
“Dynamic Handling” rating and
to display the screen below
Aerodynamic Downforce loads for
both the front and rear axles (tires).
Also include are the loads for the
Baseline condition, a condition
which you have selected to be your
“Baseline” for comparisons.
Dynamic Handling Rating of Oversteer
or Understeer, including the rating and
difference between this and the
Baseline condition..
Check Section 3.6 in book “Analyze Suspension”
for more info on this screen. This “Dynamic
Handling” rating is for the vehicle at the “transition”
point, between braking and accelerating, no fore or
aft acceleration.
(C) Performance Trends Inc 2008
Circle Track Analyzer
Appendicies
Figure A19 Oversteer/Understeer Rating Around the Entire Track, and Big
Bar Soft Spring Starting Pont Suggestions
After you Calculate Lap Times, click on Analyze
Suspension for the screen below.
Click on Reports, then ‘Rule of Thumb’ Suggestions for
either a Std Setup or the new BBSS Setup. The program
will create the report like shown below with spring, roll
bar, stagger, anti-dive and other recommendations for
either type of setup you want to run.
Report is shown in Notepad so you
can easily copy and paste, email, or
print it on most any printer.