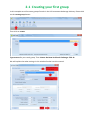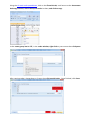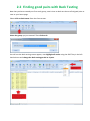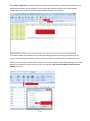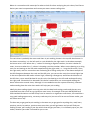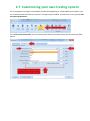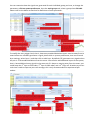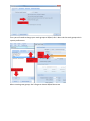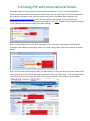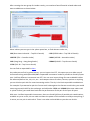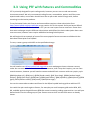
1
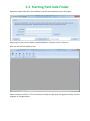
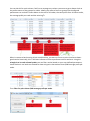
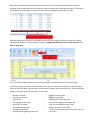
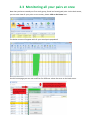
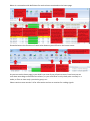
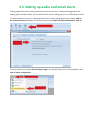
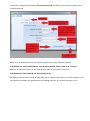
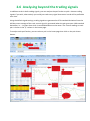
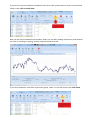
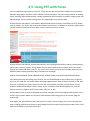
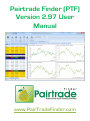
Pairtrade Finder (PTF)
Version 2.97 User
Manual
www.PairTradeFinder.com
Table of Contents
1.0
Introduction
1.1 Overview of Pairtrade Finder(PTF)
1.2 The Pair Trading Strategy
1.3 Installing PTF
1.4 Starting PTF
2.0
Using PTF
2.1 Creating your first group
2.2 Finding good pairs with back testing
2.3 Monitoring all your pairs at once
2.4 Receiving entry and exit signals on your pairs
2.5 Setting trading signal audio and email alerts
2.6 Analysing beyond the trading signals
2.7 Customizing your own trading system
2.8 Keeping records and position sizing
3.0
Using PTF with other markets
3.1 Adding real time data to PTF
3.2 Adding international stock exchanges
3.3 Adding futures and commodities
3.4 Adding options
3.5 Adding forex
4.0
How to get the most out of PTF
4.1 Optimum performance
4.2 Trading mentality required
4.3 Diversification and smart risk management
5.0
Troubleshooting
5.1 Installing
5.2 Running
5.3 Data
6.0
Other Information
6.1 Useful links
6.2 Automating PTF
1.1 Overview of Pairtrade Finder(PTF)
Welcome to the Pairtrade Finder user manual. This manual is designed to help you understand the
concepts within our software and how to get the most out of it. We highly recommend you take the
time to read this manual as it could dramatically change your trading, so grab a cup of coffee and
enjoy learning our highly popular trading software.
At first glance PTF may seem complex or confusing, however after reading this user manual and
playing around with the software for an hour or two you will begin to realise its simplicity and
powerfulness in creating your own pair trading system. There is no other software available that
comes close to performing what PTF does. Pairtrade Finder has been developed by professional
traders in tandem with qualified programmers and has been continually developed over the past
several years and is constantly updated. We encourage user feedback to develop our software.
Pairtrade Finder is a stand-alone software program that runs on Windows XP, Windows Vista or
Windows 7. In section 1.2 we give you detailed instructions on how to install Pairtrade Finder on
your computer free for 30 days; this is a simple process that should only take you 15 minutes to
achieve.
PTF is a highly customizable tool you can use to generate trading signals on over 1,000,000 tradeable
instruments from around the world including stocks, options, futures, commodities and forex, it is a
true global platform to find unique trading opportunities at a click.
You can create your own groups categorized by industry, sector, country or whatever else you can
think of, and then you can test all instruments within those groups for historical performance of our
trading signals. You can customize how the trading signals are generated, and then save the pairs
with the best historical performance to your home screen where you can watch over all pairs at once
and receive real time trading signals for.
After designing your trading system, you can use the triggers window to easily see new entry and
exit signals on your saved pairs. These signals come in during market hours or any other time which
you can specify. These trading signals can be sent to your email inbox so you don’t need to be in
front of the computer all day, you can receive and trade these signals from your phone with the help
of one of many free broker applications.
You can perform additional analysis on the built in trading signals, using ratio, correlation, RSI,
volatility, standard deviation and our own custom % from the mean charts. With quick links to news
items, ability to chart 2 instruments, easily compare fundamentals gives you an extra added layer of
analysis to improve your trading performance.
PTF is designed to be very user friendly and perform various calculations very quickly, all backed up
and supported by a team of professional programmers and traders that regularly update the
software to stay current with market conditions and changes.
Please turn to section 1.2 for instructions on how to download a free 30 day trial of PTF. If you wish
to continue using our software after 30 days, you will need to purchase a lifetime license.
1.2 The Pair Trading Strategy
Pairtrade Finder is built around the pair trading strategy. Pair trading involves buying one instrument
and at the same time shorting another instrument. This leaves you market neutral, you’re not
betting on the underlying direction of the market, you’re betting on the relationship between 2
correlated instruments.
Pair trading or statistical arbitrage as it’s more commonly known in the investing world, is the most
popular trading strategy amongst hedge funds, as they recognise the reduced risk and ability to
produce returns in any market environment that the pair trading strategy delivers.
Pair trading has been around since the invention of markets, Jesse Livermore, probably one of the
most famous traders of all time, used pair trading back in the late 1800s, he would find a strong
stock then short what he called the ‘’sister stock’’. Pair trading really took off with large investment
banks and hedge funds in the 1980s with the help of computers.
Today, pair trading is still a new concept amongst most online traders; however that is quickly
changing; more and more online traders are beginning to see the benefits of the pair trading
strategy. The go-go days of 1999 where you could wake up and buy yahoo, go out for breakfast and
come back and have made 3k are gone, markets are a lot more sophisticated now, and so too must
be your trading strategy.
With pair trading, it doesn’t matter which direction markets go in, up, down or sideways you can still
profit. You risk is greatly reduced as you not subject to large directional price shocks the market can
often experience. Using pair trading, you can safely use leverage to magnify your position size,
something that is not safe when betting on a one way direction.
Pairtrade Finder allows you to design, test and implement your very own customized pair trading
system. You can import over 1,000,000 different tradeable instruments from around the world and
look for the best pair combinations, and then be notified of entry and exit signals for those pairs. You
can further analyse the trading signals with the help of our own custom charts, formula’s and
fundamental analysis. No other tool available allows you to do all this so easily.
We urge you to take some time out of your day and go through this user manual with Pairtrade
Finder open, the 60 minutes you invest in learning our proprietary software is sure to pay handsome
dividends and could dramatically change your trading and your income.
You may find it easier to print this user manual and have it in your hand whilst learning our software.
The user manual is designed to flow from one section to another, giving you an overview of the
software and teaching you how to extract the most value from it.
1.3 Installing Pairtrade Finder
Everyone is welcome to download a free 30 day trial of PTF. This free trial has no feature limitations
and you will receive the same support provided to our already large user base. We welcome you to
test out our support response by sending an email to [email protected] we answer 99%
of all emails within 24 hours. If at any time you have trouble installing PTF please email us and we
will guide you through the process or we can even remotely connect to your computer and install
the software for you, right in front of your eyes. We provide this service free of charge.
If you have already successfully downloaded PTF, please skip this section.
Pairtrade Finder is a windows based program and if you have purchased your computer within the
last 10 years, you will have the hardware and software pre-requirements for installing our software,
it does not require the latest specifications to run.
Installing PTF is a 2 step process. The first step of getting PTF up and running is to Install Microsoft
SQL, this is a database program and is where all of the historical and ongoing data is stored. PTF
automatically updates data into SQL, once you have setup SQL, you don’t need to anything further in
regards to updating and storing data.
If you are running Windows XP, you will need to install Microsoft .NET and Microsoft SQL 2005.
If you are running Windows Vista, or Windows 7 you only need to install Microsoft SQL 2008.
We recommend using this guide in assisting you to install Microsoft SQL 2008.
Once you have successfully installed SQL, the last remaining step is to install the PTF software.
Please download the Pairtrade Finder software from here.
The Pairtrade Finder installation is very quick and straight forward, and upon completion you should
see the PTF icon on your desktop. Please read on to section 1.3 for instructions on starting PTF for
the first time.
1.3 Starting Pairtrade Finder
Open Pairtrade Finder from your desktop. You will see the below screen once open.
Please type in your correct name and email address, and then click on free trial.
Next you will see the below screen.
Please read onto section 2.1 for instructions on how to input your first group of stocks into the
program to find good pairs.
2.1 Creating your first group
In this example we will create a group of stocks in the US investment brokerage industry. Please click
on the create group button.
Then click on create.
Type a name for your stock group. Then choose the New York Stock Exchange. Click ok.
We will explain the other settings in this window further into this manual.
Using the US stock code spreadsheet, click on the financials tab, scroll across to the investment
brokerage column, select the top 10 stocks in there, and click on copy.
In the create group box in PTF, in the codes window, right click on your mouse then click paste.
After copying codes, change data to 3 years then click on add codes. Once finished, click close.
2.2 Finding good pairs with Back Testing
Now that you have created your first stock group, now is time to back test them to find good pairs to
save to your home page.
Please click on back tester from the front screen.
Select the group you just created. Then click on ok.
You will see the back testing screen appear, next highlight all stocks using the SHIFT key in the left
hand column and change the back testing period to 3 years.
Next click on Find Pairs and please wait for results to start showing in the blank window, this can
take several minutes as the software is crunching huge volumes of data. Every possible pair
combination from stocks in the left hand window is shown in the results.
The results shown are based on the in-built pair trading system, the same signals that you can
receive in real time going forward. This is real proof that our system works, numbers don’t lie.
When you see the last 2 stocks codes paired, in this case its SEIC & TRAD, back testing has finished.
Now let’s average the results for every pair in this group, click on the E symbol in each column
header to do so.
You can do this for each column, feel free to average any column you want to get a deeper look at
the performance of the group as a whole. Ideally you want to focus on groups that show good
performance as a whole. Shown below is the sum of all trades, the total profit from all those trades,
the average profit per trade and the winning %.
When it comes to back testing all pair combinations, you want to focus on pairs that have shown
good results historically, this is the best indicator of future performance that we have. Using the
triangle icon in each column header you can filter results based on your own defined parameters,
shown below is our back test filtered to show only pairs that make at least $300 average profit per
trade.
Then filter for pairs above $300 average profit per trade.
Now that has reduced the shown pairs down to 55 out of all 78 possible combinations, all pairs
showing in the results make at least $300 per trade (assuming 10k invested per trade). This has also
increased all our other back test statistics, lifting the average winning trades to 77.4%
Now we will save all of these 55 profitable pairs to our home page to monitor further for trading
signals going forward. Using the SHIFT key again, highlight all the pairs in the results window, then
click on Save Pair.
You have now completed a back test, found good pairs and added them to your home page.
Feel free to play around with the back tester more, you can back test our system on up to 10 years
worth of historical data, and create any combination of filters that you can think of. These results are
shown in the back tester for each pair, in this order;
-
Number of trades
Average correlation
Total profit
Average profit per trade
Winning % of trades
Average winning trade
Average losing trade
Average winning/losing trade ratio
-
Biggest winning trade
Biggest losing trade
Average days trade was open
Total PnL less biggest winning trade
Total PnL less biggest losing trade
Median profit/loss per trade
2 charts shown (Running PnL and ratio chart for
each pair)
2.3 Monitoring all your pairs at once
Now that you have created your first stock group, found and saved good pairs via the back tester,
you can now view all your pairs on one screen, please click on the home icon.
The below screen will appear with all your saved pairs populated.
On this home page you can rank and filter for different values the same as the back tester.
Below is a screenshot with definitions for each column contained on the home page.
Shown below are the functions of some other buttons you will find on the home screen.
As you can see the home page is your bird’s eye view of your all pairs at once, from here you can
rank them according to the different columns, or you could filter to only show pairs currently in a
trade, or filter to show only a particular group, etc…
Please continue onto section 2.4 for information on how to monitor for trading signals.
2.4 Receiving entry and exit signals on your pairs
You have now created a stock group, found and saved good pairs, know where to see them all at
once, now you can use the triggers window to monitor for upcoming trading signals. Trading signals
will come in during market hours or your specified time. Please click on the trading signals button.
It will be blank until new trading signals are generated by the software.
This is what your trading signals window will look like one new trading signals come in, you can also
sort to show signals going back in time, and then using the same E and triangle icons in the columns
headers, can sort, rank and average values.
2.5 Setting up audio and email alerts
Trading signals will come in during market hours for you to act on, instead of being glued to the
trading signals window all day, you can be alerted to a new trading signal via an audio beep or email.
To setup audio alerts, which is a beeping sound when a new trading signal arrives, please click on
the system preferences button on the front screen, then enable the play sound options, click ok.
To setup email alerts, please click on the pair logo in the top left hand corner of the software, then
click on alerts configuration.
In the alerts configuration window, click on the email tab and follow instructions as shown in the
screenshot below.
Below is an example of what an entry trading signal sent to your inbox will look like.
7/16/2010 Enter Trade GOOG/YHOO - Long GOOG at 412.38, Short YHOO at 15.75 Layer 1
Below is an example of what an exit trading signal sent to you inbox will look like.
7/20/2010 Exit Trade GOOG @ 419.25/YHOO @ 14.63
We highly recommend you setup at least audio alerts, and/or email alerts so you are notified in real
time when our software has generated a new trading signal for you to look at and/or act on.
2.6 Analysing beyond the trading signals
In addition to the in-built trading signals, you can analyse the pair further to pick n choose trading
signals if you wish, alternatively you could just trade every signal that comes in and still be profitable
over time.
Using the default signal settings, trading signals are generated at 2.70 standard deviations from the
100 day mean average of the ratio, an exit signal is generated when the pair goes past 1.00 standard
deviations; i.e.….its goes closer than 1 standard deviation to the mean. The current reading on each
pair is shown in the +/- column in the home page.
To analyse each pair further, you can select a pair in the home page then click on the pair charts
button.
In the same pair charts window, you can easily compare the fundamentals of each stock against each
other, click on the fundamental comparison tab at the bottom of the data column.
If you would like to compare two stocks or more against each other you can do so by clicking on the
stock list button on the front screen.
Next, select 2 or more stocks using the CTRL key.
If you wish to see the latest news items released on a particular stock, click on it in the left hand
column, then click on the View in yahoo finance button.
Your browser will automatically load the selected stock code in yahoo finance, so you can quickly see
any recent news items released on a stock.
If you wish to view an individual candlestick chart for a stock, please select a stock in the left hand
column, then click on detail view.
Next you will see the detailed view window, where you can daily trading information, and whether
the stock is trending or ranging, and key support/resistance levels.
If you wish to delete a stock from a particular group, select it in the left column and click delete
Below is a screenshot with some tips for what to look for when analysing the pair charts, feel free to
devise your own interpretations and create your own custom trading rules.
The ratio chart is probably the most used chart in pair trading, shown in the top left hand corner in
the above screenshot, it is the left stock in a pair divided by the right stock. In the above example,
the latest ratio is 1.02. When the +/- column is showing a negative number, the ratio is below its
mean, vice versa when the +/- column is showing a positive number. When we are betting on a rising
ratio, we are betting on the left code outperforming the right code, i.e…..long the left stock / short
the right stock, and vice versa when we are betting on a falling ratio price. In the above example of
the RSI divergence between the ratio and the RSI price, you can see the ratio chart move higher but
in the same period the RSI makes a lower high, indicating a divergence, we follow the direction of
the RSI chart, so we would be bearish on the ratio, thus betting on the left code underperforming
the right code. Please don’t be alarmed if this doesn’t make sense, we recommend reading the
above information several times, although it’s not needed to use our system effectively, however
understanding how the ratio chart works will help your pair trading.
Ideally the best trading signals occur on pairs with the best back testing results and that are very
stretched from their mean on no significant news items, for example if the pair AMTD/OXPS was
3.00 standard deviations and 10% away from its mean on no significant news items, this would be a
very good trading opportunity, not every trade may win, but out of 10 or more of these trades, you
will come out on top.
The best way to get good at pair trading is the same way to get good at anything else; read, learn,
practice, persist, be patient, practice some more then you will get better and you will find your
trading nirvana, pair trading is just the vehicle that will get you there, it is ultimately up to you, the
trader, whether you make it succeed for you or not.
2.7 Customizing your own trading system
PTF is designed to be highly customizable, flexible and appealing to a wide audience of traders. You
can customize how the charts are shown in the pair charts window. On the front screen, please click
on system preferences.
Then click on the charts tab, you can choose what charts are shown where and for what look back
period.
You can customize how the signals are generated for each individual group you have, to change the
parameters, click on system preferences, then the stock groups tab, select a group then click edit.
Please refer to the below screenshot for definitions of each parameter.
To modify the entry trigger level, that is, how many standard deviations a pair must be away from its
mean before our software generates a signal, please click on system preferences, then on universal
layer settings, select layer 1, and then click on edit layer. By default PTF generates entry signals when
the pair is 2.70 standard deviations from the mean. You can also add additional layers to the system,
that is, have additional entry signals in the same pair if it keeps on moving away from the mean, you
could setup the 1st layer at 2.50 stdev, 2nd layer at 2.80 stdev, and a 3rd layer at 3.10 stdev so you can
scale into a trade to improve your cost average, this is only recommended for experienced pair
traders.
You may wish to set individual entry layers for each pair, for e.g…2 highly correlated liquid ETFs you
may want to set at 2.00 layer, however for a risky small cap NASDAQ biotechnology pair you want
may to use 3.00 along with smaller position sizing. To edit individual layers for pairs, go to the front
screen, select a pair, and then click on edit layers.
As you can see PTF is highly customizable and its very unlikely 2 traders will make exactly the same
trades over time. You can use and customize PTF in any way you can think, some traders can get very
creative with their trading rules and combinations, some swear by the RSI chart, other’s buy the dips
in up-trending ratio charts backed with fundamentals, some will only trade pairs in a certain
industry, etc…it really is up to your imagination as to what you can come up with. Pair trading is part
science, part art, it is a skill that you can grow and develop over time, and before you know it, your
trading will come natural just like driving a car.
2.8 Keeping records and position sizing
As a pair trader, is it very important you keep detailed records of all trades, both simulated and live
as this gives you a journal that you can go back too and learn from, plus keep track of your PnL. It is
also critical that you have the right position sizing formula based on your risk tolerance, investment
objectives and available leverage. We cannot give a one-size-fits-all type position sizing formula as
every trader is different and use a multitude of brokers which offer different leverage. We can give
you an outline on how to approach position sizing with the help of our spreadsheet.
You will find the spreadsheet for download here.
You will also find in the trading signals window the qty of shares to buy or sell for a trade which is
calculated on your defined trade size, default is size $10,000.
In here you can record your trades, entry and exit prices, and it will automatically calculate the % PnL
return for the pair trade as a whole. You can also use the spreadsheet to calculate how many shares
to buy or sell.
When pair trading, our aim to trade dollar neutral, that is, equal $ exposure on both the long and
short side. For example if you had a $10,000 a/c you may wish to place $2,000 in each trade, so you
would take $2,000 and divide it by the share price to work out the qty to buy/sell….eg…..2000 / 35 =
57 shares to buy/sell.
Good pair trading is all about making heaps of small trades with an edge, don’t ever place a large %
of your a/c in any one trade, as in the rare case of a large overnight move this will affect your whole
a/c negatively.
Spreading your risk is what we keep you in the game for the long term, try and trade a diversified
portfolio of pairs from different sectors, industry’s, asset classes whilst never focusing on the results
on one trade, rather the performance of 10, 20 or more trades over time, that is what counts.
3.1 Getting Real Time Data into PTF
To use Pairtrade Finder with real time data for US or Canadian stocks or with futures, options, forex
and commodities requires a data subscription from www.iqfeed.net/pairtradefinder Please
remember to use this link with our extension as we have an arrangement with IQfeed where the
normally charged $50 setup fee is waived for PTF users.
Whilst you may be used to getting free data, if you’re a serious trader, there is nothing more
important than getting quality, clean data, a bad tick on free data could costs you hundreds, which
would have been saved with a simple monthly subscription to real time data. IQfeed isn’t the
cheapest provider, however they offer the best value when it comes to markets covered and quality
of data, hence they have over 80,000 clients.
Signing up to IQfeed is a simple process. To get started complete their online free trial registration
form, then download their software.
Once you have signed up to IQfeed you will need to enable IQfeed in PTF, please click on system
preferences, then enable IQfeed.
Then you will need to change your stock groups to IQfeed, this is done via the stock groups tab in
system preferences.
When creating new groups, don’t forget to choose IQfeed there too.
3.2 Using PTF with International Stocks
Pairtrade Finder sources its data from yahoo finance by default; it is free 15 min delayed data
automatically imported into the software. Alternatively you can subscribe to real time market data
for US stocks, Canadian stocks, futures, options and forex via an IQfeed data subscription at
www.iqfeed.net/pairtradefinder Yahoo finance supports the majority of international stock
exchanges, you can find a list of supported exchanges in PTF here. To add an international exchange
to PTF, please click on the pair logo, then add exchange.
Next, scroll through the list and add an exchange, in this example we will add the London Stock
exchange, after adding the exchange, when you create a new group, select this exchange as shown
below.
Next, you will want to add relevant codes for that exchange, unless you know your local codes off by
heart, go to your local yahoo finance page and look for the local index listing, in the LSE example this
is the ^FTSE. Click on this index, and then click on components for stock codes as shown below.
After creating the new group for London stocks, you now have found financial related codes and
want to add them as shown below.
Other indices you can type in the yahoo quote box, to find relevant codes are;
^DJI (Dow Jones Industrial – Top 30 US stocks)
^SPX (SP500 Index – Top 500 US Stocks)
^GSPTSE (TSX – Canadian Index)
^AXJO (ASX200 – Australian Index)
^HSI (Hang Seng – Hong Kong Stocks)
^GDAXI (DAX30 – Top German Stocks)
^FCHI (CAC 40 – Top France Stocks)
You can find an expanded list here.
Any code you can find in yahoo finance, you can import into PTF, this opens you to a wide array of
instruments along with IQfeed 600,000+ importable instruments makes it possible to literally import
over 1 million different instruments into PTF. You can even import things like non tradeable indices
like advance/decline line, tick, trin, etc….and compare them to indices, futures, options or anything
you can think to pair with for some interesting results. The sky is the limit to possible combinations.
For example if you wanted to pair the France stock index against the German stock Index, you would
create a group with NYSE as the exchange, and add codes ^FCHI and ^GDAXI (the same codes used
in yahoo finance) you could then back test the performance of this pair for the past 10 years.
With over 1 million importable instruments, there are literally billions of possible pair combinations
available to you at a click, do not under estimate the power of this software to analyse everything, if
it moves, we can pair it and trade it. There is no other tool available to you that can do this.
3.3 Using PTF with Futures and Commodities
PTF is primarily designed for pair trading stocks, however you can use to trade more exotic
instruments aswell. We only recommend trading futures, commodities, options and FX to more
experienced traders, new traders should learn how to pair trade stocks to begin with, before
venturing into derivative products.
To use Pairtrade Finder with futures and commodities requires a data subscription from
http://www.iqfeed.net/pairtradefinder as per section 3.1 of this manual. Once you have a IQfeed
subscription and the data feed enabled in PTF you can now import futures contracts. Please note
that some exchanges require different subscriptions with IQfeed, the basic subscription does cover
most contracts, however some require additional exchange subscriptions.
We will begin with an example of some of the most popular futures contracts available with the
basic data subscription from IQfeed.
To start, create a group with NYSE as the specified exchange.
You will need to use IQfeed symbol look-up guide on their webpage to locate relevant contract
codes. He are some codes for continuous futures contracts, that is they don’t expire, you can front
month contracts, however you will need to remove and add fresh contracts with every expiry cycle.
@BO# (soybean oil), @C# (corn), @GF# (feeder cattle), @HE (lean hogs), @RB# (random length
lumber), @LE@ (live cattle), @O# (oats), @PB# (pork bellies), @S# (soybeans), @W# (wheat), @ZG#
(gold), LRC# (robusta coffee), QC# (cocoa), QW# (white sugar)
You use the same codes as above and found in the IQfeed symbol look up guide to add into PTF.
You could also pair stocks against futures, for example you could compare gold stocks NEM, KGC,
GG, and ABX against the gold futures @ZG #for some interesting trading opportunities. Just add your
desired stocks into the same group as your futures contract then use the back tester as already
shown.
3.4 Using PTF with Options
Just as above, you will need a IQfeed subscription to import options into PTF. Please read
instructions in section 3.1 of this user manual on how to achieve this.
Please specify the NYSE as the exchange when creating a new group to house your option contracts.
Then use the IQfeed symbol look-up guide to locate relevant option codes to import into PTF. As
with stocks and futures, we highly recommend you only trade the most liquid contracts, with the
case of options, this is mostly comprised of the SP100, that is the top 100 liquid stocks, you can trade
other stocks in the SP500, however the more liquid the option, the tighter the spread and lower your
trading costs.
When searching for options in IQfeed, specify OPRA as the exchange in the lookup window. Then
specify index/equity options in the product field and type the stock code of the options you want
displayed.
You can compare the underlying stock to the options too, by adding the stock code into the same
group as the options, e.g…..you could add all the call options for MSFT into a group then add stock
code MSFT aswell to backtest pairs of stock vs options. You could get even more creative by
comparing the call options of MSFT against a similar business like ORCL or INTC, or compare MSFT
call options against the stock of ORCL or INTC. The combinations are endless and only limited by your
imagination.
3.5 Using PTF with Forex
You can import foreign currency into PTF. These are the spot instruments traded over the counter
between large banks and with access offered via online brokers. There are many benefits to trading
forex, including 24hrs deep liquidity, steady movements with limited price shocks, cheap access and
high leverage. This can make trading forex very appealing to the online trader.
As with futures and options, you need an IQfeed subscription to import forex data into PTF, please
refer to section 3.1 of this user manual for relevant instructions. In addition to the basic subscription
you will need to subscribe to forex data in their premium services section.
As with futures and options, please select NYSE in the exchange field when creating a new group to
house your currency crosses. Shown below are the most liquid currency crosses and in the same
format you would add them into PTF. For a full list of currency crosses you can add, please use the
IQfeed symbol lookup guide and select FXCM as the exchange.
USDJPY.FXCM, EURUSD.FXCM, GBPUSD.FXCM, USDCHF.FXCM, AUDUSD.FXCM, NZDUSD.FXCM
You could add some interesting pairs with FX, like the EURUSD against the EUR futures, or against
the euro ETF code FXE, to create riskless arbitrage opportunities. Also oil tends to move in line with
the euro, as Europe is a major importer of oil and central banks consider it a high factor in their
inflation models which affect interest rates, so you could pair the EURUSD against the crude oil
futures contract or against oil ETFs like codes USO, OIL, or XLE.
Use the back tester as much as possible to find the best pairs which have performed the best over 1,
3 and 5 year periods. Make sure you only save the best performing pairs to your home page for
monitoring.
Once again, the possibilities of pairs that you can create is never ending, you can find unique and
exotic trading opportunities that only large hedge funds are used to enjoying. Pairtrade Finder is the
only tool available to you that can do this.
4.1 Optimum Performance
Pairtrade Finder is a powerful program. No other software available crunches the same amount of
data PTF does on the fly. The latest programming technologies have been used to allow this to
happen. However there are limits on the amount of data you can import and back test at any given
time. This largely depends on your computer RAM, chip speed, hard drive speed, internet
connection and how many other programs you have running on your computer.
PTF can store and analyse more data than most trading software programs available. That is because
we use separate 3rd party software, Microsoft SQL as a database for our data. PTF connects to your
SQL database automatically and updates it minute by minute, and retrieves old data from there for
back testing. Due the volume of data PTF crunches on the fly, you have to be aware of the limitations
involved.
Typically speaking, you should be able to easily store 300 pairs in your home page and back test 20
stocks at once. This is plenty of capability, because you should be creating groups with 20 or less
instruments to make sure there are of high correlation, so create a new group for each industry or
instrument type. With default settings, each pair will produce on average 2.5 trades per year, so with
300 pairs, that is 750 trading signals per year. Some users have powerful PCs and can comfortably
store over 1,000 pairs on their home page and back test 50 or more stocks at once. However if you
find the program crashing during start up or during a back test, it is likely you have loaded too much
data into the software.
We have found the optimum computer setup to be a brand name PC with 8gb of memory, quad core
chip and windows 7 64 bit. This is not required to use PTF, however if you are a serious full time
trader you may consider the above. Anything over 2gb of RAM and more than 1.5ghz of chip speed
should allow you to enjoy PTF functionality without issue.
With regards to setting the update frequency in group settings, be careful using a high frequency like
5 seconds when having more than 200 pairs, by default the update frequency is 300 seconds,
meaning PTF will fetch new data every 5 minutes, you can safely decrease this to 60 seconds with
200 pairs on your home page.
4.2 Trading Mentality Required
Your personal attitude require to succeed in pair trading is the same attitude required to succeed in
any other style of trading or anything else in life. Every trading system or style will have drawdowns
and soft patches, that’s the nature of the beast. There is not one trading system that will produce
profit, day in day out all the time, there will be times when market conditions aren’t favourable for a
particular trading style.
Anyone can handle winning, it’s how you handle losing that matters. You can’t control what
happens, you can only control how you respond to what happens. The good thing with pair trading is
naturally it has a high win rate around 70%, meaning 7 out of 10 trades will produce a profit, having
a high win rate makes it easier to stick to a strategy. That doesn’t mean you can’t have 3 losing
trades in a row, and you inevitably will at some stage if you trade long enough. What matters is your
performance after 10, 20 or more trades. It’s a game of numbers and you need to treat your trading
like a business where your losses are your business costs, are your wins is your business revenue, so
long as you collect more revenue than costs after the quarter you have a profitable trading business.
By default, we are raised to believe that if you do something and it is wrong, that you must change
something. This is a natural human reflex that is deeply ingrained in our psyche, this is also
detrimental to successful trading. You have to continue to use the same method even if it isn’t
working. This is where most traders fail with trading systems, you can find a trading system with an
excellent back test report and equity curve, however when the inevitable drawdown comes, the
traders starts chopping and changing things or even worse, completely abandons the method.
What you need to continue trading through a drawdown is confidence in your trading method. The
advantage with pair trading, is that it is designed around a very robust strategy with sound logic. Pair
trading is not a fly by night strategy that most online traders employ, it has been around for 100s of
years and will continue to do so. It is not based on some voo-doo combination of the MACD, RSI,
chart pattern and day of the week filters, which sometimes may produce good results, however
trading systems like this aren’t based on sound logic and when the drawdown comes you will have
no conviction to continue trading it.
Successful pair trading, like anything else in life, requires planning, persistence and patience. You
can’t expect to become a millionaire overnight, it takes work and time to achieve. Plenty of practice
and record keeping will help you get better at your craft. Try and learn as much as possible, ask
other successful pair trader’s questions and look for new ways to improve your trading. Pair trading
is a method you can use to generate a consistent income and capital growth after you have
mastered the basics.
If you are tied of chopping and changing your trading method, or looking for the non-existent holy
grail, or sick of being promoted the latest ‘’hot stock’’ then make it your objective to learn the pair
trading method to the best of your ability and guided with our software and ongoing support you are
significantly increasing your chances of becoming a successful trader and living a lifestyle most only
dream about.
Pair trading does work over time as evidenced by the results in the back tester, if you stick to it, you
will succeed, the impatient and greedy won’t.
4.3 Diversification and Risk Management
Paying attention to risk is of upmost importance in trading. You have to ensure you won’t take a
drawdown above your psychological uncle point, for most traders this is 30%, after a 30% drawdown
it becomes mentally hard to continue with the same method. Also smart risk management ensures
your account won’t take a big hit if any one trade goes sour. Every now and then you will take a large
loss, this is part and parcel of trading, and something every trader has to deal with.
The first thing you want to decide is how much of your account you want to place in each trade. This
is a function of your risk tolerance and the maximum amount of positions you will allow. Ideally you
will place between 10-30% of your account in each trade. For example if you had a $10,000 account,
you may wish to buy $2,000 stock and short $2,000 at a time. With 2:1 overnight margin, this will
allow you to have a maximum of 5 pair trades open (5 x 4,000 = 20,000).
Next, you want a diversified portfolio of pairs, look for opportunities in as many markets as possible,
if you are just trading stocks, trade companies from a variety of industries. Even better would be to
trade multiple asset classes, stocks, futures, options and forex. Of course you will need more trading
capital and trading experience to trade multiple markets, this is something you can work towards.
You have to be careful with what stocks you trade, unlike with futures and forex which are large,
liquid instruments, some stocks present much greater risks. For example a large blue chip company
like Walmart (WMT) has significantly less risk inherent than say a small cap biotechnology company
traded on the NASDAQ which doesn’t have any revenue and trades only 50,000 shares per day, you
shouldn’t short stocks like this. Where possible, stick to the largest and most liquid stocks only.
When trading derivatives, use a % of your account position sizing rule, don’t over leverage your
account, the volatility in your trading account will become unbearable. The first goal of any
investment program is to preserve your capital, next is to reduce account volatility then your aim to
grow your capital above the risk-free rate offered in bonds. Focus on not exposing your account to
great risks and the growth will come naturally. Good trading is all about being defensive,
conservative and taking calculated risks.
Finally, be careful of the news surrounding stocks when trading. Don’t place a trade several weeks
before an earnings announcement, or make sure you don’t have a position during the
announcement, because if a company surprises on delivered earnings compared to what analysts
and market expected, the stock price can and often does move large amounts. Use yahoo finance
and earnings.com to check for stock news and upcoming earnings announcement dates.
5.1 Trouble shooting Installation Issues
Sometimes getting PTF installed for the first time can be tricky, this isn’t due to our software, rather
the strict system requirements set by Microsoft SQL, the database program PTF plugs into. SQL is
very strict because it is mostly used by companies which house sensitive data they don’t want
employees to have access too. You have to be the computer admistrator for full rights to be able to
install SQL correctly.
The most common issue with users installation issues, is downloading the wrong SQL version
relevant to their operating system, please check section 1.3 of this user manual for instructions on
how to correctly identify your operating system and the relevant SQL version to install.
If you are having installation issues, please don’t hesitate to contact us at
[email protected] and we will respond to you very quickly with a possible solution to
your issue.
If you would like, we also offer remote installation of our software on your computer, we provide
this service free of charge.
5.2 Troubleshooting Running Issues in PTF
Pairtrade Finder is a very stable software program, which has been used for several years amongst
thousands of traders. Most issues are due to local computer settings or something the user has done
out of the ordinary.
For most issues, you can find answers at our support forum in the Q&A section at
www.pairtradefinder.com/forum
The most common issue with users from European or other non-US counties, is not being able to
add stock codes, this is due to your computer date format not being compatible with PTF date
format. To fix this issue, open your control panel, click on global and regional settings, then change
your date format to MM/DD/YYYY and re-start PTF and try again, if that doesn’t work try changing
your date settings to DD/MM/YYYY and re-start again. Also you may wish to change your default
currency to $ and use 2 decimal (.) places.
If you find your software crashing during start up or a back test, you most likely have too many pairs
saved in your home page or are back testing too many stocks at once. Due to the large amounts of
data PTF crunches, you have to be aware of your computers limitations.
If you have any other issues running PTF properly, please don’t hesitate to contact us at
[email protected] and we will endeavour to help you at the earliest convenience.
5.3 Troubleshooting Data Issues
By default PTF uses free data automatically imported from yahoo finance. Data from yahoo finance
comes from CSI data, a large reputable data company. 99% of the time it is reliable, even more so
with large, liquid stocks. With smaller stocks the quality isn’t so high, this is the give and take of free
data. If you want 100% reliable clean data, you will have to subscribe to a data subscription from
IQfeed as per section 3.1 of this user manual.
If you see large spikes in your price charts, one or more of your stocks may have become corrupted,
this doesn’t affect the trading signals at all, only the price chart. To fix this issue, simply delete the
pairs, and the related stocks, then re-add the stocks back into the system. If you wish to force a new
data grab for all of your pairs please follow instructions from Q&A thread ‘’my price charts have
large spikes in them’’ found in our support forum www.pairtradefinder.com/forum
Apart from that, data is quite reliable and stable in PTF, our software runs very smoothly and
efficiently.
If you have any other data issues, please don’t hesitate to contact us at
[email protected] and we will endeavour to help you at the earliest convenience.
6.1 Useful links to aide your Pair Trading
www.iqfeed.net/pairtradefinder - Quality, reliable and clean data you can import into PTF.
www.mechtrading.com/qcollector/dtn/index.htm - A cheap and simple program you can use with
your IQfeed subscription to be able to download historical data into MSCII or CSV format, so you can
import into other software programs or a spread sheet. You can download data in any time interval
(1min, 18min, 1day, etc..) and going back 10 years for some instruments.
www.yahoo.com/finance - Possibly the best free finance website on the net, you can type in just
about any code for any instrument around the world and pull up charts and analysis for. Use yahoo
finance to check for any stock related news that may be affecting the price, upgrades/downgrades,
earnings, take overs, won/lost contracts, litigation, earnings guidance, CEO appearances.
www.pairtradefinder.com/forum - Our own forum for PTF users to converse with one another.
Please don’t forget to email us after joining to confirm your user name so we can activate it.
www.earnings.com – A free service for traders to look up earnings announcements dates for US
stocks, you don’t want to place trades right before an earnings announcements, this is the place to
check for that.
www.interactivebrokers.com – Possibly the best online broker in the world. Available to traders all
over the world, you can trade over 80 different markets all from one platform. IB has the cheapest
overnight financing rates and commission fees than other online brokers.
To see a full list of useful links please visit www.pairtradefinder.com/articles.php
6.2 Automating PTF
You can have the trading signals in PTF automatically sent to your Interactive Brokers trading
account.
To learn more please visit www.pairtradefinder.com/automated.php
This concludes the Pairtrade Finder user manual.
We hope you enjoy using our software and are certain it will be a valuable tool to improve your
trading for many years to come. You have 30 days to use our software before the free trial will
expire, you cannot download another free trial as our system recognises your IP address and blocks
it. You will need to purchase a license key before you free trial is over to continuing using our
software.
With every lifetime license, you don’t just get the best pair trading software available, you also get
ongoing upgrades and support from a team of professional traders and programmers.
If you have any questions or suggestions for us please don’t hesitate to email us at
[email protected] and we would be happy to help you.
We look forward to you becoming part of the large and growing online pair trading community.
The team at www.PairTradeFinder.com