1
ECE499
Design Report
Winter 2015
Statistical Data Analysis in Soccer using GPS Tracking
John-Paul van Essche
March 17, 2015
ECE499 – Electrical Engineering Capstone
Advisor: Steven Gustafson GE
1
ECE499
Design Report
Winter 2015
Report Summary:
The Senior Capstone Project is the culmination of over three years of
undergraduate electrical engineering instruction along with prerequisite courses in
mathematics and physics. The diligent study of these concepts has allowed for the
application and design of a project that combines a passion for both electrical engineering
as well as soccer.
The overall design goal of this project is to produce a position tracking system for
soccer players on field with a clear intention of providing a data map to their on field
positioning and the distance they travel during a training session. By tracking the precise
movement of an individual player on the field, data can be retrieved to identify whether
or not the player is playing in their position adequately. After a training session or game,
software can then provide a data map of players indicating where the individual was
located over the course of their particular play. In higher-level competitions and
professional soccer, having this clear-cut data can be the difference between a win and
loss as many players have different strengths that suit to their style of play and position.
Additionally, powerful data analysis can assist managers and coaches to summarize the
behavior pattern of both the competitor and home team. With statistics regarding each
player, calculated predictions can be made and an individual’s weaknesses can be
identified.
Having specific data allows coaches to come up with precise strategies for
individual athletes to improve themselves, as well as game plans to maximize the strength
of the team to counter their opponents. During a session, each individual player will have
a location recognition device attached to either their shirt or around their arm. Within
2
ECE499
Design Report
Winter 2015
soccer, certain players may have high work rates and be in great physical form, but they
may be playing either out of position or be too stationary, which is not always clearly
perceivable from a coach’s point of view. Ultimately, the objective of the position
tracking system is to provide managers and coaches with defined data that can be used to
determine which players can be placed into each position to maximize their performance
on the field. There is definitely a motivation to bring the technology to youth club
organizations as well as competitive soccer leagues to provide coaches with clear data so
that calculated decisions can be made on how certain players should be positioned.
Upon submission of this technical report, a GPS unit has been successfully
constructed and tested, which can be used for tracking of player movements in soccer.
The GPS module on the unit can log data on a player’s speed, distance travelled, and
position when a satellite fix is received. After filtering in the logged data, the software
displays the positional track of the player during a training session, while also providing a
speed plot and some practical statistics relating to soccer for the user.
3
ECE499
Design Report
Winter 2015
Table of Contents:
Chapter
Page
Report Summary ................................................................................................................ 2
Table of Figures and Tables ............................................................................................... 5
Introduction ........................................................................................................................ 6
Background ........................................................................................................................ 9
Design Requirements ....................................................................................................... 14
Design Alternatives .......................................................................................................... 19
Preliminary Proposed Design ........................................................................................... 22
Initial Design and Construction ........................................................................................28
Final Design and Implementation .................................................................................... 30
Performance Estimates and Results ................................................................................. 41
Production schedule ......................................................................................................... 45
Cost Analysis ................................................................................................................... 47
Discussion, Conclusions, and Recommendations ............................................................ 49
References ........................................................................................................................ 52
Appendix .......................................................................................................................... 53
User’s Manual ...................................................................................................... 53
Code ..................................................................................................................... 55
4
ECE499
Design Report
Winter 2015
Table of Figures and Tables:
Figures:
Fig. 1: Position Tracking of Players .................................................................................. 7
Fig. 2: Top-Level Block Diagram of Proposed System ................................................... 23
Fig. 3: GPS Module connection to Arduino ..................................................................... 24
Fig. 4: Layout of Software Output including Performance statistics ............................... 26
Fig. 5: Soldering the shield with pin headers ................................................................... 32
Fig. 6. Schematic of the Adafruit Ultimate GPS Shield .................................................. 33
Fig. 7: Diagram of finalized GPS Unit in enclosure ........................................................ 35
Fig. 8: Raw GPS Data “NMEA Sentences” ..................................................................... 36
Fig. 9: Tab-delimited $GPRMC and $GPGGA data ........................................................ 37
Fig. 10: Tab-delimited $GPGGA fix data ........................................................................ 38
Fig. 11: GPS Column data imported to Matlab ................................................................ 38
Fig. 12: Importing Variable Name Data ........................................................................... 39
Fig. 13: $GPRMC and $GPGGA Variable Names .......................................................... 39
Fig. 14: 50 Yard Sprint on Bailey Field ........................................................................... 42
Fig. 15: Test Statistics from 50 Yard Sprint ..................................................................... 43
Fig. 16: Training Session Field Data ................................................................................ 43
Fig. 17: Test Statistics from training session ................................................................... 44
Fig. 18: Initial Design Project Schedule ........................................................................... 45
Tables:
Table 1: Design Requirements ......................................................................................... 18
Table 2: Implemented Schedule for Senior Design Project.............................................. 46
Table 3: Component Expenditures ................................................................................... 47
5
ECE499
Design Report
Winter 2015
Introduction:
In competitive soccer at the club and varsity level, it is very difficult for managers
to assess every player on the field equally as each player is moving concurrently in a
specialized position. In a match, managers and coaches are not able to keep track of all
eleven players at once. My project aims to provide greater insight to coaches in their
decision-making in order to assess players better on the field. By having quantifiable
data regarding each player, coaches can make more informed decisions on who to include
in the starting lineup and how players can improve their positioning on the field. Because
each player is assigned to their position and expected to complete a specific task, it can
be challenging to pinpoint distinct strengths and weaknesses in a player’s game.
First, every competitive manager has a different approach to how they want to
their team to line up. If an individual player does not meet the requirements of a
manager’s system, they are likely to be assigned to a role on the bench, but if a player can
capitalize on their opportunities consistently, they will be given a starting roll. At the
competitive level, the conventional team formation is a 4-2-3-1, which consists of four
defenders, two defensive midfielders, three attacking midfielders and one forward. Each
player at the competitive level has considerable experience and is assumed to meet their
assigned position. A defender’s task is to keep the ball away from opponents in a
protective manner and prevent the opposing forwards from passing and receiving the ball.
Defending requires individual players to work hard, be quick to anticipate the movement
and passing of opponents, and position themselves as to not allow ample space to pass for
the opposing team. Midfielders tend to be well-rounded players; however, their task
requires greater running and movement, as they have to bring the ball up and prevent the
6
ECE499
Design Report
Winter 2015
ball from reaching their defenders when dispossessed. Forwards are positioned closest to
the opponent’s goal and they have to be able to distract defenders and receive the ball
well to create scoring opportunities by positioning themselves properly. Individual
positioning is very important as players need to be able to make runs into open space to
receive the ball and position themselves correctly as to not allow the opposing team to
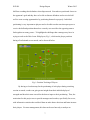
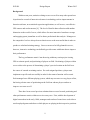
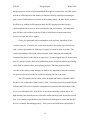
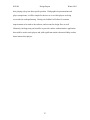
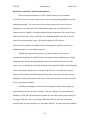
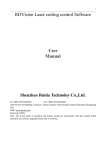
link together too many passes. To highlight the challenge that a manager may have in
trying to track each of his eleven field players, Fig. 1, which tracks player positions
during a Professional soccer match, can be observed below.
Fig. 1: Position Tracking of Players
By having a clear data map for the positioning of each player during a training
session or match, coaches can gain greater insight about their individual players’
strengths and how their team can utilize the data to improve their positioning. Thus, the
motivation for this project was to provide managers and coaches, specifically for soccer,
with informative statistics that could aid them to make better decisions and better instruct
their players. For team management, this data can be used not only to analyze an
7
ECE499
Design Report
Winter 2015
individual player’s performance, but also to provide team-wide data to see how much the
team is moving together as a unit when they possess the ball. The data can then be used
for managers to ascertain which players are faltering and strive to help them regain their
form, based on the combined individual and team data.
The overall objective is to provide greater insight to coaches in their decisionmaking in order to assess players better on the field. Due to the quick, aggressive pace of
the matches in higher-level competitions, managers and coaches are only able to clearly
focus on a group of players and they are not able to track each player’s positioning
simultaneously. Data regarding the speed of player’s movements, as well as their
proximity with each other, can clearly assist coaches and allow them to make betterinformed decisions.
The remainder of this design report is organized comprehensively as follows.
First, the paper focuses on the history of statistics in European football (soccer), and
discusses the different technologies used to gain viable performance statistics in soccer.
Second, the design requirements section outlines the specific requirements and
components that the design must satisfy in order for the system to be useful for coaches.
In addition, the design requirements detailed the design process and goals as well as
potential costs. Third, the next section examines the alternative designs and technologies
considered for each component of the system. Fourth, the preliminary proposed design
section explains the complete design of the system and its underlying components and
parts. The project specifications will be presented in a comprehensive manner, as to gain
a full understanding of the general concept of the project.
8
ECE499
Design Report
Winter 2015
Background:
Within recent years, statistics relating to soccer as well as many other sports have
skyrocketed as a result of innovative advances in technology such as improvements in
detection software, new statistical regression applications, as well as new, cost-effective
GPS sensors and accelerometers [4]. The level of detail in data collection adds another
dimension to the world of soccer, which allows for more innovative broadcast coverage
and engaging sports journalism as well as better professional data analysis. Managers at
the competitive level are always keen to obtain access to the most useful data in order to
produce a calculated winning strategy. Success can never be fully planned in soccer;
however, innovative technology can definitely provide teams with better data to improve
their performance.
The key performance metric I am observing within my senior project is using
GPS to estimate speed, and positioning of players on field. Positioning of players within
soccer refers to the process of determining a player’s precise location on the field over
the course of a match or training session. For each assigned position, a player must
implement a specific task successfully in order for the team to function well as a unit.
Each manager has a different playing system, which may not cater to every player at first,
but having a better sense of positioning on the field can educate players on how to
improve as a team as well.
There have been several previous solutions that were used to track positioning and
other performance metrics within soccer in recent years. First, with the development of
digital camcorders in the early 1980s, managers and coaches of teams have used video to
watch replayed games and observe which players are playing in their respective positions
9
ECE499
Design Report
Winter 2015
properly. Watching recorded games can certainly allow coaches to get a better sense of
their team strengths and weaknesses; however, the one clear limitation to watching
recorded gameplay is that it can be very tedious and not conducive for time. By being
limited to watching recorded gameplay numerous times to accurately analyze each
player, managers are also limiting their teams to time that could be better spent
implementing specific training drills and instructions in practice.
Another example of positioning technology using for statistical performance data
is radio frequency identification (RFID). RFID is essentially data collection technology
mainly used for object identification and tracking, in which the system is comprised of a
reader module, which modulates data and commands into an RF signal, as well as an
antenna for signal transmission [3]. Most RFID tags have many capabilities and can be
very practical; however, their clear limiting factor is their range and they tend to be on
the expensive side. Another main constraint of RFIDs is tag distribution on accuracy and
precision of passive RFID positioning systems are tag density and tag distance. The read
range of the RFID system depends on the frequency, in which the range generally
increases as the frequency increases. Active RFIDs, which contain built-in batteries,
have greater range in comparison to passive RFIDs, which do not have a built-in energy
source; however, they are not as cost-effective as other sensor devices and require a
permit to operate as well. Clearly, for RFID to function, a user must be within range of a
RFID reader, and both the user and the reader must be operating on the same frequency.
In early 2012, local Bundesliga soccer clubs in Nurnberg, Germany, implemented
and tested an RFID-based system provided by the Fraunhofer Institute for Integrated
Circuits (IIS), that follows the movements of players and balls in order to provide
10
ECE499
Design Report
Winter 2015
training data as well as automated score-keeping [7]. The RFID system developed,
known as RedFIR, essentially provides team managers and trainers on how well players
perform, and whether they may require additional guidance. With the RFID system, each
player wears one or more battery-power RFID tags, which can be attached around one or
both of the player’s ankles, over the shin guard, or attached to the individual’s shirt.
Each device transmits a unique ID number at a high frequency, using a proprietary airinterface protocol or set of standards that govern communication systems such as RFID.
The readers positioned around the field capture each tag’s 2.4 GHz signal, and then
forward the specific ID’s location to a nearby computer. The Fraunhofer software then
calculates each device’s location based on triangulation and the time difference of arrival
(TDOA) for each tag. The software can then provide data indicating where players are
located at any given time during a game, and can enable coaches and referees to better
understand what occurred during particular plays. In addition, the software displays a
map of the field, with an icon displaying each player and the ball, which can be reviewed
further by team management and trainers. The RFID system developed by Fraunhofer
offers team managers a viable solution to determining how well each player performs
during a game, which can be used during practice to help team members with training;
however, implementing the RFID system requires a substantial amount of hardware and
can cost tens of thousands of dollars, which certainly exceeds the budget of most nonprofessional competitive teams.
For the 2014 World Cup in Brazil, the German Football Association (DFB)
worked in collaboration with SAP Match Insights, to develop a high-performance
analytic appliance tool to analyze players by processing vast amounts of data from video
11
ECE499
Design Report
Winter 2015
footage [9]. Video footage is captured from 8 on-field cameras and thousand of data
points are generated. The data is converted into simulations and graphs viewable on a
tablet or computer, enabling coaches and players to identify and assess key metrics such
as player speed, position and possession time in each match. These insights were then
used during pre-match preparations to improve player and team performance.
In addition to enabling the German team to analyze its own performance, SAP
match insights can help coaches and players to identify opponent’s strengths and
weaknesses, as well as inform defensive tactics [9]. With this information, coaches can
employ specific strategies for individual players to improve themselves, and maximize
the team as a unit to counter their opponents. Like the RFID system presented before, the
software can extract data on individual players, and present it in an easily viewable and
intuitive form, so that coaches can assess the tempo and position of players quickly.
Again, the main overall problem is that most team managers at the competitive level do
not have access to such technologies that allow for accurate sensing of players in an
intuitive manner. These products are sustainable for the future, but they cater to the
professional market, which decreases the availability for those at the non-professional
competitive level.
Opta, a sports data company headquartered in London, provides a wide variety of
data feeds on performance data by working with premier sports broadcasters, who have
access to high definition cameras with superb frame rates [6]. For each event logged, a
series of descriptive statistics is added: a pitch coordinate, each player and team reference
as well as a time-stamp. These variables enable Opta to provide hundreds of statistics on
where events occurred, which players were involved and when they took place. Opta’s
12
ECE499
Design Report
Winter 2015
attention to detail and range of information on every ball contact is the largest available
from any provider; however, it is only accessible through high definition broadcasts,
which are not clearly not attainable at every level for competitive soccer. Opta’s
comprehensive statistical data can provide a well defined level of analysis and insight
that can support editors and commentators as well.
A cost-effective, viable alternative to the solutions provided is to utilize a Global
Positioning System (GPS) for obtaining the precise location of player on field on time.
The GPS system consists of a cluster of 35 navigation satellites, with 24 satellites active
at any given time, for easy accessibility [1]. GPS technology allows for exact coordinates
of an individual’s current location over a certain time span. By listening in on more than
three satellite transmissions, a GPS system can triangulate a specific location on Earth.
Most GPS modules are more accessible than ever and further developed, which allows
for GPS systems to be used successfully as a position tracking device. The update rate of
a GPS module is important, as it is the frequency at which the device recalculates and
reports its position. The standard frequency for most devices is only 1 Hz, but moving
vehicles and other high-speed uses may require faster update rates to have accurate
measurements. A fast update rate may provide greater accuracy, but may overwhelm
some microprocessors trying to parse that much data in a given time sample. In addition,
differing GPS modules of varying frequencies may consume more power; thus, it is
important to determine the specific power usage of the device before attaching a batterypowered source. Overall, utilizing GPS reduces the costs of the overall system while
eliminating the need for building specific hardware components.
13
ECE499
Design Report
Winter 2015
Design Requirements:
In order for the system to be able to provide a practical service to the end user, i.e.
team manager or coach, the system must meet or exceed certain specified design
requirements. In this section, the system behavior will be described and specified, as
well as the main objectives of the project. This will help to define what entails a
successful project, allowing for clear identification when the goal has been reached.
Functional Requirements:
The most fundamental requirement or goal is that the system must be able to give
coaches a clear visual of a player’s movement and give them a few indicators to a
player’s performance on the field. The overall system should provide key data points
regarding player position, change of direction, speed and total distance traveled during
the course of a training session. For a training session, the user should not be expected to
be able to identify the differing performance metrics for each player, so the system must
be readable for someone who does not have prior technical knowledge in engineering or
computer science. An important requirement that may be more difficult to quantify is
that the system must be easy to use. A new user should be able to power on the device
and use it without a great deal of training. This requires that the system provide basic
functionality with no input from the user whatsoever. The system must also be accurate
and be able to detect precisely when players make high intensity runs and their position,
even at a higher speed to test real playing conditions. During pre-match preparations,
these insights can then be used to improve both player and team performance.
The GPS receiver will be attached to the arm or shirt of a player by armband and
will log the position of each of the players with the device over the course of a training
14
ECE499
Design Report
Winter 2015
session or a pre-match practice. The GPS receiver must provide accurate positioning
within +-3m, otherwise managers and coaches will not be able to successfully analyze the
data points regarding their players. Since GPS measurements are affected most by
changes in vertical position, measuring position on an outdoor soccer field will be the
best-case scenario for trying to obtain optimal data. The GPS module will have to be
attached in a way so that the receiver faces upward towards the sky for best results. For a
field test, two players can run in a straight line with the GPS device and the linearity of
the data points can be assessed to observe whether the device is accurate or not. A visual
representation with scattered plots from side to side will indicate that GPS module is not
functioning at its best, while linear movement will represent that the device is functioning
better.
In addition, the GPS module has to have a sufficient refresh rate in order to track
the speed of the players. A higher refresh rate may be required to have better accuracy as
players move around quickly, but a greater frequency may also overwhelm the
microprocessor being used to process and analyze the incoming data. A microcontroller
or development board will be necessary in order to evaluate the position data received
from the GPS sensor. For the specific microcontroller and GPS module, a sufficient
battery source will have to be used in order for adequate power of both connected
devices. A higher frequency for the GPS receiver may lead to greater battery usage, but
the accuracy of the data is expected to be greater. Without ample battery life, the GPS
package will not function for long enough to yield significant statistical data and results
for team managers and coaches. In addition, the GPS package has to have enough
memory for data collection over a period of approximately 1 hour. A typical scrimmage
15
ECE499
Design Report
Winter 2015
during a practice session will last around half the length of a match; thus, the GPS system
must have sufficient power and memory to function correctly and help team managers
gain a sense of which players to include in their starting lineup. In order for the system to
be effective in yielding useful aggregate data, the GPS package must have proper
connection from the receiver to the microcontroller and power source. All component
pins will have to be soldered correctly to form a solid electrical connection so that
devices can send and receive signals.
Clearly raw positional data is meaningless to the end user, regardless of how
accurate it may be. Therefore, the system must also have the ability to provide the user
with a visual representation or field map of a player’s current location over time. The
visual representation will include clustered points, with each point representing the
location of the player on the field at an exact time. By observing the specific location and
time of a group of points, data can be gathered on player movement and their positioning
on the field in relation to their given playing position. The data points should be
viewable to the coach or team manager, in which a few important performance statistics
are given to alleviate decisions for coaches on playing time for each player.
The GPS system must be robust, and be designed and built to withstand a fall if
the device was to disconnect from a player’s shirt. An enclosure must be provided for the
Arduino and GPS receiver so that the components are protected and remain intact if the
device is to withstand a fall. If the device is not robust and being used on players for
high-intensity runs, then the device will not be reliable and may break down after several
uses. It is certainly required that several field tests are undergone to ensure that the GPS
device is evidently functioning properly. If the system can fulfill these requirements, it
16
ECE499
Design Report
Winter 2015
will provide a useful and instructive service to team managers and coaches. A main
requirement is that feedback from coaches is given regarding what statistics are the most
important to differentiate between players at the competitive level.
Secondary Requirements:
Secondary or minor requirements include that the system should be affordable
and easy to duplicate so that the technology could be used across a number of playing
fields. The individual components must be purchased in order for the system to be
simulated, built and tested. In order for the system to be used as intended, it must be
lightweight and portable, which limits both its size and weight. Ideally, the GPS system
should be light enough to not be obstructive in any way when attached to a player’s shirt.
An alternative, secondary goal is to have a Bluetooth receiver connected to the
microcontroller so the individual analyzing the data can simply bring their laptop to the
field to quickly acquire specific information after a practice. By having a wireless
design, the overall system is more approachable for the end user as only a computer and
GPS package are required to collect and read the data. Ultimately, the overall system
should be modular as well so that a technical user can add additional features or even
remove some of the included features. The GPS package should be able to be redesigned
and rebuilt by the developer as well if any problems do occur. In addition, the overall
design should be shown to a coach to gather feedback and input from a potential user of
the system.
Feedback from Coaches:
Before testing and calculating performance statistics using the GPS unit, a
primary requirement in the project was to acquire some feedback from experienced
17
ECE499
Design Report
Winter 2015
soccer coaches. I interviewed the head women’s soccer coach, Brian Speck, and the
men’s soccer coach, Jeff Guinn, for some feedback on which statistics can are most
valuable for improving team performance. The most vital performance estimate
determined by the two coaches was distance travelled by a player, as it is a good indicator
to the extent of how much a player contributes to the team. Another valuable
performance indicator was a player’s work rate or positioning on the field. Having a
higher work rate or higher rate of movement leads to players tracking to the ball more
when not in possession. Speed of players was also important, but the statistic was easier
to gage as it is usually clear who is fastest during training sprints. Coach Speck, who had
years of experience coaching at the Division III level, noted that there had been a video
tracking solution used at the University of North Carolina, which can track the number of
touches a player has and records which direction they occur in. The direction in which a
player makes passes and runs was another good indicator of player performance. Table 1
below displays the main and secondary requirements for the design project.
Table 1: Design Requirements
Primary Requirements
-Display position accurately within 2 m
-Robust encasing and attachment
-Adequate Battery Power
-Programmable Microcontroller
-Sufficient Memory
-Intuitive User display or output
-Feedback from coaches on design
-Sufficient refresh rate for GPS module
Secondary Requirements
-Bluetooth Integration
-Affordability of the prototype
-Modular system
-Minimize Device
18
ECE499
Design Report
Winter 2015
Design Alternatives:
The fundamental, technical challenge associated with this project was positioning,
as it was the area in which the most energy was devoted to evaluating alternative designs
and technologies. For accurate movement and positioning, GPS is the most affordable
solution in addition to being widely available and developed. There were other
positioning systems seriously considered, but none were as cost-effective and developed
as GPS technology.
RFID was one considered system that presented an interesting approach to
solving the problem that team managers have when trying to assess each player
accurately and impartially. The technology has been developed further in recent years as
receivers produce stronger signal and the read range of RFIDs has increased
considerably, which allows for precise tracking within a given range for moving objects.
With active RFID systems and state-of-the-art RFID software, an exact trace of an object
or individual’s movement can be obtained, but the technology is not easily accessible and
RFID users have to follow certain policies, in which certain RFID equipment must be
licensed in order to operate. RFID tags have been used in professional soccer teams to
gain a distinct advantage by tacking the precise movements of players, but purchasing
such devices are too expensive for a design at the competitive level.
GPS was the most viable design alternative due to the fact that GPS systems have
been used for tracking high speed movements and significant data analysis in the past.
Recent technological improvements have made GPS tracking a convenient and popular
method to quantify movement patterns and physical demands in sports [8]. GPS modules
are reasonably inexpensive and do not require a permit to use. In addition, intuitive GPS
19
ECE499
Design Report
Winter 2015
modules have been designed with software libraries for quick access to readable,
positional data. Several companies have built GPS units that are compatible with
Arduino development boards to obtain data smoothly regarding key performance metrics
for coaches. The only disadvantage to GPS technology is that there are realistic
constraints that can affect the accuracy of the output data. If a GPS module is utilized in
an urban environment with tall, concrete buildings, that data can be altered. GPS units
can also be affected by the direction to which the ceramic module is positioned. Overall,
there are a few limitations for GPS; however, the technology is accessible and allows for
the use of intuitive, development microcontrollers.
An interesting approach to increase the accuracy of positioning would be to gather
three different occurrences of training session for a player, and then access the data in
MATLAB for statistical analysis. The data could be graphed for each training session,
and the average of the three sessions could be observed as well. Specific performance
data could be gathered on players of differing positions to observe the physical demands
of each position. Clearly, soccer at the competitive level requires players to cover a
substantial distance, but positional data regarding distance ran and number of rapid
accelerations for each position could give coaches crucial information that may lead them
to alter their playing style and team formation.
Additional applications include having the user wear multiple GPS units, and then
taking an average of the data set in Matlab for better precision. The GPS prototype could
be used for players in different positions on the field to provide coaches with clear
statistical data on player work rates. The data provided from GPS can give a detailed
description of player movement demands and can assist teams from a tactical view point.
20
ECE499
Design Report
Winter 2015
By observing the movement patterns of players via GPS, key information regarding
distance, running speed, number of surges, mean velocity as well as the differences
between fixed position players and nomadic players can be studied.
Ultimately, the implications are that team managers can use the device to gain
valuable information on players and better understand how their team performance can be
improved. Through GPS monitoring, team managers and top-level officials can
objectively evaluate trends in the game and the impact of playing demands for each
position. Further work is required to describe movement patterns in the dynamic
environment of soccer and key game indicators such as positioning and decision making.
21
ECE499
Design Report
Winter 2015
Preliminary Proposed Design:
The proposed design, which is essentially a performance data positioning system,
will allow for managers and coaches to gather statistical data over the course of a training
session and then analyze the collected data regarding each player in a timely manner.
After a training session or practice is complete, a team can analyze this data on a
computer to customize training and prepare for the next match. The data will essentially
consist of positional data points with specific points indicating the exact time and
position of the player during a practice. Given the exact positions over time, coaches will
be able to observe whether or not their players are playing out of position or not and what
can be done in training to improve the team. Ultimately, the main objective of the
position tracking system is to provide managers and coaches with clearly defined data
that can be used to determine which players can be better positioned to maximize their
performance on the field.
The overall goal of the project is to utilize a GPS sensor to track the position of
players on field during a training session to gather specific data that could be used to
quantify which players are either playing out of position or not contributing to the team
enough. Each player will receive a small, encased GPS package including a sensor,
microcontroller and method of power. The system will be attached to either the shirt or
arm of the player via an armband, and will collect data within seconds after being
powered on. Data regarding the speed of player’s movements, as well as their proximity
to each other, can provide managers with the key insights needed in order to maximize
team performance. The aggregate data can then be converted into simulations and graphs
viewable on a computer, enabling coaches and players to identify and assess key metrics
22
ECE499
Design Report
Winter 2015
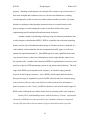
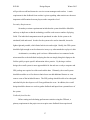
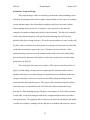
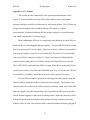
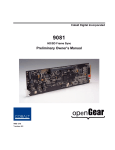
such as player speed, position and total distance traveled. A top-level block diagram of
the overall system can be seen as follows in Figure 2.
GPS Subsystem
GPS Module
Arduino
Microcontroller
Bluetooth/USB
Computer
Power Supply
Figure 2: Top-level Block Diagram of Proposed System
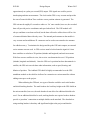
The project will consist of a GPS subsystem package, which is comprised of an
microcontroller, battery pack, GPS receiver, and GPS shield connector, which links the
Arduino to the GPS receiver. A microcontroller or development board will be necessary
in order to evaluate the positional data received from the GPS sensor. The specific
microcontroller chosen will be the Arduino Uno R3 board, which is a great, intuitive
development board with a USB input as well. USB connection will be used initially to
capture the data from the GPS sensor; however, Bluetooth connection would provide
greater accessibility to coaches after a training session, as the technology is wireless.
The GPS receiver will be attached to the arm or shirt of a player and will track the
position of each of the players with the device over the course of a training session or a
pre-match practice session. The GPS module must clearly provide accurate positioning
for managers and have a sufficient refresh rate in order to track the high-intensity runs
23
ECE499
Design Report
Winter 2015
that player make. The particular, chosen GPS device was a 66 channel GPS module,
which had a refresh rate of 5 Hz, or 5 times per second, for better data collection.
To power the microcontroller and GPS sensor, one standard alkaline 9V battery
rated at 590 mAh will be used. The supply is more than sufficient to power the
microcontroller for and is regulated to 5V when fully charged. In addition to powering
the microcontroller, a micro SD memory card will be necessary in order to store the
collected data since the Arduino only has a storage space of 32 KB. For the overall
project, the aim is to have 2 GPS packages so different players can be analyzed and
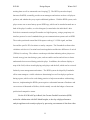
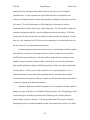
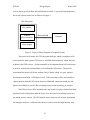
compared for work rates and position. The GPS subsystem, which contains the GPS
receiver with a micro SD input, shield kit, and Arduino Uno R3 can be observed below.
Note that the battery pack is not attached to the subsystem in the following diagram.
Figure 3: 66 Channel GPS Module Shield Kit connection to Arduino
After designing and constructing the prototype which will be used during the
testing phase of the design project, it is important to review over what will be measured
as well as what the testing conditions are. The purpose of the final installation test is to
24
ECE499
Design Report
Winter 2015
determine that the system is both functional and accurate. For professional match
standards, there is a guarantee for both the client and the competition organizer that the
system has been installed correctly; however, there are a multitude of “field” tests that are
undergone to ensure that the system is evidently functioning properly. The same
guarantee should be required for the competitive level as the data being collected on
players should accurately match their actual performances.
In addition to having the specific hardware components aforementioned, the
system must have an intuitive, simple user interface so that the process in which a
manager observes the data can be expedited. In order for individual circuits to swap their
information, they must share a common communication protocol. The specific software
language for programming the microcontroller utilized will be the Arduino language, in
which no specific drivers will have to be installed for coding to work. The proper board,
serial port and tools will have to be selected on the Arduino application in order to
connect to the microcontroller and upload the programmed code. When the GPS unit and
microcontroller are connected properly to the computer, the GPS module will start
sending coded positional data even if the module is not fixed. Thus, the GPS module will
have to be directly outside in order to get a fix on a satellite. When the GPS module is
fixed, valid data will be sent to the microcontroller and stored on the memory card. The
GPS module will output sentences in a specified format, which can then be used to
determine location and speed at each time interval. The output sentences can then be
extracted in which the data is read, stored and parsed in order to understand the positional
data. Having a micro SD card will allow for more data to be collected as well as allow
for a greater update rate, which takes up greater memory. In order to interface the
25
ECE499
Design Report
Winter 2015
hardware and execute a successful GPS system, the Arduino microcontroller will require
a fundamental understanding of coding and how to read the output sentences from the
GPS module.
The software will essentially send all strings of code received from the GPS to the
computer; however, the specific coordinate data output will not be readable. In order to
adequately provide data for coaches, the data needs to be readable and useful. The
coordinates will be output as NMEA sentences, which will need to be converted to
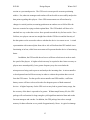
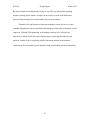
decimal form for a user to understand the data. Specific performance analytics outputs
will be player position tracking, total distance traveled, the number of high-intensity runs
a player makes, average speed, and average position. A layout of the specific software
output is shown below, in which the coach will be able to see a field diagram with points
relating to where a player was over the course of a scrimmage during a practice. Given
these specific points relating to a player’s position, a coach will be able to conclude
whether a player is too stationary or running around too much given their position.
Figure 4: Layout of Software Output including Performance statistics
In addition to having a diagram tracking a player’s position over the course of a
training session, graphs could be utilized to compare each player on a team and contrast
26
ECE499
Design Report
Winter 2015
their playing style given their specific position. With graphical representations and
player comparisons, it will be simpler for the user to view which players are being
overworked or underperforming. Having user feedback will allow for constant
improvements to be made to the software, and account for design flaws as well.
Ultimately, the long-term goal would be to provide coaches with an intuitive application
that could be used to track players and yield significant statistics that would help coaches
better instruct their players.
27
ECE499
Design Report
Winter 2015
Initial Design and Construction:
Once the necessary parts were obtained to start the project construction, the first
three weeks were begun constructing the design and works towards designing a
prototype. By week 4 of the winter trimester, a functioning prototype was constructed
and field tests were performed on the sensor to analyze the accuracy of the positional data
and what could be improved. The main limitations were how much time the GPS
subsystem could run given the 9V battery power supply and how much memory was
taken by the collected GPS data on the Arduino in roughly 45 minutes; thus, a microSD
memory card was required to be used in sufficient memory storage for a training session.
The following week consisted of collecting data and what could be done to improve the
system user-friendliness of the overall GPS package. The software should be designed
and analyzed throughout the winter term to improve the display output for the user. The
software extracts data on individual players, and presents it in the form of digital
personas, so that it is easy to distinguish between differing players for coaches. In
addition, a robust, protective encasing should be produced for the GPS package so that
the subsystem isn’t damaged if it were to fall. The final draft of the design should be
achieved by week 8 of the winter trimester to allow time for small revisions to the GPS
subsystem and maximizing the intuitiveness of the software to allow coaches to quickly
assess each player’s strengths and weaknesses.
Upon completion of the project, the final device including the software will be
able to collect data successfully and display the data intuitively when loaded onto the
computer. The prototype unit will provide greater insight on how the overall design of
the GPS package can be improved. The GPS package should be robust and all solder
28
ECE499
Design Report
Winter 2015
connections will need to be correct in order for the system to function properly. For each
component of the system, the pins within the circuit will have to be arranged correctly.
In addition, the coding required to complete the project may be extensive; thus, I will
have to account for the time the coding may take and draw out specific block diagrams
and state machines to gain a fundamental understanding of the code. Once the positional
data on a player is uploaded from the device, the software should be presentable and
allow for the user to easily view the speed of the player, the direction they travel and how
often they are making high intensity runs on the field. Overall, this project will be
considered a success if the system can provide useful, accurate data to coaches intuitively
at the competitive level to help them gain a better sense of how their team can be
improved as a unit.
29
ECE499
Design Report
Winter 2015
Final Design and Implementation:
In this section, the final implementation of the system will be presented in which
the components and functions are described. The final design is composed of a GPS
package with the main intent to provide the user with informative statistics on player
movements over the course of a training session or game. The design report is brokendown into two phases of development to meet the end goal of providing clear data for
coaches: hardware and software.
Hardware:
In order to function properly, any GPS module requires correct wiring or
soldering to both input and output pins. The Adafruit Ultimate GPS shield allows for
precise positioning without having to wire any components together, in which each shield
is pre-assembled and tested for the Arduino Uno. Although soldering is required to
attach the shield to the programmable microcontroller, the input and output pins are all
designed and set in an organized manner. The GPS module on the shield has a refresh
rate of up to 10 Hz, 66 channels and a very high sensitivity of -165 dBm. In addition, the
module draws only 20mA of current at a low power, which is half of most alternative
GPS modules. A 4 GB MicroSD card slot is used for GPS data logging onto a removable
card, which is sufficient as the largest text-files during testing only accumulated several
hundred kilobytes of data over a period of 30 minutes. The GPS module can retrieve a
fix at a multitude of locations; however, urban environments may affect the accuracy of
the recording and cause outliers in the GPS data.
Once the GPS unit has been activated by uploading the Arduino software and has
achieved a fix on the GPS satellites, the system generates a new position estimate
30
ECE499
Design Report
Winter 2015
approximately at a pulse per second (PPS) output. PPS signals are used for precise
timekeeping and time measurement. The clock on the GPS is very accurate and provides
the exact Greenwich Mean Time each time a new position estimate is generated. The
GPS unit needs roughly 45 seconds to achieve a ‘fix’ once outside; however, the recorded
data will provide precise coordinates and speed when fixed. The GPS module will
always send data even when not fixed, but the data will not be valid as there will be a lot
of comma-delimited data with only zeros. The internal patch antenna on the module is
very accurate and an addition u.FL connector can be used as an external active antenna
for added accuracy. To minimize the design and keep the GPS unit compact, an external
active antenna was not used. A GPS receiver must be locked onto the signal of a least
three satellites to calculate a 2D position (latitude and longitude) and track movement.
With four or more satellites in view, the receiver can determine the user’s 3D position
(latitude, longitude and altitude). Once the GPS user’s position has been determined via
satellite, the GPS unit can calculate other information, such as speed, bearing, and
dilution of position. The Adafruit GPS shield is highly recommended over the GPS
standalone module as the shield as it allows for connection to a microcontroller without
adding extra space to the project.
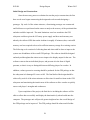
When soldering the GPS unit, two types of headers could be used: male headers
and shield stacking headers. The male headers don’t add any height to the GPS shield on
the microcontroller; however, the male headers do not allow for additional shields to be
used. For an additional shield to be used, stacking headers are required as these headers
provide a ‘pass-thru’ connection so multiple shields can be attached. The drawback to
using stacking headers is that they add significant height to the project and that the
31
ECE499
Design Report
Winter 2015
connections are not as strong due the headers being thinner, which can affect the GPS
unit since the microcontroller may shake around a bit at higher speeds.
Figure 5: Soldering the shield with pin headers
Different pin headers can be used for connecting a shield to an Arduino, but the
recommended pins are 2 x 8 pins, 1 x 6 pin and 1 x 10 pin, which equates to a total of 32
pins on the microcontroller. The most important pins for the recommending connect
setting are pins 7,8, and 13, which allow that the microcontroller is synchronized and free
for debugging and uploading scripts. Pin 13 provides a one pulse-per-second output from
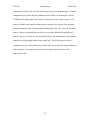
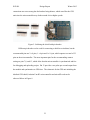
the module and synchronizes to GPS time. The schematic for the GPS unit including the
Adafruit GPS shield, Arduino Uno R3 microcontroller and microSD card can be
observed below in Figure 6.
32
ECE499
Design Report
Winter 2015
Overall System Diagram:
Figure 6: Schematic of the Adafruit Ultimate GPS Shield
The 9V battery provided sufficient power for testing over long periods of time as
the GPS unit draws very low power. It is difficult to determine how long the 9V battery
can provide power to the GPS unit because power consumption can be altered by a
number of factors. Battery power consumption will suffer at use for higher speeds as the
algorithm set to operate the GPS function will target the position accuracy of reporting
location. In other words, the GPS module is programmed to log precise position
estimates, rather than save battery life. In addition, different LED’s draw different
amounts of current, and the processor on the Arduino board will use more or less current
depending on how the program is written. The 9V battery is estimated at over ten hours
of usage when connected to the GPS unit, but the GPS unit is only using three LEDs
33
ECE499
Design Report
Winter 2015
(Power, Pin 13, and Fix Status) in addition to powering the module. Ultimately, the
longevity of the battery power source was never determined; however, the 9V battery
supply is more than adequate for the length of a match or training session. An RTC
backup battery (coin cell) is provided, in which a real time clock will automatically set
itself to the correct signal from a satellite. If the 9V battery source dies and the GPS
loses power, the time will have be reset until a signal is received again. With the RTC
backup battery, it will keep time even after a power loss. In addition, there are several
additional breakout pins that can be used to add any wiring to the GPS unit if necessary.
Two different GPS units were built for the design project: one required serial
USB connection and the other had Bluetooth capability. The advantage of the GPS unit
that required USB connection was that the design only used two shields and was
minimal, while the GPS unit with Bluetooth was taller and occupied more space. The
Bluetooth serial link module allowed for intuitive pairing and connection in which the
module can automatically detect and change the serial baud rate for the GPS module.
The only nuisance with the Bluetooth EZ-link was that the data upload time was greater
than that of a wired connection (up to 15 seconds for uploading).
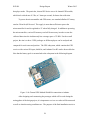
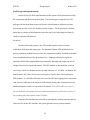
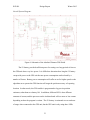
The GPS unit with USB connection worked better with the project enclosure that
could attach to a user’s arm as the unit could be inserted in the enclosure with ease. The
serial USB cable could be connected to the USB port on the Arduino in the enclosure.
The enclosure was used to secure the Arduino, GPS shield and 9V battery together when
shaking around at higher speeds. The Robustness of the system was difficult to
determine as any mishandling of the device was avoided to reduce the overall costs of the
project. An image of the finalized GPS unit in the enclosure can be observed in Figure 7.
34
ECE499
Design Report
Winter 2015
Figure 7: Diagram of finalized GPS Unit in enclosure
Ultimately, implementing the hardware to form a functioning overall system was
not as difficult as carrying out the software design, which took up the bulk of the project.
In order for the overall project to function, both the hardware and software had to
function properly.
Microcontroller and Software:
The Arduino microcontroller was chosen as the microcontroller for the GPS unit
because it is designed to interface with the GPS shield developed by Adafruit and
provides accurate GPS data, which can be filtered into Matlab.
The Arduino IDE software correctly shows how to listen to the GPS module in an
interrupt, which allows serial GPS data to be streamed. The algorithm correctly reads in
coordinate and fix data from the GPS and then logs the data into a text file on the
microSD card. Once the GPS module was tested with direct wiring of pins 0 and 1 to TX
and RX pads respectively for sending commands from the module to the USB port. The
35
ECE499
Design Report
Winter 2015
serial monitor from the Arduino IDE outputs the GPS data at a specified baud rate, which
can be used to test the connection from the module. The baud rate that I found best to
work was 115200 baud rate as the data was sent fast enough to display all of the raw GPS
data necessary. I chose to have a soft serial connection as opposed to having a direct
connection so that the main UART (Universal Asynchronous Receiver/Transmitter)
could be uploaded without having to use any wires. By changing the software serial
connection lines to pins 7 and 8, the Arduino IDE serial monitor was able to output and
log raw GPS data onto the microSD card. Logged GPS data from the microSD card on
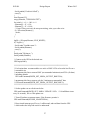
the GPS module can be observed in Figure 8 below.
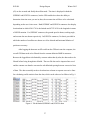
$GPGGA,035803.000,4249.1781,N,07355.6219,W 1,07,1.19,81.0,M,-‐33.6,M,,*63
$GPRMC,035803.000,A,4249.1781,N,07355.6219,W,5.74,18.14,210115,,,A*41
$GPGGA,035804.000,4249.1793,N,07355.6209,W,1,06,1.23,83.0,M,-‐33.6,M,,*6C
$GPRMC,035804.000,A,4249.1793,N,07355.6209,W,4.14,13.48,210115,,,A*41
$GPGGA,035805.000,4249.1794,N,07355.6207,W,1,06,1.35,83.5,M,-‐33.6,M,,*66
$GPRMC,035805.000,A,4249.1794,N,07355.6207,W,0.10,13.48,210115,,,A*49
$GPGGA,035806.000,4249.1799,N,07355.6204,W,1,06,1.35,85.7,M,-‐33.6,M,,*6F
$GPRMC,035806.000,A,4249.1799,N,07355.6204,W,0.20,13.48,210115,,,A*47
$GPGGA,035807.000,4249.1805,N,07355.6202,W,1,06,1.23,87.7,M,-‐33.6,M,,*67
$GPRMC,035807.000,A,4249.1805,N,07355.6202,W,0.21,13.48,210115,,,A*4B
$GPGGA,035808.000,4249.1814,N,07355.6200,W,1,06,1.23,90.1,M,-‐33.6,M,,*6A
$GPRMC,035808.000,A,4249.1814,N,07355.6200,W,0.13,13.48,210115,,,A*47
$GPGGA,035809.000,4249.1818,N,07355.6198,W,1,06,1.23,91.3,M,-‐33.6,M,,*66
$GPRMC,035809.000,A,4249.1818,N,07355.6198,W,0.05,13.48,210115,,,A*4F
$GPGGA,035810.000,4249.1820,N,07355.6197,W,1,06,1.23,91.7,M,-‐33.6,M,,*6E
$GPRMC,035810.000,A,4249.1820,N,07355.6197,W,0.04,13.48,210115,,,A*42
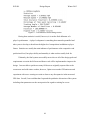
Figure 8: Raw GPS Data “NMEA Sentences”
The raw GPS output from the module provides a large amount of data, but the
data is essentially meaningless to the user unless filtered. There are a few different kinds
of NMEA sentences; however, the two chosen data outputs are $GPRMC (Minimum
Recommended Specific Data) and $GPGGA (Fix Data) sentences. $GPRMC has the
most useful data, in which each portion of data is separated by commas. The first data
column, 035803.000, is the current time (Greenwich Mean Time) in which the first two
numbers (03) indicate the hour, the next two (58) are the minute, and the following two
36
ECE499
Design Report
Winter 2015
(03) are the seconds and finally the milliseconds. The time is displayed in both the
$GPRMC and $GPGGA sentences, but the GPS module does have the ability to
determine what time zone you are in, thus, the accurate time will have to be calculated
depending on the user’s time-zone. Both $GPRMC and $GPGGA sentences also display
location data in which 4249.1781 is the latitude and 07555.6219 is the longitude in terms
of NSWE notation. For $GPRMC sentences, the ground speed in knots, tracking angle,
and current date are shown respectively. In $GPGGA sentences, fix data is provided in
which the number of satellites are shown as well as altitude and horizontal dilution of
position or accuracy.
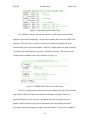
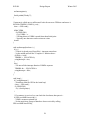
After logging the data onto an SD card from the GPS unit onto the computer, the
overall GPS data needs to be filtered from the comma-delimited NMEA sentences.
Because the logged data is delimited by commas rather than by tabs, the data needs to be
filtered before being brought into Matlab. The text-file data can be imported into excel
and the commas can then be converted to tab-delimited spacing between successive lines
of data. The data essentially needs to be taken into columns to separate successive lines
for calculating useful statistics from the data, which can be observed as follows in Fig. 9.
Figure 9: Tab-delimited $GPRMC and $GPGGA data
37
ECE499
Design Report
Winter 2015
The tab-delimited NMEA sentences need to be separated into two sentences of
data to differentiate their column lengths and variables in order to be readable in Matlab.
Tab-delimited $GPGGA data was filtered as shown in Figure 10.
Figure 10: Tab-delimited $GPGGA fix data
The main challenge was converting the NMEA data output from logging the GPS
data into a readable format for the user. Since the Arduino is not the best at parsing the
strings of data and has a limited memory, the statistical data had to be imported and
calculated in Matlab. Both the tab-delimited $GPGGA and $GPRMC data had to be
converted to column data and imported into Matlab, which can be observed in Figure 11.
Figure 11: GPS Column data being imported to Matlab
Each column of data is assigned to a variable name in Matlab, in which each
variable name will contain a different chunk of data at all GPS position estimates. Figure
12 below shows the imported array data from the column data.
38
ECE499
Design Report
Winter 2015
Figure 12: Importing Variable Name Data
For $GPRMC sentences, the data provided in variable names include latitude,
longitude, speed and tracking angle. Because the longitude data is not on a NWSE scale
and only a NW scale, thus, a negative value has to be added to longitude due to the
location being in the western hemisphere. $GPGGA variable names are input as number
of satellites, horizontal dilution of position, and altitude in meters. The format for the
variable names in Matlab can be observed below in Figure 13.
Figure 13: $GPRMC and $GPGGA Variable Names
Once the variable names are input correctly into Matlab, the code will convert the
input filtered NMEA GPS data to decimal form and output a display of the user’s
position and speed over their session. In addition, the code will output the user’s
statistics, which includes average speed, maximum speed, total distance travelled,
percentage of time spent jogging or higher, and total duration. The specific coordinates
39
ECE499
Design Report
Winter 2015
of Bailey field where the tests were implemented were added into Matlab to provide a
superimposed map of the field perimeter so the position data could be observed in
relation to the field space. The final outputs of the GPS data can be seen in the
Performance Estimates and Results section.
40
ECE499
Design Report
Winter 2015
Performance Estimates and Results:
In this section, the performance of the final implemented system is discussed,
based on the preliminary design criteria. First, the performance estimates are analyzed,
then the results of the GPS unit are discussed. Throughout, the estimated performance
and project results are evaluated.
Performance Estimates:
The most vital performance estimate determined by the two coaches was distance
travelled by a player, as it is a good indicator to the extent of how much a player
contributes to the team. The GPS was able to reliably track a player’s position
throughout a session, in which total distance travelled could be calculated intuitively in
Matlab. Another valuable performance indicator was a player’s work rate or positioning
on the field. A higher work rate or higher rate of movement leads to players tracking to
the ball more when not in possession. Work rate can be determined by observing a
player’s detailed movement track along the field. It is estimated that coaches will be able
to determine that total distance travelled will differ marginally for players in different
positions. In terms of the actual system, a clear initial performance estimate of the GPS
module was that the module would have to track player movement within 2 meters to be
considered as accurate. The accuracy of the GPS module is difficult to gage because
global positioning is not completely reliable due to the number of satellites being fixed to
and the tracking angle. A critical outcome of the GPS unit was ground speed, as the
metric could be used to calculate average speed and time spent running at high intensity.
Maximum speed was estimated as well, but was not as important as Coach Jeff Guinn
had stated that it is usually clear who is the fastest player on the field during sprints.
41
ECE499
Design Report
Winter 2015
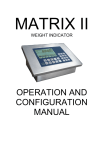
GPS Unit Results:
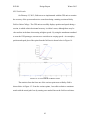
On February 25, 2015, field tests were implemented with the GPS unit to examine
the accuracy of the system and retrieve some data during a training session on Bailey
Field at Union College. The GPS unit successfully displays position and speed during a
session, in which relative horizontal accuracy is within 1 meter, although there may be
clear outliers in the data when testing at higher speeds. By using the attachment armband
to wear the GPS prototype, test runs were carried out at varying speeds. An exemplary
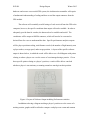
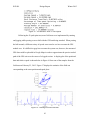
position and speed plot of the sprint from the field test is shown below in Figure 14.
Figure 14: 50 Yard Sprint on Bailey Field
The statistics from the from one of the various sprint tests on Bailey field is
shown below in Figure 15. From the various sprints, I was able to obtain a consistent
match with the actual path I ran by running on a marked line on the field several times.
42
ECE499
Design Report
Winter 2015
Figure 15: Test Statistics from 50 Yard Sprint
Following the 50 yard sprint test, more field tests were implemented by running
and jogging while passing a soccer ball with the GPS unit being attached. When passing
the ball around, a different variety of speeds were tested to see how accurate the GPS
module was. It is difficult to gage how accurate the system was; however, the measured
GPS data could be uploaded in Google Maps in order to approximate the precise tracked
path of the GPS unit over the course of a logged session. A display plot of the positional
data and relative speed is shown below in Figure 16 from one of the samples from the
field tests on February 25, 2015. Figure 17 displays the statistics of the field test
corresponding to the same position and speed plots.
Figure 16: Training Session Field Data
43
ECE499
Design Report
Winter 2015
Figure 17: Test Statistics from training session
Having these statistics is useful, however, it is not the final delineator of a
player’s performance. A player’s adeptness is something that cannot be quantified and
takes years to develop to break into the higher level competitions in addition to player
fitness. Statistics are usually the main indicator of performance at the competitive and
professional level, but player ability and mentality is what coaches usually look for.
Ultimately, the final system successfully meets close to all of the design goals and
requirements set out in the fall term and future work will be implemented to improve the
design. I was not able to perform as many field tests as originally expected due to the
recent snow and cold winter weather; however, I plan to test out the GPS unit more and
experiment with a user wearing two units to observe any discrepancies in the measured
GPS data. Overall, I am confident that I captured the qualitative discussion of the system
including what parameters are the most practical in regard to training for soccer.
44
ECE499
Design Report
Winter 2015
Production Schedule:
The production schedule was proposed during the fall term during ECE-498 and
planned to completely implement the design project by the end of the winter term for
ECE-499. The initial proposed schedule appeared sufficient in the beginning, but several
changes were implemented to the schedule due to the presentation and demonstration
date being announced at the start of winter term. A specific outline of the initial
proposed design project going forward into the winter trimester can be observed as
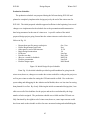
follows in Fig. 18.
•
•
•
•
•
•
•
•
•
Research on specific parts to order/price
Define Requirements and Goals
Order parts by end of fall trimester
Begin design construction
Field tests
Provide raw data
Show to a coach for feedback
Finalize presentation
Finalize design report
Oct., Nov.
Nov.
11/20
1/6
Late Jan.
Early Feb.
Mid. Feb.
Late Feb.
Mid. March
Figure 18: Initial Design Project Schedule
From Fig. 18, the initial schedule provided a good foundation for going into the
winter term; however, changes were made due to time needed for coding on the project as
well as poor winter weather for testing the GPS unit outside on field. Due to the time
spent coding and debugging for the Arduino and in Matlab, there was less time for testing
than planned for at first. By closely following the initial recommended design plan, I was
able to meet all of the deadlines for the project and not be overwhelmed by the large
number of tasks assigned. The production schedule was reliable and the GPS unit was
fully functional by the eighth week of winter term; however, some improvements could
have been made to the schedule to allow for more structured testing and embellishing the
45
ECE499
Design Report
Winter 2015
user display. In terms of having a structured testing regiment, a number of tests could
have been incremented to provide data on the reliability of the system for coaches.
First, the longevity of the 9V battery cell for the system could have been observed to
have a sense of how often the unit will run before losing power. In addition, the accuracy
could have been tested better by having the user run across the field with the two
constructed GPS units. The durability of the system could have tested as well by
simulating competitive game play conditions in which a defender physically uses his arm
to obstruct an opposing forward in an attempt to retrieve the ball. Overall, the final
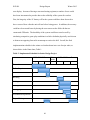
implementation schedule in the winter was broken-down into a set of major tasks, as
shown below in the Gantt chart, Table 1.
Table 2: Implemented Schedule for Senior Design Project
ECE-498 Fall Term
Sep
Oct
Nov
Winter
Break
Dec
ECE-499 Winter Term
Jan
Feb
Mar
Research
Define Requirements
Order Parts
Building
Coding
Testing
Debugging
Presentation Preparation
Report Writing
(2/28)
ECE498 Report (11/23)
46
Final Report (3/17)
ECE499
Design Report
Winter 2015
Cost Analysis:
The initial budget for this project was to remain under $300. The costs of the
components for the project requested by the committee can be observed below in Table 2.
The overall project required the purchase of two overall packages. Each overall package
consisted of two GPS modules, two Arduino boards, sufficient power encasings with
batteries, as well as a Bluetooth receiver. Two packages were used to achieve greater
accuracy and allow for the comparison of two players who play different positions on the
field. The total amount of funding requested by the Student Research Grant Program is
$249, in which shipping costs were included. As most of the parts were ordered from
Adafruit Industries, the shipping costs were free and an educational discount was applied
to reduce the cost of order. The complete project funding is requested from the Student
Research Grant Program and the Electrical and Computer Engineering Department.
Table 3: Component Expenditures
Component:
GPS Logger Shield Retail Kit (2x)
Purpose:
- Tracking movements of player on field
- Includes a US Global Sat 66 Channel GPS receiver, GPS
shield connector, interface communication cable, and Arduino
stackable headers
- The GPS shield connects directly to an Arduino via the
stackable headers
- Development Board used for evaluating player’s movements
Price:
$104.00
$8.00
$25.00
Soldering Iron / Solder
- Provide power for GPS sensor and microcontroller
- Allow for wireless connection from microcontroller to
computer
- Provide connection from microcontroller to CPU
- Necessary software to capture and analyze data on
movement i.e. positioning, runs, total distance traveled
- Necessary for soldering stackable pins to GPS shield
Enclosure for Arduino
- Provide necessary protection for both GPS devices
$30.00
4GB micro SD (2x)
- Required for sufficient memory
$16.00
MiNE Armband
-Armband utilized for encasing the GPS shield and Arduino
$12.00
Arduino Uno Microcontroller
Atmega328 (2x)
9V Battery Holder (2x)
Bluetooth Link Shield for Arduino
USB cable
MATLAB R2014a
$50.00
$4.00
*
*
Total:
$249
47
ECE499
Design Report
Winter 2015
Table 2. List of components for the proposed project. The * indicates the component will
be covered by the Electrical and Computer Engineering Department. (2x) indicates that
the quantity of the specific component will be two.
The table does not include the relatively inexpensive components such as a
microSD card reader as well as the cost of batteries used for the project. From a financial
standpoint, the GPS unit has good financial marketability. Although there are better GPS
devices on the market with greater precision, the GPS unit provides the necessary
statistics at the competitive level for a fraction of the price. The market cost to produce
each GPS unit would equate to approximately $95, which includes the Adafruit Ultimate
GPS shield, Arduino Uno microcontroller, battery and microSD card. Each GPS unit
produced could be used for a player on a club team, and data could be collected and
compared for a group of players who play similar positions on the field.
48
ECE499
Design Report
Winter 2015
Discussion, Conclusions, and Recommendations:
The successful development of a GPS unit that tracks player movements
specifically for soccer was the result of three terms of brainstorming, planning, research
and implementation. The overall aim of the senior design project was to develop a
prototype by exercising some of the fundamental engineering concepts learned in a
capstone process. Initially, developing detailed design requirements for a project based
on desired needs and realistic constraints was a daunting thought at the end of the first
term of the capstone design course. With many options for GPS devices,
microcontrollers and data calculating software, designing the optimal system for my
budget and goals was a rewarding experience.
Through the capstone design process, I learned valuable lessons in time
management, budgeting of available funds, and setting weekly, attainable goals. Being
organized in the design and implementation process was critical to the success of the
project. By researching on the design, setting up a documented schedule, and ordering all
of the components on the project by the end of the fall term, I was able to get a good
grasp of what needed to be done during the winter term. Once the winter term started,
diligently working on the project each week was the only way that I was able to meet the
Week 8 presentation deadline.
I intend on continuing to test the GPS unit during the course of the spring term
and make improvements to the user display. First, the Arduino Uno microcontroller is
limited to 32 KB; thus, the data had to be stored on a microSD card for proper storage of
the logged GPS data. Because the logged GPS data had to be stored on an external
microSD card, wireless capability was essentially defeated. An improved microcontroller
49
ECE499
Design Report
Winter 2015
with greater memory and wireless capability would allow for the user to simply upload
the data to a computer for tracking a player’s movement rather than having to remove and
input an SD card for every use. By having Bluetooth or wireless integration, GPS data
could be constantly streamed to the user. In addition, an improved user display would
appeal more to coaches and users.
To improve the accuracy performance of the system, an external antenna with the
GPS module’s u.FL connector could be used. The external antenna is very minimal and
would not add much weight to the project. The antenna would draw an extra 10mA and
yield an additional 28dB of gain for a boost in performance. Having an external antenna
would be advantageous for the user to receive as strong a signal as possible to track to
more satellites. The more satellites a receiver can detect, the greater the accuracy of the
information the unit provides. In retrospect, the project design experience allowed me to
dive into many aspects of product design and electrical engineering applications. I was
able to dive into software applications, control algorithms, GPS hardware, NMEA
sentences, and robust product design practices. Identifying the main design requirements
before delving into the project was also important to take into consideration during the
design process.
Overall, the project experience was definitely a rewarding process, from both the
standpoint of my own education and of the department. A great deal was learned of how
difficult it can be to take learned theory and convert that knowledge into practice. The
culmination of close to four years of education at Union College could not have been
accomplished without the help and support from the entire Electrical and Computer
50
ECE499
Design Report
Winter 2015
Engineering department, student research grant funding, as well as the unwavering
support from both of my parents.
51
ECE499
Design Report
Winter 2015
References:
[1]
Adafruit Industries. “Adafruit Ultimate GPS Logger Shield – Includes GPS
module,” N.p. n.d. Accessed 12 Nov, 2014. https://learn.adafruit.com/adafruitultimate-gps-logger-shield?view=all.
[2]
Adafruit Industries. “GPS module tutorial”, N.p n.d. Accessed 16 Jan, 2015.
https://learn.adafruit.com/adafruit-ultimate-gps-logger-shield/soft-serial-connect
[3]
Bouzakis, A., and L. Overmeyer, “Position Tracking for Passive UHF RFID Tags
with the Aid of a Scanned Array,” Int. J Wireless Inf. Networks, vol. 20, no. 1, pp.
318–327, Jun. 2013.
[4]
“From how far away can a typical RFID tag be read?” RFID Journal, n.p., n.d.
Accessed 03 Sept. 2014. http://www.rfidjournal.com/faq/show?139.
[5]
Google Earth, http://earth.google.com. N.p., n.d. Web. 12 Mar, 2014.
[6]
Google My Maps, https://www.google.com/maps/d/u/0/. N.p., n.d. Web. 12 Mar,
2014.
[7]
Namal, S.M., “Analysis of Soccer Actions using Wireless Accelerometers,”
presented at the Industrial Informatics, 2006 IEEE International Conference,
Singapore, Aug. 16–18, 2006.
[8]
Northumbria University. “Future of football: GPS and miniature accelerometers
to better assess player’s training load and fitness levels.” ScienceDaily, N.d. Sept.
21, 2010. Accessed Sept 16, 2014. http://www.sciencedaily.com/releases/2010/
09/100916073412.htm.
[9]
Opta Sports Pro. “High definition live sport data,” N.p., n.d. Accessed 6 Nov,
2014. http://www.optasports.com/services/broadcast/data-graphics/onscreen.aspx.
[10]
Swedberg, Claire. “RFID helps Soccer Teams Keep Their Eye on the Ball, and
Their Players,” RFID Journal, May 13, 2012. Accessed Sept. 15, 2014.
http://www.rfidjournal.com/articles/view?9315.
[11]
Wisbey, B., P. Montgomery, D. Pyne and B. Rattray. “Quantifying movement
demands of AFL football using GPS tracking” Journal of Science and Medicine in
Sport, vol. 13, no. 5, pp. 531-536, Sept. 2010. Accessed Oct. 21, 2014.
http://www.sciencedirect.com/science/article/pii/S1440244009001844.
[12]
Zhang, Bill, “Money Ball to World Cup: Big Data in Professional Sports,”
Arcadiasolutions.com, n.d. Accessed Sept. 3, 2014. http://www.arcadiasolutions
.com/money-ball-world-cup-big-data-professional-sport/.
52
ECE499
Design Report
Winter 2015
Appendix: User’s Manual:
This section provides instructions for the operation and maintenance of the
project. The manual details the proper GPS module statuses, battery replacement,
program uploading, microSD card data retrieval, and parsing the data. The GPS unit was
designed and assembled with an Adafruit Ultimate GPS shield, an Arduino
microcontroller, an Adafruit Bluetooth EZ-link module (optional), a microSD memory
card, MiNE armband and a 9V battery supply.
Before handling the GPS unit, it is important to note that there are three LEDs on
board to help you with debugging and status updates. The green PWR LED tells you that
there is at least a good 3V power supply. If this isn't on, there is either a serious problem
with the power supply or your device is not connected. The yellow L13 (and microSD
card access) LED is connected to digital 13, which is convenient for telling when the
Arduino is boot-loading and also will flicker whenever the microSD card is accessed.
The red FIX LED is connected to the GPS's fix output. When this is turning on/off once a
second it does not have a fix. When the LED blinks once every 15 seconds, the GPS has a
fix to satellites. In addition, ensure that the microSD card is placed in its socket.
First, the GPS unit must be powered on and plugged into the computer using the
interface cable to upload the Arduino script to the microcontroller. The Arduino script
correctly shows how to listen to the GPS module in an interrupt, which allows serial GPS
data to be logged. Once the Arduino sdlog code is uploaded, the GPS unit can be taken
outside for data logging over the course of training session. Make sure the power switch
is in the ON position when disconnected the Arduino from the computer because the
Arduino will be on even if the interface cable is connected without the battery plugged in.
53
ECE499
Design Report
Winter 2015
The system is relatively easy to use, assuming that the GPS module is outside and
the application is already started, the user does not have to do anything to use the system.
The system will automatically start updating the serial port on the Arduino as soon as the
GPS system begins producing position estimates. The reset button can be pressed to
begin logging a new text-file of GPS data during use. It is recommended that the system
be powered off when a training session or match is completed. After a training session,
the data can be retrieved by taking the microSD card out and reading in the data as a text
file of the logged data. The text-file will provide raw data, which is essentially
meaningless to the user. Because the data is meshed together by commas, the data needs
to be parsed and filtered into Matlab for analyzing user statistics. Next, the commadelimited data needs to be converted to column data.
Once converted, each column will be assigned to a variable name in Matlab, in
which each variable name will contain different data at all GPS position estimates
including speed, time, number of satellites, and tracking angle. Each variable name for
the $GPRMC sentences will need to be input in the Matlab code in the respective order
for displaying statistics: latitude, longitude, speed, tracking angle. For $GPGGA
sentences, the variable names will need to be input as number of satellites, horizontal
dilution of position, and altitude in meters. Once the variable names are input correctly
into Matlab, the code will convert the input filtered GPS data to decimal form and output
a display of the user’s position and speed over their session. In addition, the code will
output the user’s statistics, which includes average speed, maximum speed, total distance
travelled, percentage of time spent jogging or higher, and total duration. In conclusion,
the output data is an accurate measure of positional data that can be used for coaches.
54
ECE499
Design Report
Winter 2015
Arduino Code:
The following code is an excerpt of open source code that was written for the Adafruit
Ultimate GPS logger. This software was downloaded from: https://github.com/adafruit/
Adafruit-GPS-Library and the code was adapted and organized to fit the correct serial
setup, baud rate and refresh rate for the GPS unit. In addition, the code was used to
determine which NMEA GPS sentences were output when logging. There is additional
code involved with the Arduino software; however, it is too long to fit into this appendix,
so the following example for SD logging is shown.
// Code for logging GPS data onto an SD card after recording satellite fixed data
// Libraries used for Code
#include <SPI.h>
#include <Adafruit_GPS.h>
#include <SoftwareSerial.h>
#include <SD.h>
#include <avr/sleep.h>
// This code shows how to listen to the GPS module in an interrupt
// which allows the program to have more 'freedom' - just parse
// when a new NMEA sentence is available then access the data when desired
SoftwareSerial mySerial(8, 7);
Adafruit_GPS GPS(&mySerial);
// Set GPSECHO to 'false' to turn off echoing the GPS data to the Serial console
// Set to 'true' if you want to debug and listen to the raw GPS sentences
#define GPSECHO true
// Set to true to only log to SD when GPS has a fix, for debugging, keep it false //
#define LOG_FIXONLY false
// Interrupt is off by default
boolean usingInterrupt = false;
void useInterrupt(boolean);
// Set the pins used on the Arduino
#define chipSelect 10
#define ledPin 13
File logfile;
// Read in a hexadecimal value and return the decimal equivalent
uint8_t parseHex(char c) {
if (c < '0')
return 0;
if (c <= '9')
55
ECE499
Design Report
Winter 2015
return c - '0';
if (c < 'A')
return 0;
if (c <= 'F')
return (c - 'A')+10;
}
// Blink out an error code when not recording fixed data
// Error code blinks every second when not fixed
void error(uint8_t errno) {
/*
if (SD.errorCode()) {
putstring("SD error: ");
Serial.print(card.errorCode(), HEX);
Serial.print(',');
Serial.println(card.errorData(), HEX);
}
*/
while(1) {
uint8_t i;
for (i=0; i<errno; i++) {
digitalWrite(ledPin, HIGH);
delay(100);
digitalWrite(ledPin, LOW);
delay(100);
}
for (i=errno; i<10; i++) {
delay(200);
}
}
}
void setup() {
// Connect at a baud rate of 115200 so the GPS can read data fast enough and echo
without dropping characters
Serial.begin(115200);
Serial.println("\r\nUltimate GPSlogger Shield");
pinMode(ledPin, OUTPUT);
// Default chip select pin is set to output, even if you don't use it:
pinMode(10, OUTPUT);
// See if the card is present and can be initialized:
if (!SD.begin(chipSelect, 11, 12, 13)) {
// f (!SD.begin(chipSelect)) {
// Use this line for the Arduino Uno
56
ECE499
Design Report
Winter 2015
Serial.println("Card init. failed!");
error(2);
}
char filename[15];
strcpy(filename, "GPSLOG00.TXT");
for (uint8_t i = 0; i < 100; i++) {
filename[6] = '0' + i/10;
filename[7] = '0' + i%10;
// Create if does not exist, do not open existing, write, sync after write
if (! SD.exists(filename)) {
break;
}
}
logfile = SD.open(filename, FILE_WRITE);
if( ! logfile ) {
Serial.print("Couldnt create ");
Serial.println(filename);
error(3);
}
Serial.print("Writing to ");
Serial.println(filename);
// Connect to the GPS at the desired rate
GPS.begin(9600);
//////////////////////////////////////////////////////////////////////////////////////////////////////////////
// For logging data, recommended to use only or RMC+GGA to keep the log files at a
// reasonable size
// uncomment this line to turn on RMC (recommended minimum) and GGA (fix data)
// including altitude
GPS.sendCommand(PMTK_SET_NMEA_OUTPUT_RMCGGA);
// uncomment this line to turn on only the "minimum recommended" data
// GPS.sendCommand(PMTK_SET_NMEA_OUTPUT_RMCONLY);
//////////////////////////////////////////////////////////////////////////////////////////////////////////////
// Set the update rate or refresh rate below
GPS.sendCommand(PMTK_SET_NMEA_UPDATE_1HZ); // 100 millihertz (once
every 10 seconds), 1Hz or 5Hz update rate
// Turn off updates on antenna status, if the firmware permits it
GPS.sendCommand(PGCMD_NOANTENNA);
// Have timer0 interrupt go off every 1 millisecond, and read data from the GPS
// which makes the loop code easier to understand
57
ECE499
Design Report
Winter 2015
useInterrupt(true);
Serial.println("Ready!");
}
// Interrupt is called once a millisecond, looks for any new GPS data, and stores it
SIGNAL(TIMER0_COMPA_vect) {
char c = GPS.read();
#ifdef UDR0
if (GPSECHO)
if (c) UDR0 = c;
// Writing direct to UDR0 is much faster than Serial.print
// but only one character can be written at a time.
#endif
}
void useInterrupt(boolean v) {
if (v) {
// Timer0 is already used for millis() - interrupt somewhere
// in the middle and call the "Compare A" function above
OCR0A = 0xAF;
TIMSK0 |= _BV(OCIE0A);
usingInterrupt = true;
}
else {
// Do not call the interrupt function COMPA anymore
TIMSK0 &= ~_BV(OCIE0A);
usingInterrupt = false;
}
}
void loop() {
if (! usingInterrupt) {
// Read data from the GPS in the 'main loop'
char c = GPS.read();
if (GPSECHO)
if (c) Serial.print(c);
}
// If a sentence is received, we can check the checksum, then parse it...
if (GPS.newNMEAreceived()) {
// NMEA sentences printed out
// In the main loop, groups of data have been received by calling
GPS.newNMEAreceived(),
58
ECE499
Design Report
Winter 2015
// if this returns true then we can ask the library to parse that data with
GPS.parse(GPS.lastNMEA())
// Don't call lastNMEA more than once between parse calls because it will clear the
received flag
// and can cause very subtle race conditions if new data comes in before parse is called
again
char *stringptr = GPS.lastNMEA();
if (!GPS.parse(stringptr)) // This sets the newNMEAreceived() flag to false
return; // Failing to parse a sentence will return another value after waiting
// Sentence parsed
Serial.println("OK");
if (LOG_FIXONLY && !GPS.fix) {
Serial.print("No Fix");
return;
}
// Logging data
Serial.println("Log");
uint8_t stringsize = strlen(stringptr);
if (stringsize != logfile.write((uint8_t *)stringptr, stringsize)) //write the string to the
SD file
error(4);
if (strstr(stringptr, "RMC") || strstr(stringptr, "GGA")) logfile.flush();
Serial.println();
}
}
// End Code
59
ECE499
Design Report
Winter 2015
Matlab Code:
% Import excel file of parsed GPS data
% Sprinting Test on Feb. 25, 2015
% GPGGA Sentences
[num, txt, raw] =
xlsread('/Users/vanessche/Documents/MATLAB/GPSSprintGPGGA.xlsx','Sheet1');
% GPRMC Sentences
[num, txt, raw] =
xlsread('/Users/vanessche/Documents/MATLAB/GPSSprintGPRMC.xlsx','Sheet1');
% Perimeter of Bailey Field at Union College
[num, txt, raw] =
xlsread('/Users/vanessche/Documents/MATLAB/GPSFieldPerimeter.xlsx','Sheet1');
%Each xlsx file assigned with different variable names
num = sort(num);
for i = 1:numel(num)
% Number of elements in an array
NumCell(i) = {num2str(num(i))};
end
% --------------------- Change Variable Names here ----------------------% Converting from parsed GPS NMEA format to decimal values
% GPRMC Sentences
lat = VarName41;
long = -VarName42; % Negative value due to location in Western Hemisphere
x = VarName43; % Speed (knots)
a = VarName44; % Tracking Angle
% GPGGA Sentences
b = VarName21; % Number of Satellites
c = VarName22; % Horizontal Dilution of Position
d = VarName23; % Altitude in Meters
% Field Perimeter (Fixed Variable Names)
latfield = VarName1;
longfield = -VarName37;
% -----------------------------------------------------------------------degrees = floor(lat/100);
minutes = lat-degrees*100;
lat2 = degrees + minutes/60;
% number of degrees
% number of minutes
% latitude in degrees
degrees = floor(long/100);
minutes = long-degrees*100;
long2 = degrees + minutes/60;
% number of degrees
% number of minutes
% longitude in degrees
60
ECE499
Design Report
degrees = floor(latfield/100);
minutes = latfield-degrees*100;
latf = degrees + minutes/60;
% number of degrees
% number of minutes
% latitude in degrees
degrees = floor(longfield/100);
minutes = longfield-degrees*100;
longf = degrees + minutes/60;
% number of degrees
% number of minutes
% longitude in degrees
Winter 2015
% Need to have proper number count to obtain correct total distance
n = numel(x); % Number count in array for speed data
z = sum(x(:)==0); % Zero Count in array for speed data
index = (x>~6); % Rate spent jogging equal or greater than 6 mph
numberOfElements = (mean(index)*1.15078);
figure
subplot(2,1,1), h = geoshow(lat2, long2, 'DisplayType', 'Point');
mapshow(long2,lat2)
mapshow(longf,latf)
xlabel('Longitude (degrees)')
ylabel('Latitude (degrees)')
title('Positional Data')
%camroll(90)
axis([-73.2596 -73.25836 42.8163 42.81744])
%set(h,'Xtick',1:numel(num),'XTickLabel',txt,'Ytick',num,'YTickLabel',NumCell(i))
%g = h.EdgeColor;
%set(g,'XtickLabel','XTickLabel','Ytick','YtickLabel')
subplot(2,1,2), plot(1:n,(x*1.150779)) %Speed in mph
xlabel('Time (seconds)')
ylabel('Speed (mph)')
title('Speed Data')
axis;
% Calculations
avg_speed = mean(x)*1.150779; % knots to mph
max_speed = max(x)*1.150779; % knots to mph
total_distance = avg_speed*(n*0.000277778); % seconds to hour conversion for time
avg_trackingangle = mean(a);
avg_numbersatellites = mean(b);
avg_horizontal_dilution_in_meters = mean(c);
avg_altitude = mean(d)*3.28084;
elapsed_time = n;
display Training_Statistics
61
ECE499
Design Report
fprintf('Average Speed = %f mph \n', avg_speed)
fprintf('Maximum Speed = %f mph \n', max_speed)
fprintf('Total Distance Travelled = %f miles \n', total_distance)
fprintf('Percentage of Time spent Sprinting = %f \n', numberOfElements)
fprintf('Tracking Angle = %f° \n', avg_trackingangle)
fprintf('Average Number of Satellites = %f \n', avg_numbersatellites)
fprintf('Elevation = %f ft \n', avg_altitude)
fprintf('Elapsed Time = %f seconds \n', elapsed_time)
62
Winter 2015