1
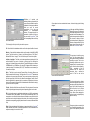
OceanView TM
Version 2.0, Copyright ©C-MAP Norway A/S –2000
All rights reserved
C-MAP Norway A/S
Hovlandsveien 52
PO Box 212
N-4379 Egersund
Norway
Phone: (+47) 51 46 47 00
Fax: (+47) 51 46 47 01
Email: [email protected]
No part of this document may be copied, transmitted, transcribed, reproduced,
stored in any retrieval system or translated into any language, either in written or
electronic form, without the written permission of C-MAP Norway AS.
1.0 Introduction.........................................................................................................3
2.0 General Information...........................................................................................4
Electronic charts, chart supplementary information and user’s objects...............................4
The combination of seamless coverage and bookmarks...................................................4
Electronic documents with associated chart information ..................................................5
Customer’s external databases......................................................................................5
Working groups..........................................................................................................5
3.0 Installation...........................................................................................................6
3.1 System Requirements ........................................................................................6
3.2 Installing OceanView™ ....................................................................................6
3.3 Registering the CM-93/3 database for use in OceanView™.............................8
3.4 Licensing charts for use in OceanView™ .........................................................9
3.5 Updating Databases .........................................................................................10
4.0 Using OceanView™........................................................................................12
4.1 Starting OceanView TM and opening a chart ....................................................12
4.2 Moving around the world and changing scales ...............................................13
4.3 Bookmarking views and saving them as graphic files .....................................14
4.4 Undo function ..................................................................................................14
4.5 Measuring distances on the chart .....................................................................15
4.6 Printing a chart .................................................................................................16
4.7 Tidal Predictions ..............................................................................................17
4.8 Three dimensional view of the seabed .............................................................18
4.9 Route Planning.................................................................................................19
4.10 Mariners Objects............................................................................................21
4.11 Object Information.........................................................................................23
4.12 Presentation Parameters.................................................................................24
4.13 Multiple Windows .........................................................................................25
4.14 Automatic Chart Updating.............................................................................25
4.15 Importing S-57/3 charts (ENC) .....................................................................27
4.16 User Databases...............................................................................................28
4.17 Database Wizard ............................................................................................29
5.0 Advanced Procedures and Practical Applications......................................33
5.1 Display Terminology and Parameters .............................................................33
5.2 Creating Chart Templates ................................................................................34
5.3 Manual Chart Updating ...................................................................................35
5.4 Safe Route Checking .......................................................................................36
5.5 Voyage Scheduling..........................................................................................36
6.0 CM-93 Edition 3...............................................................................................37
7.0 Users Notes .......................................................................................................38
2
2.0 General Information
1.0 Introduction
Electronic charts, chart supplementary information and user’s objects
OceanView ™ is the office electronic chart information system developed by C-MAP
in order to meet the market demand for a global marine information system. The
main purpose of OceanView ™ is for the maintenance and easy distribution of
various types of geo-referenced information using global coverage of electronic
navigational charts provided by the world-wide Electronic Chart Database CM-93
Edition 3.0 from C-MAP.
Numerous organizations and commercial companies need updated navigation
charts to maintain their own geo-referenced information. Such examples are the
Global GMDSS plan, Global Search and Rescue plan, Ship’s routing databases
maintained by the International Maritime Organization, marine environment
monitoring information, spatial analysis of sea incidents etc. In many cases such
information should be made available to many persons around the World and
should be kept updated. Shipping companies also need updated charts for
monitoring their fleets, check details of the navigation conditions when planning new
routes, maintaining a database of their agents, harbour facilities etc. The system
can be used for generation and transmission of information to vessels such as storm
avoidance recommendations and targeting SAR vessels and helicopters.
OceanView ™ is primarily aimed at organizations and commercial companies
involved with the management of the shipping business and the marine environment
protection. Many other potential users such as universities, public libraries,
geographic research centres should find it useful for their purposes as well.
OceanView ™ is a powerful tool for the creation and distribution of geo-referenced
value added information and, as a natural part of CM-93 Edition 3.0 Electronic Chart
technology – this is C-MAP’s contribution to the safety of navigation and the sea
environment protection.
CM-93/3 is a specially compiled database of electronic charts comprised of objects
and their attributes as defined by the IHO S-57 Edition 3.0 standard. CM-93/3 is fully
compliant with the S-57/3 data format, and in addition the CM-93/3 distribution
conventions allow the mariner to immediately use the required chart coverage,
including automatic updating, while at the same time skipping the time consuming
conversion of S-57/3 data on board.
CM-93/3 World wide database contains over 15000 electronic charts grouped into
the following scale levels:
•
•
•
•
•
•
•
•
Background, small scale
Background, medium scale
Overview
General
Coastal
Approach
Harbour
Berthing
The OceanView ™ system is designed to display supplementary information as well
as the users own information layers, in addition to the electronic charts. The
standard package includes a worldwide database of tidal information.
Users can create and edit their own objects such as point marks, line and area
objects. Text notes and styles can be applied to the objects and stored in the
customer’s database.
The combination of seamless coverage and bookmarks
The CM-93/3 database provides seamless cartographic coverage. User can
navigate in the database, setting the necessary scale of the charts and coordinates
of the centre of screen.
In addition to this, the user can save the current view as a geo-referenced
bookmark. There are two types of bookmarks implemented in the system. Personal
bookmarks allow saving views within the current window and providing the fast
panning to the point of interest. Shared bookmarks can be saved as a file with the
user own defined name, and contains all current chart settings such as database
version, data set name, coordinates of screen, presentation model, display mode,
scale, zoom factor, and references to all user objects that were displayed on the
screen. The bookmark files can be managed as any standard Windows files: placed
in the chosen directory, saved on diskette, forwarded to another computer of the
office network or sent as the binary attachment to e-mail.
3
4
Such a unique combination of seamless coverage combined with the bookmark
feature, gives the user both freedom of easy navigation in the worldwide electronic
chart database and quick restoration of all chart settings that were made during the
previous working session.
3.0 Installation
3.1 System Requirements
This feature allows a fast and easy way of exchanging geo-referenced information
between the members of a working group within the office network, or by Internet,
and even via direct communication channels such as GSM or Inmarsat.
OceanView ™ is a PC based Windows application. The program will run on almost
any IBM compatible PC with an Intel Pentium™ processor. The system must also
contain a 1,44MB diskette station and a CD-ROM drive.
Electronic documents with associated chart information
For printing purposes, almost any printer can be used including LaserJet printers as
well as colour printers.
The geo-referenced bookmarks relate to a particular theme that can be organized in
the database, assembled together with CM-93/3 Electronic chart database, and
made into a specially compiled customer database. Text files, formatted in MS
Word, and scanned pictures can be linked to this database as well.
When organized in this way, with the viewer that provides the navigation and search
functions in the database, such structured information is considered as electronic
documents or publications.
This power feature of the system allows the user to easily create and distribute
value added products and services on a subscription basis with continuous
automatic updating of his documents and publications.
Customer’s external databases
OceanView ™ clients can be configured to access external customer databases with
defined access rights. Examples of such databases are the Global SAR plan
database, maintained by the IMO, or a database of ships operated by a shipping
company, or an electronic catalogue of paper chart portfolios published by
Hydrographic offices.
An external database can be designed and created by the customer and then linked
to the OceanView ™ system by means of a special database configuration module.
Please note that OceanView ™ is designed to run under Microsoft Windows 98
(Second Edition), NT™ or Windows 2000 only. If the PC does not have either of
these, it must be upgraded before installation of OceanView ™.
3.2 Installing OceanView™
1. Close down all windows programs currently running on your computer.
2. Insert the CD marked “OceanView ™ Edition 2.0” in the CD ROM drive.
3. Either from My Computer or Windows Explorer locate the CD drive and double
click on Setup. This will initialise the installation procedures for the software.
4. A message will appear asking “Do you want to install OceanView™ ?” Choose
Yes.
5. “Please enter the diagonal of your screen in inches.” This will depend on your
individual computer monitor. Common sizes are 13, 15, 17, 19, 21. If in doubt
please see your documentation on the monitor.
6. The system will then commence copying executive files and should complete at
100%.
Working groups
7. “Please enter unique company name”. This will be printed on the back cover of
the software box as well as on the back of the User’s Manual. Please take care to
enter this as printed.
OceanView ™ is designed as a client-server system. All OceanView ™ networked
Clients can work simultaneously with the CM-93/3 electronic chart database,
physically stored on the LAN database server. The CM-93/3 electronic chart
database is automatically updated from the C-MAP Distribution Centre ensuring that
all clients are working on the current updated electronic charts.
8. “Please enter system ID number”. This will be printed on the back cover of the
software box as well as on the back of the User’s Manual. Please take care to enter
this as indicated.
The Client workstations can be configured to access various working groups,
provide the ability for users to work on particular projects. This also allows the
definition of responsibilities for the maintenance of different information in the
databases by using different access rights.
Configuration of the working groups can be done on two levels: definitions of access
rights and configuration of the routing recipients.
5
6
9. A message will appear “Now the setup will install the DCOM. This is the redistributable product of Microsoft, enclosed in OceanView ™ setup.” This is
necessary for the proper functioning of your software. Choose OK. If an error
message appears “A newer version of DCOM98 had been installed. To override,
you must uninstall the current version first.” This means that you have a more recent
copy of the DCOM and the software will continue to use the newest unless you
manually update this which is not recommended. Choose OK.
3.3 Registering the CM-93/3 database for use in OceanView™
1. Once the license string has been sent to you by C-MAP Norway AS, click on
GDBAdmin which is found in the same location as OceanView ™.
10. A message will appear “Now the setup will install the MDAC. This is a redistributable product of Microsoft, enclosed with OceanView ™ setup.” This is
necessary for proper database functioning. Choose OK.
11. The computer will process information and bring up a screen with registration.
“To obtain access to the charts and updates you have to register in C-MAP
Distribution Center.”
a. Save to file for sending by email or mail.
b. Via Internet
c. Register later
It is recommended to choose the first option. Click Next.
12. “Setup will copy registration file user.usr in the following folder. To copy to this
folder click Next. To copy to different folder, click Browse and select another folder.
You can choose not to install OceanView ™ at this time by clicking Cancel to exit
Setup. It is recommended to keep the User.usr file stored for your own records and
therefore you may wish to copy it to the harddrive for sending to C-MAP.
13. The setup will create a folder directory for start menu items comprised of
shortcuts that you may like to add to your desktop for easy access. To add to
desktop right click on icon (for example OceanView ™). Choose Create Shortcut.
This may now be dragged onto the desktop.
Please send C-MAP Norway AS the USER.usr file at this time to compile your
license string at [email protected].
7
2. Find the location where the chart database is located. If you would like to copy
the database to your harddrive (quicker processing)(for the World database you will
need over 600MB free space), run straight from the CD, or from a network (only if
license agreement permits). Choose the directory where the database is located.
3. Once the correct directory is found, the database name (eg. World) will be visible
under Available Database. You may notice on the left side of the screen databases
and which is set currently as the default.
4. Click Register Database. In some instances if reinstallation is necessary the
following will appear ”Database already exists, update it? World”. Choose YES. This
may take between 15-20 seconds depending upon the size of the database and the
computers processing speed.
5. “OK World” Click OK to continue.
6. Choose Set as Default. “Do you really want to set as default Database? World”
Choose YES.
7. Close GDBAdmin.
8
3.4 Licensing charts for use in OceanView™
Chart licences are obtained from C-MAP Norway AS and are available for
Worldwide Coverage, one or more Zones, one or more Areas, or single charts.
Contact C-MAP Norway AS for price lists of coverages. Licenses can only be used
on the system for which they were generated and cannot be transferred to other
software or hardw are systems. Licenses can be added manually or automatically.
Licenses can be added automatically by choosing “add licenses from file” and
pointing to the PASSWORD.USR file received from C-MAP Norway AS. All the
licenses contained within this file will be automatically registered.
In addition to adding licenses, licenses can be renewed and the status of the current
license list reviewed.
3.5 Updating Databases
If you are a subscription customer who is entitled to CM-93/3 chart database
updates it will be necessary to update this dataset via the CD which will be
automatically sent to you three times per year.
1. Open LicenseAdm.
2. In the right hand side of the LicenseAdm window choose the Zone or Areas which
your license has been generated for (eg. Zone 1). The 16 digit code which has been
sent to you may be entered manually or by a cut and past method into the License
String window. Once these are selected click Add License. This will take a few
seconds to process and upon completion should result in a message “License has
been added successfully”. Choose OK.
3. Close down LicenseAdm and open OceanView ™ and your detailed chart
database will be visible.
To un-register a database, simply choose the required database and click on
UNREGISTER DATABASE. Please remember to choose another database as the
default or you will receive the following error message upon initialising
OceanView ™:
Once registration is complete, close the database administrator window. You will
now need to apply licenses to open the required chart coverage.
9
Replacing Data on Hard Disk
Option 1 (requires 1.2GB hard disk space)
-Copy the contents of the CM93v3 CD directory to a unique (newly created)
directory on the hard drive for example “World 48”. *Do not rewrite existing database
files.
-Start GDBAdmin and register the new Database from the newly created source.
-When the system asks if you wish to update choose YES.
-You are now free to delete the previously installed Database.
Option 2
-Note the License string by entering LicenseAdm>License List.
-Exit LicenseAdm.
-Open GDBAdmin and unregister the existing database.
-Delete this DB from Windows Explorer.
-Copy update of Database to the hard drive within a newly created directory.
-Open OceanView™ and register the new Database and enter the license string.
10
Replacing Data from CD ROM
-Insert the newly received database CD into the CD ROM drive
-Open GDBAdmin
-Locate the new database and choose Register and Set As Default
4.0 Using OceanView™
4.1 Starting OceanViewTM and opening a chart
OceanView ™ is started by clicking on the icon generated by the installation.
Replacing Data through a Network
-Have the Systems Administrator add the new Database to a commonly accessible
directory on the network
-Open GDBAdmin and locate the new World (Database)
-Register and Set As Default
The default startup.ovb will appear (not necessarily as shown). From this point on,
the startup view will continue from the point of leaving off from the previous session.
To reopen the default chart, simply click on the “world” icon at the top left of the
screen.
See information about .ovb in section 4.3 for more about bookmarks and views.
11
12
4.2 Moving around the world and changing scales
You can “navigate” around the world by clicking on the LEFT mouse button. The
point where you click on the chart will always become the new centre position
(panning).
4.3 Bookmarking views and saving them as graphic files
There are different methods of changing chart scales.
OceanView ™ contains a function for bookmarking current views. These bookmarks
can be sent to other users, or can be stored on the local hard disc for future
reference. The two icons related to bookmarking are:
The first is by using the zoom-in and the zoom-out icons on the toolbar.
By pressing these icons, you can zoom in and out to any position on the chart. As
you zoom in, OceanView ™ will always automatically load the best scale chart
available.
The second method of zooming in and out is to draw a marquee box around the
area you wish to zoom. This is achieved by holding the left mouse button down, and
then drawing a box around the required area with the pointer.
This button will open a previously saved bookmark for future use. Your version
of OceanView ™ is preloaded with various bookmarks (stored as .ovb and .ovd files
within OceanView bookmarks folder in your CM93v3 directory structure. Ovb files
will save a graphical view and ovd files will save the view maintaining database
structure.
This button will save a bookmark. You must give a name and location for this
information to be stored. You may then retrieve this information by opening it as
explained above.
To zoom out, do exactly the same as above but in addition hold down the left shift
key.
To cancel this action, you may press the Esc key while the box is on screen.
In addition, the F5 (zoom-out) and the F6 (zoom-in) keys are activated.
It is also possible to SAVE a view in the form of a graphic file. Supported formats
are .bmp and .jpg. To save the view as a graphics file, choose Map, Save As, and
then choose the required name, location and format. These files can now be
imported into most other programs.
It is also possible to manually type in the desired scale to the top right corner of the
map display or through the View, Set Scale menu.
It is also possible to store positions by entering the name of the position in the
top right hand corner of the page. Use the GOTO button to return to that
position in the future. As well, there is a delete bookmark button and it may
be used while the appropriate bookmark is visible for deletion.
4.4 Undo function
As in most Windows programs, OceanView ™ contains and UNDO function.
This allows you to backtrack in previous views. This will not undo functions that you
13
14
have previously generated as most commands require you to save changes made
as a precaution.
4.5 Measuring distances on the chart
4.6 Printing a chart
This icon on the toolbar is used for measuring distances on the chart. Click on
the chart with the LEFT mouse button and move the mouse cursor to the next point.
A black line will be drawn between the two points with the bearing from point one to
point two given in a small box. The distance between the points is given at the top
left of the screen. The line can be extended to as many points as you wish by simply
continuing to add new points. Points may be moved by positioning the cursor over
the anchor point and dragging to the new position. Points may be removed by
RIGHT clicking the mouse button
OceanView ™ has the ability to print high detail charts in colour or black and
white. The print icon is located on the toolbar.
15
The print dialogue can be used to change such things as printer, paper type and
paper orientation.
16
4.8 Three dimensional view of the seabed
The 3D button is found on the toolbar.
4.7 Tidal Predictions
The 3D model is generated using depth contours and soundings and therefore the
model is only as detailed as the charts from which it is being generated.
The tide prediction icon is found on the toolbar.
The model can be rotated and zoomed by holding down the mouse buttons and
moving the mouse.
Once this icon is pressed, small blue diamonds will appear on the chart (there are
some 4000 tidal prediction points around the world). Click with the RIGHT mouse
button inside any of these diamonds to see the tidal prediction for today.
It is also possible to edit presentation parameters and change colours, vertical
exaggeration, method of portrayal (grid, wireframe, solid, points) as well as to print
and export any graphics file created.
You can also receive a tidal prediction for another day by choosing the required date
in the pull down chart at the bottom of the graph. To turn tidal predictions off, click
on the icon again as it is a toggle key.
17
18
When entering a route you may wish to insert, delete or move waypoints.
4.9 Route Planning
The Route planning icon is found on the toolbar.
Route planning can be used to plan and check routes. Routes can also be exported
to other programs such as Electronic Charting systems.
Clicking on the Route button will bring up the following dialogue box:
The Route planning window is shown above. To start a new route, click on the
CREATE NEW ROUTE button and enter the required name. You can now define
your route on the chart by using the left mouse button to enter a waypoint and by
holding down the Ctrl button and left mouse buttons simultaneously to pan the chart.
As you enter waypoints the following information is automatically entered:
-
Waypoint Number
Lat.
Lon.
Radius
Deviation
Speed
Distance
DTA
Time
WP Name
Insert a waypoint
To insert a waypoint to a leg that has already been defined, simply move the mouse
cursor to a position in between two waypoints and a large cross will appear. Click
the LEFT mouse button and move the new waypoint to the required position then
clicking again with the left mouse button to set the waypoint.
Delete a waypoint
To delete a waypoint that has already been defined, simply move the mouse cursor
to the waypoint and a black line with 2 arrows will appear. Click the RIGHT mouse
button to delete the waypoint.
Move a waypoint
To move a waypoint that has already been defined, simply move the mouse cursor
to the waypoint and a black line with 2 arrows will appear. Click the LEFT mouse
button to move the waypoint to the required position.
Save a waypoint
Once a route is completed, it can be saved by choosing the SAVE ROUTE button.
To edit a route, firstly choose the required route in the left portion of the screen and
click the EDIT ROUTE button. You can now edit the route using the mouse keys as
defined in the section above.
To delete a route, first choose the route to delete in the left-hand window and click
the DELETE ROUTE button. You are asked to confirm the deletion. Routes can also
be hidden and displayed by alternating between the HIDE ROUTE and SHOW
ROUTE buttons. Routes may be either exported to an external file or database files
may be imported to view on the screen as routes. More on this function see the
section relating to Advanced Procedures and Practical Applications (Section 5.0).
19
20
4.10 Mariners Objects
The Mariner’s Objects icon is found on the toolbar. The Mariners Objects
function is used to draw your own symbols or areas on the screen. To create a new
object, click on Create New Object. The screen display has been changed to day,
blackback under View, Display in the menu.
It is also possible to edit the entry coordinates of the objects entered. Simply hold
the mouse button over the point that you wish to move and do exactly the same as
you would for editing a waypoint. Remember by entering a point and setting your
Scale Minimum to 50000, if the zoom level exceeds that say for instance 60000 or
any smaller scale than your input, the object will not be visible. If all scale fields are
left empty, the object will be visible at all scales.
You can now choose several categories of Mariners Objects. Choosing Mariners
Feature for example will give you the following dialogue:
Objects may be imported and exported for use between OceanView™ users under
the Tools menu Import/Export Mariner Objects.
Here it is possible to choose the object type (point, line or area), the name, the scale
levels for which the object will be visible, and various other levels of information.
You can now click on the chart to place the object.
21
22
we have clicked on the Beacon Special Purpose, and are given all the beacon
characteristics in the right hand window.
Files created through the Export option are in the form of .dat files and contain all of
the associated geographical coordinates along with any descriptions entered during
the original creation. Once files have been imported to another user they may then
be reedited or added to. This feature is ideal for the sharing and maintenance of
predefined points, lines, or areas among users or for the transmission between
users of more than a graphical image stored as a .jpg or .bmp.
The object when imported are visible within the standard Mariners Objects window
and can be individually selected for editing by double clicking on the particular
object taking the OceanView™ window to the correct location on the chart.
4.12 Presentation Parameters
It is possible to set a number of parameters to customize the display of the chart.
These include:
2 presentation methods (IHO S-52 and C-MAP INT-1)
Base, Standard, Full or Custom display. These allow various objects to be
turned on or off.
Presentation parameters such as light lengths, danger symbols etc.
Scales Levels (automatic or defined chart scales).
Chart Grid or Map Margin
4.11 Object Information
It is possible to interrogate the properties of any object on the chart. This is done by
clicking the RIGHT mouse button on the required object. In the example below, we
have clicked on a beacon, and have received the following information:
There are always quite a number of objects under the mouse cursor and these can
include one or more depth areas, caution areas, lights etc. In the example above,
23
24
4.13 Multiple Windows
It is possible to open several chart views by clicking on the Open Chart icon (see
3.1). These can be arranged by choosing the required option in the Windows menu.
Below is an example of two vertical tiled charts:
The following picture shows the updating dialogue:
The user can check the updates applied by clicking on the different HO’s and then
expanding the update and clicking on the various objects. The chart will
automatically pan and highlight the location of the object as shown above.
The software keeps a log file of all updates.
4.14 Automatic Chart Updating
AUTO UPDATING allows the user to update the charts via any connection to the
Internet or C-MAP’s RAS based distribution centre. Updating is only available to
subscribers.
To update charts automatically you must first connect to the Internet or C-MAP RAS
server (number available on request). Once connected simply click on the
“Download All” button. The software will now connect to the C-MAP distribution
centre and check the validity of the licenses. If the subscriber is entitled to charts
updates then the relevant files will be downloaded to the hard disc and the changes
automatically applied to the charts. An update log of all chart corrections is
maintained. In addition to downloading updates, the user can also check the size of
updates before download or simply download a list of updates and choose the
required ones.
When the subscriber receives a new CD-ROM from C-MAP Norway, all updates will
be automatically removed from the hard disc.
25
26
4.15 Importing S-57/3 charts (ENC)
It is possible to compile fully compliant S-57/3 charts (ENC) into CM-93/3 and view
them in OceanView ™. This is achieved by choosing Import S-57 from the Data
menu.
4.16 User Databases
Users of OceanView ™ have the possibility to enter their own global information into
local or networked databases. For example, a ship owner might want to plot the
positions of his vessels into the system on a daily basis, and see the positions
shown graphically on the chart. There are a number of pre-defined databases
included with OceanView™ and in addition, users can define their own using the
Database Wizard.
To open a local database, choose Database, Open Database and choose one of the
available .leg files(System Manufacturers was chosen in this case). The screen will
now look as follows:
Choose the location of the stored S-57/3 charts in the left hand window, and enter
the issuing Hydrographic Office at the top of the right hand window. Click on
Execute to compile the S-57/3 charts to CM-93/3. If the S-57/3 is fully compliant with
the IHO specification, the charts will be compiled into CM-93/3. They can then be
viewed on the screen by opening the Add Database dialogue and adding the
recently imported S-57/3.
27
28
prompting for a Title and a Description will occur.
Objects (companies in this case) can be entered and edited by using the buttons on
the toolbar. These are defined as follows:
Enter the desired field names and
then chose Next to continue with
database selections.
These functions may also be accessed through the menu Database, Record.
A new object is added by clicking the Add New Object button and clicking the
position of the object onto the screen. All other relevant information can now be
added in the database window.
An existing object may be deleted using the Delete Object button.
Objects can be moved and edited by using the Edit object button.
The next step is to select
appropriate
object
definitions.
Chose style (point, line, area, or
note), colour, type, and size. Once
satisfied with the dialogue box
choices, click next to continue.
Objects may have their appearance changed by using the Style editor function.
Existing object and field information updates and edits must be saved utilizing
the Save button.
To cancel changes made, the Cancel button is used.
4.17 Database Wizard
This section is intended for system administrators or advanced users and describes
how to connect OceanView T M to external client databases.
The Wizard is the link between an
external
database
and
OceanView T M itself. It can decide
what is to be displayed on screen,
from which database, and how.
Points, Lines, Areas, and Notes can
be generated and displayed, or
altered from existing databases.
First to access the Wizard chose
Database,
Database
Wizard
displaying a welcome screen as
shown at the left.
Choosing Next will bring you to this
screen where you must make your
choice of Creating a new database
or opening an existing one for
editing. Clicking Browse, will open a
browser for selecting the file that
you wish to edit. Choose the file and
then Open to select. In the event of
generating a new database,
29
This page defines the type of
connection to database and, when
necessary, the initialisation
parameters. Currently OceanView TM
supports ODBC protocol and native
Microsoft Access link. When
connecting to database via ODBC
you must select the Data Source
from the list of available data
sources and input the user name
and password. This information
defines the access rights of a particular user to the database or particular tables or
fields. A system administrator should set the appropriate parameters for this
function. When connecting to Microsoft Access file (*.mdb) the full path must be
defined. The “Custom connection string” allows the manual input of this information.
This page will present the available
tables of connected databases and
allow the selection that will be
associated with the created
database (linked to Ocean View).
Select a table from the options and
click Next.
30
Definitions
of
required
and
additional fields are prompted in this
screen. Required fields are used for
initialisation of the legend, additional
fields are used for correct
presentation of the data and
activation
of
communication
features. This page allows for the
association of names of fields as
they are used in OceanView T M with
the corresponding fields even if they
When options have been selected and chosen, click next to bring up the following
dialogue:
In this stage, definitions of database
fields will be chosen. The left side of
the window displays the list of all the
available fields of the database. The
right window presents the fields that
are selected to display. Left and
right buttons allow for changing the
contents of displayed fields. Up and
down buttons change the order of
fields in the OceanView T M table.
are a different name.
The following list will help to clarify the selection process:
ID – Select the field in the database that is used for the unique identifier of records.
Metrics – Select the field in database that is used for metrics of the LINE or AREA
objects. The field should be of <binary> type (Microsoft Access: “OLE Object”,
Microsoft SQL Server: “image”). This is not necessary for Point or Note objects.
The last stage is to define a group
style. This gives objects that will
have particular values of attributes a
specific group style. This is not a
mandatory operation and may be
skipped if there is no need to have a
group. Criteria for this is defined by:
Field – associates a field of
database that will contain the
descriptor. Value – defines the
value of “Field” to sort out the
Latitude, Longitude – The fields, used to store georeferenced locations for Point
and Note objects. They can be of <double> or <string> type. If the field has the
string type, the format of data must be defined. The optional formats are as follows:
<DDºMM.mmm’$> pr <DDºMM’.mm $>, where DD is degrees, MM is minutes, mm
is decimal minutes, $ is directional (N,S,W, E). These fields are not necessary for
Line and Area Objects.
Style – This field is used to store the Personal Style of the object. When a new
object is created this field is empty. The Style editor of OceanView T M then allows the
application of a personal style for objects. The personal style has a higher priority
than the legend style. If this field is not defined in the database, Ocean View will
allow the application of a personal style for a maximum of 500 objects. In this case,
the style will be saved in the legend file. In the database this field should be <string>
type, not less than 100 symbols.
records that will match criteria.
The objects that match to defined
criteria are displayed on the chart in
accordance with style defined in the
group “Style”. Add will create a new
style and add to the list, Delete
removes the style from the list.
<Up> <Down> allow changing the
priority of styles, the highest priority
placed on the top.
Tooltip – Select the field of the name of the object. The string value will be used as
tooltip of object displayed when pointing the corresponding symbol on the chart.
URL – Various references to a world wide web address or a LAN file can be stored
in a dedicated field of the database. This field can be associated with URL. This
means that a value of this field is the reference to Website or name of file with a full
path. When such an object is displayed on the chart, click on the left mouse button
activates the corresponding program (Internet browser for www, and Microsoft Word
files)
When group styles are created, click
Next to complete generation of the
legend. The full path may be entered
Email – When the dedicated field of database is associated with this, OceanView TM
makes available the function of automatic generation of e-mail, addressed to the
recipient according to the value of this field.
31
32
manually or a Browse button is provided.
Safety contour only – When it is switched on, the only safety contour is displayed.
The remaining depth contours are not drawn on the chart.
Generic text off – This removes generic texts such as place names etc. This is
useful to remove cluttering when the chart is zoomed out too much.
Shallow pattern used – When this is activated the transparent pattern is added to
the area within the safety contour.
Plain borders –
5.0 Advanced Procedures and
Practical Applications
Danger symbols – Highlights dangerous objects in a safety contour.
Not danger depth off – Removes all spot soundings deeper than the value of safe
depth.
Central symbol off -
Vector electronic charts can be viewed with various settings depending on your
current needs. OceanView ™ supports two main presentation models: S-52,
developed for Electronic Chart Display Information System (ECDIS); and INT1
which is used for modern paper charts produced by Hydrographic Offices.
Coverage off – Removes the boundaries of data sets (electronic charts)
Text important – Turns on object information when in S-52 mode of display.
Lights info – Activates displaying of the light parameters as text.
In addition, viewing properties may be “tuned” to suit the user’s needs by applying
individual Display Mode and Chart Settings.
Overscale indicator – Provides vertical hatching when the chart is overscaled and
out of its normal accuracy.
Plain depth contour –Removes safety contour depth numbers.
5.1 Display Terminology and Parameters
Base Display -The minimum set of the chart information allowed by the IMO
Performance Standard for ECDIS.
Standard Display –A reduced set of information sufficient for safe navigation of a
ship along the planned route.
Quality of data off – Removes the special symbol that indicates the quality of
electronic chart. This is used in S-52 presentation mode only.
Sometimes when it is necessary to fit a relatively large area in the screen or to print
it in one page. When zooming in/out OceanView T M will normally try to select the
chart scale from the database that will automatically match the current zoom factor.
To prevent this selected fixed scale level from menu View, Scale level.
Full Display – All of the encoded chart’s objects.
Custom Display – Chart visuals set by the user. This can be generated based on
Base, Standard, or Full Displays adding and or removing selected objects.
For various vessels these display parameters may be of great help with regards to
safety contour, shallow contour, deep contour and safe depth. When applied they
can completely change the presentation of the chart giving useful information that
will match individual needs.
5.2 Creating Chart Templates
Once these items are tuned to individual specifications all chart settings can be
saved as templates for further use as OceanView T M bookmarks. When opened, this
bookmark will restore all applied chart settings and the preparation of presentation,
database maintenance, or generation of voyage reports can be continued. Settings
may be saved for further use as a template (for example, world overview, North
Europe, Baltic overview, vessel routing, SAR coordination centres).
Two shadows only – Normally presentation of electronic charts use four colours of
different depth areas. When this is activated, only two colours are used, one within
safety contour and another for safe area out of safety contour.
Text other – Selects unimportant object text information.
Lights leg off – This control activates displaying of light sectors in accordance with
visibility of corresponding light in scale of charts.
Safety contour off – This deactivates the displaying of the safety contours.
33
34
5.3 Manual Chart Updating
One of the main features of CM-93/3 technology is the automatic updating of
electronic charts. OceanView T M supports this feature to full extent but manual
updating is still important as local reports about navigational dangerousness may
not be included in the Notice to Mariners that are used in updating the central CM93/3 database.
SOLAS convention requires that all charts must be updated for intended voyages.
Before planning a new route or prior to updating an existing voyage it is strongly
recommended that OceanView T M has received the latest automatic and manual
updating.
The Charts button in the Route planning window will provide displaying of the
frames of all charts and scales that are intersected by the route corridor, or the
deviation buffer which can also be manually set within this window. In addition it
opens the database table with a list of all these charts with their properties (source
producing agency, date of original, date of compilation of dataset, last check date,
updating status etc.) so the user can decide whether automatic updating is sufficient
or if there is a need to apply manual updates if the chart is too old.
The Manual Update option is located in the menu. There is a wide variety of
navigational objects listed within the Add New Object under the menu. Features are
sorted in an orderly manner and within each feature, object properties may be
chosen.
Once the desired object is selected, the
point may be clicked onto the screen.
At this time, it may be moved, modified,
deleted, cancelled or saved from within
the Manual Update menu. Once the
object has been saved a graphical
representation of the point will be
visible upon the screen. As with other
objects, the updated object may be
queried in the same manner. Right
clicking on the object will bring up such
information as object properties, date of
modification, and name of person who
performed the update.
35
5.4 Safe Route Checking
After setting up the desired route, it is possible to check for safety within this
planned voyage. Route limits define the maximum XTE variation that is considered
safe for the vessel when moving through a route. Route limits and radius of turn can
be changed later for individual legs and waypoints. Planned speed of the vessel is
not of importance at this stage.
When all editing is completed save and activate Route Check. This will prompt
OceanView T M to check the safety of the voyage leg by leg based on available
cartographic information on the BEST SCALE charts and parameters of the
individual vessel. Unsafe legs will be marked in a wide red line and this will require
more editing to this leg to avoid a danger for navigation. This may be as simple as
moving the leg slightly to remain in safe depth areas.
5.5 Voyage Scheduling
Voyage Scheduling depends upon the task, it may be based on the arrival time or
with departure times. Ocean View calculates the total route time based upon many
factors such as: speed of the vessel at individual legs, duration of stop at ports of
call, turning radius of the vessel etc.
Individual field parameters may be set within the Route planning options and
individual items may be set and not necessarily route wide.
36
6.0 CM-93 Edition 3
7.0 Users Notes
OceanView T M is designed to function with C-MAP’s latest worldwide chart database
format, CM-93/3.
Information can be found at www.c -map.no or directly from C-MAP Norway:
C-MAP Norway AS
Hovlandsveien 52
4379 Egersund
Norway
Tel: +47 51464700
Fax: +47 51464701
Email: [email protected]
37
38
39
C-MAP Norway AS
Hovlandsveien 52
P.O. Box 212
4379 Egersund, Norway
Tel: +47 51464700
Fax: +47 51464701
email: market@c -map.no
C-MAP Italy S.r.l.
Via Caboto 9
Marina Di Carrara
Italy
Tel: +390 585 772444
Fax: +390 585 631282
email: [email protected]
C-MAP Russia Ltd.
21 Line 8, block H, Office 19
199026 St. Petersburg
Russia
Tel: +7 812 325 9894
Fax: +7 812 325 1234
email: [email protected]
C-MAP France S.a.r.l.
Route de Coray
BP.658 Erque Gaberic
29552 Quimper, Cedex 9, France
Tel: +33 9852 1215
Fax: +33 9852 1419
email: [email protected]
C-MAP South Africa Pty Ltd.
Box 30760
7966 Tokai
South Africa
Tel: +27 21 701 2930
Fax: +27 21 701 2945
email: [email protected]
C-MAP Poland S.p.z.o.o.
Bldg of Oceanotechnichs
Technical University of Gdansk
ul. G. Narutowicza 11/12 Poland
Tel: +48 58 347 2949
Fax: +48 58 347 2148
email: [email protected]
C-MAP Australia Pty. Ltd.
259B Victoria Road
Gladesville
Australia, NSW 2111
Tel: +61 298 790277
Fax: +61 298 790322
email: c-mapinfo@c -map.com.au
C-MAP Baltic Ltd.
Akadeemia tee 21G
EE0026 Tallin
Estonia
Tel: +372 6397 96 6
Fax: +372 6397 968
email: [email protected]
C-MAP Hellas Ltd.
147 Sygrou avenue
17121 Athens
Hellas
Tel: +30 1937 3588
Fax: +30 1937 3598
email: [email protected]
C-MAP Japan
1518-430 Koyata Iruma-City
358 Saitama
Japan
Tel: +81 429 659887
Fax: +81 429 659916
email: [email protected]
C-MAP UK Ltd.
System House
Delta Business Park, Salterns Lane
Fareham PO16 0QM England
Tel: +44 1329 517777
Fax: +44 1329 517778
email: sales@c -map.co.uk
C-MAP Commercial Inc.
133 Falmouth Rd. - Building II
Mashpee, MA 02649
USA
Tel: +1 508 477 7537
Fax: +1 508 477 7549
email: [email protected]