1
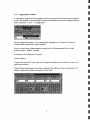
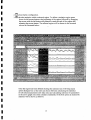
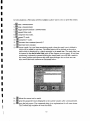
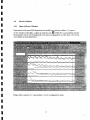
I
MOOR INSTRUMENTS LIMITED
Moorsoft for Windows for moorLAB VI. 1
USER MANUAL (Issue 1)
A data handling program for use with the moorLAB
25th January 2000
Moor Instruments Limited
Millwey Rise
AXMINSTER
Devon
EX13 5HU
England
Tel,+44(0)1297 35715
Fax+44 (0)1297 35716
Website: www.moor.co.uk
Email: marketing(@moor.co.uk
1
USING THE MOORLAB USER MANUAL
3
2
NEW FEATURES COMPARED WITH Vl.O
4
3
INTRODUCTION
5
3.1
LASER DoppLER BLOOD FLOW MEASUREMENT
OVERVIEW OF MOORLAB
THE COMPUTER AND SOFTWARE INSTALLATION
3.2
3.3
3.3.1
3.3.2
3.3.3
4
5
7
7
Computer Specifications
Software Installation
Registration Number
7
7
8
STEP BY STEP GUIDE
4.1
9
MONITORING WINDOW
4.1.1
4.1.2
4.1.3
4.1.4
4.1.5
4.1.6
4.2
Open a Monitor Window
Setup Monitor Configuration
Setup Display Configuration
Configuration
Start a Measurement
Icon Functions
REVIEW WINDOW
4.2.1
4.2.2
Open a Review Window
Icon Functions
9
file
9
10
11
12
12
12
17
17
18
Moor Instruments Limited assumes no responsibility for the operator's failure to
comply with instructions given in this manual.
1
USING THE moorLAB USER MANUAL
This manual is for use with Moor Instruments' Moorsoft for Windows for
moorLAB/floLAB software, run on an IBM 486 PC, Pentium or compatible, in
conjunction with the moorLAB/floLAB blood flow monitor.
Users unfamiliar with laser blood flow monitoring and analysis should read the
Introduction of this manual. Otherwise users need only read the section 'Step by Step
Guide'.
2
NEW FEATURES COMPARED WITH V1.0
This version:a.
Does not require a dongle key to operate (see Section 3.3.3 Registration Number).
b.
Can display graphically either cone or dc values and stored values of either cone
or dc (Version 1.0 did not allow display and reading of dc).
3
INTRODUCTION
3.1
Laser Doppler Blood Flow Measurement
Laser Doppler flowmetry provides easy to use, non-invasive, real time measurements of
local tissue blood flow. Laser Doppler blood flow measurement uses the Doppler
frequency broadening of laser light, when the light is reflected off a moving object. The
degree of broardening is dependent on the speed ofthe moving object, the wavelength of
the laser light and the angle ofthe scatter. For example laser light, wavelength 780nm,
back scattered off a particle moving in a watery medium with a speed of 1 mm/sec has a
frequency shifl of approximately 3.3KHz. Laser light is used to illuminate the skin tissue
resulting in some ofthe light being reflected straight back by the static tissue, and some
being reflected by moving blood. The reflected light from the static tissue and the
frequency broadened light from moving blood is collected and mixed on a photodetector.
The photocurrent can then be processed to produce indications ofthe flux, concentration
and speed ofthe moving blood.
The moorLAB/floLAB uses solid state laser diodes as the laser light sources at about
780imi. Two glass fibres are used, mounted in a probe head, one to transmit the laser light
to illimiinate the tissue, and the other fibre to collect the reflected light. This is then
photodetected. The signal from the photodetector is amplified and processed by an
analogue processor. The signal is then sampled and further processed by a digital
processor. The digital processor also performs all the user interface and display functions.
The mean blood cell flux (flux), nimiber concenfration of moving blood cells (cone),
mean speed ofthe blood (speed) of each moorLAB/floLAB channel are output to a PC in
real time via an RS232 serial link.
If moorLAB/floLAB is running on a PC, this information may be collected, displayed,
stored, analysed and converted into moorLAB format or text format.
The algorithms used to compute flux cone and speed are as follows :kl Pfi>P(<y)dcy - (dark + short noise)
flux =•
dc^
k 2 V F(Q))do} - (dark + short noise)
cone = •
dc'
speed = k3x flux/cone
OD is the frequency of Doppler shift
( OD = 27if, f: frequency in Hz)
P(o3) is the power of signal at frequency o
dc is the intensity of all detected light
(01 is the low cut off frequency
(ffi \ - 2nf\, f1: frequency in Hz)
©2 is the high cut off frequency
(M2 = 2nf2, ^2' frequency in Hz)
k^, k2 and k3 are scaling constants
The optical imits are arbitrary. The values assigned are determined by standardising the
moorLAB/floLAB parameter of flux (blood flow) etc, using a physical standard, e.g. the
thermal (Brownian) motion of polystyrene microspheres (sub-micron diameter sphere) in
water.
The laser Doppler monitor user guide should be consulted for information on calibration.
3.2
Overview of moorLAB
The moorLAB program receives the moorLAB/floLAB real time flux and cone data via
the RS232 serial link and converts the information into a graphical format. The data will
be displayed in real time and stored.
The moorLAB software consists of two different windows, they are:
Monitoring window:
receive and display real time parameter signals from
moorLAB/floLAB.
Review window:
load and analyse saved parameter data from a moorLAB format file.
3.3
The Computer and Software Installation
3.3.1
Computer Specifications
Only computers complying with lEC 950 should be used.
The minimum requirements for running the moorLAB software is:Processor - 486 dx PC (Pentium is recommended).
Memory - 4Mb RAM, 50Mb space on hard disk drive (depending on monitoring
duration), minimimi recommended.
Operating system - Windows™ 3.11 or higher, e.g. Windows"^" 95.
3.3.2
Software Installation
A working knowledge of Windows"^"^ is assumed for installation and operation of
moorLAB software.
To install, place the disk in the drive A. From Program Manager select File, then Run.
Type:
A:INSTALL
Then follow the instructions.
3.3.3
Registration Number
A registration nimiber has been assigned to the copy of moorLAB that has been supplied
to you. This number is automatically recorded at installation and can be displayed during
RUN. Click File -> New -> Configuration
|^fe'JaS!a>US&Sarft&-;a!h^5^>
Do not change this number. If it is accidentally changed you will need to re-enter it.
Contact Moor Instruments if help is needed.
Note if you are using a demonstration version this is fiilly operational but is a time
limited version - usually 3 months.
A message will be displayed on expiry:Cannot Monitor
Program has passed its expiry date use Configuration/Registration Number to enter new
registration number.
Contact Moor Instruments if you wish to purchase the software. Moor Instruments will
supply a regisfration number on receipt of your order.
Seitirtg Up Registralioh Niimbei':
STEP BY STEP GUIDE
4.1
Monitoring Window
4.1.1 Open a Monitor Window
To open a Monitoring window select File —>^ New or click the icon^1=
A monitoring window (illustrated below) will be shown:
^moorLAB'liaser Doppler Peifusjon Mbniioilyi'J0;T:i[rnobrLAB;Moniloi:(Graph-1)]
ialilM
^^^^^^mfmMm^^m^m^^m^&m^^^m^m^mM
4.1.2
Setup Monitor Configuration
To setup monitor configiu-ation select Configuration -> Monitor Setup or click the icon
MB. The following window will appear:
In the above window the serial port, scroll/slide display mode, monitoring schedule and
the display of dc or cone can be selected. Note that for some computers a delay in the
graphic display can be observed in scroll mode. Ifthis occurs slide mode should be used.
Note that in this version of moorLAB software only the free run and preset time
modes are implemented, others are greyed out.
10
4.L3
Setup Display Configuration
Once a monitoring window is open the display confix ration can be defined by selecting
Configiu-ation -^ Display Setup or clicking the icon 0
The following window will be available.
Settings for graphic display'
in which the graph link status, active graph, graph labels, graph units, time scale and time
offset can be changed. The parameter traces which will be displayed in each graph can be
defined by ticking the corresponding check box (button). Upto 4 parameters can be
assigned to each graph. If more than 4 parameters are chosen the first 4 will be used.
The time constants, Y offsets and Y scales can be configured by clicking the Y and TC
button in the above window. The following dialogue box will be shown to allow user to
change the settings:
11
Sellings for Y:ScaIes;ahdT.Gsi!
i|iaiiM.4bayilMiE.».^llli;^^
4.1.4
Configuration file
The configtirations described in sections 3.1.2 and 3.1.3 can be saved into a file
(Configuration -> Config File -> Save) so that user can use the same configuration next
time by loading the config file (Configuration -^ Config File -^ Load).
4.1.5
Start a Measurement
Once a monitoring window is open and the moorLAB is in the RUN mode a
measurement can be started by selecting Monitor -> Start or clicking the icon iM:. A
measurement can be Paused/Continued by toggling the icon Iffi. At the end of a
measurement selecting Monitor —>• Abort or clicking the icon ==1 will stop the
measurement. The recorded data can be saved by selecting File —> SaveAs or clicking the
icon Sua. There are two file formats available: moorLAB format and text format.
4.1.6
Icon Functions
The operations of individual elements ofthe icon tool bar are described below:
1. E i setup monitor configuration.
12
2. liliJ setup display configuration.
3.0
3.1z l calculate statistics within a selected region. To define a statistics region press
down the left mouse button at the beginning ofthe region followed by dragging
the mouse with the left button still pressed to reach the end of the region and
releasing the mouse button. The selected region will be shown in the inverted
colours as illustrated below:
GsmbbrLABiiLaser DbppleriPerfiJsioh.Mbniibr;^^^^
Once the region has been defined clicking the statistics icon will bring up an
option dialogue box so that user can choose between calculating the statistics
for all selected parameters (raw data only) and calculating statistics for parameters
in the active graph only (time constant considered). If the first option is chosen the
statistics will be shown as follows:
13
Slalistics (example, mlb)
Fl
Cl
SI
F2
C2
32
F3
C3
S3
F4
C4
54
Mean
245.0
203.0
59.8
152.1
112.5
66.9
97,5
92,7
52,2
96,5
63.5
75,1
Min
184
194
47
115
105
53
77
85
43
77
61
62
Std
30,1
3,6
7.0
18,7
3,8
7,0
10,2
6,6
5,7
10,1
1,5
7,2
Total Point =86
Start point: 2,4 sec, Endpoint;
TC = OFF
Max
292
210
71
192
120
80
127
115
69
117
67
90
Median
249
203
61
155
112
69
99.
91
51
98
63
76
4,5 sec.
If the second option is selected the following table will be given as graph 1 is the selected
active graph:
^2; example.mlb lSlalistics-2)
Statistics (example.mlb)
Fl
Cl
SI
Mean
245,0
203.0
59,8
Std
30,1
3,6
7,0
Min
184
194
47
Total Point =86
Start point; 2.4 sec, Endpoint: 4,5 sec.
Active Graph Number = 1 , TC = off
14
Max
292
210
71
Median
249
203
61
In both situations a File menu will be available to allow user to save or print the results.
start a measurement.
stop a measurement.
6.11 toggle pause/continue a measurement.
expand time scale.
compress time scale.
expand Y scale.
10. i i compress Y scale.
11.1 * increase time constant (smooth) *
12.1 I decrease time constant.
insert a mark. In a real time monitoring mode, when the mark icon is clicked a
13.
mark will be added in real time. The added mark will be defined as the active
mark which is displayed by a black rectangle in the mark bar. The mark label can
be entered in the mark label Edit (refer to the diagram on next page). If real time
monitoring is aborted or paused clicking the insert mark icon will add a mark in
the cursor position and open an edit mark notes dialogue box so that user can
enter mark label and comment as illustrated below:
I
1 4 . 1 ^ delete the current active mark.
15. s print the parameter fraces displayed in the current window after a measurement.
16. Mi open the help menu. The commands help gives explanations for all menu items.
The Toolbar help explains all icon functions.
15
17. Link status: cHcking the link status rectangle will toggle between link/un-link ofthe
graphs. If'L' is displayed in the rectangle all graphs are Hnked, i.e. changing Y
scale, Y offset and time constant will affect all graphs. If'U' is displayed in the
rectangle all graphs are not linked, i.e. changing Y scale, Y offset and time
constant will only affect the active graph.
link status
active graph
Yscmllbax ^
X scroll 1>ar
18.'Active graph: clicking on the nimibered rectangle or on the graph rectangle will make
that graph as the active graph.
19. « make the previous mark (left to the current active mark) as the active mark.
20. » make the next mark (right to the current active mark) as the active mark.
21.x scroll bar: it can be used to change time offset. (Any X scroll bar action will affect
all graphs).
22. Y scroll bar: it can be used to change Y offset. If all graphs are linked any Y scroll bar
action will affect all graphs, otherwise it will only affect the active graph.
f
16
4.2
Review Window
4.2.1
Open a Review Window
Data stored in the moorLAB format can be loaded into a review window. To open a
review window select File -> Open or click the icon lal. If the file is successfijlly opened
the parameter traces will be displayed in the same configiu-ation as when they were saved.
An example is illustrated below:
B ^ moorLAB, LasefDbpplerPeilusioniMbnitqr.VI ^
Please refer to section 3.1.3 and section 3.1.4 for configuration setup.
17
4.2.2
Icon Functions
The icon ftmctions in a review window are the same as in a monitor window (refer to
section 3.1.6), except that the icons !MI, = ^ and IkH are not available in a review
window.
18
ilTh
f^
n11
/ \
n
. I '""
r—1
-'j^l
|L
r_
i
•
^
11
11 1
1.
!
—I
[1
K
J:
r '
Ii
;r^.
il
!;
il
1 :
!l
n
h
i1
u
n
1
1
11
1i
1
\
:
..L.'
1
i' J
Lr
ij
n^
i-,u
/
1 I
f?
L
1 '
1
LI
1
'1
i
ii
.-i'-'
r
1
II
Hi :
ll u
1
1
u
1
i'
u
U
1
rL
|-|'
,
1
1
i!
11
;KJ:
-
Kf-
^
J
r
•^v.
J
M o o r i n s t r u m e n t s L t d . Millwey, Axminster, Devon EX13 5HU, England
Telephone: +44 (0) 1297 3 5 7 1 5 Fax: +44 (0) 1297 3 5 7 1 6
E-mail: mail@moor,co,uk Internet: http://www,moor,co,uk
/
/
M o o r i n s t r u m e n t s i n c . 501 Silverside Road, Suite # 6 6 , Wilmington, DE 19809, USA
Telephone: (302) 798-7470 Fox: (302) 798-7299
E-mail: moorinc@interserv,com
./
i-j
U
p. J.
-
L
n'-
1
i
L
i
ll
0
"s.
1
^
b'%
•Ji|
n
u 1
•
J:
... i
^i!
f"^\
r i
I 1
1
1
r
||