1
TRACK ‘N TRADE PRO
VERSION 4.0
Accumulating Wealth One Tic at a Time!®
USER’S GUIDE
Track ‘n Trade Pro 4.0 User Manual
1
Track ‘n Trade Pro 4.0 User Manual
2
A Special Thanks to:
Lan Turner
Erik Larson
Nick Russell
Ben Marchant
Krystal Anderson
Janie Blair
Jacob Anawalt
Jana Perkins
Phillip Arnoldson
Gecko Software, Inc.
95 West Golf Course RD
Suite 107
Logan, UT 84321
http://www.geckosoftware.com
Copyright © 2004 Gecko Software, Inc. All Rights Reserved.
Track ‘n Trade Pro 4.0 User Manual
3
Track ‘n Trade Pro 4.0 User Manual
4
Introduction to Futures .......................................... 17
Introduction ...................................................................................17
What are Futures? ........................................................................17
Margins and Guaranteeing Futures...............................................18
The Long and Short of Trading .....................................................20
Calculating Profit/Loss: .................................................................21
Points vs. Cents: ...........................................................................22
Margins, Cents, Points & the Power of Leverage.........................24
Types of Orders ............................................................................27
Look Before You Leap: .................................................................29
Keyboard Shortcuts Quick Reference .................. 39
Creating Chartbooks from Start to Finish ............ 43
Opening or Creating a New Chartbook .........................................44
Adding/Removing Charts in your Chartbook .................................44
Switching between Charts in your Chartbook................................45
Saving and Closing a Chartbook...................................................45
Opening an Existing Chartbook.....................................................47
Saving Charts as an Image ...........................................................48
Printing a Chart .............................................................................49
Scaling a Chart..............................................................................50
Auto Scale Charts....................................................................50
Sizing Controls: .......................................................................50
Data Downloads ...................................................... 53
Commodity Chooser .....................................................................53
Commodity Symbols .....................................................................55
Data Download Utility....................................................................58
Data Tab .......................................................................................60
Key Tab.........................................................................................62
Importing Data...............................................................................64
Exporting Data ..............................................................................65
Firewalls ........................................................................................65
Analyzing Charts with Charting Tools .................. 69
Introduction ...................................................................................69
Crosshair Tool...............................................................................69
Technical Analysis ........................................................................72
Support....................................................................................72
Resistance...............................................................................72
Line Tool .......................................................................................73
Multi-Line Tool..............................................................................74
Channels .......................................................................................76
Narrow Sideways Channel ......................................................76
Narrow Sideways Channel Tool ....................................................76
Track ‘n Trade Pro 4.0 User Manual
5
Inclining Channel..................................................................... 78
Declining Channel ................................................................... 79
Inclining/Declining Channel Tool................................................... 80
50% Retracements ....................................................................... 81
N% Tool ........................................................................................ 82
1-2-3 Formations .......................................................................... 85
1-2-3 Top................................................................................. 85
1-2-3 Bottom ........................................................................... 86
1-2-3 Tool ..................................................................................... 87
Head & Shoulders Formation........................................................ 88
Head & Shoulders - Top.......................................................... 88
Head & Shoulders - Bottom..................................................... 89
Head & Shoulders Tool................................................................. 90
Triangle and Wedge Formations................................................... 92
Inclining Wedge....................................................................... 92
Declining Wedge ..................................................................... 93
Symmetrical Triangle............................................................... 94
Non-Symmetrical Triangle....................................................... 95
Wedge and Triangle Tool.............................................................. 96
Trend Fan ..................................................................................... 97
Trend Fan Tool ........................................................................... 100
Advanced Charting Tools .................................... 103
Introduction ................................................................................. 103
Elliot Wave Theory...................................................................... 103
Elliot Wave Tool .......................................................................... 105
Dart (Blip) Formations................................................................. 106
Dart Up (Blip) Formations...................................................... 106
Dart Down (Blip) Formation................................................... 106
Dart/Blip Tool .............................................................................. 107
Gann Fan Theory........................................................................ 108
Gann Fan Tool............................................................................ 109
Andrews Pitchfork Theory........................................................... 111
Andrews Pitchfork Tool ............................................................... 111
Fibonacci Retracements ............................................................. 114
Fibonacci Retracement Tool ....................................................... 115
Fibonacci Arc Tool ...................................................................... 117
Fibonacci Time Zones................................................................. 119
Calculating Trading/Actual Days................................................. 121
Days “Up” and “Down” ................................................................ 121
Day Offset Tool........................................................................... 122
Rounded Top & Bottom Formations ........................................... 123
Rounded Top & Bottom Formations ........................................... 124
Rounded Top ........................................................................ 124
Rounded Bottom ................................................................... 124
Double Top............................................................................ 124
Double Bottom ...................................................................... 125
Triple Top .............................................................................. 125
Track ‘n Trade Pro 4.0 User Manual
6
Triple Bottom ......................................................................... 125
Arc Tool.......................................................................................126
Personalizing Your Charts with........................... 131
Introduction .................................................................................131
Notes Window .............................................................................132
Arrow Tool...................................................................................132
Flag Tool .....................................................................................133
Text Tool .....................................................................................135
Box Tool ......................................................................................136
Circle Tool ...................................................................................137
Using Indicators.................................................... 141
Introduction .................................................................................141
Displaying Indicators in the Indicator Window ....................... 141
One Button ............................................................................ 141
All Button ............................................................................... 142
Buy/Sell Signals ..........................................................................143
%R – Williams Percent R ............................................................146
AD –Williams AD.........................................................................148
CCI –Commodity Channel Index.................................................150
DMI – Directional Movement Index .............................................153
HVOL – Historic Volatility ............................................................158
MACD Moving Average Convergence/Divergence ....................163
MOM – Momentum .....................................................................166
RSI – Relative Strength Index .....................................................169
FSTO – Fast Stochastics ............................................................173
SSTO - Slow Stochastics ............................................................176
VOL/OI –Volume/Open Interest ..................................................179
Displaying Indicators in the Chart Window ............................ 181
Moving Average Lines.................................................................181
Double Moving Average ........................................................182
Triple Moving Average........................................................... 182
Pivot Points .................................................................................186
10x8 MAC ...................................................................................188
10x8 MAC ...................................................................................189
DON – Donchian Channels .........................................................191
PSAR – Parabolic Stop and Reversal .........................................192
Long Term Charts ................................................. 195
Using Calculators ................................................. 203
Dollar Calculator..........................................................................203
Risk/Reward Calculator...............................................................204
Program Options................................................... 209
Introduction............................................................................ 209
Global Settings............................................................................210
Track ‘n Trade Pro 4.0 User Manual
7
Track ‘n Trade Pro Themes................................................... 211
Long Term............................................................................. 212
Tools ........................................................................................... 213
My Default Settings..................................................................... 217
Appearance........................................................................... 218
Bollinger Band....................................................................... 220
MAC ...................................................................................... 221
Moving Averages .................................................................. 222
Pivot Points ........................................................................... 223
PSAR – Wilder’s Parabolic Time/Price.................................. 224
Scaling & Price Bars ............................................................. 225
AD - Williams Accumulation/Distribution ............................... 226
CCI - Commodity Channel Index........................................... 227
DON – Donchian Channels ................................................... 229
DMI/ADX – Directional Movement Index ............................... 230
HVOL – Historic Volatility ...................................................... 232
MACD – Moving Average Convergence/Divergence ............ 233
MOM – Momentum ............................................................... 235
%R – Williams Percent R ...................................................... 236
RSI – Relative Strength Index ............................................... 238
FSTO – Fast Stochastics ...................................................... 239
SSTO – Slow Stochastics ..................................................... 241
VOL/OI – Volume and Open Interest .................................... 243
Ruler Bar..................................................................................... 244
Current Chart Settings ................................................................ 245
Accounting & Simulator Plug-in......................... 247
My Account ........................................................................... 253
Deposits and Withdrawals..................................................... 255
Trade Log.............................................................................. 256
Simulation ............................................................................. 257
Smooth Scroll........................................................................ 258
Options Plug-In ..................................................... 263
Introduction ........................................................................... 263
Options Accounting ............................................................... 266
Interest Rate History ............................................................. 269
OS Calculator........................................................................ 270
OSV & STRK Options Indicators........................................... 272
Black and Scholes Calculations ............................................ 275
Seasonals Plug-In................................................. 279
Introduction ........................................................................... 281
Seasonal Trends ................................................................... 281
Historical Averages ............................................................... 282
Market Probability ................................................................. 284
Spreads Plug-In .................................................... 287
Track ‘n Trade Pro 4.0 User Manual
8
Introduction............................................................................ 289
Spread Margins ..................................................................... 292
Commitment of Traders Plug-In .......................... 293
Commitment of Traders Key .......................................................296
Displying the Commitment of Traders Indicator ..........................296
Methods of Displaying the COT Indicator....................................297
Customizing Commitment of Traders Indicator ..........................297
COT Program Options ................................................................298
Customizing JBCOT Indicator .....................................................300
Candlestick Charting ............................................ 305
Track ‘n Trade Pro 4.0 User Manual
9
END-USER LICENSE AGREEMENT FOR GECKO SOFTWARE
IMPORTANT-READ CAREFULLY: This Gecko End-User License Agreement
("EULA") is a legal agreement between you (either an individual or a single entity)
and Gecko Software, Inc., corporation for the Gecko software product identified
above, which includes computer software and may include associated media,
printed materials, and "online" or electronic documentation and data ("SOFTWARE
PRODUCT"). The SOFTWARE PRODUCT also includes any updates and
supplements to the original SOFTWARE PRODUCT provided to you by Gecko. Any
software provided along with the SOFTWARE PRODUCT that is associated with a
separate end-user license agreement is licensed to you under the terms of that
license agreement. By installing, copying, downloading, accessing or otherwise
using the SOFTWARE PRODUCT, you agree to be bound by the terms of this
EULA. If you do not agree to the terms of this EULA, do not install or use the
SOFTWARE PRODUCT; you may, however, return it to your place of purchase for
a full refund.
SOFTWARE PRODUCT LICENSE
The SOFTWARE PRODUCT is protected by copyright laws and international
copyright treaties, as well as other intellectual property laws and treaties. The
SOFTWARE PRODUCT is licensed, NOT SOLD!
1. GRANT OF LICENSE. This EULA grants you the following rights:
Track 'n Trade Software. You may install and use one copy of the SOFTWARE
PRODUCT on two desktop systems, and one laptop system. (Intended for one copy
at work, one copy at home, and one copy for travel.) You may not allow remotely
connected COMPUTERS, nor to invoke application sharing of the software. This
connection includes any indirect connections made through software or hardware
which pools or aggregates connections. This multi-station license agreement allows
you to personally use the software while at home, work or on the road; this is not
the right to lend out copies of this software to your friends and family. Even though
you are allowed to install the SOFTWARE on multiple workstations, the
SOFTWARE can only be executed and running on one COMPUTER at a time; no
simultaneous use is allowed without the purchase of additional licenses.
Storage/Network Use. You may also store or install a copy of the SOFTWARE
PRODUCT on a storage device, such as a network server, used only to install or
run the SOFTWARE PRODUCT on your other COMPUTERS.
License Pak. If this package is a Gecko License Pak, you may install and use
additional copies of the computer software portion of the SOFTWARE PRODUCT
up to the number of copies specified above as "Licensed Copies".
2. DESCRIPTION OF OTHER RIGHTS AND LIMITATIONS
Academic Edition Software. If the SOFTWARE PRODUCT is identified as
"Academic Edition" or "AE," you must be a "Qualified Educational User" to use the
SOFTWARE PRODUCT. If you are not a Qualified Education User, you have no
rights under this EULA. Furthermore, you are only allowed to install the
SOFTWARE PRODUCT on one single COMPUTER, not the three systems as
described above. To determine if you are a Qualified Educational User, please
contact the Gecko Sales Information Center in the USA at 435-752-8026.
Not For Resale Software. If the SOFTWARE PRODUCT is labeled "Not For Resale"
or "NFR," then, notwithstanding other sections of this EULA, your use of the
SOFTWARE PRODUCT is limited to use for demonstration, test, or evaluation
purposes and you may not resell, or otherwise transfer for value, or install the
SOFTWARE PRODUCT on more than one single COMPUTER.
Track ‘n Trade Pro 4.0 User Manual
10
Limitations on Reverse Engineering, Decompilation, and Disassembly. You may not
reverse engineer, decompile, or disassemble the SOFTWARE PRODUCT, except
and only to the extent that such activity is expressly permitted by applicable law
notwithstanding this limitation.
Separation of Components. The SOFTWARE PRODUCT is licensed as a single
product. Its component parts may not be separated.
Rental. You may not rent, lease or lend the SOFTWARE PRODUCT.
Trademarks. This EULA does not grant you any rights in connection with any
trademarks or service marks of Gecko Software, Inc.
Support Services. Gecko may provide you with support services related to the
SOFTWARE PRODUCT ("Support Services"). Use of Support Services is governed
by the Gecko polices and programs described in the user manual, in "on line"
documentation and/or other Gecko-provided materials. Any supplemental software
code provided to you as part of the Support Services shall be considered part of the
SOFTWARE PRODUCT and subject to the terms and conditions of this EULA. With
respect to technical information you provide to Gecko as part of the Support
Services, Gecko may use such information for its business purposes, including for
product support and development.
Software Transfer. The user of the SOFTWARE PRODUCT may make a one-time
permanent transfer of this EULA and SOFTWARE PRODUCT only directly to an
end user. This transfer must include all of the SOFTWARE PRODUCT (including all
component parts, the media and printed materials, any upgrades, this EULA, and, if
applicable, the Certificate of Authenticity). Such transfer may not be by way of
consignment or any other indirect transfer. The transferee of such one-time transfer
must agree to comply with the terms of this EULA.
Even though we have given the right to transfer the software application license, we
do not give the right to transfer data subscription services. Data subscription
services are non-transferable.
Termination. Gecko Software, Inc. may terminate your license and this EULA at any
time for any reason what so ever; without the obligation of reimbursement or
compensation. Therefore, if Gecko gives notice of termination of your license, or
you fail to comply with the terms of use set forth in this agreement, you must
destroy all copies of the SOFTWARE PRODUCT and all of its component parts.
3. UPGRADES. If the SOFTWARE PRODUCT is labeled as an upgrade, you must
be properly licensed to use a product identified by Gecko Software, Inc. as being
eligible for the upgrade in order to use the SOFTWARE PRODUCT. A SOFTWARE
PRODUCT labeled as an upgrade replaces and/or supplements the product that
formed the basis for your eligibility for the upgrade. You may use the resulting
upgraded product only in accordance with the terms of this EULA.
4. COPYRIGHT. All title and intellectual property rights in and to the SOFTWARE
PRODUCT (including but not limited to any images, photographs, animations,
video, audio, music, text, and "applets" incorporated into the SOFTWARE
PRODUCT), the accompanying printed materials, and any copies of the
SOFTWARE PRODUCT are owned by Gecko Software, Inc. or its suppliers. All title
and intellectual property rights in and to the content which may be accessed
through use of the SOFTWARE PRODUCT is the property of the respective content
owner and may be protected by applicable copyright or other intellectual property
Track ‘n Trade Pro 4.0 User Manual
11
laws and treaties. This EULA grants you no rights to use such content. All rights not
expressly granted are reserved by Gecko Software, Inc.
5. DUAL-MEDIA SOFTWARE. You may receive the SOFTWARE PRODUCT in
more than one medium. Regardless of the type or size of medium you receive, you
may use only one medium that is appropriate for your computer. You may not loan,
rent, lease, lend or otherwise transfer the other medium to another user, except as
part of the permanent transfer (as provided above) of the SOFTWARE PRODUCT.
6. BACKUP COPY. After installation of the SOFTWARE PRODUCT pursuant to this
EULA, you may keep the original media on which the SOFTWARE PRODUCT was
provided by Gecko solely for backup or archival purposes. If the original media is
required to use the SOFTWARE PRODUCT on the COMPUTER, you may make
one copy of the SOFTWARE PRODUCT solely for backup or archival purposes.
Except as expressly provided in this EULA, you may not otherwise make copies of
the SOFTWARE PRODUCT or the printed materials accompanying the
SOFTWARE PRODUCT.
7. U.S. GOVERNMENT RESTRICTED RIGHTS. All SOFTWARE PRODUCT
provided to the U.S. Government pursuant to solicitations issued on or after
December 1, 1995 is provided with the commercial license rights and restrictions
described elsewhere herein. All SOFTWARE PRODUCT provided to the U. S.
Government pursuant to solicitations issued prior to December 1, 1995 is provided
with "Restricted Rights" as provided for in FAR, 48 CFR 52.227-14 (JUNE 1987) or
DFAR, 48 CFR 252.227-7013 (OCT 1988), as applicable.
8. EXPORT RESTRICTIONS. You agree that you will not export or re-export the
SOFTWARE PRODUCT, any part thereof, or any process or service that is the
direct product of the SOFTWARE PRODUCT (the foregoing collectively referred to
as the "Restricted Components"), to any country, person or entity subject to U.S.
export restrictions. You specifically agree not to export or re-export any of the
Restricted Components: (i) to any country to which the U.S. has embargoed or
restricted the export of goods or services, which currently include, but are not
necessarily limited to Cuba, Iran, Iraq, Libya, North Korea, Sudan and Syria, or to
any national of any such country, wherever located, who intends to transmit or
transport the Restricted Components back to such country; (ii) to any person or
entity who you know or have reason to know will utilize the Restricted Components
in the design, development or production of nuclear, chemical or biological
weapons; or (iii) to any person or entity who has been prohibited from participating
in U.S. export transactions by any federal agency of the U.S. government. You
warrant and represent that neither the BXA nor any other U.S. federal agency has
suspended, revoked or denied your export privileges. MISCELLANEOUS This
EULA is governed by the laws of the State of Utah. If this product was acquired
outside the United States, then local law may apply. Should you have any questions
concerning this EULA, or if you desire to contact Gecko for any reason, please
contact Gecko on the World Wide Web at: www.GeckoSoftware.com.
LIMITED WARRANTY Gecko warrants that the SOFTWARE PRODUCT will
attempt to perform in accordance to our advertisements for a period of thirty (30)
days from the date of receipt. If it does not perform to your expectation, the only
guarantee Gecko Software gives is a refund of the purchase price paid for the
application. This warranty is only good for a period of 30-days from the date of
purchase. Gecko does not guarantee that any mathematical formulas are correct,
or that any data is correct, or that any of the rules used to create the software to
simulate real life situations are correct. These are just our best guess, and you as
the licensee of the software agree not to hold Gecko liable for any mistakes,
discrepancies, inaccuracies or errors that may be included with the software
Track ‘n Trade Pro 4.0 User Manual
12
application, supporting materials, manuals, or supplemental products provided by
Gecko Software, Inc. or its subsidiaries, groups, friends, associates, managers,
employee's, spouses, or anyone else who lives on planet earth. You agree to play
with this software totally and 100% at your own risk. This software application was
written as a game, in an attempt to simulate real market situations and as an
educational tool to practice such teachings and techniques; therefore you take upon
yourself the total and entire risk of loss if you decide to actually use this software in
an attempt to help you make any real life decisions -- whatever they may be.
If an implied warranty or condition is created by your state/jurisdiction and federal or
state/provincial law prohibits disclaimer of it, you also have an implied warranty or
condition, BUT ONLY AS TO DEFECTS DISCOVERED DURING THE PERIOD OF
THIS LIMITED WARRANTY (THIRTY (30) DAYS). AS TO ANY DEFECTS
DISCOVERED AFTER THE THIRTY (30) DAY PERIOD, THERE IS NO
WARRANTY OR CONDITION OF ANY KIND. Some states/jurisdictions do not
allow limitations on duration of an implied warranty, so the above limitation may not
apply to you. Any supplements or updates to the SOFTWARE PRODUCT, including
without limitation, any (if any) service pack or hot fixes provided to you after the
expiration of the thirty (30) day Limited Warranty period are not covered by any
warranty or condition, express or implied.
LIMITATION ON REMEDIES; NO CONSEQUENTIAL OR OTHER DAMAGES Your
exclusive remedy for any breach of this Limited Warranty is as set forth below.
Except for any refund elected by Gecko, YOU ARE NOT ENTITLED TO ANY
DAMAGES, INCLUDING BUT NOT LIMITED TO CONSEQUENTIAL DAMAGES, if
the SOFTWARE PRODUCT does not meet Gecko's Limited Warranty, and, to the
maximum extent allowed by applicable law, even if any remedy fails of its essential
purpose. The terms "Exclusion of Incidental, Consequential and Certain Other
Damages" below are also incorporated into this Limited Warranty. Some
states/jurisdictions do not allow the exclusion or limitation of incidental or
consequential damages, so the above limitation or exclusion may not apply to you.
This Limited Warranty gives you specific legal rights. You may have others that vary
from state/jurisdiction to state/jurisdiction.
YOUR EXCLUSIVE REMEDY Gecko and its suppliers' entire liability and your
exclusive remedy shall be, at Gecko's option from time to time, (a) return of the
price paid (if any) for, or (b) repair or replacement of, the SOFTWARE PRODUCT
that does not meet this Limited Warranty and that is returned to Gecko with a copy
of your receipt. You will receive the remedy elected by Gecko without charge,
except that you are responsible for any expenses you may incur (e.g. cost of
shipping the SOFTWARE PRODUCT to Gecko). This Limited Warranty is void if
failure of the SOFTWARE PRODUCT has resulted from accident, abuse,
misapplication, abnormal use or a virus. Any replacement SOFTWARE PRODUCT
will be warranted for the remainder of the original warranty period of thirty (30) days.
Outside the United States, neither these remedies nor any product support services
offered by Gecko are available without proof of purchase from an authorized
international source. To exercise your remedy, contact: Gecko Software, Inc., Attn.
Gecko Sales Information Center at the Web address specified above.
DISCLAIMER OF WARRANTIES The limited warranty that appears above is the
only express warranty made to you and is provided in lieu of any other express
warranties (if any) created by any documentation, packaging, or outside reseller
advertisements or claims. Except for the limited warranty and to the maximum
extent permitted by applicable law, Gecko and its suppliers provide the SOFTWARE
PRODUCT and Support Services (if any) AS IS AND WITH ALL FAULTS, and
hereby disclaim all other warranties and conditions, either express, implied or
statutory, including, but not limited to, any (if any) implied warranties or conditions of
merchantability, of fitness for a particular purpose, of lack of viruses, of accuracy or
completeness of responses, of results, and of lack of negligence or lack of
Track ‘n Trade Pro 4.0 User Manual
13
workmanlike effort, all with regard to the SOFTWARE PRODUCT, and the provision
of or failure to provide Support Services. ALSO, THERE IS NO WARRANTY OR
CONDITION OF TITLE, QUIET ENJOYMENT, QUIET POSSESSION, AND
CORRESPONDENCE TO DESCRIPTION OR NON-INFRINGEMENT WITH
REGARD TO THE SOFTWARE PRODUCT.
EXCLUSION OF INCIDENTAL, CONSEQUENTIAL AND CERTAIN OTHER
DAMAGES To the maximum extent permitted by applicable law, in no event shall
Gecko or its suppliers be liable for any special, incidental, indirect, or consequential
damages whatsoever (including, but not limited to, damages for loss of profits or
confidential or other information, for business interruption, for personal injury, for
loss of privacy, for failure to meet any duty including of good faith or of reasonable
care, for negligence, and for any other pecuniary or other loss whatsoever) arising
out of or in any way related to the use of or inability to use the SOFTWARE
PRODUCT, the provision of or failure to provide Support Services, or otherwise
under or in connection with any provision of this EULA, even in the event of the
fault, tort (including negligence), strict liability, breach of contract or breach of
warranty of Gecko or any supplier, and even if Gecko or any supplier has been
advised of the possibility of such damages.
LIMITATION OF LIABILITY AND REMEDIES Notwithstanding any damages that
you might incur for any reason whatsoever (including, without limitation, all
damages referenced above and all direct or general damages), the entire liability of
Gecko and any of its suppliers under any provision of this EULA and your exclusive
remedy for all of the foregoing (except for any remedy of repair or replacement
elected by Gecko with respect to any breach of the Limited Warranty) shall be
limited to the greater of the amount actually paid by you for the SOFTWARE
PRODUCT or U.S.$1.00. The foregoing limitations, exclusions and disclaimers
described above shall apply to the maximum extent permitted by applicable law,
even if any remedy fails its essential purpose.
Hypothetical or simulated performance results have certain limitations. Unlike an
actual performance record, simulated results do not represent actual trading. Also,
since the trades have not actually been executed, the results may have over or
under compensated for impact, if any, of certain market factors, such as lack of
liquidity. No representation is being made that any account will or is likely to achieve
profits or losses similar to those shown. The risk of loss in trading futures, stocks
and options can be substantial; therefore only genuine "risk" funds should be used
in such trading. Futures, stocks and options may not be suitable investments for all
individuals and individuals should carefully consider their financial condition in
deciding whether to trade. Option traders should be aware that the exercise of a
long option would result in a futures or stock position.
Gecko Software, Inc. at its discretion may, from time to time, contact you by
telephone, fax, email, paper mail, express mail, etc. By agreeing to this EULA and
installing this software, you are giving digitally written consent to receive telephone
calls from Gecko Software, Incorporated, its affiliates, and associated vendors, and
you wave your rights to any laws prohibiting Gecko from contacting you via
telephone, fax, email, or any other method preferred by Gecko.
Portions of the grid controls used in the data tab, broker's report, and Spreads
module are copyright (c) 1998, Chris Maunder.
DATA DOWNLOAD IS DEFINED AS: This is a non-guaranteed service, with no
rights or privileges whatsoever, and is only an extension of the service provided by
Track 'n Trade, and Gecko Software, Inc. not a standard feature.
Track ‘n Trade Pro 4.0 User Manual
14
SUBSCRIPTION BASED DATA DOWNLOAD IS DEFINED AS: Data in which
Gecko Software provides by computer transmission services to their subscribing
customers. This service is not a guaranteed service, and may be discontinued or
off line for any given period or amount of time without warranty or restitution. Data
subscription services and fees are a non-refundable, non-guaranteed extension of
service provided by Gecko Software Inc.
Data has been provided from sources believed to be reliable but no guarantee is
made as to its accuracy, therefore use of this data in making real-life trading
situations is strongly discouraged. When trading "real" markets, consult a licensed
brokerage firm to confirm ALL price action; always remember, this is a game, and
the data provided is for simulation and practice purposes only. This license does
not give any recipient the right to re-transmit or re-distribute this data in any format
whatsoever. Much of the options data provided by Gecko Software is not even real
market data, but “fictitious data” generated by the Black and Scholes mathematical
model, it is never recommended that you use Track ‘n Trade Pro options data as a
reference to the actual “live” market data.
Final Disclaimer: Track ‘n Trade pro and all plug-in modules were specifically
designed for entertainment purposes only – have fun!
Track ‘n Trade Pro 4.0 User Manual
15
Track ‘n Trade Pro 4.0 User Manual
16
TRACK ‘N TRADE PRO
VERSION 4.0
Accumulating Wealth One Tic at a Time! ®
INTRODUCTION TO FUTURES
Track ‘n Trade Pro 4.0 User Manual
15
Track ‘n Trade Pro 4.0 User Manual
16
Introduction to Futures
INTRODUCTION TO FUTURES
The Basics of Futures Trading
Introduction
The Stock Market evolved into being a way for companies to raise
capital. By exchanging ownership in a company for cash, early
business ventures were able raise capital to buy equipment, or
build factories. Companies hundreds of years ago, as well as
today, primarily use the stock market as a means to raise capital.
The modern futures market evolved not from a need to raise
capital, but from a need to transfer risk. The futures market
makes it possible for those who wish to manage price risk
(hedgers) to transfer that risk to those who are willing to accept it
in the hopes of a profit (speculators).
Futures markets are first and foremost a risk transference vehicle.
Futures markets also provide price information that the world
looks to as a benchmark in determining value of a particular
commodity or financial instrument on any given day or at any
specific time of the day. These benefits, risk transference, and
price discovery, reach every sector of the economy of the world
where changing market conditions create economic risk; including
such diverse fields as agricultural products, foreign exchange,
imports, exports, financing and investment vehicles.
What are Futures?
Futures contracts are standardized to meet the specific
requirements of buyers and sellers for a variety of commodities
and financial instruments. Quantity, quality, and delivery locations
(all the essential ingredients) are pre-established. The only
variable is price, which is discovered through an auction-like
process on the trading floor of an organized futures exchange.
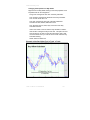
For example, assume an individual buys one contract of March
Corn at $2.25 per bushel on January 2nd, initiating a long
position. This contract calls for the delivery of 5,000 bushels of
Number 2 Yellow Corn seven days before the last business day of
the delivery month (March) at an exchange-recognized facility. If
on February 15th, the purchaser of the March Corn contract
wishes to exit his position, he can do so by selling one March
Corn contract.
Assuming that the contract was sold at $2.45 per bushel, the
holder of the March Corn contract would receive $1,000.00 before
Track ‘n Trade Pro 4.0 User Manual
17
Introduction to Futures
broker commissions and fees for holding the position for six
weeks:
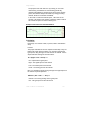
Profit or Loss = Sale Price – Purchase Price * # of bushels
($2.45 - $2.25 = $0.20 * 5,000 = $1,000.00)
Our person in this example is $1,000.00 richer for the experience,
and has no further obligation in the Corn market because the sale
of the March Corn futures contract at $2.45 per bushel offset the
earlier purchase at $2.25 per bushel.
Notice in this example, that all of the features of the contract were
predetermined by the exchange except price.
Quantity: 5,000 bushels for Corn futures
Quality of the Corn: #2 Yellow
Delivery time: 7th to last business day of the contract month
Location: exchange-recognized warehouse or transfer
station
Because futures contracts are standardized (with the only variable
being price) buyers and sellers are able to exchange one contract
for another and actually offset their obligation to deliver or take
delivery of the commodity underlying the futures contract.
Offset means taking an equal and opposite position in the futures
market to one’s initial position.
Margins and Guaranteeing Futures
The exchanges and their members are able to guarantee all
trades because they require all parties in a transaction to deposit
performance bond margins.
Performance bond margins are financial guarantees required of
both parties (buyers and sellers) of futures contracts to ensure
fulfillment of the contract obligations.
That is, buyers and sellers are required to take or make delivery of
the commodity or financial instrument represented by the futures
contract unless the position is offset before contract expiration.
Before entering into a transaction, both parties have to post Initial
Margin Requirement. The Initial Margin Requirement is the
amount of money a party must have on account with a clearing
firm (your broker) at the time the order is placed.
Initial margin funds must be on deposit before any trade can be
accepted. Maintenance Margin is a set minimum margin (per
outstanding futures contract) that a party to a futures contract
must maintain in his/her margin account to hold a futures position.
Track ‘n Trade Pro 4.0 User Manual
18
Introduction to Futures
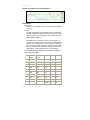
Initial Margin Requirements vary from commodity to commodity,
but are generally between 5% and 10% of the total value of the
contract.
For example, if March Corn futures are trading at $2.11/bushel,
the initial Margin Requirement for CBOT Corn futures is $405.00
per contract, with a maintenance margin requirement of $300.00.
Our speculator would have to have at least $405.00 on deposit
with his broker before he could enter the market. He would need
to have an account liquidating value of at least $300.00 per
contract in order to stay in the position.
Let’s assume that our speculator has $1,000 in his account and
decides to buy 2 contracts of March Corn at $2.35/bushel on
January 2nd. He is able to buy 2 contracts of March Corn
because he has more than the initial margin requirement of
$810.00 ($405.00 initial margin x 2 contracts = $810.00). With
$50.00 round turn commission rate ($25.00 in, $25.00 out) our
speculators broker would charge him $50.00 in commissions as
well. Assume that March Corn settled at his entry price of
$2.35/bushel. His account liquidating value would be $950.00, or
$1,000.00 initial deposit - $50.00 commission to buy 2 contracts of
Corn. Since the liquidating value of the speculators account
(Funds on Deposit + Open Position Profit or loss) is greater than
the maintenance margin requirement of $300.00 per contract or
$600.00 for 2 March Corn, he is able to stay in the trade.
The next day, much to our speculators detriment, Corn prices
drop by 5 cents. Our speculator now has an open position loss of
-$500.00 and an account liquidating value of $450.00 ($1,000.00 $50.00 commission - $450.00 open position loss = $450.00).
Since this value is less than the Maintenance Margin requirement
of $300.00 per contract, or $600.00, our speculator is on a Margin
Call.
In order to keep the position, the speculator must either send
enough money to bring the account back above the Initial Margin
Requirement of $810.00 or liquidate the position. The
Maintenance Margin Requirement is the minimum amount of
money, which must be in the account (including open position
profits and losses) to maintain an open position in the futures
market. If the value of the account dips below this level, then the
account holder must either send additional funds to his/her broker
or liquidate the position. Usually, traders have 5 business days to
get funds posted to the account, but in some cases the brokerage
firm may liquidate the futures positions in order to meet the Margin
Call.
Note: Brokerages have the right to liquidate your position
immediately, and many may require you to wire funds immediately
Track ‘n Trade Pro 4.0 User Manual
19
Introduction to Futures
to avoid liquidation. Also be aware that margin requirements are
subject to change without notice.
Remember, Initial Margin is the minimum amount of money you
must have in your account to open up a futures position.
Maintenance Margin is the minimum amount of money you must
have in your account to maintain the position. So in our Corn
example, the initial margin was $405.00 per contract, meaning
that a trader must have at least $405.00 per contract in his/her
margin account before a Corn futures position can be entered
into. After the position is entered into a balance of $300.00 per
contract or the Maintenance Margin must be maintained in order
for the position to be left open. If the available funds in the
account (funds deposited + open position profit or loss) are less
than the Maintenance Margin Requirement, then more funds must
be deposited or the futures positions will be liquidated or offset by
taking an opposite position in the futures market.
Reminder: Long or buy positions are offset or closed by selling,
while short or sell positions are offset or closed out by buying.
The dual margining system (initial and maintenance) of the futures
market ensures that all positions are adequately financed, insuring
the integrity of the futures market. The exchanges set the
minimum margin requirement based on the volatility and dollar
value of the contract. Margin levels are subject to change both up
and down at the discretion of the Exchange. Most brokerage
firms charge the exchange minimum margin, but they are entitled
to charge more, so be sure to check with your broker before
entering into any futures transaction.
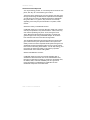
The Long and Short of Trading
There are two basic positions one can have in the futures
markets:
1. A long position entails the purchase of futures contracts in
anticipation of rising prices.
Purchasing a futures contract enters into a long position. Long
positions are profitable if the underlying futures contract increases
in price during the holding period. Selling the same quantity and
contract month that one initially purchased offsets a long position.
Long positions are typically used by consumers to hedge against
rising prices, and initiated by speculators in anticipation of higher
prices.
2. A short position entails the sale of futures contracts in
anticipation of lower prices.
Track ‘n Trade Pro 4.0 User Manual
20
Introduction to Futures
A short position is entered into by initially selling a futures
contract. In the futures market, unlike the stock market, it is just as
easy to establish a short position as a long position. Short
positions are profitable if the underlying futures contract
decreases in price during the holding period. Buying the same
quantity and contract month that you initially sold offsets your
short positions. If the resulting purchase price is less than the
original sale price, a profit is achieved. However, if the resulting
purchase price is greater than the original sale price, a loss is
incurred.
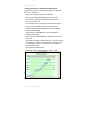
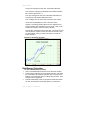
Commodity producers who wish to avoid potentially lower prices as a short position increases in value and prices decline - usually
establish short positions. Speculators anticipating lower prices in
the future establish short positions.
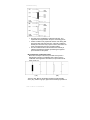
Calculating Profit/Loss:
To figure out the profit or loss associated with a position is the
same regardless of either a long or short position. The profit or
loss from a futures position is calculated as follows:
Profit or Loss = Sell Price – Buy Price x Contract Size x Number
of Contracts
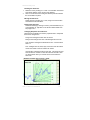
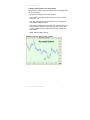
For example, assume a speculator thinks that Corn prices will go
down in the coming weeks. As such, he sells 2 March Corn
contracts at 235 ($2.35 per bushel, but corn prices are quoted in
cents per bushel, so the price is said to be 235 cents per bushel),
thus initiating a short position.
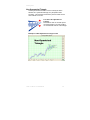
Having studied the behavior of Corn, using his Track ‘n’ Trade
software, our speculator was correct, and Corn prices fell from
235 to 220 over the next two weeks. Given the –15 cent drop in
Corn prices, our speculator has a $1,500.00 open position profit,
and decides to “cash in” his winning by buying 2 March Corn
futures at 220.
Profit or Loss = Sell Price – Buy Price x Contract Size x
Number of Contracts
= 235 – 220 = +15 cents
= $0.15 x 5,000 bushel contract size = $750.00 per contract
= $750.00 per contract x 2 contracts = $1,500.00 (before
commissions and fees.)
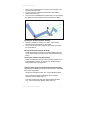
Now assume that another speculator buys (initiating a long
position) 2 March Corn at 235. After two weeks, prices again drop
by –.15 cents to 220, at which time he offsets the long position by
Track ‘n Trade Pro 4.0 User Manual
21
Introduction to Futures
selling 2 March Corn at 220. His loss from the transaction would
be -$1,500.00before commissions and fees.
Profit or Loss = Sell Price – Buy Price x Contract Size x
Number of Contracts
= 220 – 235 = +15 cents
= -$0.15 x 5,000 bushel contract size = $750.00 per contract
= -$750.00 per contract x 2 contracts =- $1,500.00 (before
commissions and fees.)
As you can see, whether you are long or short, the basic idea of
speculating in the futures market is to “BUY LOW” and “SELL
HIGH.” In the futures market this can be done in any order. You
can initiate a Long Position by buying the futures first and then at
a later time offsetting by selling, and you profit if the sale price
(exit price) is higher than the purchase price (entry price). Or, you
can initiate a Short Position by selling the futures first and then
offsetting the contract(s) at a later time by buying them. A profit
will still occur if the sale price (entry price) is higher than the
purchase price (exit price).
Of course the profit or loss amount is determined by the contract
you are trading. Each market is quoted differently. Some markets
are quoted in points, while others are quoted in cents.
Points vs. Cents:
Quoting Prices and Calculating Profit or Loss
Each futures contract is quoted in a slightly different manner, and
as such your profit or loss calculation for most markets is slightly
different. The following is a basic highlight of the major markets
and how they are quoted. Of course, Gecko Software’s Track ‘n
Trade® Pro charting software has tools to convert price moves to
profit or losses, but we thought we would show you a few
examples so you can understand how they are quoted.
Grains:
Corn, Wheat, Oats, and Soybeans are quoted in cents per bushel.
The contract size for all of these is 5,000 bushels. For example, a
Corn price of 235 is really $2.35 per bushel. Each of these grains
moves in 1/4-cent increments, which equates to $12.50 before
commissions and fees. Profit or loss of 1 cent move = $50.00
before commissions and fees.
Meats:
The contracts are quoted in cents per pound. So if Live Cattle is
trading at 74.00, the price is actually 0.74 cents per pound. Meat
Track ‘n Trade Pro 4.0 User Manual
22
Introduction to Futures
prices move in 0.025 cents per pound increments, but usually the
last 0.005-cent per pound is dropped, so a price quote of 74.02 is
really 74.025, while a price quote of 74.17 is actually 74.175. Live
Cattle, Lean Hogs and Pork Bellies contracts all call for delivery of
40,000 pounds, thus a 0.025-cent per pound is worth $10.00
before commissions and fees. Profit or loss of a 1 cent move =
$400.00 before commissions and fees. Feeder Cattle prices are
quoted the same way, except that Feeder Cattle futures call for
50,000 pounds, thus a 0.025 cent move is worth $12.50 and a 1
cent move in Feeder Cattle = $500.00 before commissions and
fees.
"Softs" or Exotics:
Coffee, Sugar and Orange Juice are all quoted in cents per
pound, but each has a different contract size. For example, a
Coffee price of 50.40 is 50.40 cents per pound, while an Orange
Juice price of 89.95 is 89.95 cents per pound, and a Sugar price
of 762 is really 7.62 cents per pound (decimal is moved over in
Sugar, as prices are quoted in cents per hundred weight). Now,
just to confuse everyone, Cocoa prices are quoted in dollars per
metric ton, so a price of 1301 is really $1301 per ton.
The contracts size for Coffee is 37,500 pounds, so a 1-cent move
is worth $375.00 before commissions and fees. Orange Juice
futures call for delivery of 15,000 pounds so a 1-cent move is
worth $150.00 before commissions and fees. Sugar is traded in
112,000-pound increments, so a 1-cent move in Sugar is equal to
$1,120.00 before commissions and fees. Cocoa contracts call for
10 tonnes at delivery so a $1 move in Cocoa is worth $10.00
before commissions and fees.
Metals:
Gold, and Platinum prices are quoted in dollars per troy ounce.
Most quote vendors display there prices in this format as well, so
prices are easy to read. A Gold price of 285.10 is $285.10 per
troy ounce, while a Platinum price of 475.5 is $475.50 per troy
ounce. However, each contract has a different contract size.
Each Gold futures contract represents 100 troy ounces, so a
$1.00 per troy ounce move equates to $100.00 before
commissions and fees. Platinum futures represent only 50 troy
ounces, as Platinum is much more rare than Gold. Each $1.00
per toy ounce move in Platinum is equal to $50.00 before
commissions and fees.
Silver and Copper Futures are quoted in cents; cents per troy
ounce in Silver, and cents per pound in Copper. For example, a
Silver price of 452.5 is actually $4.525 per ounce, while a Copper
price of 70.20 is really $0.7020 per pound. Each Silver contract
represents 5,000 ounces; therefore a 1.0-cent move equals
Track ‘n Trade Pro 4.0 User Manual
23
Introduction to Futures
$50.00 before commissions and fees. Copper contracts control
25,000 pounds of copper; therefore a 1.00-cent move equals
$250.00 before commissions and fees.
Petroleum:
Crude oil is quoted in dollars per barrel (bbl). A price of 20.50 is
$20.50 per barrel. Each contract represents 1,000 barrels of oil;
therefore a $1.00/barrel move is equal to a $1,000.00 profit or loss
before commissions and fees.
Heating Oil and Unleaded Gasoline are just like they are at the
pump (but lower as taxes are not included nor service station
mark-ups), in cents per gallon. Therefore a price of 52.46 is
$0.5246 per gallon. Both contracts call for delivery of 42,000
gallons, therefore a 1-cent per gallon equates to $420.00 before
commissions and fees.
Currencies:
Currencies represent an exchange rate, or how many US Dollars
it take to buy one Swiss Franc, Japanese Yen, Euro, or Mexican
Peso. Prices are quoted in many different fashions, but the basic
convention is that a 0.01 move in the Swiss Franc, or Yen equals
$12.50 before commissions and fees because of the contract size.
The Canadian Dollar, US Dollar Index, and Euro have a different
contract size, and therefore a 0.01 move equates to $10.00 before
commissions and fees.
Financials:
The same basic principles apply to the financial markets, which
are generally quoted in terms of points. Prices are usually read as
is, though some like the treasury securities (US, TY, FV, TU) are
traded in different combinations of 1/32nd or 1/64th. Each of
these markets has the dollars per point already calculated into
Gecko Software’s Track ‘n Trade application, and a list of the
different contract sizes and pricing terms are available from the
various exchanges they trade on, as they do not follow a single
convention.
Margins, Cents, Points & the
Power of Leverage
Before entering into either a long or short position, one must post
a performance bond, or have the Initial Margin Requirement
necessary. Because it is only necessary to post a fraction of the
underlying value of the worth of the underlying contract, futures
are a highly leveraged trading vehicle.
Track ‘n Trade Pro 4.0 User Manual
24
Introduction to Futures
Initial Margin Requirements vary from market to market, but
generally are only 3% to 18% of the value of the underlying
contract value.
For example, with March Corn trading at 211 per bushel
($2.11/bushel), the current initial margin requirement is $405 per
contract. Each Corn futures contract represents 5,000 bushels of
Corn, so the underlying value of a contract of Corn at 211 is
$10,550. In other words, for $405 you can control $10,550 worth
of Corn. Thus, by putting up just 3.9% of the value of the contract,
you can control 5,000 bushels of Corn (remember, margin
requirements are subject to change without notice).
In the above example, a 1-cent move in the price of Corn ($50.00
before commissions and fees) represents a 12.3% return on the
initial Margin Requirement. This is the power of leverage. A small
move in the price of the futures contract can mean a large move in
your account.
Another example, a 3.9% move in the price of Corn could yield a
100% return, double your money, or lose it all, if properly or
improperly positioned. The power of trading on margin is that a
small move in the price of the underlying equates to a large return
(either positive or negative) on the money posted.
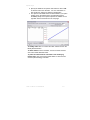
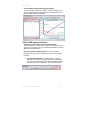
Just as leverage magnifies the amount of force used, as in the
case of pulleys allowing men to lift very heavy objects, financial
leverage magnifies the amount of money, which can be made or
lost in the markets. As they say in Chicago… “The futures
markets have made millionaires of more young men than Rock
and Roll.”
However, we want to point out that leverage is a two edged
sword. Over leveraging your trading is a sure fire way to lose your
money…and fast. Think about the leverage of a roulette wheel.
Each bet in roulette on a specific number pays off at 35 to 1. For
example, if you bet “6” and the ball bounces and lands on “6”,
every $1 you bet is paid back to you with $35 dollars. 25 to 1 is
great leverage.
Now, assume that you start off with $1 and bet “6” and win. You
now have $35 and bet it all on “6”, which comes up again. You
take your $1,225 winnings and let them ride on “6” again and win,
reaping $42,875. “You can win big, even if you don’t bet big” as
they say…let it ride again, making a phenomenal $1,500,625.
You let it ride one more time, and up pops “00”. You loose
everything.
Though roulette is strictly a game of chance, the above results are
possible with futures due to the leverage involved. For example,
Track ‘n Trade Pro 4.0 User Manual
25
Introduction to Futures
you buy 1 Corn futures contract at 210 and the price goes up to
219, giving you open position profit enough to post margin for a
second contract. Prices then rise another .04 cents, and you buy
a third contract. With Corn prices having risen .13 cents, you
were able to buy 3 contracts with an initial investment of only
$405.00 However, all it takes is a .05 cent decline in the price of
Corn and all your profits are gone. Of course another 5-cent rise
would yield a $1,450.00 profit or a 358% return on the initial
margin.
It is possible to make highly leveraged, and possibly highly
profitable transactions in the futures markets by trading with
relatively little financial cushion and pyramiding contracts.
However, it has been our experience that those that practice this
type of trading generally do not “break the bank” unless of course
you are referring to your own bank account, which is usually
drained quickly using this type of money management.
Most people are attracted to trading futures because of the
leverage involved, and it is the leverage involved which seems to
do in most traders. Though futures trading should only be done
with genuine risk capital, this does not mean you should take
undo risk.
As a general rule of thumb, traders should learn to diversify their
risk, only placing a small percentage of their capital at risk at any
one time.
Though this style of trade will reduce your “bang for your buck” in
the short run, it may prevent you from getting the “bust for your
buck” common to many futures traders. Remember, in order to
learn this game, you need to be able to stick around to learn all
the rules (both written and unwritten), and the only way to stick
around is through prudent money management.
Orders to Manage Your Future
The size of your account and the amount of risk you are
personally able to bear is a completely personal matter. Some
very successful traders, like Richard Dennis who is rumored to
have parlayed $1,000.00 into several million in the futures
markets, have made fortunes starting with relatively small sums of
money. Most professional fund managers risk as little as 1%
of their account equity on any given trade. Though both of
these are probably out of the question for most people starting out
in the futures market, as the odds of turning $1,000.00 into
several million in a couple of years is akin to hitting “6” on the
roulette wheel 5 times in a row. Also, risking 1% of a $1,000
means only risking $10.00 per trade, which just is not practical.
However, by maybe postponing your entrance into the futures
Track ‘n Trade Pro 4.0 User Manual
26
Introduction to Futures
market until you have, for example, a $5,000.00 minimum of
genuine risk capital (not the kids college fund, the rent, or your
next mortgage payment), you could achieve a level of diversity
and risk, theoretically then risking 10% of your account ($500.00
before commissions and fees) on any one trade is realistic. This
would greatly reduce your risk of ruin, increasing your ability to
trade longer and hopefully become more proficient in the long run.
Types of Orders
At the core of all risk management and trading is using the
appropriate order for your market objective. The following are
some basic definitions of the common order types, all of which
can be replicated in Gecko Software’s Track ‘n Trade Pro charting
software.
The Market Order
The market order is the most common type of order. With a
market order the customer states the number of contracts of a
particular delivery month of a specific commodity he/she wishes to
buy or sell. The price of the order is not specified, as the market
order is filled “at the market” or at the current price when the order
enters the trading pit. Market orders are placed when the
speculator or hedger wants in or out of the market fast, since time
is the most important factor in this type of order, not price. Market
on Close is a common variation of this type of order, and is used
when the trader wishes to have his/her order executed during the
closing of the market (closing range). The Market on Open is
another common variation, instructing the order to be filled during
the markets opening price range.
The Limit (“Or Better”) Order
The limit order specifies a price limit at which the order can be
filled. The limit order can only be filled at the specified price “or
better”. For example, a customer wishing to buy two July Corn
contracts at 210 when July Corn is trading at 211 would place the
following order: “Buy two July Corn at 210, limit.”
Buy limit orders must be placed at the current market price or
lower; this is because when buying you want the lowest price. The
lower the price the better, and limit orders can only be filled at the
specified price or lower. Hence one can only place a limit buy
order at the current price or lower.
A customer wishing to sell two July Corn contracts at 215 when
July Corn is trading at 211 would place the following order: “Sell
two July Corn at 215, limit.”
Sell limit orders must be placed at the current market price or
higher; this is because when selling you want the highest price
Track ‘n Trade Pro 4.0 User Manual
27
Introduction to Futures
possible. The higher the price the better, and sell limit orders can
only be filled at the specified price or higher.
An important note about limit orders is that when a buy limit is
placed above the market it can turn into a market order, and get
filled immediately. This is because if the current price is below the
limit price, the market is in a better situation and it becomes a
market order. The same principle applies to sell limits: when a sell
limit is placed below the market, it becomes a market order, as the
higher market price is better.
Remember: Gecko Software’s Track ‘n Trade program helps you
learn all these rules by allowing you to simulate placing these
orders, allowing you to practice, and make sure you have each
order under your belt, before ever moving on to trade the live
markets.
Stop Order
A stop order is not executed until the market reaches the specified
price level.
Once the stop level is hit, the stop order becomes a market order.
Buy stops are always placed above the market, while sell stops
are placed below the market.
For example, a customer wishing to buy July Soybeans at 485
when the current market price is 475 would place a stop order:
“Buy one July Soybean at 485, stop.” If the Soybean market
trades as high as 485 or is bid at 485, the order would become a
market order and would be filled as quickly as possible.
A customer wishing to sell July Soybeans at 465 when the market
is currently priced at 475 would place a stop order as follows: “Sell
one July Soybean at 465, stop.” If the Soybean market traded as
low as 465 or was offered at 465, the order would become a
market order and would be filled as quickly as possible.
Stop orders are usually used to liquidate earlier transactions, to
cut losses, or protect profits. For example, let’s assume that a
speculator bought three July Corn at 210 and the market is
currently trading at 225. He/she may wish to protect some of
his/her 15-cent profit per contract ($2,250.00 profit before
commissions and fees) by placing a sell stop at 220, to protect 10
cents ($1,500 of the profit before commissions and fees). Placing
the following order would do this: "Sell three July Corn at 220,
stop."
There are many other different types of orders, such as stop limits
and market if touched orders, but the above orders are the most
commonly used and are really the only orders a beginning trader
needs to learn.
Track ‘n Trade Pro 4.0 User Manual
28
Introduction to Futures
Look Before You Leap:
Getting Ready to Start Trading Futures
Before starting a business it is important to have a business plan
and have adequate capital. Most new businesses start off with a
dream, and the proprietors are willing to work hard. Despite the
hard work, they fail because of unforeseen difficulties, poor
preparation, or lack of capital. Remember this when starting your
trading business, and try to have adequate capital, and plan for
the unforeseen by developing and testing a trading plan.
Before trading, it is imperative that you
develop a trading plan.
Your trading plan should be capitalized with money you can afford
to lose. Generally trading funds are categorized as genuine risk
capital if it is money that you can afford to lose. Again, this is not
your child’s college education fund, the mortgage money, or
grocery money. Proper planning and adequate capitalization are
the cornerstones of any new venture.
The first step in building a house is drawing up plans for the
completed house. The workmen who erect the house consult the
blueprints when placing walls, placing sinks, appliances, and
electrical outlets. The transition from bare ground to a finished
home is laid out in the blueprints, or the plan for the completed
structure. Trades should be planed with as much detail. Every
situation should be planed for, so decisions are made not in the
heat of the moment when money is on the line.
The goal of your trading plan is to allow you to make decisions
before things happen, giving you a blueprint for trading before
entering the market. A basic trading plan should include the
following features as a minimum:
Trade entry
Initial risk or stop loss point
Criteria for stop loss movement
Criteria for profitable trade exit
Once you have developed your trading plan, put it to the test by
“Paper Trading.” Paper Trading is fictitious trading, or simulated
trading, best done using Gecko Software’s Track ‘n Trade Pro
market simulator program, in which you simulate buying and
selling futures contracts, therefore not risking real money. The
whole purpose of paper trading is to be as realistic as possible
when doing it. It does no good to practice trading with a million
dollars, if you are going to start with $10,000. Don’t practice your
trading in the S&P if you are intending to actually trade Corn.
Keep your practice as realistic as possible.
Track ‘n Trade Pro 4.0 User Manual
29
Introduction to Futures
The one major downfall to paper trading is that it does not involve
real money. It is very easy to live through a fictitious losing streak
but quite different to live through it when it is your money on the
line. Because paper trading does not involve real money, your
emotions are kept at bay, but tend to creep up when real money is
involved.
Gecko Software’s Track ‘n’ Trade Pro Charting Program comes
with over 25 years of historical data on over 50 different markets,
allowing you to learn the markets and develop a trading plan.
Four different Plug-in are available for Track ‘n Trade Pro to help
you maximize your trading strategies. The Plug-ins are listed
below:
Accounting Plug-in - Enables Track ‘n Trade Pro users to
simulate placing life like orders, applying deposits and making
withdrawals. Also, it keeps track of commissions paid to your
simulated (or live) broker, tracks orders placed, profits & losses
and even simulates margin calls.
Options Plug-in – The order tools included with this Plug-in
automatically snap to the different strike prices then it shows you
the actual dollar value of the option on that particular day. Track
‘n Trade Pro users who have this Plug-in keep track of options
profit and losses concurrent with your futures orders, allowing
them to practice mixing futures and options strategies
simultaneously.
Seasonal Plug-in – Comprised of three indicators for the
seasonal market, this plug-in assists the Track ‘n Trade Pro user
to calculate Seasonal Trends, Market Probability, and gives
Historical Averages. All this information is based on what has
happened in the past to a particular seasonal contract.
Spreads Plug-in - Place orders directly on the spread chart and
let Track 'n Trade automatically simulate placing both orders in the
opposing contracts, then calculates your daily profits and losses in
the Accounting and Simulation Plug-in module.
So, before ever attempting to trade in the futures market, develop
a strategic plan. Your trading plan should be realistic and well
tested over past history. Once it has been developed, take six
months and paper trade; “simulate” trading in “real time”, using
Track ‘n Trade Pro. If the plan still holds up, then remember the
mantra of futures traders: “Plan your Trade, and Trade Your
Plan.”
Good Luck,
Lan H. Turner, CEO
Gecko Software, Inc.
Track ‘n Trade Pro 4.0 User Manual
30
Introduction to Futures
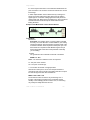
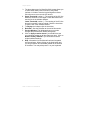
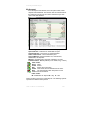
TRACK ‘N TRADE INTRO
This section includes a quick look at Track ‘n Trade Pro features
and there location in the software. For more information see the
following sections referenced.
Track ‘n Trade Pro 4.0 User Manual
31
Introduction to Futures
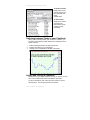
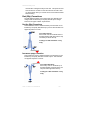
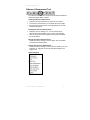
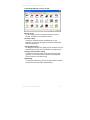
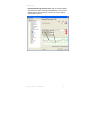
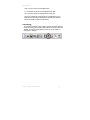
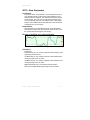
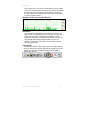
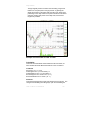
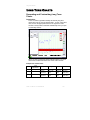
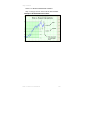
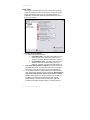
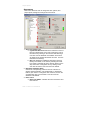
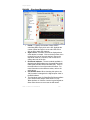
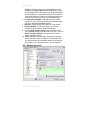
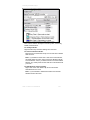
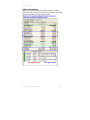
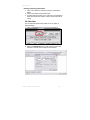
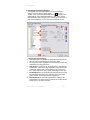
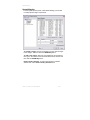
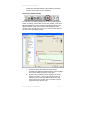
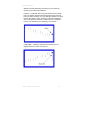
File Menu – This menu consists of File, View, and Help.
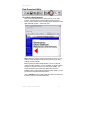
The File Menu consists of:
New: Opening New Chartbook
Open: Opening a Saved Chartbook
Save: Saving current Chartbook with existing name, if Chartbook
has been saved. If it hasn’t’ the Save As window will open for
you to name the Chartbook that you are working on.
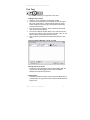
Save As: Opens the Save As window allowing you to choose a
location to save the Chartbook (default My Defaults) and name
the Chartbook.
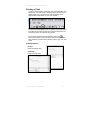
Print: Print the Chart Window. You will need to click in the Chart
Window if this option is not available.
Print Preview: Opens a window showing you what the chart will
look like when it is printed.
Print Setup: To change the printer options before printing.
Download Data: To open the data download utility.
Exit: Closes the Program.
See the following sections for more information:
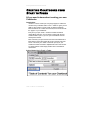
Creating Chartbooks From Start to Finish
Data Downloads
Track ‘n Trade Pro 4.0 User Manual
32
Introduction to Futures
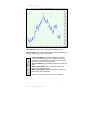
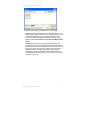
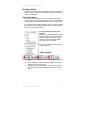
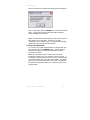
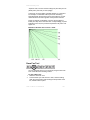
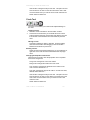
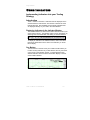
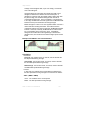
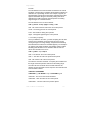
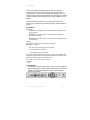
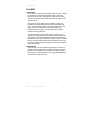
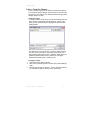
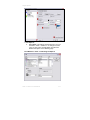
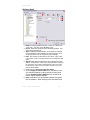
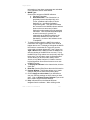
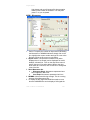
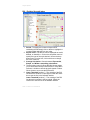
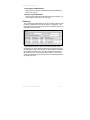
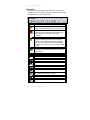
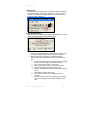
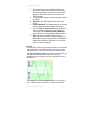
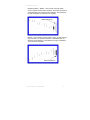
The View Menu controls the toolbars that are showing in the software.
Click on to toggle them on or off. If a check mark is in front of the
option it is selected and shown in the software.
Tool Button Lock: This option gives you the ability to lock a tool
selected until you select another tool. Normally when you click on a
tool, you draw one item and then the tool ends and you are defaulted
to the pointer tool.
Program Options: Select this item to open the Program Options
section.
Commodity Chooser: Select this item to open the Commodity
Chooser section.
See the following sections for more information:
Program Options
Data Downloads
Track ‘n Trade Pro 4.0 User Manual
33
Introduction to Futures
The Help Menu gives you information about your software needed for
technical support as well as links for accessing documentation for the
software.
About Track ‘n Trade: Select to get information about the version
installed, activation code, and plug-ins installed.
Online Help: Link to http://help.geckosoftware.com
Electronic manual: Opens the manual.
My Account Manager: Open an internet page that you can use to
update your customer information, payment information, and placing
additional orders.
How-To Videos (CD-ROM): Instructions on playing videos.
Check for Updates: This option is used to check for new updates for
the software or to update your version of the software to include any
new plug-ins you may have purchased.
Change Registration Info: If you mistyped your Activation Code or
needed to change your code for any reason, click on this option to
change the Activation code.
Keyboard Shortcuts: Select to get information on the quick
reference list of keyboard shortcuts for common commands.
Track ‘n Trade Pro 4.0 User Manual
34
Introduction to Futures
Main Toolbar – This menu consists of quick buttons for: Open, New,
Save, Capture, Print, Preview Print, Commodity Chooser, Program
Options, Data download, Pointer and Hand Tool.
These features are covered in the following sections:
Creating Chartbooks from Start to finish
Data Downloads
Charting Tools – This toolbar consists of the: Cross-hair, Line, MultiLine, 1-2-3, Head & Shoulders, Channel, N%, Inclining/Declining,
Wedge, and Trend Fan Tools
These tools are covered in the Analyzing Charts with Charting Tools
section.
Advanced Charting Tools – This Toolbar consists of the: Elliot
Wave, Dart/Blip, Gann Fan, Andrew’s Pitchfork, Fibonacci
Retracement, Fibonacci Arc, Fibonacci Time Zone, Day Offset, and
the Arc Tool.
These tools are covered in the Advanced Charting Tools section.
Notation Tools – This Toolbar consists of the Arrow, Flag, Text, Box,
and Circle Tool.
These tools are covered in the Personalizing Charts with Notation
Tools section.
Track ‘n Trade Pro 4.0 User Manual
35
Introduction to Futures
Accounting Tools – This toolbar consists of the Dollar Calculator
and the Risk/Reward Tool.
These calculators are covered in the using Calculators Section
Control Panel – The Control Panel consists of the Commodity, Key,
Data and Notes Tabs.
Commodity Tab: This section of the Control
Panel gives you the ability to open a chart,
add a chart to your Chartbook, and select
between the charts that are open.
See the Creating Chartbooks from Start to
Finish section for detailed information.
Key & Data Tabs: These sections display the
key details and data from the contract
displayed in the Chart Window.
See the Data Download section for detailed
information.
Notes Tab: This section gives you the ability
to save notes with charts.
See Personalizing Charts with Notation Tools
section for detailed information.
Track ‘n Trade Pro 4.0 User Manual
36
Introduction to Futures
Chart Window: Section of the software that displays the chart.
Play Controls: These controls consist of the center chart button, and
the daily, weekly, and monthly chart buttons.
Center Chart Button: This button scales the price bars
based on the highest/lowest values displayed in the chart
window. For more information on Scaling, see the Creating
Chartbooks from Start to Finish section.
Daily Chart Button: Automatically selected when opening a
chart.
Weekly Chart Button: Opens a long-term weekly chart
based on the daily chart shown.
Monthly Chart Button: Opens a long-term monthly chart
based on the daily chart shown.
See the Long-Term Chart section for more information.
Track ‘n Trade Pro 4.0 User Manual
37
Introduction to Futures
Indicator Window: Displays the Indicators
See the Indicators section for more information.
Indicator Buttons: Used to select the indicators shown in the
Indicator window
See the Indicators section for more information.
Scaling Controls – Gives the user quick access to changing the
price bar and ruler scaling.
See the Creating Chartbooks from Start to Finish for detailed
information.
Status Bar - The status bar gives you the cursor location. You have
two values displayed:
- Your mouse position when your mouse pointer is over the
Chart Window.
- The last day shown on the chart.
- The cursor bar is also available in a floating tool bar see the
View menu
Track ‘n Trade Pro 4.0 User Manual
38
Introduction to Futures
KEYBOARD SHORTCUTS QUICK
REFERENCE
CTRL and
Scroll Chart Up
CTRL and
Scroll Chart Down
CTRL and
Scroll Chart left
CTRL and
Scroll Chart Right
Page Up
Half Screen Scroll Up
Page Down
Half Screen Scroll Down
Ctrl and Page Up
Quarter Screen Scroll Up
CTRL and Page Down
Quarter Screen Scroll Down
Step Chart Back 1 Tic
Step Chart Forward 1 Tic
HOME
Step Chart to Beginning
END
Step Chart to End of Data
SHIFT
Highlight Day Under Cursor
DELETE
Delete Selected Tool
TAB
Move to next open Chart
SHIFT and TAB
Move to previous chart
CTRL
Lock tool to 45 or 90 Degrees
+
Increment Calculator
-
Decrement Calculator
F9
Toggle for text on Chart Pivot
Points Indicator
H
Toggle key for showing the
Control Panel
Track ‘n Trade Pro 4.0 User Manual
39
Creating Chartbooks from Start to Finish
Track ‘n Trade Pro 4.0 User Manual
40
Creating Chartbooks from Start to Finish
TRACK ‘N TRADE PRO
VERSION 4.0
Accumulating Wealth One Tic at a Time! ®
CREATING CHARTBOOKS FROM
START TO FINISH
Track ‘n Trade Pro 4.0 User Manual
41
Creating Chartbooks from Start to Finish
Track ‘n Trade Pro 4.0 User Manual
42
Creating Chartbooks from Start to Finish
CREATING CHARTBOOKS FROM
START TO FINISH
All you need to know about creating your own
Chartbooks
Introduction:
Just like a novel is made up of many single pages, a Chartbook
contains many individual charts. Track 'n Trade Pro gives you the
ability to save charts in one file; which is called a Chartbook.
Each Chartbook can contain several charts; these charts are like
the “pages” of your Chartbook.
Every time you open Track ‘n Trade Pro a blank Chartbook
named Book1 will open. You can either continue with the new
Chartbook that is open or you can open a Chartbook that has
already been created.
Each chart that you open and view from the Commodities tab is
listed below in the Active Charts list found on the left side of the
screen. This list is your "Table of Contents" per say for your
Chartbook. Charts are listed in Alphabetical order in this window.
To switch between charts simply double-click on the different
charts listed.
Active Charts List in Track ‘n Trade:
Track ‘n Trade Pro 4.0 User Manual
43
Creating Chartbooks from Start to Finish
Opening or Creating a New Chartbook
After opening Track ‘n Trade Pro, a new Chartbook has already
been started for you. It is called Book1. All this Chartbook needs
are “pages” or charts added to it. You can add pages to your
Chartbook by simply opening charts using the Commodity Tab.
See below.
Opening a chart in Track ‘n Trade:
1.
2.
Choose your commodity from the dropdown menu. Then choose
the month and year from the dropdown menu to the right.
Click on the Open Chart button to open your chosen chart.
Sorting the Commodity List:
Notice that you have sorting options above the “choose a
commodity” drop down menus. You can sort commodities by Group
or Exchange, plus you can display them in an ascending or
descending order.
Symbol Search:
If you know the symbol of the chart that you are opening, you can
type the symbol into the box after Symbol. A complete list of
Commodity Symbols and Commodity Month Symbols can be found
in the Data Download Section.
Adding/Removing Charts in your Chartbook
Now that you have charts in your Chartbook you might want to
delete some of the charts you have opened before you save it as
a Chartbook.
Track ‘n Trade Pro 4.0 User Manual
44
Creating Chartbooks from Start to Finish
To Remove a Chart:
Simply select on the
chart by clicking on it,
then right-click and
select
“Delete Chart”.
To Add a Chart:
Simply open another
chart using the
instructions found in
“Opening a New
Chartbook”.
Switching between Charts in your Chartbook
When you have several charts open in Track ‘n Trade Pro, you
are able to switch back and forth between the charts listed in the
Active Charts by:
1.
2.
3.
Double-clicking the chart in the Active Charts list.
Pressing the Tab key on your keyboard.
Clicking on the Chart Window Title Bar. (see below)
Saving and Closing a Chartbook
When you have your Active Chart list the way you want it, you can
save it as a Chartbook and have it available to open later.
To Save a Chartbook, click on the File menu and then choose
Save Book As. This will open the Save As window.
Track ‘n Trade Pro 4.0 User Manual
45
Creating Chartbooks from Start to Finish
In the Save As window, you will need to note two things:
First look at the folder specified next to the words Save In. The
default folder is My Documents; it is recommended that you use
the default folder unless you are familiar with the directory
structure of Windows and feel comfortable browsing to other
folders. This is the location in which your Chartbook will be
saved.
Second, notice the name of your file (Default is Book1.tnt)
located after File Name. It is recommended that the Chartbook
be renamed, so as not to accidentally over-write this file the next
time a file is saved. Some Track ‘n Trade users have named
Books according to Groups, Commodities, or Exchanges,
depending on the charts that they are saving in the Book. As
you become familiar with Track ‘n Trade, you will soon develop
a system of your own.
Track ‘n Trade Pro 4.0 User Manual
46
Creating Chartbooks from Start to Finish
Opening an Existing Chartbook
To open an existing Chartbook click on the Open Folder button
shown circled in the main Toolbar, or click on the File Menu and
select Open.
The following screen will appear:
In the Open window, select your file and click on the Open button.
In the screenshot above the Chartbook is named “Grains.tnt”.
Another way to access recently saved Chartbooks, is to go to the
bookmarked section at the end of the File Menu.
Track ‘n Trade Pro 4.0 User Manual
47
Creating Chartbooks from Start to Finish
Saving Charts as an Image
Many Track ‘n Trade Pro users include Chartbooks and images of
their charts in emails, websites etc. To save the current chart as it
is on your screen to an image follow these instructions:
Step One: Click on the Screen Capture button in the Main
Toolbar. See below:
Step Two: The Save Chart image window will appear. In this
window you may specify: file name, location and file type. Once
the image is saved you are ready to email or import this graphic
into your document. The standard web file types are .gif or .jpg.
Track ‘n Trade Pro 4.0 User Manual
48
Creating Chartbooks from Start to Finish
Printing a Chart
To print a chart in Track 'n Trade Pro, click on the File Menu and
select Print. This will open the Windows Printer Screen for your
default printer. You can also print a Chart by clicking on the
Printer button circled below on your main Toolbar:
The printed chart will always have the indicator window printed at
the bottom of the chart. The size of the chart will depend on the
size that it is when you press the Print button.
For an idea of what the chart will look like, click on the
Print Preview button to view the output before printing the chart.
Also printed on the chart are the last day’s Open, High, Low, and
Close.
Printing Options:
Portrait Prints a half-page chart.
Landscape Prints a full-page chart.
Track ‘n Trade Pro 4.0 User Manual
49
Creating Chartbooks from Start to Finish
Scaling a Chart
There are many scaling tools available for you use for scaling your
charts in Track ‘n Trade Pro. Take a look at each individual tool
and how to use them.
Auto Scale Charts:
The Auto Scale Chart feature in Track ‘n Trade Pro forces the
chart to scale the price bars displayed in the chart window based
on the highest and lowest point available in this set of price bars.
If you have the Accounting & Simulator Plug-in, which includes the
play controls, the Auto Scale Chart feature will re-scale the chart
each time you click a Play button.
Turning on the Auto Scale Chart
Feature:
Right-click on the Chart Window, to see
the menu shown at the left, and select
the Auto Scale Chart option. You will
notice that a check mark will appear
when this option is selected.
You may also select this feature in the
Program Options.
Sizing Controls:
A.
The first set of controls scales the vertical height of the price
bar.
B. The middle set of controls scales the number of price bars
displayed per inch on the chart.
C. The last set of controls scales the days along the bottom of
the chart and the points displayed on the right side of the
chart.
Track ‘n Trade Pro 4.0 User Manual
50
Data Downloads
TRACK ‘N TRADE PRO
VERSION 4.0
Accumulating Wealth One Tic at a Time! ®
DATA DOWNLOADS
Track ‘n Trade Pro 4.0 User Manual
51
Data Downloads
Track ‘n Trade Pro 4.0 User Manual
52
Data Downloads
DATA DOWNLOADS
Update your Track ‘n Trade Pro Database with
the simple click of a mouse!
Introduction
The Data Download Utility in Track ‘n Trade Pro is simple to use.
Easily control the commodities that you download with the
Commodity Chooser and keep current with the Data Utility.
Commodity Chooser:
The Commodity Chooser is a utility for managing the available
commodities.
To open the Commodity Chooser:
Click on the View Menu and selecting “Commodity Chooser” or
click on the Commodity Chooser button on the main Toolbar.
Selecting/Deselecting Commodities:
You may select/deselect futures and options data for each
commodity by clicking the appropriate check box. The options
data is only available if you own the Options Plug-in and the
Futures & Options Subscription service.
If you would like to select all futures/options or deselect all
futures/options data click on the + and – buttons at the end of
each column.
Note: Saved Chartbooks containing charts from commodities that
you have removed from the chart window, will not be affected by
the Commodity Chooser. This utility will not delete data from your
hard drive. You will still be able to access your previously saved
charts. The Commodity Chooser will only hide this commodity
from the Commodity Tab and from the Daily Downloads.
Track ‘n Trade Pro 4.0 User Manual
53
Data Downloads
Adding Commodities:
When you add commodities to your data set, the Data Download
Utility will retrieve any missing historical data for the commodity on
the next data download.
Limit Historical Data:
If you would like to limit the contracts listed in the Commodity Tab
drop down menu, select the “Limit History to ___ years” and then
select the number of years that you would like to see in the drop
down menu.
Note: This option does not change the amount of data stored on
your hard drive, it simply controls the data that is displayed in the
Commodity Tab. If you were to manually type the symbol (in the
symbol search) to a chart not seen in the menu, it would still be
displayed.
Commodity Chooser window in Track ‘n Trade
Track ‘n Trade Pro 4.0 User Manual
54
Data Downloads
Commodity Symbols
Track 'n Trade Pro will accept contracts typed in the following
format:
Track ‘n Trade Pro Commodity Symbols
Symbol
+AD
AD
+BP
BP
+CD
CD
+EC
+JY
JY
+MP
MP
+SF
SF
RZ
+DX
DX
+NG
+HU
+HO
+CL
+MB
+US
US
+TY
TY
Name
Australian Dollar (c)
Australian Dollar (o)
British Pound, CME (c)
British Pound, CME (o)
Canadian Dollar, CME (c)
Canadian Dollar, CME (o)
Euro FX (c)
Japanese Yen, CME (c)
Japanese Yen, CME (o)
Mexican Peso (c)
Mexican Peso (o)
Swiss Franc (c)
Swiss Franc (o)
Euro/Swiss Franc (e)
U.S. Dollar (c)
U.S. Dollar (o)
Gas, Natural (c)
Gasoline, Unleaded (c)
Oil, Heating (c)
Oil, Light Crude (c)
Municipal Note 10 yr (c)
U.S. T-Bond 30 yr (c)
U.S. T-Bond 30 yr (o)
U.S. T-Note 10 yr (c)
U.S. T-Note 10 yr (o)
Track ‘n Trade Pro 4.0 User Manual
Exchange
CME / IMM
CME / IMM
CME / IMM
CME / IMM
CME / IMM
CME / IMM
CME / IMM
CME / IMM
CME / IMM
CME / IMM
CME / IMM
CME / IMM
CME / IMM
NYBOT / FINEX
NYBOT / FINEX
NYBOT / FINEX
NYMEX
NYMEX
NYMEX
NYMEX
CBOT
CBOT
CBOT
CBOT
CBOT
Group
currencies
currencies
currencies
currencies
currencies
currencies
currencies
currencies
currencies
currencies
currencies
currencies
currencies
currencies
currencies
currencies
energies
energies
energies
energies
financials
financials
financials
financials
financials
55
Data Downloads
+TU
TU
+FV
FV
+ED
ED
+EM
EM
+C
C
+O
O
+RR
RR
+SM
SM
+BO
BO
+S
S
+W
W
KW
MW
+DJ
YM
+GI
+ND
NQ
NK
+RL
+SP
SP
ES
+MD
MD
CR
U.S. T-Note 2 yr (c)
U.S. T-Note 2 yr (o)
U.S. T-Note 5 yr (c)
U.S. T-Note 5 yr (o)
Eurodollar (c)
Eurodollar (o)
LIBOR, 1mo (c)
LIBOR, 1mo (o)
Corn (c)
Corn (o)
Oats (c)
Oats (o)
Rice, Rough (c)
Rice, Rough (o)
Soybean Meal (c)
Soybean Meal (o)
Soybean Oil (c)
Soybean Oil (o)
Soybeans (c)
Soybeans (o)
Wheat, CBOT (c)
Wheat, CBOT (o)
Wheat, KCBT (o)
Wheat, MGEX (o)
Dow J. IA (c)
Dow J. IASM $5, mini (e)
GSCI (c)
NASDAQ 100 (c)
NASDAQ 100, mini (e)
Nikkei 225 (o)
Russell 2000 (c)
S&P 500 (c)
S&P 500 (o)
S&P 500 Stock, mini (e)
S&P MidCap 400 (c)
S&P MidCap 400 (o)
CRB (o)
Track ‘n Trade Pro 4.0 User Manual
CBOT
CBOT
CBOT
CBOT
CME / IMM
CME / IMM
CME / IMM
CME / IMM
CBOT
CBOT
CBOT
CBOT
CBOT
CBOT
CBOT
CBOT
CBOT
CBOT
CBOT
CBOT
CBOT
CBOT
KCBT
MGEX
CBOT
CBOT
CME / IOM
CME / IOM
CME / IOM
CME / IOM
CME / IOM
CME / IOM
CME / IOM
CME / IOM
CME / IOM
CME / IOM
NYBOT / NYFE
financials
financials
financials
financials
financials
financials
financials
financials
grains
grains
grains
grains
grains
grains
grains
grains
grains
grains
grains
grains
grains
grains
grains
grains
indices
indices
indices
indices
indices
indices
indices
indices
indices
indices
indices
indices
indices
56
Data Downloads
YX
+FC
+LC
PB
+LH
DA
+HG
+GC
+PA
+PL
+SI
LB
+CC
KC
SB
CT
NYSE Composite,
regular old (o)
Cattle, Feeder (c)
Cattle, Live (c)
Hogs, Frozen Bellies(o)
Hogs, Lean (c)
Milk, fluid class III (o)
Copper, High Grade (c)
Gold (c)
Palladium (c)
Platinum (c)
Silver (c)
Lumber, random length (o)
Cocoa (c)
Coffee C (o)
Sugar #11 (o)
Cotton #2 (o)
NYBOT / NYFE
indices
CME
CME
CME
CME
CME
NYMEX / COMEX
NYMEX / COMEX
NYMEX / COMEX
NYMEX / COMEX
NYMEX / COMEX
CME
NYBOT / CSCE
NYBOT / CSCE
NYBOT / CSCE
NYBOT / NYCE
meats
meats
meats
meats
meats
metals
metals
metals
metals
metals
softs
softs
softs
softs
softs
Legend for the Commodity Symbols:
+ Refers to a Combined Contract
(c) Combined Data
(o) Open Outcry Session
(e) Electronic Session
Commodity Month Symbols:
Month
Jan
Feb
Mar
Apr
May
Jun
Symbol
F
G
H
J
K
M
Track ‘n Trade Pro 4.0 User Manual
Month
Jul
Aug
Sep
Oct
Nov
Dec
Symbol
N
Q
U
V
X
Z
57
Data Downloads
Data Download Utility
To perform a Data Download:
Click on the Data Download icon (shown below) on the main
Toolbar. This will open the Data Update Internet Download
screen. Notice that the Track ‘n Trade program will close and the
data download program – “FIDO” will open.
Note: When the program closes, all changes are saved on your
working charts and will be reopened to the last chart you were
working on when finished.
Before opening the Data Update Window, Track ‘n Trade will
check for product updates. If one is available you will be notified
and given a window to choose Yes or No on the update. It is
recommended that you install each update as it becomes
available. After you are finished with the program update, you will
be returned to the data download window.
Click on BEGIN to start the data download. Watch the status bar
to see the progress of the data download.
Track ‘n Trade Pro 4.0 User Manual
58
Data Downloads
When the download is complete the following window will appear:
Click on “OK” button and then DISMISS to exit the Data Download
Utility. You will notice that the bottom Status Bar will display
DATA CURRENT when finished.
Note: The Data Download Utility (FIDO) is able to detect the last
date available in your database. Therefore, if you add a
commodity or miss a couple of days, your data will be completely
updated upon the next data download session.
To Stop a Data Download:
If you need to end a data download before it is finished with all of
the contracts, click on the DISMISS button. This will signal the
Data Download Utility to end the download after the current
commodity is finished.
Note: Do not press the power or reset buttons if the Data
Downloader freezes and you are unable to close the window. If
this happens, press the buttons CTRL, ALT, DEL at the same time
to open the Tasks Screen (Only press them ONCE). Then Select
Spot.exe from the window and click on End Task. This will close
the Download Program and allow you to restart the program and
download utility.
Track ‘n Trade Pro 4.0 User Manual
59
Data Downloads
Data Tab
The Data Tab is the tab with the graphic that looks like a
spreadsheet. Click on the tab and it will expand to say “Data” as
you see in the screen shot below. This tab is a spreadsheet
representation of the data available in the specific contract that
you are currently viewing in the chart window. The Data Tab has
values for the date, open, high, low close, volume, open interest,
and each indicator for each day on the contract.
The left disk button is used to save any changes you have
made to the data in the Track 'n Trade Pro database so they are
available the next time you run the software. You can use this
feature to adjust the open, high, low, close, volume and open
interest values if you don't agree with them.
Note: If you let Gecko Software Technical Support know about
the data that seems incorrect, they can research your data
question and make a correction available on the next data
download or help you understand why the data is correct.
The disk button with the red arrow on it is for undoing any
data changes you have made but have not saved. You can
change a value in Track 'n Trade and see the results of that
change on your current chart without saving the changes. If you
mistyped a value, just click this reload button and the data will
reload from the disk. If you have already saved the incorrect
value, this action will not recall the original value. In that case,
just type the correct value in and push the save button.
The software chooses the most appropriate format for displaying
the data in the data tab and elsewhere in the software from one
of three categories:
Decimal
Most commodities are traded as decimal values and will be
displayed as a decimal everywhere.
Track ‘n Trade Pro 4.0 User Manual
60
Data Downloads
Fractional
Some commodities, notably the CBOT grains, are traded as
halves (1/2) quarters (1/4) and eights (1/8) and quoted as such
by the exchanges. Some of these commodities trade in quarters
but are quoted as though they trade in eights for historical
reasons. For example Corn, while traded in quarters, is quoted
as either 3106 or 310-3/4 with both numbers representing the
same quote. In these
cases the software will output the quote as 310-3/4 to avoid
confusion.
Short Fractional
A few commodities, notably the CBOT U.S. Treasury
commodities, are traded in much smaller fractions such as
thirtyseconds (1/32) and halves or quarters of thirtyseconds (1/4
of 1/32). This leads to quotes like 101317 which means 10131.75/32. One quarter of one thirtysecond is one hundred and
twenth eighth (0.25/32
== 1/128). To keep the data format short yet display the full
precision of the number the software quotes these numbers as
101-31.75 and drops the fraction (/32). Where space is more
Track ‘n Trade Pro 4.0 User Manual
61
Data Downloads
restricted such as the vertical price scroll bar the last digit may be
truncated to 101-31.7.
Key Tab
The Key Tab is the tab with the graphic that looks like a Key.
Click on the tab and it will expand to say “Key” as you see in the
screen shot below. The Key Tab displays the information from
the exchanges on the contract that you are currently viewing in
the Chart Window. See what each value represents below.
Symbol - Gecko Software's
symbol for the commodity. For
Track 'n Trade Pro v4.0 we
have re-done our symbology
to make our symbols match
the exchanges as much as
possible.
Name - Short name including
an indication of the session
type. Types include (o) for
open outcry and (c) for
combined. Group - The group
that Gecko Software has put
the commodity in.
Exchange - The exchange
where the commodity’s trades
are processed. Sometimes a
primary exchange will be listed
with a subsidiary exchange,
Eg NYMEX/COMEX.
Track ‘n Trade Pro 4.0 User Manual
62
Data Downloads
Contract Size - The number of units that one contract
represents.
Contract Units - The unit measurement.
Tick Size - A tick is defined by the exchanges as the smallest
increment the quote of a contract will fluctuate. This is also called
the minimum move or a point.
Minimum Move - The tick size is displayed as a decimal value
instead of a fraction.
Tick Units - The unit of measure for quotes. This is usually the
same as the unit the exchange uses. If Gecko Software uses a
different unit than the exchange, we will adjust the full point value
so that all accounting is still correct.
Full Point Value – This value represents how much a move in
the ones place is worth. For the few commodities that trade in
whole values this is the same as the minimum move. Generally it
represents several minimum moves.
Init. Margin - The initial margin is the amount the Exchange and
your Brokerage Firm requires you to have available in your
account at the end of the first day your order is filled in the
market.
Maint. Margin - The maintenance margin is the amount of
available funds required to be in your account at the end of each
trading day after the first day your order is filled. It is generally a
smaller amount than the initial margin.
FND: First Notice Day - Depending on the exchange this date
can indicate various rules have come into effect. Overall this is a
warning that the contract will expire soon. This value is different
per contract and applies to the contract that is currently open in
the charting window.
LTD: Last Trading Day - The last day that you can trade the
contract month that is currently open.
Market Open - The time that the market opens. This time is the
exchange's time zone as listed on the exchange's web site.
Market Close - The time that the market closes. Like market
open, it is in the exchange's time zone. Time is in 24 hours, so
13:15 is 1:30PM. (Subtract 12 hours from values greater than
12:00.)
Options Expiration - The date that options for the active
contract will expire worthless or be automatically exercised into
futures orders.
Track ‘n Trade Pro 4.0 User Manual
63
Data Downloads
Options Strike Interval – The value for the minimum spacing
between options, as listed by the exchange. Some contracts
have rules that make strikes further out of the money or on
contracts that aren't the next to expire have larger strike price
intervals. Track 'n Trade auto-generates strikes on all contract
months at the minimum strike price value.
Options Min. Move – The value of the minimum price fluctuation
for the options contract, this is similar in function to the futures
minimum move.
No. of strikes above/below: Track 'n Trade Pro v3.0 uses this
value to know how many strikes above the highest high and
below the lowest low to auto-generate. If the exchange sends
data out on strikes outside of these ranges, they are also
available in the software.
Below this table is a description of the units used, the
calculations for the minimum move, and the full point
movement.
Importing Data
Track ‘n Trade Pro gives you the ability to import a day’s worth of
data to any contract. To add data, open the contract you would
like to add the data to and then click on the Data Tab in the
Control Panel. Click on the “Add Data”
button and the Add Data Window will
open. This window gives you the ability
to add the values for the contract’s Open,
High, Low, Close, Volume, and Open
Interest for a specified date.
One day of data can be added to a
contract, and then a data download must
be completed before another day can be
entered. Any data entered through the
Add Data option, will be overwritten in
the database by the data downloaded.
Note: If the contract you have selected is expired, you will not be
able to add data to this contract.
Track ‘n Trade Pro 4.0 User Manual
64
Data Downloads
Exporting Data
Data subscribers, to Track ‘n Trade Pro, have the ability of
exporting data as an ASCII file. There are two ways of exporting
data: from the software and from the internet.
Export from the software – In the Commodity Tab right click on
the contract in the Active Charts list. A quick menu will open
giving you the option of Deleting the Chart or Exporting the Data.
Select the Export Data option and a Save Window will open.
Type a name in the File name section and then select a save
location with the Save in drop down menu. This option will save
your data for the selected contract in a “csv” or “comma separated
value file. This file can be opened by a spreadsheet type
application.
Exporting from the ASCII Data Download Website – If you are
interested in downloading multiple Commodities and contracts
along with customizing the data format, visit the ASCII Data
Download Website at: http://ascii.geckosoftware.com/
Firewalls
A firewall is a piece of software or hardware that protects your
computer from other people accessing your computer from the
Internet. A firewall only allows basic types of Internet and
Network communications, such as surfing the Internet. When you
log onto the Internet or your network, you are open to attacks from
other people. Although attacks are rare, they do pose a big
enough threat to warrant the protection or a firewall.
Track ‘n Trade Pro uses a special utility called the “Data
Downloader” or “FIDO” to download the current market data and
update the charts. The Data Downloader does not use
conventional means to download the data in order to speed up the
downloading process. Because of this, Track ‘n Trade Pro may
encounter problems downloading through the firewall. It may
appear that the downloader is idle for a long period of time and
then it will display an error stating it could not find the server. This
is because the firewall does not allow the server from sending the
new data to your computer.
Track ‘n Trade Pro has a new feature to allow for both standard
and non-standard methods for downloading data. The standard
method uses port 80 which is accepted by most firewalls as
regular traffic, but this method is slower. The non-standard
method uses port 60184 and will need to have an exception made
in order for this method to work with a firewall; this method is
much faster than Port 80 in downloading data.
Track ‘n Trade Pro 4.0 User Manual
65
Data Downloads
Configuring Track ‘n Trade Pro for Firewalls:
1.
2.
3.
4.
5.
Click on the Data Download button from Track ‘n Trade Pro
toolbar, which will start FIDO, Track ‘n Trade Pro’s Data
Download Utility.
There is a button located on the far right called “Options”.
Click this button.
This will open a new window where you can select which
method to download data.
If you are working behind a firewall, select “Port 80”, and
then click “OK”.
Once done, click “Begin” to start downloading data.
Track ‘n Trade Pro 4.0 User Manual
66
Charting Tools
TRACK ‘N TRADE PRO
VERSION 4.0
Accumulating Wealth One Tic at a Time! ®
ANALYZING CHARTS WITH
CHARTING TOOLS
Track ‘n Trade Pro 4.0 User Manual
67
Charting Tools
Track ‘n Trade Pro 4.0 User Manual
68
Charting Tools
ANALYZING CHARTS WITH
CHARTING TOOLS
Applying Technical Formations
Introduction
Track ‘n Trade Pro has a complete set of charting tools that
enable the futures trader to apply concepts from Technical
Analysis to their charting. Take a look at some of the Technical
Analysis formations and trends in this chapter and see how to
apply these concepts in trading with
Track ‘n Trade Pro charting tools.
For more information on these formations and tools see Gecko
Software Educational CDs available on trackntrade.com.
The first tool in the Charting Toolbar is the Crosshair Tool.
Although this tool is not used in helping you define and technically
analyze data, it is used when lining up your technical indicators
and recurring patterns.
Crosshair Tool
The Crosshair Tool is used to draw a line vertically and
horizontally on the chart. The vertical line is drawn through the
Indicator Window as well. To help place the Crosshair line on a
specific value you will notice the cursor price is displayed on the
vertical line of the crosshair.
Charting a Crosshair:
1. Select the Crosshair Tool from the Charting Toolbox.
2. Click on the Chart Window to place Crosshair.
Moving a Crosshair Drawing:
1. To select the Crosshair, click on the center point or lines of
the crosshair and drag to the new location, release mouse
button to place. Note: The tool is selected when a box
appears at the center point.
Deleting a Crosshair Drawing:
1. There are two ways to delete the Crosshair tool.
2. Select the Crosshair drawing by clicking on it and press the
Delete Key on your keyboard.
Track ‘n Trade Pro 4.0 User Manual
69
Charting Tools
3. Place mouse cursor over the Crosshair and right click. In the
popup menu, select Delete.
Deleting only the Horizontal/Vertical Line of the Crosshair:
1. Right-click on the center point of the Crosshair to view the
properties menu.
2. Select/Deselect Show Horizontal (Vertical) Line. A check
will appear in front of the item when it is shown.
Changing Properties of a Crosshair:
Right-click on the drawing to view the properties menu. Properties
that can be changed are:
Foreground: Changes the line color of the Crosshair.
Line Thickness: Changes the thickness of the Crosshair lines.
Choose values from 1-6.
Line Style: Changes the line style of the Crosshair lines.
Choose from solid, dashed, dotted and more.
Font: Changes the font that the cursor price is displayed in.
Show Text: If this option is selected, the text will stay on the
chart after the Crosshair has been drawn, If not selected the
value will only appear when drawing the Crosshair.
Vertical Line: Select/Deselect to view or hide the vertical
Crosshair line. Note: If both the vertical and horizontal lines are
deselected, the crosshair tool will be deleted.
Show Horizontal Line: Select/Deselect to view or hide the
horizontal Crosshair line. Note: If both the vertical and
horizontal lines are deselected, the crosshair tool will be deleted.
Setting: To define the date and value of the Crosshair, select
settings and type in the values. You can also choose to view or
not view the horizontal and vertical lines.
Send to Back: Changes the layer of the tool. This option is used
when more than one tool is in the same area of the chart. Click
on Send to Back when you need to access a tool under the 1-23 drawing.
Track ‘n Trade Pro 4.0 User Manual
70
Charting Tools
Example of the Crosshair in Track ‘n Trade
Track ‘n Trade Pro 4.0 User Manual
71
Charting Tools
Technical Analysis
The remaining nine charting tools are used to identify Technical
Analysis formations and trends. Take a look at the different
patterns available then read about how to use each of the charting
tools and apply the Technical concepts learned.
Support
Markets have a tendency to move in troughs and peaks, or more
appropriately “Support and Resistance”. These troughs are called
Support. The term is self-explanatory and indicates that support is
a level or area on the chart “under the market” where buying
interest is strong enough to overcome selling pressure. Therefore
a decrease in price is reversed and prices rise once again.
Typically a support level is identified by a previous set of lows.
Resistance
Essentially, resistance (or the “peaks”) is the opposite of support.
Resistance is defined as a horizontal ceiling where the pressure to
sell is greater than the pressure to buy. Therefore, an increase in
price is reversed and prices revert downward. Typically, support
can be located on a chart by a previous set of highs.
Track ‘n Trade Pro 4.0 User Manual
72
Charting Tools
Line Tool
To draw a support/resistance line (also referred to as a trend) use
either the Line or Multi-Line Tools.
Drawing a Line:
1. Select the Line Tool.
2. Left click on the chart where you want the Line to begin.
3. Hold down the mouse button and move to the position where
the Line ends.
4. Release the mouse button to place.
Resizing the Line:
1. Select the Line drawing by clicking on it. You will know the
Line is selected when boxes appear at the ends of the Line.
2. Click on a box and drag to the desired length. Release the
mouse button to place the end point of the Line.
Moving the Line:
1. Select the Line drawing by clicking on it.
2. Click on the Line (not on a box) and drag to new location and
release mouse button to place.
To Delete the Line:
Left click on the Line Tool to select, and then press the Delete
key on your keyboard. Or, right-click the line and select Delete
on the popup menu.
Track ‘n Trade Pro 4.0 User Manual
73
Charting Tools
Examples of the Line Tool in Track ‘n Trade
Multi-Line Tool
Some contracts will have a continuous line/trend of alternating
support and resistance. You may illustrate these multi-lines with
the Line or Multi-Line Tool.
Drawing a Multi-Line:
1. Select the Multi-Line Line Tool.
2. Left click on the chart where you want the Line to start.
3. Move the mouse to the next point on the Multi-Line and left
click to place.
4. Repeat step 3 until the last point. When placing the last
point on the Multi-Line, right click to place.
Resizing the Multi-Line:
1. Select the Multi-Line drawing by clicking on it. You will know
the Multi-Line is selected when boxes appear at the ends of
the Multi-Line.
2. Click on a box and drag to the desired length. Release the
mouse button to place the end point of the Multi-Line.
Moving the Multi-Line:
1. Select the Multi-Line drawing by clicking on it.
Track ‘n Trade Pro 4.0 User Manual
74
Charting Tools
2. Click on the Multi-Line (not on a box) and drag to new
location, release mouse button to place.
To Delete the Multi-Line:
Left click on the Multi-Line Tool to select, and then press the
Delete Key on your keyboard. Or, point mouse cursor over the
Multi-Line and right click. Select Delete on the popup menu.
Example of Multi-Line Tool in Track ‘n Trade Pro
Track ‘n Trade Pro 4.0 User Manual
75
Charting Tools
Channels
The Technical Formation called a Channel consists of a section of
price bars that are between parallel support and resistance lines.
There are three types of channels the first is the Narrow Sideways
Channel, then the Inclining Channel, and finally the Declining
Channel.
Narrow Sideways Channel
A Narrow Sideways Channel is a formation that features both
resistance and support with a sideways movement. Support forms
the low price bar, while resistance provides the price ceiling.
To trade a Narrow Sideways
Channel:
Place an order to buy on a break
up and out of the channel, or sell
on a break down out of channel.
Narrow Sideways
Channel Tool
To illustrate a Narrow Sideways Channel in a chart use the
Narrow Sideways Channel Tool.
Drawing a Narrow Sideways Channel:
Select the Narrow Sideways Channel Tool from the Charting
Toolbox.
2. Position the mouse pointer where you would like to place the top
left point of the channel and left click, continue to hold down the
mouse dragging it to the right bottom point of channel, release
mouse button to place.
Moving the Narrow Sideways Channel:
Select the channel drawing by clicking on it, drag to the new
location and release the mouse button to place.
1.
Deleting the Narrow Sideways Channel:
Select the drawing by clicking on it and press the Delete Key on
your keyboard. Or, point mouse cursor over the Channel and
right click. Select Delete on the popup menu.
1.
Resizing the Narrow Sideways Channel:
Select the drawing by clicking on it. Note: The drawing is
selected when boxes appear on the corners.
Track ‘n Trade Pro 4.0 User Manual
76
Charting Tools
2.
Click on one of the boxes on the corners to drag the select point
and release the mouse button.
Changing Properties of a Narrow Sideways Channel:
To view the properties menu right-click your mouse on the
channel drawing tool. Properties that can be changed are:
Foreground: Changes the top and bottom lines of the channel.
Background: Changes the inside colors of the channel.
Line Thickness: Changes the thickness of the channel lines.
Choose values from 1-6.
Line Style: Changes the line style of the channel lines. Choose
from solid, dashed, dotted and more.
Send to back: Changes the layer of the tool. This option is used
when more than one tool is in the same area of the chart. Click
on Send to back when you need to access a tool under the
Narrow Sideways Channel drawing.
Track ‘n Trade Pro 4.0 User Manual
77
Charting Tools
Inclining Channel
The Inclining Channel is a formation with parallel price barriers
along both the price ceiling and floor. Unlike the sideways
channel the inclining channel has an increase in both the price
ceiling and price floor. The breaking of the bottom trend line on
this formation shows a change in trend from bullish to bearish.
To trade an
Inclining Channel:
Place an order to sell on the
break down and out of the
channel.
Example of an Inclining Channel in Track ‘n Trade
Track ‘n Trade Pro 4.0 User Manual
78
Charting Tools
Declining Channel
The Declining Channel is the exact opposite of the Inclining
Channel Formation. The Declining Channel has a decrease in
both the price ceiling and price floor. The breaking of the top trend
line on this formation shows a change in trend from bearish to
bullish.
To trade a
Declining Channel:
Place an order to buy on the
break up and out of the
channel.
Example of the Declining Channel in Track ‘n Trade
Track ‘n Trade Pro 4.0 User Manual
79
Charting Tools
Inclining/Declining Channel Tool
You can identify an Inclining/Declining Channel by using the
Inclining/Declining Channel Tool.
Drawing an Inclining/Declining Channel:
Select the Inclining/Declining Channel Tool from the Charting
Toolbox.
2. Position the mouse pointer where you would like to place the top
left point of the channel and left click, continue to hold down the
mouse dragging it to the right bottom point of channel, release
mouse button to place.
1.
Moving the Inclining/Declining Channel:
Select the channel drawing by clicking on it, drag to the new
location and release the mouse button to place.
Deleting the Inclining/Declining Channel:
Select the drawing by clicking on it and press the Delete key on
your keyboard. Or, point mouse cursor over the Channel and
right click. Select Delete on the popup menu.
Resizing the Inclining/Declining Channel:
Select the drawing by clicking on it. Note: The drawing is
selected when boxes appear on the corners.
2. Click on one of the boxes on the corners to drag the select point
and release the mouse button.
1.
Changing Properties of an Inclining/Declining Channel:
To view the properties menu right-click your mouse on the
channel drawing tool. Properties that can be changed are:
Foreground: Changes the top and bottom lines of the channel.
Background: Changes the inside colors of the channel.
Line Thickness: Changes the thickness of the channel lines.
Choose values from 1-6.
Line Style: Changes the line style of the channel lines. Choose
from solid, dashed, dotted and more.
Send to Back: Changes the layer of the tool. This option is used
when more than one tool is in the same area of the chart. Click
on Send to Back when you need to access a tool under the
channel drawing.
Track ‘n Trade Pro 4.0 User Manual
80
Charting Tools
50% Retracements
Markets move in waves called retracements, these waves have
up and down trends. Notice in the above diagram, that the market
is in an overall “uptrend” (considered a Bull Market), but that
within the uptrend, there are small areas where the market falls
back, or “retraces”; each time establishing a new higher high.
The following chart displays an example with a down trend (when
a market is in an overall down trend it is considered a Bear
Market). In this chart you will see how the market made lower
highs and lower lows while still maintaining the overall down trend.
Notice how far back those retracements went, before they
continued on in their original direction... it is about 50% of the last
move.
Track ‘n Trade Pro 4.0 User Manual
81
Charting Tools
Markets have a tendency to retrace half or 50% of the last move
as well as in overall long-term trends.
N% Tool
You can measure a retracement with the N% Tool. The default on
this charting tool is 50%, but can be changed by simply dragging
the middle bar up or down. See Fibonacci Time Zone and Fan
Tools in the Advanced Charting Tools for more information on
retracements.
1.
2.
1.
2.
Drawing an N% Channel:
Select the N% Tool from the Charting Toolbox.
Position the mouse pointer where you would like to place the top
left point of the channel and left click, continue to hold down the
mouse dragging it to the right bottom point of channel, release
mouse button to place. Note: The default retracement
percentage on the N% tool is 50%.
Moving the % Line:
Select the channel drawing by clicking on it.
You will notice that the middle line has a box in the middle of the
line. This is the handle that you will use to change the position
of the percentage line within the tool drawing. As you change
the position of the percentage line, the percentage value to the
left will change as well.
Track ‘n Trade Pro 4.0 User Manual
82
Charting Tools
Moving the N% Tool:
Left click on the channel and drag the tool, release mouse
button to place drawing.
Deleting the N% Channel:
Select the drawing by clicking on it and press the Delete Key on
your keyboard. Or, right click on the channel tool and select the
delete option on the popup menu.
Resizing the N% Channel:
Select the drawing by clicking on it. Note: The drawing is
selected when boxes appear on the corners.
2. Click on one of the boxes on the corners to drag the select point
and release the mouse button.
1.
Changing Properties of an N% Channel:
To view the properties menu, right-click on the drawing. Properties
that can be changed are:
Foreground: Changes the color for top and bottom lines of the
channel.
Background: Changes the inside color of the channel.
Line Thickness: Changes the thickness of the channel lines.
Choose values from 1-6.
Line Style: Changes the line style of the channel lines. Choose
from solid, dashed, dotted and more.
Font: Changes font, size, style, and color of text.
Show Text: Select\Deselect to view or hide the text on the
channel.
Send to Back: Changes the layer of the tool. This option is used
when more than one tool is in the same area of the chart. Click
on Send to back when you need to access a tool under the N%
Channel Drawing.
Track ‘n Trade Pro 4.0 User Manual
83
Charting Tools
Example of the N% Tool in Track ‘n Trade
Track ‘n Trade Pro 4.0 User Manual
84
Charting Tools
1-2-3 Formations
The 1-2-3 Formation anticipates a change in trend. It is available
in both a Top and Bottom.
1-2-3 Top
The 1-2-3 Top Formation anticipates a change in trend, from up to
down, on a break below the number two point. This formation is
easily identified because the number one point is the annual price
high.
To trade a 1-2-3 Top:
Place a SELL order on a break down
past the #2 point. Then, place a stop
loss order just above the #1 point
(Considered to be an industry
standard) or just above the #3 point (A
more conservative stop loss
placement.)
Example of a 1-2-3 Top in Track ‘n Trade Pro
Track ‘n Trade Pro 4.0 User Manual
85
Charting Tools
1-2-3 Bottom
The 1-2-3 Bottom Formation anticipates a change in trend from
down to up on a break above the number two point. A 1-2-3
Bottom Formation is easily identified because the number one
point is the annual price low.
To Trade a 1-2-3
Bottom Formation:
Place a BUY order just above the
#2 point, and then place your stop
loss order just below the #1 point
(Considered an industry standard)
or just below the #3 point
(Considered a more conservative
position.)
Example of a 1-2-3 Bottom in Track ‘n Trade Pro
Track ‘n Trade Pro 4.0 User Manual
86
Charting Tools
1-2-3 Tool
Use the 1-2-3 Tool to chart both a 1-2-3 Top and Bottom
Formation.
Drawing a 1-2-3 Top/Bottom:
Select the 1-2-3 Tool from the Charting Toolbox.
Position the mouse pointer where you would like to place the #1
point and left click to place.
3. Move to the #2 point and left click to place.
4. Move to the #3 point and left click to place.
1.
2.
Moving a 1-2-3 Drawing:
Select the 1-2-3 drawing by clicking on it, drag to the new
location and release the mouse button to place. Note: The tool
is selected when a line appears connecting the 1, 2, and 3.
Deleting a 1-2-3 Drawing:
Select the 1-2-3 drawing by clicking on it and press the Delete
Key on your keyboard. Or, right-click the drawing and select
Delete from the popup menu.
Resizing the 1-2-3 Drawing:
Select the 1-2-3 drawing by clicking on it. The drawing is
selected when boxes appear on the corners.
2. Click on one of the boxes to drag the select point and release
the mouse button.
1.
Changing Properties of a 1-2-3 Drawing:
Right-click on the drawing to view the properties menu.
Properties that can be changed are:
Foreground: Changes the line and arc color of the 1-2-3.
Line Thickness: Changes the thickness of the 1-2-3 line. Choose
values from 1-6.
Line Style: Changes the line style of the 1-2-3 line, which shows
when the line is selected. Choose from solid, dashed, dotted
and more.
Arc Thickness: Changes the arcs formed at the 1, 2, and 3
points. Choose values from 1-6.
Font: Changes the Font, Size, Style, and Color of the 1, 2, and
3.
Track ‘n Trade Pro 4.0 User Manual
87
Charting Tools
Show Text: Select to view or hide the 1, 2, and 3.
Send to Back: Changes the layer of the tool. This option is used
when more than one tool is in the same area of the chart. Click
on Send to Back when you need to access a tool under the 1-23 drawing.
Head & Shoulders Formation
This Formation can appear anywhere in the chart and is made up
of the Head, Left Shoulder, and Right Shoulder. There are two
types: Top and Bottom.
Head & Shoulders - Top
This formation has three definite peaks: the Head, Left Shoulder
and Right Shoulder. The middle peak, the Head (H) is higher than
either shoulder (LS, RS). This formation anticipates a drop in
price below the Neckline (see below).
To trade a Head &
Shoulders – Top:
Place a sell order on the break of the
Neckline. Your stop loss order should
then be placed just above the Head.
The stop loss order can also be
placed above the Right Shoulder as a
more conservative point.
Example of Head & Shoulders Top in Track ‘n Trade
Track ‘n Trade Pro 4.0 User Manual
88
Charting Tools
Head & Shoulders - Bottom
This formation is simply an inverted version of the Head and
Shoulders Top Formation. Therefore, a Head and Shoulders
Bottom anticipates a rise in price above the Neckline.
To trade a Head &
Shoulders – Bottom:
Place a buy order on the break up
of the Neckline. Then place a stop
loss order just below the Head.
The stop loss order can also be
placed below the Right Shoulder as
a more conservative point.
Example of Head & Shoulders: Bottom in TNT
Track ‘n Trade Pro 4.0 User Manual
89
Charting Tools
Head & Shoulders Tool
To identify either a Head & Shoulders Top or Bottom formation,
use the Head & Shoulder Tool.
1.
2.
3.
4.
5.
6.
Charting a Head & Shoulders (H&S) Formation:
Select the H&S Tool from the Charting Toolbox.
Position the mouse pointer where you would like to place the
Left Shoulder (LS) point and left click to place.
Move to the valley point between the LS and the Head, left click
to place.
Move to the Head point and left click to place.
Move to the valley point between the Head and Right Shoulder
(RS), left click to place.
Move to the RS point and left click to place.
Moving H&S Drawing:
Select the H&S drawing by clicking on it, drag to the new
location and release the mouse button to place. Note: The tool
is selected when a line appears connecting the LS, H, and RS.
Deleting H&S Drawing:
Select the H&S drawing by clicking on it and press the Delete
Key on your keyboard. Or, right-click on the drawing and choose
the Delete option in the popup menu.
Resizing the H&S Drawing:
Select the H&S drawing by clicking on it. The drawing is
selected when boxes appear on the corners.
2. Click on one of the boxes to drag the select point and release
the mouse button.
1.
Track ‘n Trade Pro 4.0 User Manual
90
Charting Tools
Changing Properties of a H&S Drawing:
Right-click on the drawing to view the properties menu. Properties
that can be changed are:
Foreground: Changes the line and arc color of the H&S drawing.
Note: The line is only seen when the drawing is selected.
Line Thickness: Changes the thickness of the H&S line. Choose
values from 1-6.
Line Style: Changes the line style of the H&S line, which shows
when the line is selected. Choose from solid, dashed, dotted
and more.
Arc Thickness: Changes the arcs formed at the LS, H, and RS
points. Choose values from 1-6.
Font: Changes the Font, Size, Style, and Color of the H, LS, and
RS.
Show Text: Select to view or hide the H, LS, and RS.
Send to back: Changes the layer of the tool. This option is used
when more than one tool is in the same area of the chart. Click
on Send to back when you need to access.
Track ‘n Trade Pro 4.0 User Manual
91
Charting Tools
Triangle and Wedge Formations
The triangle formation comes in many varieties. There are
Rising/Inclining Wedges and Symmetrical/Non-Symmetrical
Triangles.
Inclining Wedge
The Inclining Wedge Formation occurs when the slope of price
bar highs and lows join at a point forming an inclining wedge
formation. The slope of both lines is up with the lower line being
steeper than the higher one.
To Trade the Inclining Wedge:
Place a BUY order on a break up and
out of the wedge or a SELL order on a
break down and out of the wedge.
Inclining Wedges with a prior
downtrend are anticipated to break
down and out rather than up and out.
Example of an Inclining Wedge in Track ‘n Trade
Track ‘n Trade Pro 4.0 User Manual
92
Charting Tools
Declining Wedge
A Declining Wedge Formation occurs when the slope of price bar
highs and lows join at a point forming a Declining wedge. The
slope of both lines is down, the top line being steeper than the
lower one. This formation is opposite the Inclining Wedge.
To Trade the Declining Wedge:
Place an order to buy on a break up and
out of the wedge or an order to sell on a
break down and out of the wedge. Falling
wedges, with a prior up trend, are
anticipated to break up and out, rather
than down and out.
Example of a Declining Wedge in Track ‘n Trade
Track ‘n Trade Pro 4.0 User Manual
93
Charting Tools
Symmetrical Triangle
A Symmetrical Triangle Formation occurs when there is a pause
in the current trend, after which the previous trend is resumed.
Also notice that the price bars for a perfectly symmetrical triangle
shape.
To Trade a Symmetrical Triangle:
Place a BUY order on a break up and
out of the triangle or a SELL order on
break down and out of the triangle.
Example of a Symmetrical Triangle in Track ‘n Trade
Track ‘n Trade Pro 4.0 User Manual
94
Charting Tools
Non-Symmetrical Triangle
A Non-Symmetrical Formation occurs in exactly the same
situation as a symmetrical triangle, only the pattern lacks
symmetry. This formation resumes the previous trend as well
when a break out occurs.
To Trade a Non-Symmetrical
Triangle:
Place a BUY order on a break up and
out of the triangle or an order to SELL
on a break down and out of the triangle.
Example of a Non-Symmetrical Triangle in TNT
Track ‘n Trade Pro 4.0 User Manual
95
Charting Tools
Wedge and Triangle Tool
To identify any type of Wedge or Triangle, use the Wedge Tool.
Drawing a Wedge/Triangle Formation:
Select the Wedge Tool from the Toolbox.
Left click your mouse at the top of the triangle.
Drag the mouse pointer to the bottom of the triangle and left
click to place.
4. Next drag the mouse pointer to form a triangle and left click the
mouse to place the final point.
1.
2.
3.
Resizing the Wedge/Triangle Formation:
Select the drawing by clicking on it. Note: The formation is
selected when boxes appear on the corners of the drawing.
2. Click on one of the boxes to drag the select point and release
the mouse button.
1.
Moving the Wedge/Triangle Formation:
Select the drawing by clicking on it, drag to the new location and
release the mouse button.
Deleting the Wedge/Triangle Formation:
Select the drawing by clicking on it and press the delete key on
your keyboard. Or, right-click on the formation and choose the
Delete Option in the popup menu.
Changing the Properties of the Triangle Formation:
Right-click on the drawing to view the properties menu.
Properties that can be changed are:
Foreground: Changes the line color of the Triangle drawing.
Background: Changes the inside color of the Triangle drawing.
Line Thickness: Changes the thickness of the Triangle line.
Choose values from 1-6.
Line Style: Changes the line style of the Triangle line. Choose
from solid, dashed, dotted and more.
Send to Back: Changes the layer of the tool. This option is used
when more than one tool is in the same area of the chart. Click
on Send to Back when you need to access a tool under the
Triangle drawing.
Track ‘n Trade Pro 4.0 User Manual
96
Charting Tools
Trend Fan
Trend fans are an extension of the regular trend line, and accent
simple trend line trading concepts by extending the single trend
line to a multiple of fan lines that give you a better look at a trend,
its retracements and market reversals.
Take a look at this diagram. As a trend moves up in scale, a
chartist will generally draw a vertical line across price bar lows; or
alternatively, when a market is moving down, across the price bar
highs.
Then, as the market continues to make its retracement, we can
then draw another trend line across the next level of support or
resistance. The line is support if the market is moving up and
resistance if it is moving down.
You will notice how the last move of the trend, which was
resistance for the first trend line, is now support for the second
trend line. Now draw the third trend line. At this point, you can see
that the market has made a solid retracement down past this third
fan line.
When the market crosses the third fan line, it is considered to be
confirmation of market retracement; a market that was once
considered bullish...is now bearish, or if bearish, would now be
considered bullish.
Track ‘n Trade Pro 4.0 User Manual
97
Charting Tools
Rule of Thumb:
When the markets price bars cross above or below the third trend
fan line, this is your signal and confirmation that the market has
shifted from bullish to bearish, or bearish to bullish.
To Trade a Trend Fan:
Place an order to enter the market on the break out past the third
trend fan line. See the example charts:
Example of a Trend Fan using Track ‘n Trade Pro
Track ‘n Trade Pro 4.0 User Manual
98
Charting Tools
Example 2 of a Trend Fan using Track ‘n Trade Pro
Example 3 of a Trend Fan using Track ‘n Trade Pro
Track ‘n Trade Pro 4.0 User Manual
99
Charting Tools
Trend Fan Tool
To identify a Trend Fan within a chart use the Trend Fan Tool.
To draw a Trend Fan:
Select the Trend Fan Tool.
Left click where you want the Fan to start.
Move the mouse pointer to where the first line is to end and left
click to place.
4. Repeat Step 3 until you get to the last line.
5. To place the last trend, move the mouse pointer to the ending
point and right click to place.
1.
2.
3.
Resizing the Trend Fan:
Select the Trend Fan by clicking on it. Note: The formation is
selected when boxes appear on the corners of the drawing.
2. Click on one of the boxes to drag the selected point and release
the mouse button to place.
1.
Moving the Trend Fan:
Select the Trend Fan by clicking on it. Then, drag to the new
location and release the mouse button.
Deleting the Trend Fan:
Select the drawing by clicking on it then, press the delete key on
your keyboard to remove the Trend Fan. Or, right-click on the
fan and choose the Delete option from the popup menu.
Track ‘n Trade Pro 4.0 User Manual
100
Charting Tools
TRACK ‘N TRADE PRO
VERSION 4.0
Accumulating Wealth One Tic at a Time! ®
ADVANCED CHARTING TOOLS
Track ‘n Trade Pro 4.0 User Manual
101
Advanced Charting Tools
Track ‘n Trade Pro 4.0 User Manual
102
Advanced Charting Tools
ADVANCED CHARTING TOOLS
Applying Technical Formations and Theories
Introduction
Track ‘n Trade Pro has incorporated concepts and theories from
leading Technical and Fundamental Educators in the Futures
Industry allowing you as a trader to apply their studies easily to
your trading. In this section you will both learn basics about their
theory and learn how to apply it in Track ‘n Trade Pro using the
Advanced Charting Tools provided you. For more detailed
information on the different theories and concepts see the
educational products also offered by Gecko Software, Inc.
(www.trackntrade.com)
Elliot Wave Theory
This theory was developed by Ralph Nelson Elliot and bares his
name. Elliott wave theory is an idea that market behavior is based
on waves rather than random timing. Elliott believed that market
prices rose and fell in a series of waves based on the same
Golden ratio or Golden mean that Fibonacci proved. This ratio is
present in many aspects of nature and science, and Elliott felt that
it had great significance on the financial markets as well.
Interpretation
The basic idea of this theory is that a market rises in a series of 5
“waves” (as he called them) and that a market declines in a series
of 3 declines. Elliott’s theory is that on the first wave a market
rises, on wave two it declines, begins again to rise on wave three,
has a period of decline again on wave four, and finally completes
the rise on wave five. Then thee period of correction is referred to
as a three-wave correction, where the market declines for wave A,
begins to rise for wave B, and falls again for wave C.
Elliot went on further to explain that a complete market cycle
consisted of a 144 wave cycle, broken down into an 89 wave bull
cycle, and a 55 wave bear cycle. This is based on his observation
of Fibonacci’s golden ratio. The series of numbers Fibonacci
describes, (1, 2, 3, 5, 8, 13, 21, 34, 55, 89, and 144) shows a
relationship of 1:.618. Elliot further showed that a market usually
rises or falls based on this wave cycle. Each wave in the cycle has
its own characteristics.
Five Wave Advance:
Wave one: Normally very short and easy to miss.
Track ‘n Trade Pro 4.0 User Manual
103
Advanced Charting Tools
Wave two: A retracement wave, usually gives back all or most
of what the first one gained.
Wave three: Usually very prominent, as it follows a period of
what appears as consolidation, most people trade this wave.
Wave four: Noted to be very intricate yet still a consolidation.
One of Elliot’s main rules is that in a 5-wave advance cycle,
wave 4 can’t overlap wave 1.
Wave five: Often very active, yet at some point declines and
leads to the 3 wave corrective cycle.
Three Wave Decline:
Wave A: Normally seen as a minor pullback, of wave 5 of the
advance cycle.
Wave B: Follows Wave A of the downtrend, and is often hard to
spot but should result in a third wave continuing down.
Wave C: Usually quiet significant and many traders see this
selling opportunity.
Trading an Elliot Wave:
See Wave three in the “Five Wave Advance” and the Wave C in
the “Three Wave Decline”.
Example of an Elliot Wave in Track ‘n Trade
Track ‘n Trade Pro 4.0 User Manual
104
Advanced Charting Tools
Elliot Wave Tool
To identify an Elliot Wave on a chart use the Elliot Wave tool
located in the Advanced Charting Tools Section.
1.
2.
3.
Charting an Elliot Wave:
Select the Elliot Wave Tool from the Toolbox.
Left click your mouse on the #1 point to place.
Continue throughout the wave by clicking on each point 1-5 and
A,B,C to place. When you get to the last point C the drawing is
complete.
Resizing the Elliot Wave Drawing:
Select the drawing by clicking on it. Note: The drawing is
selected when boxes appear on the corners.
2. Click on one of the boxes to drag the select point and release
the mouse button.
1.
Moving the Elliot Wave Drawing:
Select the drawing by clicking on it continue holding down the
mouse button, drag to the new location and release the mouse
button.
Deleting the Elliot Wave Drawing:
Select the drawing by clicking on it and press the delete key on
your keyboard to remove. Or, right-click the drawing and select
Options from the popup menu.
Changing the Properties of an Elliot Wave Drawing:
Right-click on the drawing to view the properties menu.
Properties that can be changed are:
Foreground: Changes the line color of the Elliot Wave.
Line Thickness: Changes the thickness of the Elliot Wave Line.
Choose values from 1-6.
Line Style: Changes the line style of the Elliot Wave Line.
Choose from solid, dashed, dotted and more.
Arc Thickness: Changes the arcs formed at the 1-5 and ABC
points. Choose values from 1-6.
Font: Changes the Font, Size, Style, and Color of the 1-5 and
ABC points.
Show Text: Select to view or hide the 1-5 and ABC points.
Track ‘n Trade Pro 4.0 User Manual
105
Advanced Charting Tools
Send to Back: Changes the layer of the tool. This option is used
when more than one tool is in the same area of the chart. Click
on Send to Back when you need to access a tool under the Elliot
Wave Drawing.
Dart (Blip) Formations
The Dart (Blip) Formation occurs when there is a dramatic price
change which is followed by an equally dramatic price change.
There are two types of Darts: Up and Down.
Dart Up (Blip) Formations
This formation is where a sudden dramatic price increase occurs
followed by an equally dramatic drop in price. A dart formation can
appear anywhere in a chart.
To Trade a Dart Up:
Place a sell order on the break down of
the Right Feather (RF) along with a stop
loss order just above the Tip.
Trading on a Dart Formation is very
risky.
Dart Down (Blip) Formation
This formation is where a sudden dramatic price decrease occurs
followed by an equally dramatic increase in price. This formation
can appear anywhere in a chart.
To Trade a Dart Down:
Place a buy order on the break up of
the Right Feather, and then place your
stop loss order right below the tip.
Trading on a Dart Formation is very
risky.
Track ‘n Trade Pro 4.0 User Manual
106
Advanced Charting Tools
Dart/Blip Tool
To chart a Dart (Blip) Up or Down formation use the Dart/Blip
Advanced Charting Tool.
To Draw a Dart Formation:
Select the Dart Tool from the Advanced Charting Tool Menu bar.
Left Click your mouse on the Left Feather (LF)
Continue to hold down the mouse button while moving to the tip
of the dart.
4. Release the mouse button then move the mouse to the Right
Feather and release the mouse button.
1.
2.
3.
To Lengthen or shorten the Formation:
Select the dart by clicking on it. (The formation is selected when
boxes appear on the corners of the drawing.)
2. Click on one of the boxes to drag the select point and release
the mouse button.
1.
To Move the Entire Dart:
Select the dart by clicking on it and drag to the new location and
release the mouse button.
To Delete the Dart:
Select the dart by clicking on it and press the delete key on your
keyboard. Or, right-click on the drawing and select Delete from
the popup menu.
Changing the Properties of a Dart/Blip Drawing:
Right-click on the drawing to view the properties menu.
Properties that can be changed are:
Foreground: Changes the line color of the Elliot Wave.
Line Thickness: Changes the thickness of the Elliot Wave Line.
Choose values from 1-6.
Line Style: Changes the line style of the Elliot Wave Line.
Choose from solid, dashed, dotted and more.
Send to Back: Changes the layer of the tool. This option is used
when more than one tool is in the same area of the chart. Click
on Send to Back when you need to access a tool under the Elliot
Wave Drawing.
Track ‘n Trade Pro 4.0 User Manual
107
Advanced Charting Tools
Example of a Dart Up and Down in Track ‘n Trade Pro
Gann Fan Theory
W. D. Gann designed several unique techniques for studying price
charts. One of these techniques included the use of geometric
angles in conjunction with time and price. Gann believed that
specific geometric patterns and angles had unique characteristics
that could be used to predict price action.
Gann’s techniques require that charts be drawn with equal time
and price intervals, so that a rise/run of one price unit for each
time unit (called a 1 x 1 trend or angle) will equal a 45 degree
angle anywhere on the chart. Gann believed that the ideal
balance between time and price exists when prices rise or fall at a
45 degree angle relative to the time axis.
Interpretation
The Gann Fan is made up of nine angles based on this concept.
These trend lines are used to indicator support and resistance
levels. When one line is broken (by the entire days price range)
prices should move to the next line. The drawing of these lines
should start from either a market top or bottom.
It is important to note that this theory is based on a squared 45
degree angle on the chart. Obviously, a 45 degree angle drawn on
a chart is no longer 45 degrees when the scale is changed without
a change to also the opposite scale. To “square” the Gann Fan to
the current chart’s scaled settings, hold down the CTRL key on
your keyboard while clicking on and rescaling with the mouse
pointer. Some Gann experts have reported that to get a truly
Track ‘n Trade Pro 4.0 User Manual
108
Advanced Charting Tools
“squared” chart, one must set the scaling to 8 price bars per inch
(width) and 4 price bars per inch (height).
A Gann Fan is used to define a market direction or a new trend.
For example, a bull market exists if prices are maintaining
strength between the1x2 lower line and 1x2 higher line. A bear
market would be the exact opposite of the previous scenario.
During an uptrend, the breaking of one line would suggest a
further price drop to the next lower line. Correspondingly, if prices
break above one line, they would be expected to rally to the next
higher one.
Example of the Gann Fan in Track ‘n Trade
Gann Fan Tool
You can apply this theory to your charts by using the Gann Fan
Tool on the Advanced Charting Toolbar.
1.
2.
To draw a Gann Fan:
Select the Gann Fan Tool.
Left click where you want the Fan to start, continue holding
down the mouse button until reaching the final position of the
fan, release button to place.
Track ‘n Trade Pro 4.0 User Manual
109
Advanced Charting Tools
Resizing the Gann Fan:
Select the Fan by clicking on it. Note: The formation is selected
when boxes appear on the corners of the drawing.
2. Click on one of the boxes to drag the selected point and release
the mouse button to place.
1.
Moving the Gann Fan:
Select the Fan by clicking on it. Then, drag to the new location
and release the mouse button.
Deleting the Gann Fan:
Select the drawing by clicking on it then, press the delete key on
your keyboard. Or, right-click on the fan and select Delete from
the popup menu.
Changing Properties of a Gann Fan:
Right-click on the drawing to view the properties menu. Properties
that can be changed are:
Foreground: Changes the line color for the fan.
Background: Changes the color of the background for the fan.
Line Thickness: Changes the thickness fan line. Choose values
from 1-6.
Font: Changes the Font, Size, Style, and Color of the fan values
Show Text: Select to view or hide the fan values.
Send to Back: Changes the layer of the tool. This option is used
when more than one tool is in the same area of the chart. Click
on Send to Back when you need to access a tool under the
Gann Fan.
Example of a Gann Fan in Track ‘n Trade
Track ‘n Trade Pro 4.0 User Manual
110
Advanced Charting Tools
Andrews Pitchfork Theory
Dr. Alan Andrews developed a channel technique to show areas
of support and resistance from a baseline. This use of a median
line is the key to using the Andrews Pitchfork. Buying near lows
and selling near highs that are identified by the “tines” of the
pitchfork. The basic premise is to trade the channel from one level
of support or resistance to the next.
Interpretation
The first element to draw the Andrews Pitchfork is the centerline.
The middle tine or median line begins at the most recent contract
low or high. To plot the direction of this point we must attain the
other two points. The top tine is determined by looking at the
highest move made from the origin of the contract low or high.
The next point is found by looking at the retracement of that move.
For example, a contract begins at point A rallies to point B, and
sells off from B to point C. A line is drawn from point B and C, and
then the line originating at point A splits those two lines equally.
This pitchfork shows continuing points of support and resistance.
The general use of this tool is to sell when the market rises to
line B, and take profits once prices reach line A the middle tine.
Also to buy when prices dip to line C and take profits when they
reach line A. This series of movements within the pitchfork affords
traders the opportunity to trade a channel system within a trending
market.
Andrews Pitchfork Tool
1.
2.
Charting Andrews Pitchfork:
Select the Andrews Pitchfork Tool from the Toolbox.
The first three clicks setup the pitchfork. The first point is the
handle of the pitchfork and is places at the end of the previous
trend.(A)
Track ‘n Trade Pro 4.0 User Manual
111
Advanced Charting Tools
3.
4.
5.
Next you are forming the base of the fork. The first point is the
top of the next trend. (B)
The second point completes the base and is placed at the
bottom of the trend. (C)
Once you have completed the first three steps you can elongate
the pitchfork to length desired. Left click to place final point.
Resizing the Andrews Pitchfork Drawing:
Select the drawing by clicking on it. Note: The drawing is
selected when boxes appear on the corners.
2. Click on one of the boxes to drag the select point and release
the mouse button.
1.
Moving the Andrews Pitchfork Drawing:
Select the drawing by clicking on it continue holding down the
mouse button, drag to the new location and release the mouse
button.
Deleting the Andrews Pitchfork Drawing:
Select the drawing by clicking on it and press the delete key on
your keyboard to remove. Or, right-click on the drawing and
select Delete from the popup menu.
Changing the Properties of the Andrews Pitchfork Drawing:
Right-click on the drawing to view the properties menu. Properties
that can be changed are:
Foreground: Changes the line color of the Andrews Pitchfork.
Line Thickness: Changes the thickness of the Andrews
Pitchfork. Choose values from 1-6.
Line Style: Changes the line style of the Andrews Pitchfork
Line. Choose from solid, dashed, dotted and more.
Track ‘n Trade Pro 4.0 User Manual
112
Advanced Charting Tools
Send to Back: Changes the layer of the tool. This option is used
when more than one tool is in the same area of the chart. Click
on Send to Back when you need to access a tool under the
Andrews Pitchfork.
Example of Andrews Pitchfork in Track ‘n Trade
Track ‘n Trade Pro 4.0 User Manual
113
Advanced Charting Tools
Fibonacci Retracements
Fibonacci Retracement levels correspond with percentage
retracements that occur in the ebb and flow of a market trend.
According to the Elliot Wave Theory, market trends tend to occur
in five distinct waves. See the Elliot Wave for more information.
Elliot asserted that these counter-trend waves will usually retrace
against the trending waves by 38.2, 50 and 61.8 percent. These
Retracement Percentages correspond to natural ratios discovered
by the Greeks called the Golden Ratio and rediscovered by
Fibonacci; a medieval, Italian Mathematician.
Interpretation
Commodity prices will frequently consist of an initial wave, a
second wave (often retracing 61.8% of the initial move), the third
wave (usually the largest), then another retracement, and finally the
5th wave (the last gap), which would exhaust the movement.
In Track 'n Trade Pro, you have three tools that you can use to
apply these concepts: the Fibonacci Retracement, Fibonacci Time
Zone and the Fibonacci Arc.
Track ‘n Trade Pro 4.0 User Manual
114
Advanced Charting Tools
Fibonacci Retracement Tool
The Fibonacci Retracement Tool is used to measure the different
retracement levels within a market.
1.
2.
3.
Drawing a Fibonacci Retracement:
Select the Fibonacci Retracement Tool from the Toolbox.
Left click on the chart where you would like the ruler to begin.
Move the mouse pointer to the lower right position of the ruler
and left click to place.
Resizing the Fibonacci Retracement:
Select the ruler by clicking on it. You can tell the ruler is
selected when boxes appear on the corners of the drawing.
2. Click on one of the boxes to drag the select point and release
the mouse button.
1.
Moving the Fibonacci Retracement:
Select the ruler by clicking on it, then drag to the new location
and release the mouse button.
Deleting the Fibonacci Retracement:
Select the ruler by clicking on it and press the delete key on your
keyboard. Or, right click on the ruler and select Delete in the
popup menu.
Right-click Menu
Track ‘n Trade Pro 4.0 User Manual
115
Advanced Charting Tools
Changing Properties for the Fibonacci Retracement:
Right-click on the ruler to view the properties menu. Properties
that can be changed are:
Foreground: Changes the line color of the ruler.
Background: Changes the background color of the ruler.
Line Thickness: Changes the thickness of the ruler lines.
Choose values from 1-6.
Font: Changes the Font, Size, Style, and Color of the values.
Show Text: Deselect/Select to view or hide the values.
Show Retracements: Select/Deselect to view the additional
retracement percentages.
Show Prediction: Select/Deselect to view the additional
prediction percentages.
Show Time Zones: Select\Deselect to overlay the Time Zones
on the ruler.
Send to Back: Changes the layer of the tool. This option is used
when more than one tool is in the same area of the chart. Click
on Send to Back when you need to access a tool under the
Fibonacci Retracement.
Delete: Select to delete the tool.
Example of a Fibonacci Retracement in Track ‘n Trade:
Track ‘n Trade Pro 4.0 User Manual
116
Advanced Charting Tools
Fibonacci Arc Tool
The Fibonacci Arc Tool is used to measure the different
retracement levels within a market.
Drawing a Fibonacci Arc:
Select the Fibonacci Arc Tool from the Toolbox.
Move the mouse pointer to the point on the chart that you would
like to start the stem of the arc tool, left click start.
3. Move the mouse pointer to the ending point for the arc tool and
left click to place. (While moving to the end point, the arc will
extend for you to get an idea of placement on the ticks.)
1.
2.
Resizing the Fibonacci Arc:
Select the arc by clicking on it. You can tell the arc is selected
when boxes appear on the corners of the drawing.
2. Click on one of the boxes to drag the select point and release
the mouse button to place.
1.
Moving the Fibonacci Arc:
Select the arc by clicking on it, then drag to the new location and
release the mouse button.
Deleting the Fibonacci Arc:
Select the arc by clicking on it and press the delete key on your
keyboard. Or, right-click the arc and select Delete on the popup
menu.
Track ‘n Trade Pro 4.0 User Manual
117
Advanced Charting Tools
Changing Properties for the Fibonacci Arc:
Right-click on the drawing to view the properties menu. Properties
that can be changed are:
Foreground: Changes the line color of the arc.
Line Thickness: Changes the thickness of the arc lines. Choose
values from 1-6.
Line Style: Changes the line style of the arc, which shows when
the line is selected. Choose from solid, dashed, dotted and
more.
Font: Changes the Font, Size, Style, and Color of the values.
Show Text: Deselect\Select to view or hide the values.
Show Retracements: Select/Deselect to view the additional
retracement percentages.
Show Prediction: Select/Deselect to view the additional
prediction percentages.
Send to Back: Changes the layer of the tool. This option is used
when more than one tool is in the same area of the chart. Click
on Send to Back when you need to access a tool under the
Fibonacci Arc.
Delete: Select to delete the tool.
Example of a Fibonacci Arc in Track ‘n Trade:
Track ‘n Trade Pro 4.0 User Manual
118
Advanced Charting Tools
Fibonacci Time Zones
The Fibonacci Time Zone uses Fibonacci numbers rather than the
percentages used in the Ruler and Arc tools.
Charting a Fibonacci Time Zone:
Select the Fibonacci Time Zone Tool from the Toolbox.
This tool is drawn like a rectangle. Left click for the upper left
point.
3. Move the mouse to the bottom right position and left click to
finish the drawing.
1.
2.
Resizing the Fibonacci Time Zone:
Select the drawing by clicking on it. Note: The drawing is
selected when boxes appear on the corners.
2. Click on one of the boxes to drag the select point and release
the mouse button.
1.
Moving the Fibonacci Time Zone:
Select the drawing by clicking on it continue holding down the
mouse button, drag to the new location and release the mouse
button.
Deleting the Fibonacci Time Zone:
Select the drawing by clicking on it and press the delete key on
your keyboard to remove. Or, right-click on the tool and select
Delete from the popup menu.
Track ‘n Trade Pro 4.0 User Manual
119
Advanced Charting Tools
Changing the Properties of a Fibonacci Time Zone:
Right-click on the drawing to view the properties menu. Properties
that can be changed are:
Foreground: Changes the line color of the Fibonacci Time Zone.
Line Thickness: Changes the thickness of the Fibonacci Time
Zone Line. Choose values from 1-6.
Line Style: Changes the line style of the Fibonacci Time Zone
Line. Choose from solid, dashed, dotted and more.
Font: Changes the Font, Size, Style, and Color of the Fibonacci
Time Zone numbers.
Show Text: Select to view or hide the numbers.
Send to Back: Changes the layer of the tool. This option is used
when more than one tool is in the same area of the chart. Click
on Send to Back when you need to access a tool under the
Fibonacci Time Zone drawing.
Delete: Select to delete tool.
Example of a Fibonacci Time Zone in Track ‘n Trade:
Track ‘n Trade Pro 4.0 User Manual
120
Advanced Charting Tools
Calculating Trading/Actual Days
In the futures industry trading days are scheduled around holiday
and weekends, therefore when looking at a futures chart often
times it is difficult to determine how many actual days have
passed while working a trade.
The number of trading days is also significant for traders using the
number of trading days as a rule in conjunction with a formation.
For example with the 1-2-3 Top or Bottom Formation, many
traders use the 10-20-50 rule. This rule defines a 1-2-3 if there
are 10 trading days between the #1 and #2 and 10 days between
the #2 and #3 points.
To calculate the Actual or Trading days on a chart use the Day
Offset Tool.
Days “Up” and “Down”
Another statistic used along side formations and other theories is
the day up and down calculation. This calculation determines how
many days, in a defined set of price bars, were “up” or “down”.
A day is considered an “Up Day” if the close is higher than any
previous close in the set of price bars selected. Conversely a day
is considered a “Down Day” if the close is lower than any previous
trading day in the defined set of price bars.
This statistic is available in Track n Trade Pro when using the Day
Offset Tool.
Track ‘n Trade Pro 4.0 User Manual
121
Advanced Charting Tools
Day Offset Tool
The Day Offset Tool enables you to measure the number of
trading days vs. actual days that expired between two points on
the chart. Also calculated on this tool is the number of days that
the market closed up or down in comparison with the previous
day.
1.
2.
3.
Charting a Day Offset:
Select the Day Offset Tool from the Toolbox.
This tool is drawn like a line. Left click for the left point.
Move the mouse to the right position and left click to finish.
Resizing the Day Offset:
Select by clicking on it. Note: The drawing is selected when
boxes appear on the corners.
2. Click on one of the boxes to drag the select point and release
the mouse button.
1.
Moving the Day Offset:
Select the drawing by clicking on it continue holding down the
mouse button, drag to the new location and release the mouse
button.
Deleting the Day Offset:
Select the drawing by clicking on it and press the delete key on
your keyboard to remove. Or, right-click on the tool and select
Delete from the popup menu.
Track ‘n Trade Pro 4.0 User Manual
122
Advanced Charting Tools
Changing the Properties of a Day Offset:
Right-click on the Day Offset drawing to view the properties menu.
Properties that can be changed are:
Foreground: Changes the line color of the Day Calculator.
Line Thickness: Changes the thickness of the Day Calculator
Line. Choose values from 1-6.
Line Style: Changes the line style of the Day Offset lines.
Choose from solid, dashed, dotted and more.
Font: Changes the Font, Size, Style, and Color of the Day
Calculator numbers.
Show Text: Select to view or hide the Day Calculator numbers.
Send to Back: Changes the layer of the tool. This option is used
when more than one tool is in the same area of the chart. Click
on Send to Back when you need to access a tool under the Day
Calculator drawing.
Delete: Select to delete tool.
Example of the Day Offset Tool in Track ‘n Trade
Track ‘n Trade Pro 4.0 User Manual
123
Advanced Charting Tools
Rounded Top & Bottom Formations
The Rounded Top & Bottom Formation is a very gradual change
in trend. This formation includes: Rounded Top & Bottom, Double
Top & Bottom, & Triple Top & Bottom.
Rounded Top
The Rounded Top Formation consists of a gradual change in
trend from up to down.
Rounded Bottom
The Rounded Bottom Formation consists of a gradual change in
trend from down to up. This formation is the exact opposite of a
Rounded Top Formation.
Double Top
This formation includes two distinct “tops” and anticipates a
change in trend from up to down.
Track ‘n Trade Pro 4.0 User Manual
124
Advanced Charting Tools
Double Bottom
This formation includes two distinct “bottoms” and anticipates a
change in trend from down to up. This formation is the exact
opposite of a Double Top.
Triple Top
This formation includes three distinct “Tops” and anticipates a
change in trend from up to down.
Triple Bottom
This formation includes three distinct “Bottoms” and anticipates a
change in trend from down to up. This formation is the exact
opposite of a Triple Top.
Track ‘n Trade Pro 4.0 User Manual
125
Advanced Charting Tools
Arc Tool
To illustrate a Rounded Top/Bottom Formation on your futures
chart, use the Arc Tool in the Advanced Charting Toolbar.
1.
2.
Drawing a Rounded Top Formation:
Select the Arc Tool from the Toolbox.
Left click your mouse on the left side of the arc and drag the
mouse to the right side, release mouse to place tool.
Resizing the Arc Drawing:
Select the arc by clicking on it. Note: The tool is selected when
boxes appear on the corners of the drawing.
2. Click on one of the boxes to drag the select point and release
the mouse button.
Moving the Arc Drawing:
Select the arc by clicking on it and drag to the new location and
release the mouse button.
1.
Deleting the Arc Drawing:
Select the arc by clicking on it and press the Delete key on your
keyboard. Or, right-click on the drawing and select the Delete
option on the popup menu.
Track ‘n Trade Pro 4.0 User Manual
126
Advanced Charting Tools
Changing the Properties of an Arc Drawing:
Right-click on the tool to view the properties menu. Properties that
can be changed are:
Foreground: Changes the line color of the arc.
Line Thickness: Changes the thickness of the arc line. Choose
values from 1-6.
Line Style: Changes the line style of the arc line. Choose from
solid, dashed, dotted and more.
Send to Back: Changes the layer of the tool. This option is used
when more than one tool is in the same area of the chart. Click
on Send to Back when you need to access a tool under the Arc
Tool Drawing.
Delete: Select to delete the tool.
Example of the Arc Tool in Track ‘n Trade:
Track ‘n Trade Pro 4.0 User Manual
127
Advanced Charting Tools
Track ‘n Trade Pro 4.0 User Manual
128
Advanced Charting Tools
TRACK ‘N TRADE PRO
VERSION 4.0
Accumulating Wealth One Tic at a Time! ®
PERSONALIZING YOUR CHARTS
WITH
NOTATION TOOLS
Track ‘n Trade Pro 4.0 User Manual
129
Personalizing Your Charts with Notation Tools
Track ‘n Trade Pro 4.0 User Manual
130
Personalizing Your Charts with Notation Tools
PERSONALIZING YOUR CHARTS
WITH
NOTATION
TOOLS
Express Yourself with Text, Graphics, and
More.
Introduction
In Track ‘n Trade Pro, you have a variety of tools available to you
to help personalize, notate and analyze your futures charts. Type
text, make drawings, import flags, plus keep notes on each chart.
The Notation tools as well as the Notes Tab in the Control panel
enable you record and remember what you learn from others tips
and tricks. In this section you will learn how to use these features.
Example of Personalizing a chart in Track ‘n Trade:
Track ‘n Trade Pro 4.0 User Manual
131
Personalizing Your Charts with Notation Tools
Notes Window
The Notes Window is located in the Control Tab after the Data
Tab. The Notes Tab is for you to keep notes on the charts that
are saved within your Chartbook. Each Chart has a new Notes
section available to keep notes for that particular chart.
Notes Tab in Track ‘n Trade
Arrow Tool
The Arrow Tool is located in the Notation Toolbar. This tool
enables you to draw arrows to help point out areas of interest on
your chart.
To draw an Arrow:
Select the Arrow Tool Button
Position mouse pointer where you want to place the point of the
arrow and click the left mouse button.
3. Continue holding down the mouse button and drag the mouse
pointer to the location you would like to end the arrow and
release.
Moving an Arrow:
Left click and continue holding down the mouse button, drag to
the new location and release to place.
1.
2.
Deleting an Arrow:
Left click on the arrow to select and press the delete key on your
keyboard. Or right-click on the arrow and select Delete from the
popup menu.
Track ‘n Trade Pro 4.0 User Manual
132
Personalizing Your Charts with Notation Tools
1.
2.
Changing the Length of an Arrow:
Left click to select the arrow.
Next, click on a box (markers located each end of the arrow)
continue to hole the mouse button and drag to lengthen/shorten
arrow, and then release to place.
Changing the Properties of the Drawn Arrow:
Right-click on the arrow to open the properties menu:.
Foreground: Changes the color of the entire arrow.
Line Thickness: Changes the thickness of the stem on the
arrow. Choose values from 1-6.
Line Style: Changes the style of the arrow stem. Choose from
solid, dashed, dotted and more.
Send to Back: Changes the layer of the tool. This option is used
when more than one tool is in the same area of the chart. Click
on Send to Back when you need to access a tool under the
arrow.
Delete: Select to delete tool.
Flag Tool
The Flag Tool enables you to place a flag or a graphic on your
chart. There are a basic set of flags available to choose from or
you can also import custom flags.
1.
2.
3.
1.
2.
3.
4.
Placing a Flag:
Select the Flag Tool Button in the Annotation Toolbox.
Left click on the Chart Window where you would like to insert the
Flag.
The default flag seen below the screenshot will be placed in this
location.
Changing the Flag Type and Settings:
Right click on the flag to display properties menu.
Select Settings from the menu to open the Flag Options window.
In Flag Settings you can select a different flag, change or import
a custom flag. Importable formats: wmf, jpeg, and gif.
After making selections, click on OK to make changes or Cancel
to exit this window.
Track ‘n Trade Pro 4.0 User Manual
133
Personalizing Your Charts with Notation Tools
Flag Settings Window in Track ‘n Trade
Moving a Flag:
To move a flag, left-click on the flag and drag to the new
location. Release the mouse button to place.
To Delete a Flag:
Left click on the flag and press the Delete Key on your
keyboard. Or right-click the flag and choose the Delete option
from the popup menu.
Changing Size of Flag:
To change the size of a Flag, simply click on the flag so that it is
selected and then drag one of the handles to change the size.
Changing Chart Position of Flag:
If another tool has been drawn in the same area as the flag,
right click on it and select Send to Back from the properties
menu to access a tool under the flag.
Default Flag:
To change the default Flag, open the Program Options window
and view the Tools Tab under Global Settings.
Track ‘n Trade Pro 4.0 User Manual
134
Personalizing Your Charts with Notation Tools
Text Tool
The Text Tool enables you to type text on the chart.
Adding Text to a Chart:
Select the Text Tool Button in the Notation Toolbar.
Left click on the chart where you would like to place the upper
left corner of the text box, continue holding down the mouse
button and drag to the lower right corner position release the
mouse to place the box.
3. Once the text box is drawn the Text Tool Options window will
open. (see screenshot below)
4. The Text Tool Options window allows you to enter the text, set
the font, size, position, color, and style of the text. Also, you can
select a border and background for the text box.
5. Click on OK when finished and the text will be placed on your
chart.
1.
2.
Text Tool Options Window in Track ‘n Trade
Moving Text on the Chart:
Left Click to select the text box and continue holding down the
mouse button while dragging the text to the new location.
Release mouse button to place text.
Deleting Text:
Left click to select the text box and then press the Delete key on
your keyboard. Or, right-click the text and select Delete from the
popup menu.
Track ‘n Trade Pro 4.0 User Manual
135
Personalizing Your Charts with Notation Tools
1.
2.
3.
Changing Properties of the Text:
Right-click to view the properties menu.
Select Settings to view the text tool options.
Make changes to color, font, size, and style then click on OK to
close window.
Changing Text Placement on Chart:
Right click to view the properties menu. Select “send to back” to
changes the layer of the tool. This option is used when more
than one tool is in the same area of the chart and you need to
access the tool under the text.
Box Tool
The Box Tool enables you to draw square or rectangle shaped
drawings on the chart.
1.
2.
Drawing a Box:
Select Box Tool Button in the Annotation Toolbox.
Left click where you would like to place the upper left hand
corner of the box, hold down the mouse button and drag to the
location of the lower right hand corner of the box.
To Move the Box:
Left Click on the box, continue holding down the mouse button
while dragging to the new location. Release mouse button to
place.
To Delete the Box:
Select the box and press the Delete Key on your keyboard. Or,
right-click the box and select Delete from the popup menu.
Changing Properties of the Drawn Box:
Right-click on the box to open the properties menu. Properties
that can be changed are:
Foreground: Changes the line color of the box.
Background: Changes the inside color of the box.
Line Thickness: Changes the thickness of the box outline.
Choose values from 1-6.
Line Style: Changes the line style of the box outline. Choose
from solid, dashed, dotted and more.
Track ‘n Trade Pro 4.0 User Manual
136
Personalizing Your Charts with Notation Tools
Send to Back: Changes the layer of the tool. This option is used
when more than one tool is in the same area of the chart. Click
on Send to Back when you need to access a tool under the box.
Delete: Select to delete tool.
Circle Tool
The Circle Tool enables you to draw circle shaped drawings on
the chart.
1.
2.
Drawing a Circle:
Select the Circle Tool Button in the Annotation Toolbox.
Left click on the chart where you would like the circle to start.
Continue holding down the mouse button and drag the tool until
it has formed a circle. Release the mouse button to place the
circle.
Moving a Circle:
Left Click on drawing so that it is selected. Continue holding
down the mouse button while dragging to the new location.
Release mouse button to place circle.
Deleting a Circle:
Select the circle and press the Delete Key on your keyboard. Or,
right-click on the circle and then select Delete from the popup
menu.
Changing the Properties of the Circle:
Right-click on the circle to view the properties menu. Properties
that can be changed are:
Foreground: Changes the color of the outline.
Background: Changes the inside color of the circle.
Line Thickness: Changes the thickness of the outline on the
circle. Choose values from 1-6.
Line Style: Changes the style of the outline. Choose from solid,
dashed, dotted and more.
Send to Back: Changes the layer of the tool. This option is used
when more than one tool is in the drawn in the same area of the
chart. Click on Send to Back when you need to access a tool
under the circle.
Delete: Select to delete tool.
Track ‘n Trade Pro 4.0 User Manual
137
Personalizing Your Charts with Notation Tools
Track ‘n Trade Pro 4.0 User Manual
138
Using Indicators
TRACK ‘N TRADE PRO
VERSION 4.0
Accumulating Wealth One Tic at a Time! ®
USING INDICATORS
Track ‘n Trade Pro 4.0 User Manual
139
Using Indicators
Track ‘n Trade Pro 4.0 User Manual
140
Using Indicators
USING INDICATORS
Implementing Indicators into your Trading
Strategy
Introduction
Track ‘n Trade Pro includes 11 indicators that are displayed in the
window below the chart window. This window is referred to as the
Indicator Window. Also available are five Overlay Indicators that
are displayed directly on your chart in the Chart Window.
Displaying Indicators in the Indicator Window
The Indicator Buttons are found on the bottom left hand side of your
screen (shown below). The indicator toolbar can be closed/open by
selecting View on the Menu Bar and clicking on Indicator Buttons.
To display an indicator in the indicator window, click on the button
that has the abbreviation for the name of the indicator you would
like to display.
One Button:
The One button on the left end of your indicator toolbar allows you
to have as many indicators as you like selected, but only view them
one at a time in the indicator window. To switch between each
selected indicator click the Indicator Information Display to the left
of the Indicator Window.
Track ‘n Trade Pro 4.0 User Manual
141
Using Indicators
When you click on the Indicator Information Display window the
indicator information will rotate to the next indicator you have
selected (as simulated above).
All Button
The All Button will display all the indicators you have selected on
the Indicator Toolbar in the Indicator Window. You will still be able
to rotate the information for each indicator to the right of the
Indicator window.
Indicators displayed in the Indicator Window are:
%R – Williams Percent R
AD –Williams AD
CCI –Commodity Channel Index
DMI – Directional Movement Index
HVOL – Historic Volatility
MACD – Moving Average Convergence/Divergence
MOM – Momentum
RSI – Relative Strength Index
FSTO – Stochastics (fast)
SSTO – Stochastics (slow)
VOL/OI –Volume/Open Interest
Track ‘n Trade Pro 4.0 User Manual
142
Using Indicators
Buy/Sell Signals
Introduction
Many of the indicators included in Track ‘n Trade Pro have buy/sell
signals. Users will be able to select the indicator to view these signals
on the chart (see above chart example). The indicators that have
buy/sell signals are:
•
•
•
•
•
•
•
•
•
AD - Williams Accumulation/Distribution
CCI - Commodity Channel Index.
DMI - Directional Movement Index
MACD - Moving Average Convergence Divergence
MOM - Momentum
%R - Williams Percent R
RSI - Relative Strength Index
FSTO - Fast Stochastics
SSTO - Slow Stochastics
Displaying the Buy/Sell Signals
To display the Buy/Sell Signals, click on the Program Options
and select the Indicator from either My Default Settings or Current
Chart Settings. Next, select the drop-down menu for Show Buy/Sell
Arrows and select either Show Always or Only When Indicator is
Visible to view the buy/sell signals.
Track ‘n Trade Pro 4.0 User Manual
143
Using Indicators
Removing Buy/Sell signals from chart: click on the Program
Options and select the Indicator from either My Default Settings or
Current Chart Settings. Next, select the drop-down menu for Show
Buy/Sell Arrows and select Never Show Arrows.
See Program Options section to view individual Indicator
setting details.
Customizing the Buy/Sell Signals
To change the color of the buy/sell arrows, click on the color box
to open the color panel. Choose a new color by clicking on it.
Thresholds: A threshold is the area defined by the study as a
region used to determine buy sell signals. Not all studies include
thresholds; see the Using Indicators Section for further
documentation.
Changing the threshold numbers: Click on Program Options and
select the Indicator under My Default Settings or Current Chart
Settings. Select the threshold number and type the new number in
the edit box.
To change the color of the threshold lines displayed in the
Indicator Window, click on the color box next to the threshold and
select the new color from the color panel.
Track ‘n Trade Pro 4.0 User Manual
144
Using Indicators
Displaying/Removing threshold lines: Click on Program Options
and select the Indicator under My Default Settings or Current Chart
Settings. Before each threshold is a check box, check to display
and uncheck to remove.
Track ‘n Trade Pro 4.0 User Manual
145
Using Indicators
%R – Williams Percent R
Introduction:
Larry Williams originally used a ten-day interval, and plotted
where the current price compared to that interval. He used it to
measure conditions of overbought and oversold. The overbought
region is the area below 20% and the oversold region is the area
above 80% - with the ability to invert the values it can be looked at
in the same manner as other overbought/oversold indicators
(Note: we will use the traditional method, not the inverted in our
discussions). Choosing the time period which the indicator looks
at the interval for the indicator is crucial to finding the optimal
sensitivity.
Interpretation:
Williams’s basic rule is simple. When the %R is lower than 20%
and becomes greater than 20% it is interpreted as a buy signal,
and conversely when the %R is higher than 80% and becomes
lower than 80% a sell signal is activated.
Changing the sensitivity of the indicator to work for you is
essential to making the study a better tool. The longer the period
for the %R, the less sensitive it will be. The indicator will move
less but will be more smoothed. A number of technical traders use
a value that is less volatile, in other words a larger value. Many
traders find it better to use a strategy where the market leaves the
areas of overbought/ oversold before entering a trade position. In
either case using solid exit strategies is important with this
indicator.
Example of the %R in the Indicator Window:
Track ‘n Trade Pro 4.0 User Manual
146
Using Indicators
Calculation:
Parameters:
Period (10) - The number of price bars, or the interval, used to
calculate the study.
Common Formula:
You must first determine the highest high and lowest low for the
length of the interval. This is the trading range for the specified
interval. The general formula for the %R is as follows:
%Rt = ( (Highn - Closet) / (Highn - Lown) ) * -100
%Rt: The percent of the range for the current period.
Highn: The highest price during the past n trading periods.
Closet: The closing price for the current period.
Lown: The lowest price during the past n trading periods.
n: The length of the interval.
Example:
Assume the market is Treasury Bills. The high for the past ten
trading intervals is 9275, and the low is 9125. The closing price in
the current period is 9267. If you substitute those values in the
equation, you get:
%R = ( (9275 - 9267) / (9275 - 9125) ) * 100
= (8 / 150) * 100
= 5.33
Updated Formula:
%Rt = ( (Closet - Lown) / (Highn - Lown) ) * -100
Customizing:
To change the settings of this indicator, open the Program Options
screen by clicking the Program Options button located on the main
Toolbar. See the Program Options section for more details on
changing the settings.
Track ‘n Trade Pro 4.0 User Manual
147
Using Indicators
AD –Williams AD
Introduction:
Larry Williams created this indicator in an attempt to measure
market pressures. It specifically looks for a difference in price and
then measures that difference. It is a tool used to measure market
sentiment and strength. The key is to look for strong differences in
what the market does as opposed to what the indicator does.
Looking for substantial divergence from the AD index versus the
underlying chart is the key to future price direction.
Interpretation:
The indicator is computed by taking the previous days close and
comparing it to the current days close. If the close of today was
higher, then the low for the period is subtracted from the current
days close, and added to the current AD. A pattern of higher highs
would show a consistently increasing AD. If the close of today is
the same as yesterday then there is no change in the AD. If the
close of today is lower than yesterdays low, the close of today is
subtracted from the high for the current period and that difference
is subtracted from the AD.
The main thing to look for is a difference in the AD and the market
trend. If a market were to make a matching or lower low or a
matching or higher high and the AD fails to follow the market trend
then this is divergence. Divergence implies a reversal in the
dominant trend may be near.
A series of lower lows would read as a decreasing AD. The
pattern created by the AD and the differences in the chart are
what the trader looks for. Divergence or a difference from the
pattern is what you want to see. For example, if the market
continues to march to higher territory and the AD follows by doing
the same then there is no divergence. However if the market
makes several new highs but the AD fails to make new highs, it is
a warning signal of a market about to reverse direction.
Example of the Williams AD in the Indicator Window
Track ‘n Trade Pro 4.0 User Manual
148
Using Indicators
Calculation:
Formula:
The AD index is computed several different ways. Some
computations normalized the index, while others added extra
smoothing factors through the use of moving averages
The first comparison checks for accumulation (i.e. Is the current
close higher than previous close?). If the market is accumulating,
then compute the difference between current close and low. Next,
add that arithmetic difference to the Accumulation/Distribution
Index. Traders perceive an undervalued market and buy. The
procedure is:
If Closet > Closet-1 then ADt = ADt-1 + (Closet - Lowt)
The second comparison checks for no change in price. If correct,
the AD index does not change. It states:
If Closet = Closet-1 then ADt = ADt-1
The last and final comparison checks for a down market. It checks
for current close below previous close. If that is correct, the market
is distributing. The software first computes the difference between
current high and close. It then subtracts that difference from the AD
index. This measures market distribution. Traders perceive an
overvalued market and are selling. The final computation is:
If Closet < Closet-1 then ADt = ADt-1 - (Hight - Closet)
ADt - The accumulation/distribution index for the current period.
ADt-1 - The accumulation/distribution index for the previous period.
Closet - The closing price for the current interval.
Closet-1 - The closing price for the previous interval.
Hight - The true high price for the current interval.
Lowt - The true low price for the current interval.
Note: The true high is the higher value of the current high or the
previous close. The true low is the lower value of the current low or
the previous close.
Customizing:
To change the settings of this indicator, open the Program Options
screen by clicking the Program Options button located on the main
Toolbar. See the Program Options section for more details on
changing the settings.
Track ‘n Trade Pro 4.0 User Manual
149
Using Indicators
CCI –Commodity Channel Index
Introduction:
The Commodity Channel Index (CCI) is designed to detect
beginning and ending market trends. The formula standardizes
market prices so that the trader can spot deviations from the
market's trend more easily.
Proponents of this indicator say that 70% to 80% of all price
fluctuations fall within +100 and -100 as measured by the index.
This is akin to technical lore that most of the time, markets trade in
a sideways trend or channels. However, when the indicator moves
out of this range, it is said that a trend is underway.
The calculation for CCI is very similar to the histogram Moving
Average Convergence Divergence (MACD), as the CCI measures
the average daily prices distance from a moving average of
average daily prices, in much the same way that MACD measures
the distance between moving averages from a base line.
The trading rules for the CCI are as follows: Establish a long
position when the CCI exceeds +100. Liquidate when the index
drops below +100. For a short position, you use the -100 value as
your reference point. Any value less than -100 suggests a short
position, while a rise above -100 tells you to liquidate your short
position.
Interpretation:
Generally, followers of the CCI look to establish long positions
when the CCI exceeds the +100 level, indicating that prices are in
a strong up trend. Generally, most users of this indicator also try
to look for patterns with in the indicator, such as higher highs, and
look for CCI movements to be confirmed by general price
readings as well.
Standard interpretation calls for long positions, once initiated on
the upward exceeding of the +100 level, to be held until the CCI
falls back below +85, at which time positions are exited as the
market has stopped trending upward.
Short positions are generally established when the CCI goes
lower than -100, indicating that prices are in a strong down trend.
Like long positions, most users of this indicator try to watch out for
patterns within the CCI itself to confirm the downward trend, and
also look for confirmation from lower prices on the chart itself.
Once a short position is established, the original interpretation of
this indicator calls for holding the position until the index climbs
above -85 to the upside, at which time short positions should be
covered.
Track ‘n Trade Pro 4.0 User Manual
150
Using Indicators
The purpose of the CCI index is to try to keep you out of the
market during consolidation or weak trending periods. By
measuring the difference average prices versus mean average
prices, this indicator attempts to isolate only strongly trending
markets, similar to momentum and MACD.
In the Track 'n Trade CCI indicator pane, -100 is 33% of the
window, +100 is 66% of the window. Therefore, guides could be
set at these two points for ease in tracking CCI.
Example of the CCI in the Indicator Window:
Calculation:
Parameters:
Period (20) - the number of bars, or period, used to calculate the
study.
Formula:
The proper calculation of the CCI requires several steps. They are
listed in the proper sequence below. You must first compute the
typical price, using the high, low and close for the interval. It is the
simple arithmetic average of the three values.
TP = (Hight + Lowt + Closet) / 3
TPt - represents the typical price.
Hight - The highest price for this interval.
Lowt - The lowest price for this interval.
Closet - The closing price for this interval.
Next, you calculate a simple moving average of the typical price for
the number of periods specified.
TPAVGt = (TP1 + TP2 +... + TPn) / n
TPAVGt - The moving average of the typical price.
TPn - The typical price for the nth interval.
Track ‘n Trade Pro 4.0 User Manual
151
Using Indicators
n - Number of intervals for the average.
The next step is rather complex; it computes the mean deviation.
The formula is:
MDt = (|TPAVG1 - TP1| +... + | TPAVG1 - TPn |) / n
MDT - The mean deviation for this interval.
TPn - The typical price for the nth interval.
n - Number of intervals.
The symbol | | designates absolute value. In mathematical terms,
negative differences are treated as positive values.
Now, the computation for the final CCI value is:
CCIt = (TPt - TPAVGt) / (.015 * MDT)
CCIt - The Commodity Channel Index for the current period.
TPt - The typical price for the current period.
TPAVGt - The moving average of the typical price.
.015 - A constant.
MDT - The mean deviation for this period.
Customizing:
To change the settings of this indicator, open the Program Options
screen by clicking the Program Options button located on the main
Toolbar. See the Program Options section for more details on
changing the settings.
Track ‘n Trade Pro 4.0 User Manual
152
Using Indicators
DMI – Directional Movement Index
Introduction:
Wilder's DMI is similar to the historic volatility indicator in that it
shows the market tendencies. The main use of this tool is to show
the strength of a trend. This could direct the trader to use a trend
following system or a counter trend system in their trading. It also
indicates possible price reversals.
Directional Moving Index is plotted as three lines on a scale of 0 to
100. This scale is a measure of market trend. The two lines of
DMI show the amount of positive and negative movement. The
positive line is called D+ and the negative D-. The direction of
these lines and the use of crossovers can show the changes in
the current market. The key to this indicator is the ADX, or
average of the difference of these two lines. The ADX is the main
factor in using this indicator. During periods of extreme price
variation the two lines can become very volatile; the ADX is used
to compensate for this.
Interpretation:
The best application of DMI is present when used with another
indicator. DMI should either confirm or contradict the indicator
being used. It is also best to use DMI in long-term trade situations.
Because the study is not as sensitive as other indicators it is
appropriate to use it as a confirmation tool. When the DMI is
advancing, the average is higher on the 0 to 100 scale, trend
following systems are best employed. Likewise with a decreasing
DMI average, the line is lower on the scale closer to 0, a counter
trend system might be best. These traits represent the fact that as
the average line goes higher in the scale the strength of the trend
is gaining, and as the ADX goes lower the trend is loosing
strength. It is also important to look at the individual lines for
changes in price movement.
The other application for DMI is to look at the D+ and D- lines
themselves. When the D+ line crosses above the D- line a buy
signal is initiated. This indicates that the positive price direction is
greater than the negative. Conversely, once the D+ line crosses
below the D- line, a sell trigger is present. The negative price
movement is overtaking the positive.
Welles Wilder himself said that he was not comfortable using
these two lines by themselves. So when looking at reversals the
ADX should be above both lines and once it turns lower we should
see a change in market direction. One should also look to ADX for
confirmation. For a good sell signal, the D+ should be greater
than D- and both should be lower than ADX ( D+ > D- < ADX ).
Track ‘n Trade Pro 4.0 User Manual
153
Using Indicators
For a good buy signal, D+ should be lower than D- and both
should be lower than ADX ( D+ < D- < ADX ).
This application is much the same as momentum showing a
change in the market sentiment. Wilder also says that a trend
following system should not be used when the ADX line is below
both D lines, as this means that the market has no discernable
direction.
When using the D+ and D- crossover method, Wilder stresses the
use of an extreme point. On the day the crossover occurs, the
extreme point is the high or low of the day, (high for a buy, and
low for a sell). The market should be able to take out that price
and stay beyond it for several days before the trade is initiated or
exited. This use of extreme points should keep the trader from
getting into whipsaws or false breakouts.
Example of the DMI in the Indicator Window:
Calculation:
Parameters:
Period (14) - the number of bars, or interval, used to calculate
the study.
Show/Hide +DI (1) - this parameter is used to show or hide the
+DI line. 0=hide, 1=show.
Show/Hide -DI (1) - this parameter is used to show or hide the DI line. 0=hide, 1=show.
Show/Hide ADX (1) - this parameter is used to show or hide the
ADX line. 0=hide, 1=show.
Computations:
The computations needed to generate the final figures for the DMI
are not complex but are numerous and lengthy. The following
discussion attempts to unravel the computational mysteries of the
DMI.
If you need further explanation, please refer to the author's
original work. The book titled New Concepts in Technical Trading
Systems by J. Welles Wilder, Jr. explains this indicator and
several others.
Track ‘n Trade Pro 4.0 User Manual
154
Using Indicators
You must first compute the directional movement, DM, for the
current trading interval. Directional movement can be up, down or
zero. If directional movement is up, it is labeled as +DM. The
expression -DM refers to downward directional movement.
Wilder defines directional movement as the largest part of the
current trading range that is outside the previous trading range.
From a mathematical view, it is the largest value of the following
differences:
Hight - Hight-1 or Lowt - Lowt-1
This is only true when the current low is less than the previous
low, or the current high exceeds the previous high. Please note
that both of these conditions do not have to be met, only one. It is
the largest portion of the trading range outside of the previous
trading range.
It is possible for the directional movement to be zero. This occurs
when the current trading range is inside the previous trading
range, or the trading ranges, current versus previous, are equal.
Directional movement is up or positive, when the difference
between the highs is the greatest. It is down or negative when the
difference between the lows is the largest value. Thus, the up
directional movement is +DM, and down directional movement is DM.
Do not let the plus and minus sign designation mislead you. They
only indicate upward or downward movement, not values. The
directional movement value is always a positive number or
absolute value, regardless of upward or downward movement.
This concept is crucial to understanding the computations for the
indicator. If you are confused or do not understand, draw some
illustrations or work with actual price data to determine the
directional movement values.
The next step in determining the DMI is to compute the true
range. According to the author, the true range is the largest value
of the following equations:
Hight - Lowt
Hight - Closet-1
Lowt - Closet-1
The true range is always a positive number. From this point
forward, all references to the true range are designated as TR.
Continue this process for the specified trading interval. In this
example, use a value of 14. This is the same value Wilder used
Track ‘n Trade Pro 4.0 User Manual
155
Using Indicators
on daily data. His logic for using this value is that it represented an
average half-cycle period. When this task is accomplished for the
specified interval, you compute the average value of the +DM, DM and TR.
Wilder prefers to use an accumulation technique rather than
computing a pure moving average. It was actually a short cut
designed to save computational time and effort. That technique is
as follows:
Averaget = (Averaget-1 - (Averaget-1 / n)) + Valuet
Thus, when you substitute the above symbols, you have:
+DMt = (+DMt-1 - (+DMt-1 / n)) + (+DMt)
-DMt = (-DMt-1 - (-DMt-1 / n)) + (-DMt)
TRt = (TRt-1 - (TRt-1 / n)) + (TRt)
If you think about it, it really is a timesaving convention.
Remember, this indicator was developed before microcomputers
were invented. The only tool available was the desktop calculator
or adding machine. You could spend a great deal of time and
effort calculating averages.
You now have the average values. The next step is to compute
the directional indicator. Again, it can either be up or down,
depending upon the directional movement. On up intervals, the
formula is:
+DI = (+DM / TR) * 100
On a down interval, the formula is:
-DI = (-DM / TR) * 100
The plus and minus directional indicator values are computed as
percentage figures. You are expressing the percentage of the
average true range for both up and down trading intervals.
If you have followed this process so far, the last few steps are
relatively simple. You compute the difference between the +DI
and the -DI. Again, you use the absolute value of this difference.
Simply, convert any negative value into a positive number. The
formula is:
DIdiff = | ((+DI) - (-DI)) |
Next, compute the sum of the directional indicator values. The
formula reads as follows:
Track ‘n Trade Pro 4.0 User Manual
156
Using Indicators
DIsum = ((+DI) + (-DI))
Once you compute the DIdiff and the DIsum, you calculate the DX
or directional movement index. This value is always a percentage.
The formula is:
DX = (DIdiff / DIsum) * 100
The DX is always a value between 0 and 100. If your calculations
exceed this range, you made an error. Wilder was not comfortable
using just the directional movement index. It could become very
volatile during periods of extreme price movement, especially
markets that rise and fall quickly. Again, he implements his
accumulated moving average technique to smooth the DX. The
result is the ADX or average directional movement index. The
computational procedure is as follows:
ADXt = ( (ADXt-1 * (n - 1) ) + DXt) / n
Customizing:
To change the settings of this indicator, open the Program Options
screen by clicking the Program Options button located on the main
Toolbar. See the Program Options section for more details on
changing the settings.
Track ‘n Trade Pro 4.0 User Manual
157
Using Indicators
HVOL – Historic Volatility
Introduction:
The Historic Volatility indicator is used mainly as an option
evaluation tool. It does not give trading signals like those given
with other technical indicators. What it does do is give the trader
an idea of how volatile the market has been for the previous
period of time.
Changing the period of time the study observes allows the trader
to fine tune options prices. If a market has been extremely volatile
for the past 3 months, for example, then near term options should
be more expensive. If the market has been calm for an extended
period of time longer term options should be reasonable.
Its use in futures is for observation, telling the trader if prices are
calming down or becoming more erratic.
Interpretation:
The key to using historic volatility is determining the correct period
of time for each market. The market you are looking at may show
a history of volatility years ago but may have been relatively calm
the last few months. Getting an idea of the markets behavior
recently may be of no use to the trader that is looking at distant
options and vice versa for the trader looking at near term options.
For the futures trader this tool is useful as a guide for order
placement. Seeing that market volatility is changing may indicate
that it is time to move stops closer or farther away. If the trader is
profitable with the trend and volatility is changing it might be a
time to move stops closer to protect profits. If a trader is trading
against the trend, they might want to move stops further away to
avoid getting bumped out prematurely.
Options traders could use this study to help them purchase
profitable options. The basic idea is to buy options when volatility
is decreasing to take advantage of a change in that volatility. Any
rise in volatility will translate to an increase in option values. Look
at options strategies that take advantage of low volatility, such as
straddles or ratio spreads. When volatility is high selling options
would be better, because any decrease in volatility will translate to
a loss of option value. Option strategies that take advantage of a
decrease in volatility are strangles and regular short option
positions.
Obviously, historic volatility is only one component of option
pricing. Any changes in the underlying futures market could
negate the changes in option prices due to volatility. For example,
if you were to buy a low volatility Put option and prices go higher
Track ‘n Trade Pro 4.0 User Manual
158
Using Indicators
that option will lose value but not as quickly as a higher volatility
option.
For the futures trader the basic concept is to expect market
changes during periods of increased volatility. George Soros, the
trading legend, said "Short term volatility is greatest at a turn
around and diminishes as a trend becomes established."
This indicator is commonly viewed as very mean regressive. What
this term means is that the historic volatility indicator tends to
return to the opposite end of the spectrum and therefore return to
an average. If volatility is great it will eventually cool off and return
to that place. If volatility is low it will not stay quiet forever. What
this means to traders is that a market that is erratic will sooner or
later calm down and a market that is quiet will eventually get loud
again.
Example of Historical Velocity in the Indicator Window:
Calculation:
Parameters:
Period (20) - the number of bars, or period, used to calculate the
study. You may alter this to use any number greater than 1 for the
close. The indicator displays in simple percentage values.
Formula:
The calculation for the historical volatility is rather involved. The
number of periods per year vary depending on the type of price
chart used for the study. The following table lists the number of
periods for each type of chart:
Chart Type
Trading Periods per Year
Perpetual
262
Daily
262
Weekly
52
Monthly
12
Variable
Based on chart period (see below)
Tick
Not available for this study
Track ‘n Trade Pro 4.0 User Manual
159
Using Indicators
When using variable charts, you must first calculate the number of
trading periods per year. To do this, you must determine the
trading time of the selected commodity. The formula is as follows:
TP = (Tt / Pn) * 262
TP - The total number of trading periods per year.
Tt - The total trading time in a day.
Pn - The length of the period.
262 - The number of weekdays per year.
For instance, the S&P 500 trades from 8:30 a.m. to 3:15 p.m. That
is a total trading time of 6 hours and 45 minutes. On a variable
chart using 5 minute bars, the number of periods for the day is 81
as demonstrated:
6 hours @ 60 minutes = 360 minutes
45 minutes +45 minutes
Total minutes of trading = 405 minutes
405 / 5 minute bars = 81 trading periods per day
Now that you have calculated the trading periods per day, you now
must calculate the number of periods for the year. Since historical
volatility considers every weekday of the year when calculating total
periods for the year, the multiplier is 262:
TP = (405)/5) * 262
TP = 81* 262
TP = 21,222
Note: This formula applies only to historical volatility on a variable
chart. It does not apply to other chart types.
Now that you have the total number of periods per year, continue
with the calculation of the historical volatility.
Next calculate the logarithm of the price change for each price in
the specified time span of n periods. The formula is:
LOGSi = LOG(Pi / Pi-1)
LOG - The logarithm function.
Pi - The current price
Pi-1 - The previous price
Track ‘n Trade Pro 4.0 User Manual
160
Using Indicators
Now that you have the logarithms of the price changes, calculate
the total logarithms for the time span you are reviewing. To
calculate the total of the logarithms, use the following formula:
Tlogs - The total of the logarithm price ratio for the time span.
S - Indicates to sum all n logarithms.
LOGSi - The logarithm of the price change for period i.
n - The number of periods for the specified time span.
The next step is to calculate the average of the logs by dividing
the total logarithm by the number of periods as shown below:
ALOGS = Tlogs / n
ALOGS - The average of the logarithms.
Tlogs - The total of the logarithm for the time span.
n - The number of periods for the specified time span.
The last calculation is to sum the squares of the difference
between the individual logarithms for each period and the average
logarithm. This is accomplished in the following formula:
SSD - The sum of the squared differences.
S - Indicates to total the squares of all n differences.
LOGSi - The logarithm of the price change for period i.
ALOGS - The average of the logarithms.
Now that the elements of the final formula are complete, the
following formula calculates the historical volatility for a given
period over a specified time span.
Track ‘n Trade Pro 4.0 User Manual
161
Using Indicators
SSD - The sum of the squared differences.
n - The number of periods for the specified time span.
TP - The total number of trading periods for the year.
Due to the complexity of the formula, it is preferable to use a
scientific calculator when attempting to manually calculate the
historical volatility of a futures instrument.
Customizing:
To change the settings of this indicator, open the Program Options
screen by clicking the Program Options button located on the main
Toolbar. See the Program Options section for more details on
changing the settings.
Track ‘n Trade Pro 4.0 User Manual
162
Using Indicators
MACD
Moving Average Convergence/Divergence
Introduction:
In an attempt to determine the strength of a trend along with the
direction of that trend MACD was created. Gerald Appel created a
system that looked at two exponential moving averages and the
difference between those two averages. Looking at these moving
averages of the market we are able to see clear buy and sell
signals. By also looking at an average of the difference in the two
moving averages we are able to get a more accurate signal.
Interpretation:
Computing this indicator requires the use of exponential moving
averages. Exponential moving averages are different than simple
moving averages because instead of looking at only the last few
days and averaging them, the exponential averages look at all the
prices, and then put more weight on the most recent data. This
type of weighted average gives a smoother average price that
reacts more quickly to market moves. The two averages of MACD
move above and below a base line, which gives indication of the
strength of the current move. This placement of the two averages
in relationship to the base line is calculated by looking at the
exponential moving average of the difference between the two
averages. So even though the two averages may cross, the
divergence or true indication of the signal is not shown until both
averages cross the base line.
Keeping this in mind, an ideal buy signal is seen on a move where
the shorter-term average moves above the other average and
both averages cross above the base line of zero. Inversely a sell
signal would be the opposite of this.
The histogram method of MACD is read as a straight line above or
below the zero baseline. This line represents the difference
between the Moving Averages. Therefore when the moving
averages move above the base line they are indicating a buy, and
as the difference between the averages increases the lines will
get taller.
The opposite is true of a sell signal. Track 'n Trade's ability to
display MACD in this fashion is vital because it allows you to read
the strength of the current trend along with the signal to buy or
sell.
When MACD is plotted as a histogram, the values used to plot the
histogram are the differences between the two moving averages
on each day. The "trigger" line that appears on this chart is an
Track ‘n Trade Pro 4.0 User Manual
163
Using Indicators
average of the histogram data, or put more simply, a smoothed
view of the histogram.
Using the MACD as a histogram also allows the trader to spot
divergences between the indicator and the market price. A
divergence is present when the market makes a higher high than
the previous high, but the MACD histogram fails to make a
corresponding higher high. This is considered - in technical lore to be a sign of weakness and a sell signal when the MACD breaks
below the lowest point in between the divergent highs.
Bullish divergence is seen in an exact opposite fashion. Assume a
market has been trending downward. The market has been
consistently making lower lows, as has been the MACD histogram
indicator. However, eventually the MACD fails to make a lower
low, corresponding to the lower low in price. If the MACD
histogram line crosses above the highest high in between the
divergent lows, then technical lore holds that higher prices should
follow.
Example of the MACD in the indicator Window:
Calculation:
Parameters:
First (12) - the number of bars, or interval, used to calculate the
first Exponential Moving Average.
Second (26) - the number of bars, or interval, used to calculate
the second Exponential Moving Average.
Difference (9) - the number of bars, or interval, used to calculate
an additional Exponential Moving Average.
Formula:
In this study, the oscillator is the simple difference between the
first two exponential moving averages. The formula is as follows:
OSCt = (EMA1 - EMA2)
OSCt - The oscillator for the current period.
EMA1 - The first exponential moving average.
Track ‘n Trade Pro 4.0 User Manual
164
Using Indicators
EMA2 - The second exponential moving average.
The second part of the study computes an exponential moving
average of the oscillator. You have:
EMAosct = EMAosct-1+ (k * (OSCt - EMAosct-1))
EMAosct - The exponential moving average of the oscillator.
OSCt - The oscillator for the current interval.
EMAosct-1 - The exponential moving average of the oscillator for
the previous interval.
k - The exponential smoothing constant.
Since the second value, EMAosct, is an exponential moving
average, it rises and falls more slowly than the oscillator. Hence,
the two lines generate crossover points. These crossover points
are the buy/sell signals. Review Reading Moving average
Convergence/Divergence Trading Signals for other possible
trading signals.
If the study is displayed as a histogram, each value for the lines is
calculated as:
DIFFt = OSCt - EMAosct
DIFFt - The difference between the oscillator for the current
interval and the exponential moving average of the oscillator.
OSCt - The oscillator for the current interval.
EMAosct - The exponential moving average of the oscillator.
Customizing:
To change the settings of this indicator, open the Program Options
screen by clicking the Program Options button located on the main
Toolbar. See the Program Options section for more details on
changing the settings.
Track ‘n Trade Pro 4.0 User Manual
165
Using Indicators
MOM – Momentum
Introduction:
The momentum indicator describes how price changes occur. It is
a measure of the price change. It lets you know if prices are
increasing at a continually increasing rate or decreasing at a more
decreasing rate. Momentum can help gauge the current market
trend. This indicator will sometimes shift ahead of a price change.
It is both an indicator of trend as well as an indicator of a changing
trend. The main thing to look for when using it is a divergence or
difference between price behavior and the indicators behavior.
Interpretation:
Momentum measures the rate of change in prices rather than
actual price levels themselves. By measuring this rate of incline or
decline momentum tells whether the current trend is strengthening
or weakening. If prices are rising and the momentum indicator is
above the zero line then the trend is gaining strength. If prices
were rising but the indicator was sagging or went below the zero
line then we would interpret this as a sign of a coming change in
trend. This is true because although prices were still increasing
they are doing so at a decreasing rate.
The reverse would be true during a declining market. For
example, think of a race car gaining 20 miles an hour each lap,
until it starts to only gain 15 miles an hour, then 10 mph, then 5
mph until eventually it reaches its top speed. Like a race car, a
market can not sustain growing momentum forever, and in many
occurrences momentum slows before prices change direction.
Typically, the trade signals are to buy when the momentum
indicator crosses from below the zero line to above it. This
indicates that a new upward trend has begun, as the market is
able to violate resistance levels and continue higher with
increasing speed.
The sell signal would be to sell when the line crosses from above
the zero line to below it. This indicates that the market is picking
up speed to the downside and should be able to violate support
areas.
It is in this way that this unique indicator is a trend following tool.
Another way to use momentum is to establish regions of
overbought or oversold. For example when, in a declining market,
the prices continue downward and the momentum indicator
moves toward more negative but begins to level out. We would be
looking for a buy signal when the indicator turned upward and out
of that oversold region.
Track ‘n Trade Pro 4.0 User Manual
166
Using Indicators
It is in this way that momentum can sometimes shift ahead of the
price movement. This use of the momentum indicator is a counter
trend usage.
In either implementation of this indicator the key is divergence seeing momentum make lower highs while prices are making
higher highs or momentum making higher lows while prices are
making lower lows. Being aware of a difference in price movement
and the momentum level can help the trader make informed
trading decisions.
Example of the Momentum in the Indicator Window:
Calculation:
Parameters:
Period (20) - the number of bars, or period, used to calculate
the study. You must determine a value suitable to your trading
needs and methods. Some technicians argue the length of the
momentum indicator should equal the normal price cycle. The
best method is to experiment with different lengths until you
find the length that works best for that particular commodity
you are trading.
Formula:
The general formula to calculate momentum is as follows:
MOMt = Pi - Pi-n
MOMt - The momentum indicator for the current period.
Pi - The price of the i interval.
Pin - The price n intervals ago.
n - The number of intervals or length specified.
Assume the current price is 7470. This example examines a
momentum study using a length of ten trading intervals. The price
ten intervals ago was 7400. The calculation is:
MOM = 7470 - 7400 = +70
The momentum value can have a very broad range. It is a
function of the length you select for the momentum and the
volatility of the underlying futures contract. Thus, it could swing
very widely and wildly about the zero line.
Track ‘n Trade Pro 4.0 User Manual
167
Using Indicators
Customizing:
To change the settings of this indicator, open the Program Options
screen by clicking the Program Options button located on the main
Toolbar. See the Program Options section for more details on
changing the settings.
.
Track ‘n Trade Pro 4.0 User Manual
168
Using Indicators
RSI – Relative Strength Index
Introduction:
The RSI was developed by J. Welles Wilder, Jr. as a measure of
the market's strength or weakness. The principle idea of this study
is that it will indicate a general zone that the market is in, either
the buy or sell zone. This indicator is similar to Stochastics in that
it shows regions of overbought and oversold. This indicator should
be incorporated into a system rather using it by itself. Wilder's
popular indicator is known for its accuracy and its ability to
compensate for erratic price movement.
Interpretation:
RSI computes the difference in recent prices as a solid line and
plots this line on a scale similar to the scale used by Stochastics.
The area above 70 is generally considered to be the overbought
region, and the region below 30 is referred to as the oversold
region. Simply selling in the overbought region and buying when
RSI is in the oversold region is not a consistent method of trade.
Trade signals are not generated until the RSI leaves these
regions. So a sell signal would not be present until the RSI has
begun sloping down and leaves the 70 region.
A buy signal, in the simple methodology associated with this
pattern, is derived when RSI leaves the oversold region - crosses
from below 30 to above it. Just like sell signals, RSI buy signals
are present when the market begins to turn and the indicator
leaves the oversold region.
Another use of the RSI is to look for a divergence in prices. When
a market makes higher highs or lower lows and the RSI fails to
follow suit. This difference in the indicator and the market could be
a signal that the market lacks the momentum to continue its
current price direction. So you may be able to take a position
sooner using this strategy than you would with the previous way.
Wilder says that this divergence is "the single most indicative
characteristic of the RSI."
The RSI indicator uses in it's calculation a moving average of
price changes over the period. You can select which type of
moving average is used to produce the desired amount of
smoothing on the RSI indicator.
Track ‘n Trade Pro 4.0 User Manual
169
Using Indicators
Example of the RSI in the Indicator Window:
Calculation:
Parameters:
Period (14) - the number of bars, or period, used to calculate
the study.
Formula:
The RSI computations are not difficult, but they are tedious.
You first calculate the difference between the current closing
price and the previous closing price. The general formula is:
DIFt = Closet - Closet-1
If that difference is a positive value, it is an up period - the
current close is higher than previous close. If the difference is
negative, it is a down period - the current close is below the
previous close. The DIF value for a series of UP and DOWN
days. The DOWN value is always a positive number for all
computations. It is the absolute value of a negative DIF.
The worksheet below shows the calculations needed to
create a 9 period RSI.
Day Current
Close
Previous
Close
Dif
Up
Down
1
7450
7430
+20
20
0
2
7460
7450
+10
10
0
3
7470
7460
+10
10
0
4
7480
7470
+10
10
0
5
7485
7480
+5
5
0
6
7490
7485
+5
6
0
7
7480
7490
-10
0
10
8
7470
7480
-10
0
10
9
7455
7470
-15
0
15
Totals
60
35
Track ‘n Trade Pro 4.0 User Manual
170
Using Indicators
You now compute the up and down averages, which are calculated
as follows:
Ut = (UP1 +... + UPi) / n
Dt = (DOWN1 +... + DOWNn) / n
UT - The up average for the current period.
DT - The down average for the current period.
UPn - The UP value for the nth period.
DOWNn - The DOWN value for the nth period.
n - The number of periods for the RSI.
Now, use the values from the worksheet. The up average is:
U = 60 / 9
= 6.67
and the down average is:
D = 35 / 9
= 3.89
The general formula for the RSI is:
RSIt = ( UT / (UT + DT) ) * 100
If you use the above values and place them in the formula, it
appears as follows:
RSI = ( 6.67 / ( 6.67 + 3.89 )) * 100
= 63.16
Assume the market continues the downward trend. The next DIF
value is -15, which sets the UP value to 0, zero, and the DOWN
value to 15. Calculate the next up and down average by using
Wilder's accumulative moving average technique. The formulae
are:
UT = ( (UT-1 * (n-1) ) + UPt) / n
= ( (6.67 * (9 -1) ) + 0) / 9
= 5.93
DT = ( ( DT-1 * (n-1) ) + DOWNt) / n
= ( ( 3.89 * (9 - 1) ) + 15) / 9
= 5.12
The value for the new RSI equals the following:
Track ‘n Trade Pro 4.0 User Manual
171
Using Indicators
RSI = ( (5.93) / (5.93 + 5.12)) * 100
= 53.67
Customizing:
To change the settings of this indicator, open the Program Options
screen by clicking the Program Options button located on the main
Toolbar. See the Program Options section for more details on
changing the settings.
Track ‘n Trade Pro 4.0 User Manual
172
Using Indicators
FSTO – Fast Stochastics
Introduction:
Stochastic Process was invented by Dr. George C. Lane many
years ago under this basic premise: During periods of decrease
daily closes tend to accumulate near the extreme low of the day
and conversely during periods of increase daily closes tend to
accumulate near the extreme highs of the day.
This indicator is designed to show conditions of overbought and
oversold markets. Stochastics are divided into two types regular
Stochastics, often referred to as Fast Stochastics, and Slow
Stochastics. Fast Stochastics are said to be more sensitive to
price changes and can give very greatly in the short-term, hence
the need for Slow Stochastics.
Interpretation:
Stochastics display two lines that move in a vertical scale between
0 and 100 - representing percentiles from 0% to 100%. Think of
the level of Stochastics as where the most current close is within a
specific range. For example, if Stochastics are reading 50%, the
current close is in the middle of the price range for specified
period of time. If Stochastics are reading 100%, the close is at the
high of the range, and 0% represents current close price being at
the low of the range. Of course, because Stochastics are
smoothed this is not exactly true, but should help you visualize the
information being shown. This will also help you to understand
why Stochastics are a counter trend indicator, in that the
underlying principle behind Stochastics is that prices will move
back to the center of the trading range, or the opposite extreme.
When both lines move to an area below 20 on this scale they are
said to be in an oversold zone. Conversely, when both %K and
%D move to above 80 on this same scale they are indicating
overbought. It is this indication of market sentiment that makes
this counter trend indicator useful.
George Lane emphasized that the most important signal
generated by this method was the difference or divergence
between %D and the underlying market price. He said that the
divergence is where %D line makes a group of lower highs while
the market makes a series of higher highs. This would indicate an
overbought condition. The reverse would be true of an oversold
market, with %D making higher lows and prices making lower
lows.
Trade triggers to buy are created when, during an oversold
condition (Stochastics below 20) the slow line, %D is crossed by
the faster moving line, %K.
Track ‘n Trade Pro 4.0 User Manual
173
Using Indicators
The opposite would occur with a sell signal. The faster %K line
crosses above the slower %D line, when both are at a reading
above 80.
As with a dual moving average system when the faster reacting
indicator crosses the slower moving indicator a buy or sell is
signaled. Because Stochastics give an indication of either
overbought or oversold you would first want to see both lines in
that above 80 or below 20 range and sloping out of that range
back to the middle before looking for these trade triggers.
Example of FSTO in the Indicator Window:
Calculation:
Parameters:
Overall Period (3) - the number of periods used to determine the
highest high and lowest low.
%D MA Period (14) - the number of periods used to determine the
moving average for the %D value.
Formula:
The first step in computing the stochastic indicator is to determine
the n period high and low. For example, suppose you specified
twenty periods for the stochastic. Determine the highest high and
lowest low during the last twenty trading intervals. It determines the
trading range for that time period. The trading range changes on a
continuous basis.
The calculations for the %K are as follows:
%Kt = ( (Closet - Lown) / (Highn - Lown) ) * 100
%Kt - The value for the first %K for the current time period.
Closet - The closing price for the current period.
Lown - The lowest low during the n periods.
Highn - The highest high during the n time periods.
n - The value you specify.
Once you obtain the %K value, you start computing the %D value
which is an accumulative moving average. Since the %D is a
Track ‘n Trade Pro 4.0 User Manual
174
Using Indicators
moving average of a moving average, it requires several trading
intervals before the values are calculated properly. For example, if
you specify a 20 period stochastic, the software system requires
26 trading intervals before it can calculate valid %K and %D
values. The formula for the %D is:
%DT = ( (%DT-1 * 2) + %Kt) / 3
%DT - The value for %D in the current period.
%DT-1 - The value for %D in the previous period.
%Kt - The value for %K in the current period.
The values 2 and 3 are constants. You specify the constants and
the length of the time period to examine for the trading range.
Customizing:
To change the settings of this indicator, open the Program Options
screen by clicking the Program Options button located on the main
Toolbar. See the Program Options section for more details on
changing the settings.
Track ‘n Trade Pro 4.0 User Manual
175
Using Indicators
SSTO - Slow Stochastics
Introduction:
The slower version of Stochastics is commonly believed to be a
more reliable indicator. In this version of Stochastics the more
sensitive %K line is dropped. The original %D now becomes the
slower line %K. The new %D is a 3-day moving average of the
%K. This basically gives you a smoothed version of the original
indictor. This modified counter trend indicator is less reactive but
considered to be more accurate.
Interpretation:
Slow Stochastics are interpreted the same as fast Stochastics.
Quite often the faster of the two indicators moves into and out of
the overbought/oversold regions quite quickly.
Example of the SSTO in the Indicator Window:
Calculation:
Parameters:
Overall Period (14) - the number of periods used to determine the
highest high and lowest low.
%K MA Period (3) - the number of periods used to determine the
moving average for the %K value.
%D MA Period (3) - the number of periods used to determine the
moving average for the %D value.
AdditionalLinePeriod (3) - the number of periods used to
determine an additional Moving Average on the Stochastic.
Track ‘n Trade Pro 4.0 User Manual
176
Using Indicators
Formula:
The calculations for the slow stochastic are similar to the normal
stochastic. The first step in computing the stochastic indicator is to
determine the n period high and low. For example, suppose you
specified twenty periods for the stochastic. Determine the highest
high and lowest low during the last twenty trading intervals. It
determines the trading range for that time period. The trading
range changes on a continuous basis.
The calculations for the %K are as follows:
%Kt = ( (Closet - Lown) / (Highn - Lown) ) * 100
%Kt - The value for the first %K for the current time period.
Closet - The closing price for the current period.
Lown - The lowest low during the n periods.
Highn - The highest high during the n time periods.
n - The value you specify.
Once you obtain the %K value, you start computing the %D value
which is an accumulative moving average. Since the %D is a
moving average of a moving average, it requires several trading
intervals before the values are calculated properly. For example, if
you specify a 20 period stochastic, the software system requires
26 trading intervals before it can calculate valid %K and %D
values. The formula for the %D is:
%DT = ( (%DT-1 * 2) + %Kt) / 3
%DT - The value for %D in the current period.
%DT-1 - The value for %D in the previous time period.
%Kt - The value for %K in the current period.
The values 2 and 3 are constants. You specify the constants and
the length of the time period to examine for the trading range.
Once the %K and %D values for the normal stochastic are
derived, the slow stochastic can be computed. The formula for the
slow stochastic is below:
%KSLOW = %DNORMAL
%DSLOWt = ( ( %D SLOWt-1 * 2 ) + %K SLOWt-1 ) ) / 3
%KSLOW - The %D for the normal stochastic.
%DSLOWt - Slow %D value for the current period.
%DSLOWt-1 - The slow %D for the previous period.
Track ‘n Trade Pro 4.0 User Manual
177
Using Indicators
%KSLOWt-1 - The slow %K for the previous period.
The values 2 and 3 are the smoothing constants. You may select
different values.
Customizing:
To change the settings of this indicator, open the Program Options
screen by clicking the Program Options button located on the main
Toolbar. See the Program Options section for more details on
changing the settings.
Track ‘n Trade Pro 4.0 User Manual
178
Using Indicators
VOL/OI –Volume/Open Interest
Introduction
Volume is a measurement of the number of contracts traded in a
day. It is a sign of market activity. Open Interest is the number of
contracts outstanding or those held overnight. This is a measure
of market participation. In liquid markets these numbers will be
consistently higher than in a thin or illiquid market. These numbers
are always a day behind, because it takes the exchange that long
to tabulate these figures. When displayed Track 'n Trade offsets
these values to put them beneath their respective data in the
chart, consequently there is not a value for either volume or open
interest for the most recent day of any contract. Volume and Open
Interest indicate participation and urgency. This tells the trader
which market is the correct one to be in based on its participation.
Interpretation:
Volume measures the number of contracts that changed hands
during that trading session. This indicator of market activity can
show whether trade was heavy or light. That will give you an idea
of the possible volatility present in that market.
Contracts that have not been settled at the end of the day are
represented by open interest. New buyers and sellers entering or
exiting the market change open interest.
The key to this indicator is to look at volume as a percentage of
open interest. VOI does not give straight buy or sell signals or
have set trading rules. Rather it shows the cyclical tendencies of
the market. The flow of the underlying market can be represented.
Looking at VOI shows whether new buyers or sellers are entering
the market or if they are liquidating positions.
There are basic common sense rules for this indicator. Prices are
up and VOI is increasing, the market is strong. Prices are up and
VOI is declining, the market is getting weaker. Prices are down
and VOI is rising, the market is getting weaker. Prices are down
and VOI is declining, the market is gaining strength.
In bull markets, volume tends to increase during rallies, and tends
to decrease on reactions. In bear markets, volume tends to
increase on declines and decrease during rallies. Trading volume
usually increases dramatically at tops and bottoms.
Look at volume and open interest will show you which contract
month to be in. When looking at trading a specific commodity it is
important to know which contract month to be in. Commodities
expire or are delivered several times a year. This creates a
situation where traders are constantly "rolling over" from one
contract month to the next. This means that traders need to know
Track ‘n Trade Pro 4.0 User Manual
179
Using Indicators
which month to be in. VOI is the tool that shows us which contract
month. The months that have the highest open interest are usually
the best to be in because they are the most liquid. The months
that have higher volume will afford the trader a better opportunity
to enter and exit the market.
Example of V/OI in the Indicator Window:
Calculation:
This study has no computations. The values for the volume and
open interest are transmitted from the exchanges. However, the
actual volume and open interest figures are always one day
behind price information. You will not know Monday's volume and
open interest until Tuesday at approximately noon (for U.S.
markets - central time). That is due to the exchanges and their
reporting requirements.
Customizing:
To change the settings of this indicator, open the Program Options
screen by clicking the Program Options button located on the main
Toolbar. See the Program Options section for more details on
changing the settings.
Track ‘n Trade Pro 4.0 User Manual
180
Using Indicators
Displaying Indicators in the Chart Window
The Overlay Indicators are displayed in the Chart Window. To
select these Indicators, right-click on the chart window and select
the name of the Indicator that you would like to display on the chart.
Indicators displayed in the
Chart Window are the:
Moving Averages
Bollinger Bands
Pivot Points
10x8 MAC
Parabolic SAR
Moving Average Lines
Introduction:
The moving average, or simple moving average as it is commonly
referred to as, represents the average of the last several closing
prices. The moving average is simple to compute, easy to
understand, and reliable under tests. This simplicity is the strength
of the moving average.
The basic moving average is computed exactly the same as any
other mathematical average. The most common way of
determining the moving average of a market is to take the closing
price over a certain number of days add them together and then
divide by the select number of days.
Interpretation:
Generally, moving averages are thought to be indicators of trend.
For example, conventional interpretation is that once prices cross
from below the moving average to above it, the trend is
considered up.
On the other hand, if prices go from above the moving average to
below it, the trend of the market is considered down.
The purpose of the simple moving average is to track the progress
of the trend. Moving averages keep you in the trend for potentially
a long time. The moving average gives you an indication of the
trend being up (prices above the moving average) or down (below
the moving average). However, the moving average gives you no
indication of the length or duration of the trend.
Track ‘n Trade Pro 4.0 User Manual
181
Using Indicators
Double Moving Average
Introduction:
Double moving averages use two different averages in tandem.
The first average is generally a faster reacting average using a
shorter period of time, usually 10 days. The second average is a
slower reacting average that will indicate longer-term price
movement.
Using these two averages together helps to alleviate “whipsaws”
by giving a basis of comparison. The faster average breaking
above the slower average is a buy signal, the faster average
breaking below the slower average is a sell signal.
Interpretation:
When using two different moving averages the trader gets a
clearer picture of price indications. By combining a slower moving
average, 20-day average, with a quicker reacting average, 10-day
average you can see where the long-term indications are going.
The trend being your friend, until it ends, you would sell once the
faster moving average crosses below the slower trend because
that is an indication of change in trend. Near term prices should
be rising at a greater rate than longer term prices in a good
upward trending market, and vice versa for a down trend.
Triple Moving Average
Introduction:
The system of triple moving averages is employed by plotting
three different moving averages together. The first of these
averages is a faster average that only looks at the short-term price
direction. The second average is a medium average that reacts to
a longer period of time, but not as long as the final average. The
third average is the slowest to react, because it takes an average
of the longest period of time.
Interpretation:
A 10, 20, and 40 day moving average system would be
considered a triple moving average. The first average, the 10-day,
is the quickest to move when prices show a change. The second
average, the 20-day, is the medium average that does not show
change until the prices have moved for a longer period of time.
Finally the slowest moving of the averages is the 40-day. This
slow average will not indicate a difference until prices have made
a significant move. Shorter-term moving averages being more
sensitive to changes in price are said to follow the trend more
closely. The middle or medium average would follow less closely
and the slowest or least sensitive average would lag the most.
Track ‘n Trade Pro 4.0 User Manual
182
Using Indicators
The use of the triple moving average is to buy when all three
averages move to be in an upward trend or to sell when these
averages are in a downtrend. The upward trend appears when the
fastest average is higher than both of the other averages, the medium
is above the slowest, and the longer term moving average is on the
bottom.
This look would be reversed for a strong down trend with slow
average on top, followed by the medium average, and the fastest on
bottom.
Calculation
Parameters:
Period1 (4) - the number of bars, or interval, used to calculate the first
moving average.
Period2 (9) - the number of bars, or interval, used to calculate the
second moving average.
Period3 (18) - the number of bars, or interval, used to calculate the third
moving average.
Formula:
The formula to calculate a moving average is as follows:
Mat = (P1 +... + Pn) / n
Mat - The moving average for the current period,
Pn - The price for the nth interval
n - The length of the moving average.
Compute the average of the past n intervals using the price specified for that
period. Now use real values to compute a five interval moving average. If you
assume the following prices, the calculations are:
MA = (7380 + 7375 + 7385 + 7390 + 7395) / 5
= 36925 / 5
= 7385
Customizing:
To change the settings of this indicator, open the Program Options
screen by clicking the Program Options button located on the main
Toolbar. See the Program Options section for more details on
changing the settings.
Track ‘n Trade Pro 4.0 User Manual
183
Using Indicators
Bollinger Bands
Introduction:
Bollinger Bands are a type of trading envelope. They are lines at
an interval around the moving average. They consist of a moving
average and two different standard deviations represented as a
line above the MA (Moving Average) and a line below the MA.
The line above is the MA plus two standard deviations; the line
below is the MA minus two standard deviations Bollinger Bands
are used to determine overbought and oversold conditions and to
project price targets.
John Bollinger, created Bollinger bands in an effort to gage the
volatility and condition of a market. These bands are used to
determine the trading range and give an indication of when to buy
and when to sell. Bollinger bands are also used to indicate market
volatility, the wider the bands the greater the volatility. Inversely
the narrower the bands the lesser the volatility. By plotting two
lines at an interval around a moving average Bollinger bands give
a good indication of market conditions and price relation. The
moving average which the band is based on works as an indicator
to confirm trade signals.
Interpretation:
The most basic use of the Bollinger Band is to look for a chart top
that occurs above the uppermost band, followed by another top
that is below the upper band. This set of chart tops would create a
sell signal, as neither upward price direction was able to sustain a
rally.
The opposite would occur for a buy signal, there would be a chart
bottom below the lower band followed by a bottom above the
lower band. This is a buy signal because neither sell of was able
to continue, indicated by one below and the other above the
lowest band.
Calculation
Parameters:
Period (20) - the number of bars, or period, used to calculate the
study. John Bollinger, the creator of this study, states that those
periods of less than ten days do not seem to work well for
Bollinger Bands. He says that the optimal period for most
applications is 20 or 21 days.
Standard Deviation (2) - the percent of one standard deviation.
John Bollinger suggests, if you reduce the number of days used to
calculate the bands, you should also reduce the number of
deviations and vise versa. For example, 200 percent of a standard
deviation means two deviations above and two deviations below
Track ‘n Trade Pro 4.0 User Manual
184
Using Indicators
the moving average. If you use a period of 50, you may want to
use 250 percent of a standard deviation. For a period of 10, you
may want to use 150 or 100 percent.
Formula:
1.
Calculate the moving average. The formula is:
Pn - The price you pay for the nth interval
n -The number of periods you select
2.
Subtract the moving average from each of the individual data
points used in the moving average calculation. This gives you a
list of deviations from the average. Square each deviation and
add them all together. Divide this sum by the number of periods
you selected.
3.
Take the square root of d. This gives you the standard deviation.
4.
Compute the bands by using the following formulas:
Pn - The price you pay for the nth interval
n - The number of periods you select
Track ‘n Trade Pro 4.0 User Manual
185
Using Indicators
Pivot Points
Introduction:
Pivot points used to be referred to as "traders numbers" because of
the popularity of these points amongst floor traders. The theory
behind them is that markets tend to have overlap from one period
to another. On most days, the daily high or low is within the
previous days range, as with the previous week’s extremes, and
previous month’s extremes. In this sense, pivot points are a counter
trend indicator.
However, many traders believe that once one point is violated, the
next point will tested, making a violation of these support and
resistance levels a clue in trend following. Though we cannot vouch
for the truth of this statement, the popularity of pivot points amongst
floor traders tends to make these points worth watching.
The popularity of these numbers can be seen on any day when the
exchanges are cleaned-up. The trading floor is literally piled high
with folded pieces of paper that contain pivot points calculated on
them.
Interpretation:
The uses of pivot points or "traders numbers" varies greatly by
trader. The most common interpretation is this: The daily pivot is
used as a guide. If prices are trading above the pivot point, then the
trend is considered up. Traders may wish to take short-term
positions on a violation of the daily pivot to the upside with an initial
upside objective of the 1st resistance level. If prices stall or slow at
the 1st resistance level, then aggressive traders may wish to take
profits. However, if the 1st Resistance level is violated to the
upside, then the market should go on to test the 2nd resistance
level. If prices have violated the 1st resistance level, then this level
should act as support on future pullbacks, as should the pivot point.
The converse is true for support levels. A violation of the daily pivot
to the downside indicates that the daily trend is down, with a
downside target being the 1st support level. If the market stalls,
then traders may wish to take profits on short positions, or initiate
long positions in anticipation of a retracement to the daily pivot.
However, if the 1st support level is violated, the day is said to be a
strongly down trending day, and as such should move down further
to test the second support level. As with the resistance numbers,
the support numbers, once violated, become resistance lines to
trade with in the trend.
Track ‘n Trade Pro 4.0 User Manual
186
Using Indicators
Though originally used as a means for floor trading, longer-term
traders can use pivot points of longer periods. Try plotting the
weekly pivot points on the daily chart and using it for shorter term
positioning on the daily charts. Pivot points can also be calculated
using the monthly pivot points on the daily chart, and used for
longer-term positions.
Example of Pivot Points in Track ‘n Trade:
Calculation:
There are several methods used to determine the Pivot Point, we
have included the three different formulas in Track 'n Trade Pro.
Traditional
Pivot Point = (H + L + C)/3
First Support Line = (2 * Pivot Point) - H
First Resistance Line = (2 * Pivot Point) - L
Second Support Line = Pivot Point - (H - L)
Second Resistance Line = Pivot + (H - L)
Variation 1
This method Changes the formula used to derive the Pivot Point. The
changes include adding the trading day's open and calculating the
Track ‘n Trade Pro 4.0 User Manual
187
Using Indicators
average of the four values. In doing this Variation one takes into
account both opening gaps and overnight trading. The formula is:
Pivot Point = (H* + L* + C* + O**)/4
*=Yesterday
**=Today
Variation 2
This method changes the formula used to derive the Pivot Point as
well. In this method you substitute yesterday's close with today's
open. In doing this Variation 2 also takes into account opening gaps
and overnight trading. The formula is:
Pivot Point = (H* + L* + O**)/3
*=Yesterday
**=Today
Customizing
To change the settings of this indicator, open the Program Options
screen by clicking the Program Options button located on the main
Toolbar. See the Program Options section for more details on
changing the settings of each indicator.
Track ‘n Trade Pro 4.0 User Manual
188
Using Indicators
10x8 MAC
Introduction
It has often been said that prices fall faster than they rise, or simply
put it is easier to ride a bike downhill than uphill. Due to this
perceived quirk in pricing, the legendary market analyst, author,
and seminar speaker Jake Bernstein developed the 10x8 moving
average system.
This system uses two simple moving averages, but they are
calculated in a slightly different manner than those traditionally
used. The first moving average is a moving average of the daily
highs, as opposed to that of the daily settlement like most
traditional moving averages. The second moving average is
calculated using the daily lows.
Though Mr. Bernstein recommends using a 10 period moving
average of the daily highs and an 8 period moving average of the
daily, based on his observation that prices tend to fall about 20%
faster than they rise, any combination would do the trick. Generally
though, accepting market lore that prices fall faster than they rise,
the moving average of the lows should be of shorter term duration
than that of the highs.
Interpretation:
The most basic use of the 10x8 Moving Average is to look for a
breakout above the upper moving average to initiate a buy signal.
When the daily settlement price exceeds the average high of the
last 10 days, this indicator flashes a buy signal indicating that the
trend of the market should be up.
Track ‘n Trade Pro 4.0 User Manual
189
Using Indicators
Example of 10x8 MAC in Track ‘n Trade
Customizing
To change the settings of this indicator, open the Program Options
screen by clicking the Program Options button located on the main
Toolbar. See the Program Options section for more details on
changing the settings of each indicator.
Track ‘n Trade Pro 4.0 User Manual
190
Using Indicators
DON – Donchian Channels
Introduciton:
Donchian Channels were created by Richard Donchian, and expert
in trends. The DON in a simple trend breakout system. The
channel works well in trending markets, but not as well in sideways
moving markets.
Interpretation:
When prices brake above the DON Channel it is a signal to go long.
When prices brake below the DON channel it is a signal to go short.
Example:
Calculation:
Donchian Channel High = MAX (HI, n)
Donchian Channel Low = MAX (LO, n)
Customizing
To change the settings of this indicator, open the Program Options
screen by clicking the Program Options button located on the main
Toolbar. See the Program Options section for more details on
changing the settings of each indicator.
Track ‘n Trade Pro 4.0 User Manual
191
Using Indicators
PSAR – Parabolic Stop and Reversal
Introduction:
The Parabolic SAR, Developed by Welles Wilder, creator of RSI and
DMI, sets trailing price stops for either long or short positions. Also
referred to as the stop-and-reversal indicator (SAR stands for "stop
and reversal"), Parabolic SAR is more popular for setting stops than
for establishing direction or trend. Wilder recommended establishing
the trend first, and then trading with Parabolic SAR in the direction of
the trend. If the trend is up, but the underlying price drops back below
the trailing PSAR indicator, then sell or liquidate your long position. If
the trend is down, and the underlying price rises above the trailing
PSAR indicator then buy or liquidate your short position.
Example of PSAR in Track ‘n Trade:
Calculation:
Parameters:
Initial (20) - the initial acceleration factor, in 1/1000.
Addition (20) - the additional acceleration factor, in 1/1000.
Limit (200) - the acceleration factor limit, in 1/1000.
Track ‘n Trade Pro 4.0 User Manual
192
Using Indicators
Formula:
The computational procedure for the parabolic time/price study is a
logic exercise. The actual computations are quite simple. The logic
to derive those computations is somewhat more complex.
Once the market establishes a direction, the initial SAR becomes
the extreme price for the two intervals. The extreme price is either
the lowest price or highest price for the two trading intervals. The
short position uses the high, and the long position uses the low.
The formula for the PSAR is:
SARt = SARt-1 + ( a * ( EPtrade - SARt-1) )
SARt - The stop and reverse price for the current interval.
SARt-1 is the stop and reverse price for the previous interval.
a -The acceleration factor.
EPtrade - The extreme price for the trade.
The SAR is always the "stop and reverse" price point. This is the
point you liquidate your current position and establish the opposite
position.
The acceleration factor, a, is a weighting factor. In Wilder's work,
the initial value for the acceleration factor is .02 The acceleration
factor increases by a value of .02 each time the extreme price
changes for the trade. You do not increment the acceleration factor
if the extreme price fails to change. The value for a, acceleration
factor, never exceeds .20 in Wilder's methodology.
The extreme price for the trade, EP, is just that. What was the
highest or lowest price achieved during this trade? If you have a
long position, use new highs as the extreme price. When you have
a short position, use the new lows as the extreme price. The
extreme price concept allows for normal market corrections without
immediately triggering the SAR price, but it keeps the SAR price
moving in the direction of the market.
Customizing:
To change the settings of this indicator, open the Program Options
screen by clicking the Program Options button located on the main
Toolbar. See the Program Options section for more details on
changing the settings of each indicator.
Track ‘n Trade Pro 4.0 User Manual
193
Long Term Charts
Track ‘n Trade Pro 4.0 User Manual
194
Long Term Charts
TRACK ‘N TRADE PRO
VERSION 4.0
Accumulating Wealth One Tic at a Time! ®
LONG TERM CHARTS
Track ‘n Trade Pro 4.0 User Manual
195
Long Term Charts
Track ‘n Trade Pro 4.0 User Manual
196
Long Term Charts
LONG TERM CHARTS
Generating and Customizing Long Term
Charts
Introduction:
Track 'n Trade Pro generates weekly and monthly long-term
charts with up to 25 years of historical data. To open a long-term
chart, click on the appropriate button to the right of the chart
window. The day button is selected automatically when you open
a commodity contract.
When you click on either the Week or Month buttons a long term
chart is then created and listed in the Active Charts window.
Comparison of Chart Ticks
Chart
Tick
Represents
Open
High
One Day
Day's open
Day's High
Day's low
Day's close
Weekly
One Week
1st Day's
Open Value
High for the
Week
Low for the
Week
Last Day's
Close Value
Monthly
One Month
1st Day's
Open Value
High for the
Month
Low for the
Month
Last Day's
Close Value
Daily
Track ‘n Trade Pro 4.0 User Manual
Low
Close
197
Long Term Charts
How are Long Term Charts created?
Because commodity contracts overlap over each other, Track 'n
Trade Pro creates Long Term charts using the data from the front
month contracts. This method includes the data for the section of
the contract that is actively being traded, therefore has higher
volume and open interest. This is demonstrated in the Diagram
#1:
Diagram 1: The boxes represent the portion of the contract that Track 'n
Trade Pro uses to create the long term chart.
Long Term Chart Options
Another way to create a long-term chart is to take only the "fat"
portion of each front month contract and paste them together.
With this method, you are both cutting off the beginning of the
chart (where there is typically less volume and open interest) and
the end of the chart where it is "cooling down" (Most traders are
transferring their orders to the next month's contract). See
Diagrams 2 & 3:
Diagram 2: Contracts tend to have more activity during the middle of the
contract and less toward the end when trader's are transferring their orders to
the next month's contract. Track 'n Trade Pro can cut out the middle of each
contract and then paste them together as a long term chart.
Track ‘n Trade Pro 4.0 User Manual
198
Long Term Charts
Diagram 3: Using options available in Track 'n Trade Pro, traders are able to
specify the number of days at the end of a contract that they would like
excluded from a long term chart.
Setting Long Term Chart Options:
See the Program Options Section of the Manual for more
information.
IMPORTANT: After applying the new settings in Program
Options, you will need to delete the long-term chart from the
Active Charts list, if you currently have a long term open, and then
re-generate the chart to apply the new settings to the long-term
chart.
Track ‘n Trade Pro 4.0 User Manual
199
Long Term Charts
Track ‘n Trade Pro 4.0 User Manual
200
Long Term Charts
TRACK ‘N TRADE PRO
VERSION 4.0
Accumulating Wealth One Tic at a Time! ®
USING CALCULATORS
Track ‘n Trade Pro 4.0 User Manual
201
Using Calculators
Track ‘n Trade Pro 4.0 User Manual
202
Using Calculators
USING CALCULATORS
Calculations Made Easy with Track ‘n Trade
Pro Market Calculators
Introduction:
Track ‘n Trade includes two calculators to help simplify the trading
process. With both the Dollar Calculator and the Risk/Reward
Calculator, simply click and drag between two locations on the
chart and instantly know what the $ value between the two points.
Dollar Calculator
Risk vs. Reward Calculator
Dollar Calculator
1.
2.
3.
4.
To Calculate the Effect of a Chart Movement:
Click on the Dollar Calculator Tool.
Left click where you want the calculator to start
Left click where the calculation is completed.
The dollar amount of the chart movement will be calculated from
the beginning and end point values, and will then be displayed in
the center of the line.
Resizing the Dollar Calculator:
Select the drawing by clicking on it. Note: The drawing is
selected when boxes appear on the corners.
2. Click on one of the boxes to drag the select point and release
the mouse button.
1.
Moving the Dollar Calculator:
Select the drawing by clicking on it continue holding down the
mouse button, drag to the new location and release the mouse
button.
Deleting the Dollar Calculator:
Select the drawing by clicking on it and press the delete key on
your keyboard to remove.
Changing the Properties of a Dollar Calculator:
Right-Click on the drawing to view the properties menu.
Properties that can be changed are:
Track ‘n Trade Pro 4.0 User Manual
203
Using Calculators
Foreground: Changes the line color of the Dollar Calculator.
Line Thickness: Changes the thickness of the Dollar Calculator
line. Choose values from 1-6.
Line Style: Changes the line style of the Dollar Calculator line.
Choose from solid, dashed, dotted and more.
Font: Changes the Font, Size, Style, and Color of the values.
Show Text: Deselect/Select to view or hide the values.
Settings: The settings window allows users to adjust the end
points and make their calculations more accurate. Click on OK
to make the change or Cancel to exit this window.
Send to Back: Changes the layer of the tool. This option is used
when more than one tool is in the same area of the chart. Click
on Send to Back: when you need to access a tool under the
Dollar Calculator.
Example of the Dollar Calculator
Risk/Reward Calculator
To draw a Risk/Reward Calculator:
Click on the Risk/Reward Calculator on the Financial Toolbox.
Left click at the beginning of your technical formation, hold down
the mouse button and drag the calculator line to cover the area
between your initial order and your risking stop loss order. (See
example chart on page 204).
3. This will automatically create an equal sized reward area which
can then be stretched to the proper distance you expect the
1.
2.
Track ‘n Trade Pro 4.0 User Manual
204
Using Calculators
4.
5.
graph to retrace. Note the numbers in the tool indicate the dollar
amount of risk and reward.
When the chart is trading within the risk area (negative number),
you are risking your own money. When the chart is trading
within the reward area (positive number), you are risking OPM or
“Other People's Money”.
Use the Risk/Reward Calculator on all trades to calculate where
your order entries and exits should be placed.
Resizing the Risk/Reward Calculator:
Select the calculator by clicking on it. Note: The calculator is
selected when boxes appear on the corners.
2. Click on one of the boxes to drag the select point and release
the mouse button.
1.
Moving the Risk/Reward Calculator:
Select the calculator by clicking on it, continue holding down the
mouse button, drag to the new location and release the mouse
button.
Deleting the Risk/Reward Calculator:
Select the calculator by clicking on it and press the delete key
on your keyboard to remove.
Changing the Properties of a Risk/Reward Calculator:
Right-Click on the drawing to view the properties menu.
Properties that can be changed are:
Foreground: Changes the line color of the Risk/Reward
Calculator.
Line Thickness: Changes the thickness of the Risk/Reward line.
Choose values from 1-6.
Line Style: Changes the line style of the Risk/Reward
Font: Changes the Font, Size, Style, and Color of the values.
Show Text: Deselect\Select to view or hide the values.
Settings: The settings window allows users to adjust the end
points and make their calculations more accurate as well as
specify the number of contracts purchased. Click on OK to
make the change or Cancel to exit this window.
Send to Back: Changes the layer of the tool. This option is used
when more than one tool is in the same area of the chart. Click
on Send to Back when you need to access a tool under the
Risk/Reward Calculator.
Track ‘n Trade Pro 4.0 User Manual
205
Using Calculators
Delete: To delete the Risk/Reward Calculator.
Help: T bring up more on how to use the this Calculator.
Example of the Risk/Reward Calculator:
Track ‘n Trade Pro 4.0 User Manual
206
Using Calculators
TRACK ‘N TRADE PRO
VERSION 4.0
Accumulating Wealth One Tic at a Time! ®
PROGRAM OPTIONS
Track ‘n Trade Pro 4.0 User Manual
207
Program Options
Track ‘n Trade Pro 4.0 User Manual
208
Program Options
PROGRAM OPTIONS
Customizing each chart for your maximum
benefit
Introduction
The Program Options, in Track ‘n Trade Pro, enable you to
customize the chart appearance, tool options, and indicator
settings on either a Global or Per Chart basis. The Program
Options window includes three setting areas:
1.
2.
3.
Global Settings: This section contains settings for Tools
and Long Term settings and some Plug-in Settings (if you
have the Plug-in installed).These settings will only affect new
charts that are opened.
My Default Settings: This section contains settings for the
chart appearance and indicators. Anything changed in this
section will affect new Chartbooks and new charts opened in
a saved Chartbook, it will not affect currently opened charts
or already saved charts.
Current Chart Settings: This section contains all of the
settings also in the My Default Section of Program Options.
Anything changed in this section will affect only the specific
chart that you have open and have selected.
To View the Program Options Screen
There are two ways to pull up the Program Options screen:
1.
2.
Click on the View Menu and select Program Options.
You can also click on the Program Options icon on the main
Toolbar. (shown below)
Track ‘n Trade Pro 4.0 User Manual
209
Program Options
Global Settings
The Global Settings section of the Program Options folder gives
you the ability to change settings that will affect only new
Chartbooks or new charts opened within a saved Chartbook.
Saved Charts will keep the settings on currently drawn tools and
apply the new settings to new tools drawn on the chart.
For example, if you change the Global setting Line Tool Color to
blue, and then open a previously saved chart that contains tools
drawn on it in green, these tools will keep the green color. Any
new tools that you draw on this saved chart will be colored blue
until the setting is changed.
See the Tool section for more information.
Global Settings Window in Track ‘n Trade
To open the Global Settings folder, click on the plus sign to the
left of the folder. The blue Global Settings folder contains your
Long Term Chartings settings and your Tool settings.
Track ‘n Trade Pro 4.0 User Manual
210
Program Options
Track ‘n Trade Pro Themes:
Track ‘n Trade Pro gives you the ability to take all of the settings
in the Program Options settings and save them into a “theme” file.
This gives you the ability to have different themes and apply many
settings quickly to a chart.
Creating a Theme:
To create a Theme, simply select your desired settings within the
three sections of settings: Global, My Defaults, and Per Chart.
Next, go to the Global Settings main page and select the Save
Settings button.
This will open the Save As window. Choose a name for the file
and click on the Save button. The theme will be saved in the
themes folder located in the Track ‘n Trade Pro folder where you
installed it. (Default location for the software is C:\Program
Files\Gecko Software\Track 'n Trade Pro 4.0)
To Apply a Theme:
Open the Program Options window.
Click on the Load settings button located on the Global Settings
page.
3. This will open the themes directory. Click on the theme file that
you would like to apply by clicking on the Open button.
1.
2.
Track ‘n Trade Pro 4.0 User Manual
211
Program Options
Long Term
The Long Term section allows the user to define how long term
charts are calculated. There are two types of Long-Term Charts:
Weekly and Monthly. See the Long-Term Charts Section for
information on how these charts are generated and how to use
them in your trading.
Long Term Charting Options:
1. Build Long Term Charts From:
a. Front Month Data: This option uses data from one
contract month to the next in historical order. For
example: Jan 2001, Mar 2001, May 2001 and so on.
b. Contract Month Data: This option uses data from a
contract month from each successive year. For
example: Jan 2001, Jan 2002, Jan 2003 and so on.
2. How much data should be included? 2-10 years of data can
be displayed at a time on a long term chart. Click on the drop
down menu to specify the number of years to be displayed.
3. To cut off the end of the contract used in your long term chart,
click on the empty check box in front of the text: "Read ahead to
next contract month before the end of the current contract
month." Next, specify the number of days in the box that you
would like to exclude. (Note: This option is best used for
historical data. If you are looking at a long-term chart that
includes current data, remember that if you set this option to
Track ‘n Trade Pro 4.0 User Manual
212
Program Options
4.
5.
exclude 10 days, the last few days will apply this rule and
exclude the last 10 days of data.)
To set the options back to Factory Defaults, click on the
Restore Factory Defaults button on the bottom of the
Properties screen.
Help: Information from the Manual has been integrated into the
software. When clicking on the Help button and you will get
specific documentation based on the location of the button. You
may also press F1 on your keyboard.
IMPORTANT: After applying the new settings in Program
Options, you will need to delete the long-term chart from the
Active Charts list, if you currently have a long term open, and then
re-generate the chart to apply the new settings to the long-term
chart.
Tools
The Tools Default Options section allows you to change
properties of the Charting, Advanced Charting, Notation, and
Accounting Tools.
Clicking the OK button, will apply new default settings and will
apply all changes made in this window to any NEW tools or text
created from this point forward. Any tools, within the active
Chartbook that have already been created will NOT be affected by
this change, unless you press the Apply To All Charts button.
These new default settings will then be stored in Track ‘n Trade
and applied to any new AND past files upon the opening or
reopening of those files.
Simply click on the Apply all Color Changes button if you would
like to apply ONLY the color changes to the tools in all the Active
Charts.
If you would like to change settings for one specific tool, you will
need to right-click on that tool and select the individual tool
settings. See Individual Tool Settings for more information.
Track ‘n Trade Pro 4.0 User Manual
213
Program Options
1. Font Options:
a. Tool Labels: This setting changes the text in any tool
included in Track ‘n Trade Pro. To change font, size,
color, etc click on the Change Button. See the Font
Window that opens on the following page.
Font Window in Track ‘n Trade Program Options
Track ‘n Trade Pro 4.0 User Manual
214
Program Options
Font: Change the Default Font by clicking on a Font
listed below.
Font Style: Change the Default Font Style by clicking
on a new Font Style listed below.
Size: Change the Font Size by clicking on a new size
listed below.
Effects: Add a Strikeout or Underline effect to the
Default Font by checking one or both of these items.
Color: Change the Color of the Default Font by clicking
on the drop down arrow and selecting a new color.
Sample: See a Preview of the newly created settings
for the Default Font.
Script: Change the Font Script by clicking on the drop
down arrow and selecting a new Script.
Text Boxes: This tool applies to the Text Tool only.
Click on the Change button too see the Font Window
and change the Default Text Box settings.
2. Line Options:
Line Color: Change the Default Line Color, used by all
Track ‘n Trade Tools, by clicking on the color box and
choosing a new color from the Windows Color Palette.
Line Style: Change the Default Line Style to Solid,
Dashed, Dotted and more by clicking on the drop down
arrow and choosing a new style.
Line Thickness: Change the Default Line Thickness,
used on all Track ‘n Trade Tools by clicking on the drop
down menu and choosing a new thickness (0-6).
Arc Thickness: Change the Default Arcs
Thickness on the Track ‘n Trade Tools that include
Arcs. (An example is the 1-2-3 Tool). Click on the
drop down menu to select a new thickness (0-6).
3. Background Color: Change the Default Color used
for backgrounds of tools that have background
capabilities. Click on the color box to choose a new
color from the Windows Color Palette.
4.
Default Flag: Change the Default Flag for the Flag Notation
Tool by clicking on the Flag Button. A window will open with
a selection of Flags to choose from. You may also import a
custom flag.
Track ‘n Trade Pro 4.0 User Manual
215
Program Options
5.
Reset Questions: In Track ‘n Trade you will get extra help
in using the software with “questions” that prompt you
throughout your use. These questions are initially shown
when you install the software; however on each question
window there is an option to hide the display questions. If
you have selected this option, but would now like to see the
“questions” again, click on the Reset Questions button.
6.
To set the options back to Factory Defaults, click on the
Restore Defaults button on the bottom of the Properties
screen.
7.
Help: Information from the Manual has been integrated into
the software. When clicking on the Help button and you will
get specific documentation based on the location of the
button. You may also press F1 on your keyboard.
Track ‘n Trade Pro 4.0 User Manual
216
Program Options
My Default Settings
The My Default Settings allows you to set custom settings for chart
appearance and indicator options. These settings will only affect
newly created charts after the selection has been made.
If you wish to apply your chosen settings to all the charts you have
open, click the ‘Apply to all charts’ button that appears on all the
screens in this folder.
To open the My Default Settings folder:
Click on the plus sign to the left of the yellow My Default Settings
folder, and select the section you want to customize.
Track ‘n Trade Pro 4.0 User Manual
217
Program Options
Appearance
This screen allows the user to change tick color options, ruler
paper options, background changes and much more.
1. Grid Lines and Day Line:
a. Light & Dark Grid Lines: Select the check box in front of
the line to display them on the chart. Change the color of
the Grid Line by clicking on the color box and selecting a
new color from the Windows Color Palette. These lines
are based on the scaling selected for the chart. For more
information see Scaling.
b. Day Line: Displays an additional vertical line, based on
the day of the week, on the chart by selecting the check
box. Select a particular day of the week by clicking on the
drop down menu. Change the color by clicking on the
color box and select a color from the Color Palette.
2. Expiration and Notice Dates:
Click on the corresponding check box in front of the item to
display: Options Expiration, Last Trading Date, or First Notice
Date on your Chart. To change the color of the line, click on the
corresponding color box and select a new color from the
Windows Color Palette.
3. Ruler Colors:
a. Ruler Text / Marks: Indicates the color used for the ruler
lines and text.
Track ‘n Trade Pro 4.0 User Manual
218
Program Options
b. Ruler Background: Indicates the color used for the
background of the rulers.
4. Chart Background and Order Colors:
a. To change the background color of your chart window,
click on the color box and select a new color from the
Color Palette.
b. To change the color of your order arrow, click on the
color box and select a new color from the Color Palette.
5. Price Bars:
a. Changes, based the #6 condition, are displayed by tick
color, specify the color for: No Change, Close Lower,
and Close Higher by clicking on the color box and
selecting a color from the Color Palette.
b. Highlight: When holding down the SHIFT key while
using the pointer tool, you will see a vertical line
highlighting the chosen trading day from the chart
window through the Indicator Window. To change the
highlight color, click on the color box and select a color
from the Color Palette.
6. Choose the value used to calculate the price bar change. You
may choose: yesterday’s open, high, low, close or today’s open,
high, or low to compare to today’s close. If you would like to
modify the colors of the ticks based on this change, see step 5a.
7. Proportional Tick Thickness: When selected this
feature increases the thickness of both chart price bars
and indicator lines.
Fill All Candles: When this feature is selected, all of the
candle bodies will be filled.
8. Fill All Candles: When this feature is selected, all of the
candle bodies will be filled.
9. Buy/Sell Arrows: When this feature is selected the
buy/sell signals are enabled. Also you have the option to
see the arrows for the Full Contract or just the Last few
months the number of months is put in the edit box.
10. Print Background Color: When printing you have the
option to print the background
11. Click on Apply to active charts if you would like to see
your selecting settings on all the charts you have open.
Click on Restore Factory Defaults if you would like to
restore original software settings for this window.
12. Help: Information from the Manual has been integrated into the
software. When clicking on the Help button and you will get
specific documentation based on the location of the button. You
may also press F1 on your keyboard.
Track ‘n Trade Pro 4.0 User Manual
219
Program Options
Bollinger Band
1. Bands: The Bollinger Band Indicator is made up of three lines
on the chart. They are: Upper, Middle & Lower.
2. Period: Define the period interval for the Bollinger Band. This
value affects all three lines.
3. Type: The Bollinger Band Indicator can be based on a Simple,
Linearly Weighted or Exponentially Smoothed Average. Click
on the drop down menu to change the type of average.
4. Data: The average can be based on four values: Open, High,
Low or Close. Click on the drop down menu to change the data
option.
5. Style & Color: Bollinger Band lines can be displayed as solid,
dashed, or dotted lines. Click on the drop down menu to specify
the type of line style. Next to the drop down menu is the color
box for the line. Click on the color box to choose a new color
from the Color Palette.
6. Check this box to Display the Bollinger Bands.
7. Click on Apply to active charts if you would like to see
your selecting settings on all the charts you have open.
Click on Restore Factory Defaults if you would like to
restore original software settings.
8. Help: Information from the Manual has been integrated
into the software. When clicking on the Help button and
Track ‘n Trade Pro 4.0 User Manual
220
Program Options
you will get specific documentation based on the location
of the button. You may also press F1 on your keyboard.
MAC
1. Lines: The 10x8 & 3x3 MAC consists of two lines. Each line’s
parameters may be changed independently in the options
screen.
2. Period: The period values of the MAC Indicators are not
editable. If you would like to specify different time periods for an
average, it is recommended that you use a moving average
instead of the MAC Indicators.
3. Type: Choose between Simple, Linearly Weighted, and
Exponentially Smoothed averages for each line. Click on the
drop down menu and select the type desired.
4. Data: To change the data that the line is based on click on the
drop down menu. The options available are: High, Low, Open,
and Close.
5. Style & Color: Average lines can be displayed as solid,
dashed, or dotted lines. Click on the drop down menu to specify
the type of line style. Next to the drop down menu is the color
box for the line. Click on the color box to choose a new color
from the Color Palette.
6. Check these boxes to display the 3x3 and/or the 10x8 MAC
Lines on your charts.
7. Click on Apply to active charts if you would like to see your
selecting settings on all the charts you have open. Click on
Track ‘n Trade Pro 4.0 User Manual
221
Program Options
Restore Factory Defaults if you would like to restore original
software settings.
8. Help: Information from the Manual has been integrated into the
software. When clicking on the Help button and you will get
specific documentation based on the location of the button. You
may also press F1 on your keyboard.
Moving Averages
1. Average1-6: Each Moving average displayed on the chart is
referred to as an Average. You may have up to 6 different
averages displayed at once on the screen.
2. Period: To specify the number of days used in calculating the
moving average simply click on the box, highlight the current
number and type in a new value.
3. Type: Choose from simple, linearly weighted and exponentially
smoothed calculations. Click on the drop down menu to specify
the type.
4. Data: The average can be based on four values: Open, High,
Low or Close. Click on the drop down menu and select the data
value.
5. Style & Color: Average lines can be displayed as solid,
dashed, or dotted lines. Click on the drop down menu to specify
the type of Line Style. Also, change the color of the line by
clicking on the color box for the line ands elect a new color from
the Color Palette.
Track ‘n Trade Pro 4.0 User Manual
222
Program Options
6. Check this box to Display the Moving Average Lines. Only the
lines checked above will show on the chart.
7. Click on Apply to active charts if you would like to see your
selected settings on all the charts you have open. Click on
Restore Factory Defaults if you would like to restore original
software settings.
8. Help: Information from the Manual has been integrated into the
software. When clicking on the Help button and you will get
specific documentation based on the location of the button. You
may also press F1 on your keyboard.
Pivot Points
1.
2.
3.
4.
Pivot Point Lines: Pivot Points are made up of 5 Lines.
You can specify preferences for each line independently.
For information on their value and how they are
calculated, refer to the Indicator Section.
Style & Color: The Pivot Point Indicator lines can be
displayed as a solid, dashed, or dotted. Click on the drop
down menu to specify the type of line style. To change the
line color click on the color box, next to the line, and select
new color from the Color Palette.
Pivot Points are available in Traditional, Variation 1, and
Variation
Show Text: This option displays the pivot point line values
in the chart window. Press F9 to toggle it on and off.
Track ‘n Trade Pro 4.0 User Manual
223
Program Options
5.
6.
7.
This section controls how the pivot points are displayed.
The pivot points include predication and historical lines
available in Daily, Weekly, and Monthly calculations.
Show: If checked this turns on the items selected.
Historical Lines: Check the daily, weekly or monthly box
to select for display. Show Lines: Check the daily, weekly,
or monthly box to select prediction lines for display.
Click on Apply to active charts if you would like to see
your selected settings on all the charts you have open.
Click on Restore Factory Defaults if you would like to
restore original software settings.
Help: Information from the Manual has been integrated
into the software. When clicking on the Help button and
you will get specific documentation based on the location
of the button. You may also press F1 on your keyboard.
PSAR – Wilder’s Parabolic Time/Price
1.
2.
3.
4.
To enter the values for the Initial Acceleration,
Additional Acceleration, and Acceleration Limit;
highlight the current numbers and type in your value.
Style & Color: To change the style click on the dropdown
menu and choose from: squares, dots, lines, or crosses.
Click on the color box to change the color of the indicator.
Check this box to Display the PSAR Indicator.
Click on Apply to active charts if you would like to see
your selected settings on all the charts you have open.
Track ‘n Trade Pro 4.0 User Manual
224
Program Options
5.
Click on Restore Factory Defaults if you would like to
restore original software settings.
Help: Information from the Manual has been integrated
into the software. When clicking on the Help button and
you will get specific documentation based on the location
of the button. You may also press F1 on your keyboard.
Scaling & Price Bars
1.
2.
3.
4.
This section allows you to select your own preferences on
scaling. You can select different scaling on each tick style;
OHLC, HLC, Close, or Candlestick. You can select how many
days are in one inch on your charts, as well as when the dark
grid lines appear.
The Price Bar determines what style of tick is shown on your
charts. This also can be selected by right clicking on your open
chart and selecting OHLC, HLC, Close, or Candlestick. The no
tick option is only available on the screen shown above.
Vertical Scaling: Check this option to automatically adjust to fit
your chart window vertically. Note: If you have the Accounting &
Simulator Plug-in, which includes the play controls, the Auto
Scale Chart feature will re-scale the chart each time you click a
Play button.
Click on Apply to active charts if you would like to see your
selecting settings on all the charts you have open. Click on
Track ‘n Trade Pro 4.0 User Manual
225
Program Options
5.
Restore Factory Defaults if you would like to restore original
software settings.
Help: Information from the Manual has been integrated into the
software. When clicking on the Help button and you will get
specific documentation based on the location of the button. You
may also press F1 on your keyboard.
AD - Williams Accumulation/Distribution
1. Period: To specify the number of days used in calculating
the ADMA Indicator, simply highlight the current number
and type in a new value.
2. Style: The AD Indicator lines can be displayed as a solid or
dotted lines. Click on the drop down menu to specify the
type of line style desired.
3. Color: Click on the color box and a color panel will open
for you to specify the new color.
4. To display the Buy signal the AD line needs to cross above
the ADMA line and to display a Sell signal the AD line
needs to cross below the ADMA line. If the ADMA Line
Style is None then the buy/sell arrows will not be
displayed. The drop-down menu for Show Buy/Sell Arrows
allows you to select either Always Show Arrows or Only
When Indicator is Visible to view the buy/sell signals or
Never Show Arrows to never see the AD arrows.
Track ‘n Trade Pro 4.0 User Manual
226
Program Options
5. To display the indicator in the chart window, click the check
box.
6. Ruler Bar - See the Ruler Bar at the end of this section.
7. Preview Window: This Window allows you to make
changes and preview them before saving them.
8. Click on Apply to active charts if you would like to see
your selecting settings on all the charts you have open.
Click on Restore Factory Defaults if you would like to
restore original software settings.
9. Help: Information from the Manual has been integrated into
the software. When clicking on the Help button and you
will get specific documentation based on the location of the
button. You may also press F1 on your keyboard.
CCI - Commodity Channel Index
1. Period: To specify the number of days used in calculating
CCI, simply click on the box, highlight the current number
and type in a new value.
2. Style & Color: The CCI Line can be displayed as a solid,
dashed, or dotted. Click on the drop down menu to specify
the type of line style. To change the color, click on the
color box, select the new color in the Color Palette.
Track ‘n Trade Pro 4.0 User Manual
227
Program Options
3. The drop-down menu for Show Buy/Sell Arrows allows you
to select either Always Show Arrows or Only When
Indicator is Visible to view the buy/sell signals or Never
Show Arrows to never see the CCI arrows.
4. Upper Threshold[ number ] - The crossing of the CCI line
below this number is a sell signal. Check the check box to
see the line in the indicator window.
Lower Threshold[ number ] - The crossing of the CCI line
above this number is the buy signal. Check the check box
to see the line in the indicator window.
5. To Display the indicator click the check box.
6. Ruler Bar - See the Ruler Bar at the end of this section.
7. Preview Window: This Window allows you to make
changes and preview them before saving them.
8. Click on Apply to active charts if you would like to see
your selecting settings on all the charts you open. Click on
Restore Factory Defaults if you would like to restore
original software settings.
9. Help: Information from the Manual has been integrated
into the software. When clicking on the Help button and
you will get specific documentation based on the location
of the button. You may also press F1 on your keyboard.
Track ‘n Trade Pro 4.0 User Manual
228
Program Options
DON – Donchian Channels
1. Period: To specify the number of days used in calculating
DMI, simply click on the box, highlight the current number
and type in a new value. Be sure to click on Ok to save
your changes.
2. Style & Color: The DMI Lines can be displayed as a solid,
dashed, or dotted. Click on the drop down menu to specify
the type of line style desired. Next to the drop down menu
is a color box, click on this box to change the color of the
line.
3. To display the Donchian Channel click the check box.
4. Click on Apply to active charts if you would like to see
your selecting settings on all the charts you have open.
Click on Restore Factory Defaults if you would like to
restore original software settings.
5. Help: Information from the Manual has been integrated
into the software. When clicking on the Help button and
you will get specific documentation based on the location
of the button. You may also press F1 on your keyboard.
Track ‘n Trade Pro 4.0 User Manual
229
Program Options
DMI/ADX – Directional Movement Index
1. Period: To specify the number of days used in
calculating DMI, simply click on the box, highlight the
current number and type in a new value. Be sure to
click on Ok to save your changes.
2. Style & Color: The DMI Lines can be displayed as a
solid, dashed, or dotted. Click on the drop down menu
to specify the type of line style desired. Next to the
drop down menu is a color box, click on this box to
change the color of the line.
3. Directional Indicator: The two methods available in
displaying the DMI Indicator are Averaged Directional
Index (ADX) and the Directional Index (DX). Click on
the radio button in front of the method to select. For
more information on the different values, refer to the
article above.
4. Use Relative Scale: When choosing this option, the
100% location is changed to the highest point value in
the DMI Indicator.
5. The drop-down menu for Show Buy/Sell Arrows allows
you to select either Always Show Arrows or Only
When Indicator is Visible to view the buy/sell signals or
Never Show Arrows to never see the AD arrows.
Track ‘n Trade Pro 4.0 User Manual
230
Program Options
6. Extreme Point Validation - This filter delays the
buy/sell arrows at least a day by requiring that the
market move higher or lower than the high or low on
the day the DM+/DM- cross over happened. If a new
higher high or lower or low is not obtained before the
next DM+/- cross over the buy sell arrow is
suppressed completely for that previous period. The
filter does not require the use of DX/ADX although it
does stack with the other filters if they are used.
7.
8.
9.
10.
11.
ADX Trend Strength [ number ] - This filter is simple
to understand. The directional index (DX) or averaged
directional index (ADX) line must be above the target
number before a DM+/- cross will give a buy/sell
arrow. The theory is that the DX/ADX lines indicate
trend strength (but not trend direction) and if it is below
20 there is practically no trend. Values above 40
indicate a strong trend. Different articles would use
values between 20 and 40 as targets to look for. The
directional index indicator line must be on for this rule
to be available.
Turning Point Validation - This filter is simply that
your directional index line (DX or ADX) must be above
the point where DM+/- crossed. To me this is like a
variable trend strength filter. The directional index can
indicate any trend strengths as long as the trend
strength is greater than the value of the DM+/crossing point. This indicator also requires that the
directional index indicator line be on.
To display the indicator in the chart window, click the
check box.
Ruler Bar - See the Ruller Bar at the end of this
section
Preview Window: This Window allows you to make
changes and preview them before saving them.
Click on Apply to active charts if you would like to
see your selecting settings on all the charts you have
open. Click on Restore Factory Defaults if you would
like to restore original software settings.
Help: Information from the Manual has been integrated
into the software. When clicking on the Help button
and you will get specific documentation based on the
Track ‘n Trade Pro 4.0 User Manual
231
Program Options
location of the button. You may also press F1 on your
keyboard.
HVOL – Historic Volatility
1.
Period: To specify the number of days used in
calculating Historic Volatility, simply click on the box,
highlight the current number and type in a new value. Be
sure to click on Ok to save your changes.
2.
Style & Color: The Historic Volatility Line can be displayed as a
solid, dashed, or dotted line. Click on the drop down menu to
specify the type of line style desired. Next to the drop down
menu is a color box, click on this box to change the color of the
line.
Use Relative Scale: When choosing this option, the 100%
location is changed to the highest point value in the HVOL
Indicator.
To display the indicator in the chart window, click the check
box.
Ruler Bar – See the Ruler Bar at the end of this section
Preview Window: This Window allows you to make changes
and preview them before saving them.
Click on Apply to active charts if you would like to see your
selecting settings on all the charts you have open. Click on
3.
4.
5.
6.
7.
Track ‘n Trade Pro 4.0 User Manual
232
Program Options
8.
Restore Factory Defaults if you would like to restore original
software settings.
Help: Information from the Manual has been integrated into the
software. When clicking on the Help button and you will get
specific documentation based on the location of the button. You
may also press F1 on your keyboard.
MACD – Moving Average Convergence/Divergence
1. The MACD Indicator can be displayed differently,
choose from Difference as Histogram or Difference as
Line in the drop down menu.
2. Period: To specify the number of days used in
calculating the MACD simply click on the box, highlight
the current number and type in a new value.
3. Style & Color: MACD Trigger line can be displayed as
solid or dotted line. Click on the drop down menu to
specify the type of line style. Click on the color box and
a color panel will open for you to specify the new color.
4. The MACD is calculated using two exponential moving
averages. To change the periods used in the formula,
highlight the number value and type in the new value
desired.
5. There are three components that create the MACD
Indicator; Bullish, Bearish and Trigger lines. More
Track ‘n Trade Pro 4.0 User Manual
233
Program Options
6.
7.
8.
9.
10.
11.
12.
information on how these components are calculated
in the Indicators section under MACD.
MACD Type:
Choose from two types of MACD Indicators.
a. Standard Calculation
b. Extra Smoothed: This Calculation is a
proprietary formula developed by Lan H.
Turner, president and founder of Gecko
Software, Inc., and Gecko Software's
Programming staff. This method increases
the movement in the MACD Indicator and has
shown to be more accurate (in Gecko
Software's market testing) than the standard
calculation. Click the Extra Smoothed option
to test it's accuracy for yourself! Its
relationship to the MACD is similar to the
relationship between the Fast and Slow
Stochastics - so think of this indicator as the
"Fast MACD".
To display the Buy signal the MACD line needs to
cross above the Trigger line and the cross needs to
happen above zero. To display a Sell signal the MACD
line needs to cross below the Trigger line and the
cross needs to happen below zero. If the Trigger Line
Style is None then the MACD arrows are determined
with the crossing of the MACD line over zero. To buy
the MACD line will go above zero and to sell it will drop
below zero. The drop-down menu for Show Buy/Sell
Arrows allows you to select either Always Show
Arrows or Only When Indicator is Visible to view the
buy/sell signals or Never Show Arrows to never see
the MACD arrows.
To Display the indicator in the chart window, click the
check box.
Ruler Bar: See the Ruler Bar at the end of this section
Preview Window: This Window allows you to make
changes and preview them before saving them.
Click on Apply to active charts if you would like to
see your selecting settings on all the charts you have
open. Click on Restore Factory Defaults if you would
like to restore original software settings.
Help: Information from the Manual has been
integrated into the software. When clicking on the
Track ‘n Trade Pro 4.0 User Manual
234
Program Options
Help button and you will get specific documentation
based on the location of the button. You may also
press F1 on your keyboard.
MOM – Momentum
1. Period: To specify the number of days used in calculating
the Momentum or MOMMA Indicators simply click on the
box, highlight the current number and type in a new value.
Be sure to click on Ok to save your changes.
2. Style & Color: The Momentum Indicator Line (when
displayed as a Line Graph) can be displayed as a solid,
dashed, or dotted line. Click on the drop down menu to
specify the type of line style desired. Next to the drop
down menu is a color box, click on this box to change the
color of the line.
3. Show Momentum As:
a.
Histogram Graph: Momentum represented as a
Time Progression Bar Chart.
b.
Line Graph: Momentum represented as Lines.
4. MOMMA - Momentum Moving Average. This is a moving
average of the Momentum line.
5. To display the Buy signal the MOM line needs to cross
above the MOMMA line and to display a Sell signal the
Track ‘n Trade Pro 4.0 User Manual
235
Program Options
MOM line needs to cross below the MOMMA line. If the
MOMMA Line Style is None then the buy/sell arrows will
not be displayed. The drop-down menu for Show Buy/Sell
Arrows allows you to select either Always Show Arrows or
Only When Indicator is Visible to view the buy/sell signals
or Never Show Arrows to never see the MOM arrows.
6. To Display the indicator in the chart window, click the
check box. Once the box is checked you may also select
the box to display the MOMMA Indicator.
7. Ruler Bar - See the Ruler Bar at the end of this section
8. Preview Window: This Window allows you to make
changes and preview them before saving them.
9. Click on Apply to active charts if you would like to see
your selecting settings on all the charts you open. Click on
Restore Factory Defaults if you would like to restore
original software settings.
10. Help: Information from the Manual has been integrated
into the software. When clicking on the Help button and
you will get specific documentation based on the location
of the button. You may also press F1 on your keyboard.
%R – Williams Percent R
Track ‘n Trade Pro 4.0 User Manual
236
Program Options
1. Period: To specify the number of days used in
calculating the %R simply click on the box, highlight
the current number and type in a new value.
2. Style & Color: The %R line can be displayed as a
solid, dashed, or dotted line. Click on the drop down
menu to specify the type of line style desired. Click
on the color box and color panel will open for you to
specify the new color.
3. There are a couple different calculations used for the
%R Indicators click on the preferred calculation
under the “Calculation used in %R” section. For
more information on the different calculations see
the Indicator Section under Williams’ % R.
4. The drop-down menu for Show Buy/Sell Arrows
allows you to select either Always Show Arrows or
Only When Indicator is Visible to view the buy/sell
signals or Never Show Arrows to never see the %R
arrows.
5. Upper Threshold[ number ] - The crossing of the
%R line below this number is a sell signal. Check the
check box to see the line in the indicator window.
Lower Threshold[ number ] - The crossing of the
%R line above this number is the buy signal. Check
the check box to see the line in the indicator window.
6. To Display the indicator in the chart window, click
the check box.
7. Ruler Bar – See the Ruler Bar at the end of this
section
8. Preview Window: This Window allows you to make
changes and preview them before saving them.
9. Click on Apply to active charts if you would like to
see your selecting settings on all the charts you
have open. Click on Restore Factory Defaults if
you would like to restore original software settings.
10. Help: Information from the Manual has been
integrated into the software. When clicking on the
Help button and you will get specific documentation
based on the location of the button. You may also
press F1 on your keyboard.
Track ‘n Trade Pro 4.0 User Manual
237
Program Options
RSI – Relative Strength Index
1. Period: To specify the number of days used in
calculating the RSI simply click on the box, highlight the
current number and type in a new value.
2. Style & Color: The RSI line can be displayed as a solid,
dashed, or dotted line. Click on the drop down menu to
specify the type of line style desired. Next to the drop
down menu is a color box, click on this box to change
the color of the line.
3. Average Calculation: Choose between Exponential,
Simple, and Wilder’s smoothing calculations.
4. The drop-down menu for Show Buy/Sell Arrows allows
you to select either Always Show Arrows or Only When
Indicator is Visible to view the buy/sell signals or Never
Show Arrows to never see the RSI arrows.
5. Upper Threshold[ number ] - The crossing of the RSI
line below this number is a sell signal. Check the check
box to see the line in the indicator window.
Lower Threshold[ number ] - The crossing of the RSI
line above this number is the buy signal. Check the
check box to see the line in the indicator window.
Track ‘n Trade Pro 4.0 User Manual
238
Program Options
6. To Display the indicator in the chart window, click the
check box.
7. Ruler Bar - See the Ruler Bar at the end of this section
8. Preview Window: This Window allows you to make
changes and preview them before saving them.
9. Click on Apply to active charts if you would like to see
your selecting settings on all the charts you have open.
Click on Restore Factory Defaults if you would like to
restore original software settings.
10. Help: Information from the Manual has been integrated
into the software. When clicking on the Help button and
you will get specific documentation based on the location
of the button. You may also press F1 on your keyboard.
FSTO – Fast Stochastics
1. Period: To specify the number of days used in
calculating the Fast Stochastics Indicator simply
click on the box, highlight the current number and
type in a new value.
2. Smoothing: To specify the number of days used in
calculating Smoothing, simply click on the box,
highlight the current number, and type in a new
value.
Track ‘n Trade Pro 4.0 User Manual
239
Program Options
3. Style & Color: The Fast Stochastics Indicator lines
can be displayed as a solid, dashed, or dotted. Click
on the drop down menu to specify the type of line
style desired. To change the line color, click on the
color box.
4. Stochastic Formula Using: Chose from the dropdown menu the type of formula you prefer to be
used. The choices are the Exponential Moving
Average and the Simple Moving Average. For more
information on the formulas used, see the
Stochastics information under the Using Indicators
Section.
5. The drop-down menu for Show Buy/Sell Arrows
allows you to select either Always Show Arrows or
Only When Indicator is Visible to view the buy/sell
signals or Never Show Arrows to never see the
FSTO arrows.
6. Upper Threshold[ number ] - The crossing of the
%D line above the %K line is the sell signal and only
confirmed if this crossing happened above the upper
threshold number. Check the check box to see the
line in the indicator window.
Lower Threshold[ number ] - The crossing of the
%D line below the %K line is the buy signal and only
confirmed if this crossing happened below the lower
threshold number. Check the check box to see the
line in the indicator window.
7. To Display the Fast Stochastics indicators check
the box by the corresponding indicator.
8. Ruler Bar: See the Ruler Bar at the end of this
section
9. Preview Window: This Window allows you to make
changes and preview them before saving them.
10. Click on Apply to active charts if you would like to
see your selecting settings on all the charts you
have open. Click on Restore Factory Defaults if
you would like to restore original software settings.
11. Help: Information from the Manual has been
integrated into the software. When clicking on the
Help button and you will get specific documentation
based on the location of the button. You may also
press F1 on your keyboard.
Track ‘n Trade Pro 4.0 User Manual
240
Program Options
SSTO – Slow Stochastics
1. Period: To specify the number of days used in
calculating the Slow Stochastics Indicator simply
click on the box, highlight the current number and
type in a new value.
2. Smoothing: To specify the number of days used in
calculating Smoothing, simply click on the box,
highlight the current number, and type in a new
value.
3. Style & Color: The Slow Stochastics Indicator lines
can be displayed as a solid, dashed, or dotted. Click
on the drop down menu to specify the type of line
style desired. To change the line color, click on the
color box.
4. Stochastic Formula Using: Chose from the dropdown menu the type of formula you prefer to be
used. The choices are the Exponential Moving
Average and the Simple Moving Average. For more
information on the formulas used, see the Slow
Stochastics information under the Using Indicators
Section.
5. The drop-down menu for Show Buy/Sell Arrows
allows you to select either Always Show Arrows or
Track ‘n Trade Pro 4.0 User Manual
241
Program Options
6.
7.
8.
9.
10.
11.
Only When Indicator is Visible to view the buy/sell
signals or Never Show Arrows to never see the
SSTO arrows.
Upper Threshold[ number ] - The crossing of the
%D line above the %K line is the sell signal and only
confirmed if this crossing happened above the upper
threshold number. Check the check box to see the
line in the indicator window.
Lower Threshold[ number ] - The crossing of the
%D line below the %K line is the buy signal and only
confirmed if this crossing happened below the lower
threshold number. Check the check box to see the
line in the indicator window.
To Display the Slow Stochastics indicators check
the box by the corresponding indicator.
Ruler Bar – See the Ruler Bar at the end of this
section
Preview Window: This Window allows you to make
changes and preview them before saving them.
Click on Apply to active charts if you would like to
see your selecting settings on all the charts you
have open. Click on Restore Factory Defaults if
you would like to restore original software settings.
Help: Information from the Manual has been
integrated into the software. When clicking on the
Help button and you will get specific documentation
based on the location of the button. You may also
press F1 on your keyboard.
Track ‘n Trade Pro 4.0 User Manual
242
Program Options
VOL/OI – Volume and Open Interest
1.
2.
3.
4.
5.
6.
7.
8.
Style & Color: The Volume\Open Interest line can be
displayed as a solid, dashed, or dotted. Click on the
drop down menu to specify the type of line style desired.
Next to the drop down menu is the color box, click on
this box to open a panel and change the line color.
Volume Bars: If you would like to Display the Volume
Indicator in two colors check this box.
Scale: Choose how you would like to view the VOL
Indicator by selecting the radial button you prefer.
a. Same Scale: The VOL Indicator will not be
proportional to the size of the indicator window
b. Individual Scale: The VOL Indicator will be
displayed with its highest value equal to 100% of the
window.
Status Bar: Determines if the Volume or Open Interest
is displayed in the status bar. (The opposite will be
shown in the current price bar.)
To Display the indicator in the chart window, click the
check box.
Ruler Bar – See the Ruler Bar at the end of this section
Preview Window: This Window allows you to make
changes and preview them before saving them.
Click on Apply to active charts if you would like to see
your selecting settings on all the charts you open. Click
Track ‘n Trade Pro 4.0 User Manual
243
Program Options
9.
on Restore Factory Defaults if you would like to
restore original software settings.
Help: Information from the Manual has been integrated
into the software. When clicking on the Help button and
you will get specific documentation based on the
location of the button. You may also press F1 on your
keyboard.
Ruler Bar
The Ruler Bar inside the Program Options windows for the indicators
that are displayed in the Indicator window, allows user's to create
highlighted regions or horizontal lines within the indicator window.
To create a highlighted region: Click at either end of the Ruler bar
and drag either up or down to the end point of the region.
To place a line: Click in side the ruler bar and drag the line to the
desired point.
To change the color of the highlighted region: You must rightclick on either the bottom edge (if it is on the top of the indicator
window) or the top edge (if it is on the bottom of the indicator
window). Next choose the “Select Color” option from the right-click
menu. The Color Palette will open, choose a color and click on OK.
Track ‘n Trade Pro 4.0 User Manual
244
Program Options
You may also Clear the item that you right-clicked on or Clear All
items in the Indicator window by selecting these items from the rightclick menu.
Current Chart Settings
This folder only appears in the Program Options screen when a
Chart is open.
All of the options that appear in this folder are identical to those
found in the My Default Settings folder. The difference between the
two folders is when you set your options in the Current Chart
Settings folder; the options you change will only affect your
currently opened chart.
Track ‘n Trade Pro 4.0 User Manual
245
Accounting & Simulator Plug-In
Track ‘n Trade Pro 4.0 User Manual
246
Accounting & Simulator Plug-In
TRACK ‘N TRADE PRO
VERSION 4.0
Accumulating Wealth One Tic at a Time! ®
ACCOUNTING &
SIMULATOR PLUG-IN
Track ‘n Trade Pro 4.0 User Manual
247
Accounting & Simulator Plug-In
Track ‘n Trade Pro 4.0 User Manual
248
Accounting & Simulator Plug-In
ACCOUNTING &
SIMULATOR PLUG-IN
Track your Account Profits/Losses
with Ease
Introduction:
The Accounting & Simulator Plug-In enables you to place orders,
deposits, and withdrawals using the historical and/or current data.
Traders will find this Plug-In very helpful in getting to know the
markets and testing different trading strategies. This Plug-in also
allows you to play charts forward and backward using VCR style
buttons, which is called simulation.
Requirements:
In order to place futures orders or simulate trading using Track ‘n
Trade Pro, you will need to purchase the Accounting and
Simulator Plug-In. Call us at 1-800-862-7193 to reach the sales
department and order the plug-in today!
Placing a Futures Order
Once you have opened a chart using the Commodity Tab, you are
ready to place an order. There are two ways in which an order
can be placed in Track 'n Trade Pro:
1.
2.
Order Placement Tool.
Order button in My Account Window.
This section will step you through placing orders both ways.
Order Placement Tool
Track ‘n Trade Pro 4.0 User Manual
249
Accounting & Simulator Plug-In
To Place an Order using the Accounting Toolbar:
Click on the Order Placement Tool on the Toolbox.
1.
2.
Click and drag your order on the chart until you find your order
point, then release the mouse button. The following window will
appear.
3.
Fill out the information in the order placement window.
a. In this window, you can specify the brokerage fee
(per side), date order placed, buy or sell, quantity
of contracts, symbol of contact, order type and
change the price on the order. Also, Help options
are available to give instructions on the different
types of orders.
b. When you place an order using the Accounting
Toolbar the screen above will be pre filled with
default settings. You will not be able to change
the date or the symbol.
4. Click on OK to place the order and Cancel to dismiss order
screen.
To Place an order using the Accounting Tab:
1. Click on the Order button in My Account Window:
Track ‘n Trade Pro 4.0 User Manual
250
Accounting & Simulator Plug-In
2. Release the mouse button and the order placement dialogue
box will open:
3. Fill out the information in the order placement window.
a. In this window, you can specify the brokerage fee (per
side), date order placed, buy or sell, quantity of contracts,
symbol of contact, order type and change the price on
the order.
b. When you place an order using the Accounting Tab the
screen above will not be pre filled and you can change
the date and symbol.
5. Click on OK to place the order and Cancel to dismiss order
screen.
Track ‘n Trade Pro 4.0 User Manual
251
Accounting & Simulator Plug-In
To Edit an Unfilled Order:
To edit an order on a chart, right click on the order and select
Settings to view the order placement window.
2. To edit an order in My Accounts Window, right click on the order
and select Settings to view the order placement window.
1.
A Filled Order:
When you order is filled, the triangle will fill in red on the chart
(see chart below). In My Account Window, the icon will fill green
and an F will appear after the icon. See My Account Window for
more details.
Example of orders displayed on the Chart:
Track ‘n Trade Pro 4.0 User Manual
252
Accounting & Simulator Plug-In
My Account
From the My Account Window, user's can place orders, make
deposits and withdrawals. This window also has overall totals for
the trading account and for the current contract that you have
open in the Chart Window.
Accounting Date: Date that the current chart is played to.
Open Order P/L: Profit/Loss on trades that are open.
Closed Order P/L: Profit /Loss on completed trades.
Order Commissions: Total commissions paid.
Account Balance: All closed Profit /Loss, Commissions,
Withdrawals, and Deposits
Margins: Requirements in placing & maintaining an order.
Current Position: Market position (not in market, long, or short)
Color Codes:
Green Filled
Yellow Placed
Red
Placed, but in the future.
Faded Order exists, but was deleted from the chart.
Gray
The chart that this order was placed on was
deleted from the Chartbook.
Letter Codes:
W – Withdrawal D – Deposit B – Buy S – Sell
Orders are also noted on the commodity tab. The following symbols
represent the different orders placed.
Track ‘n Trade Pro 4.0 User Manual
253
Accounting & Simulator Plug-In
Each order is listed on the My Account tab by Date, Commodity,
Details, and Placed On.
To modify an Order:
Right-click the entry and select Settings from the menu.
To Cancel or Delete an Order:
Right-click on the order listed in My Account and click on Delete
from the menu.
Note: If you delete an order from a chart in the Chart Window,
this simply hides the order; orders need to be deleted in the My
Account window. Also, if you delete a chart in the Commodities
Window, any orders placed on that chart will not be deleted from
your book.
To Hide/Show an order on a Chart:
Right -click on the order listed in My Account and select
Hide/Show from the menu.
Note: If you would like to hide/show all orders use the Hide
All/Show All from the menu.
Track ‘n Trade Pro 4.0 User Manual
254
Accounting & Simulator Plug-In
Deposits and Withdrawals
Track 'n Trade Pro's Accounting systems allows entering deposits
and making a withdrawals in your trading account as well as
placing orders.
To Place a Deposit:
Click on the Deposit button in My Account Window. This will
bring up the Deposit window. See below
2. Next select the day of the deposit and the amount.
3. Click OK to enter deposit.
4. Click Cancel to dismiss Deposit Window.
1.
To Make a Withdrawal:
Click on the Withdrawal button in My Account Window. This will
bring up the Withdrawal window. (see below)
2. Next select the day of the withdrawal and the amount.
3. Click OK to enter withdrawal.
4. Click Cancel to dismiss Withdrawal Window.
1.
Track ‘n Trade Pro 4.0 User Manual
255
Accounting & Simulator Plug-In
Deleting Deposits/Withdrawals:
Right-click on the deposit or withdrawal and select Delete from
the menu to remove.
Editing a Deposit/Withdrawal:
Right-click on the deposit or withdrawal and select Settings, you
can change the date, amount or order type.
Trade Log
The Accounting and Simulator Plug-In also includes a trade log that
tracks the changes that you make to orders in a Chartbook. This
trade log will list new orders placed, orders cancelled as well as any
order that you have moved.
To generate the trade log, click on the Trade Log button on the
Accounting Tab. Next, select the date range for the trade log from
the drop down menus. This will give you the changes in the orders
placed within that date range. You also can filter the trade log by
All Charts or by one of the contracts being traded. You can print
and/or save this trade log by clicking on the corresponding button in
the upper left corner.
Track ‘n Trade Pro 4.0 User Manual
256
Accounting & Simulator Plug-In
Simulation
The ability to play charts forward and backward, using the Play
Controls, gives you the ability to go back in time and simulate the
trading experience using historical data.
Icon
Action
Lock Charts to Date. This option will “lock” all the
charts to the date displayed on the current chart .
Red – Play to End: Never. This option will open
saved charts at the last date viewed before they
were saved and new charts with no data
displayed.
Yellow – Play to End: New Charts. This option
will leave the data in saved charts at the date
that they were last displayed before saved and
play any new charts to end of the data available
for that contract. This setting is the factory default
setting.
Play to End: All Charts. This option will display all
available data on both saved and new chart that
are selected.
Play Buttons:
Icon
Action
Go to First Day in Chart
Back One Month
Back One Day
Reverse Fast
Play Backward (one day at a time)
Stop
Play Forward (one day at a time)
Track ‘n Trade Pro 4.0 User Manual
257
Accounting & Simulator Plug-In
Fast Forward
Forward One day
Forward One Month
Go to the Last Day in the Contract
Chart Option Buttons
Icon
Action
Center Chart with in Chart Window
Daily Chart
Weekly Long-Term Chart
Monthly Long-Term Chart
Smooth Scroll:
The Smooth Scroll option changes the way that the chart “plays”
when coming to the right edge of the chart window. The default is
for this feature to be selected. This option is located on the
Appearance tab in the Program Options.
Track ‘n Trade Pro 4.0 User Manual
258
Accounting & Simulator Plug-In
Smooth Scroll Selected: As the data nears the right edge of the
Chart Window, the chart will shift to the left one price bar
displaying the new price bar. This continues in a smooth motion
from the right to left.
Smooth Scroll Not Selected: As the data nears the right edge of
the Chart Window, the chart will shift to the left so that the last
price bar is centered and then continues playing data until
approaching the right edge again, causing the process to recur.
Track ‘n Trade Pro 4.0 User Manual
259
Accounting & Simulator Plug-In
Track ‘n Trade Pro 4.0 User Manual
260
Accounting & Simulator Plug-In
TRACK ‘N TRADE PRO
VERSION 4.0
Accumulating Wealth One Tic at a Time! ®
OPTIONS PLUG-IN
Track ‘n Trade Pro 4.0 User Manual
261
Options Plug-In
Track ‘n Trade Pro 4.0 User Manual
262
Options Plug-In
OPTIONS PLUG-IN
Implementing Options Strategies in Your
Trading
Introduction:
The Track ‘n Trade Pro Options Plug-in gives you the ability to
place put/call orders on the futures chart, calculate profit/loss on
an option or on an option strategy, calculate the “Greeks”, plus
two indicators that display the option as under or over valued.
Options Requirements:
In order to place options orders or use any of the options tools,
you will need to also own the Accounting & Simulator Plug-in.
See the Accounting & Simulator Plug-in Chapter for more
information.
Call us at 1-800-862-7193 to reach the sales department and
order the plug-in today!
Placing an Options Put/Call Order:
Option orders can be placed by selecting the Options Put or
Options Call order tools in the Accounting Toolbar or in the OS
Calculator.
Call Order
1.
2.
3.
Put Order
Select either the Call or Put Accounting Tool.
Click onto the futures chart and hold down the mouse button.
When you drag the order tool along the futures chart, you will
notice that the cursor skips from striker price to strike price.
When you have reached the desired strike price release the
mouse and the Options Order Window will open.
Track ‘n Trade Pro 4.0 User Manual
263
Options Plug-In
The Options Orders window allows you to specify:
1. Commodity: This is the commodity Symbol for the chart. (Value
pre-filled when placing on chart)
2. Date: This is the date of the futures chart that the option is
placed on (Value pre-filled when placing on chart)
3. BUY or SELL: Click on the dropdown menu to change.
4. Quantity: Default 1, Highlight and change to increase the
number of Options to purchase.
5. Strike Price: Value of the Strike Price (Value pre-filled when
placing on chart)
6. Brokerage Fee: This value is based on “per side fee” highlight
and change value. Default is $0.00.
7. CALL or PUT: Choose the order type from the dropdown menu.
(Value pre-filled with type of option order tool chosen)
8. Premium: Point value for the strike price.
9. Value: The Dollar amount of the Premium
10. Contingency Order: If this box is check then the option order is
executed based on a specific Futures price.
11. On Screen Text: This section controls the text that is displayed
on the chart window next to the order. Click on OK to place the
order or Cancel to exit.
The second way of entering Options orders is through the OS
Calculator. Click on Place orders when you complete your options
strategy in the OS Calculator. See the OS Calculator section for
more information.
Track ‘n Trade Pro 4.0 User Manual
264
Options Plug-In
Changing Properties of an Options Order
To change the properties of an order, right click on the diamond
shape representing an options order on the chart window.
Font: Changes the Font, Size, Style, and Color of the 1-5 and
ABC points.
Show Text: Select to view or hide the 1-5 and ABC points.
Settings: Select to view the Options Order window.
Send to Back: Changes the layer of the tool. This option is used
when more than one tool is in the same area of the chart. Click
on Send to Back when you need to access a tool under the Elliot
Wave Drawing.
Exercise: Select on a Put or Call Buy order to “exercise the
option”. This will place a futures order for the underlying
contract.
Hide: Select/Unselect this option to hide or view the order on the
chart window. Once you have hidden the order you can rightclick on the order listed in the My Account Tab and toggle the
Hide option to show the order on the chart again.
Track ‘n Trade Pro 4.0 User Manual
265
Options Plug-In
Options Accounting
When you purchase the Options Plug-in you add on an Options
section to the “My Account” tab as well. Plus the Options orders that
are placed are listed in the My Account window.
Track ‘n Trade Pro 4.0 User Manual
266
Options Plug-In
Options Tab:
The Options Tab is located in the Control Panel after the Data Tab.
It looks like a green up and purple down arrow. Once you click on
this tab, it will expand and display “Options”. See the screenshot
below for further clarification:
Viewing Options Data:
When you first click on the Options Data Tab it defaults to the “Date
View” which contains the options data available.
Instructions:
1. Open the corresponding futures chart in the Commodity Tab
for the options pricing that you are interested in viewing.
2. After opening the futures chart, you will notice that the
Options Tab is now populated with values, included in this
tab:
a. Strike: The price at which the futures contract underlying
an option is to be bought or sold upon exercise.
b. Type: Type of options order – Put or Call.
c. Premium: Value (in points) to purchase the Option.
d. $Value: Dollar amount for the Premium value.
e. Change: The difference between yesterday and today’s
strike.
f. Diff: Dollar amount for the Change.
g. IVOL: Implied Volatility of the underlying futures
contract.
h. Delta: Measures how much the options price changes
when the underlying futures contract changes by one
point.
Track ‘n Trade Pro 4.0 User Manual
267
Options Plug-In
i.
j.
k.
l.
Gamma: Measures how much the delta changes when
the underlying futures contract changes by one point.
Theta: Measures time decay of an option.
Vega: Measures how a change in volatility affects the
price of an option when all other factors remain the
same.
Rho: Measures how a change in a short-tem risk free
interest rate affects the price of an Option.
*If you DO NOT have a contract open, the only item available in
Options Tab is the Interest Rate History.
Viewing the Strike Price History:
The Options Tab defaults to the “Date View”, which shows a list of
all strike prices available for that day.
To see the history for a particular strike price:
1. Click on the Strike button and a dropdown box will appear
below the buttons.
2. Click on the dropdown box to choose the specific Put/Call
Strike price.
3. Once this value is selected, the history for that price is
generated.
Track ‘n Trade Pro 4.0 User Manual
268
Options Plug-In
Interest Rate History:
The Options Tab defaults to the Date View, which shows a list of all
strike prices available for that day. To view the Interest Rates
history, click on the Rate button to the right of the Strike button.
The historical interest rate data consists of the monthly average
interest rate of the three month Treasury Bill secondary market
rates. Interest rates are used by the Black Scholes (More
information is available in the Black & Scholes description at the
end of this section.) options formulas to determine the theoretical
options price.
Note: Because most futures contracts expire in under a year, we
have not noticed the interest rate to make a large difference on the
dollar value of an options price.
Adding an Interest Rate:
Interest rates are updated by Gecko Software, Inc. on a regular
basis however, if you would like to add a new interest rate follow
these instructions:
1. Click on the Add Interest Rate button and the “Add Interest
Rate” Window will open.
2. Chose the date for the effective date dropdown menu, then
type the new interest rate in the input box.
3. Click on Ok to save or Cancel to exit from this window.
Track ‘n Trade Pro 4.0 User Manual
269
Options Plug-In
Deleting an Existing Interest Rate:
1. Click on and select the interest rate that you would like to
delete.
2. Click on the Delete Interest Rate button.
3. A window will open asking you to verify that you would like to
delete this interest rate. Click on YES to continue and NO to
cancel.
OS Calculator
The OS Calculator Determines Profit/Loss on an Option or
Option Strategy:
1. Click on the CALC button to open the OS Calculator.
2. Click on the Add New button to add an option order to the
calculator. This will open the Option Order window.
Track ‘n Trade Pro 4.0 User Manual
270
Options Plug-In
3. Specify the details of the options order and then click on OK
to add the order to the calculator. For more information on
this window see “Placing an Options Put/Call Order”.
4. The options order details have now been added to your option
strategy list on the left side of the OS Calculator and the
Profitability Graph of the Option Expiration is available on the
right side. See the screenshot on the next page.
To modify orders click on to select the order and then click on the
Modify Selected button.
To delete orders from the calculator, click on the order and then
click on the Delete Selected button.
To place the orders from the calculator on the underlying
futures chart, click on the Place Orders Button or click Cancel to
exit the Options Strategy Calculator.
Track ‘n Trade Pro 4.0 User Manual
271
Options Plug-In
The Profitability of Option Strategy at Expiration:
The OS Calculator enables you to enter an Option Strategy to see
the potential profit/loss of that strategy/order. See diagram below
with the details of the OS Calculator.
OSV & STRK Options Indicators
Determining if your Option is Over or Under Valued?
The Options Plug-in contains two indicators used to determine if an
option is over or under valued. The indicators available are Options
Strike Value and Strike Price.
Selecting the OSV or STRK Indicator: To view the Options
Indicators you may choose to display them from in three separate
locations:
1. The Indicator Button Bar: To select the OSV or STRK
Indicators, click on the corresponding button on the Indicator
bar. You may also change the put/call strike that the indicator
is based on from the Indicator Bar. See screenshot below:
Track ‘n Trade Pro 4.0 User Manual
272
Options Plug-In
2. The Right-Click Indicator Window Menu: Simply right-click
inside the Indicator Window to view the menu. Highlight and
then left-click to select the indicator. You will notice that the
selected indicator is shown with a check mark below:
3. OSV/STKE Section under the My Defaults or My Chart
Settings in Program Options.
Track ‘n Trade Pro 4.0 User Manual
273
Options Plug-In
1.
2.
3.
4.
5.
6.
7.
8.
Strike Price Indicator: The lines that make up the OSV
indicator are the Black and Scholes Theoretical and the
Reported Market Value
Style and Color: To change the line style, click on the drop
down menu and choose from solid, dashed, or dotted lines. To
change the color of the line, click on the corresponding color box
and choose a new color from the Color Palette.
Options Strike Value: This indicator is a histogram style chart
measuring Under and Over Valued Options.
To Display the Strike Price Indicator or the Options Strike
Value, select the check box in front of the indicator.
Ruler Bar – See page 247 for full instructions
Preview Window: This Window allows you to make changes
and preview them before saving them.
To apply the changes you made to all open chart (listed in your
Active Charts list) click on the Apply to active charts button.
To restore the software defaults to the Options Indicators, click
on the Restore Factory Defaults button.
Help: Information from the Manual has been integrated into the
software. When clicking on the Help button, you will get specific
documentation based on the location of the button.
The Option Strike Price Indicator (OSV)
This indicator displays the theoretical option values vs. the actual
option price value for a specific put/call strike price. By looking at
these two lines you are able to determine if the option price is under
or over priced. Take a look at the example below:
Example of the Options Strike Price in Track ‘n Trade:
Track ‘n Trade Pro 4.0 User Manual
274
Options Plug-In
The Strike Price Indicator (STRK)
This Indicator also displays the theoretical option prices vs. actual
option prices however; this indicator displays them as a histogram.
The positive values represent over valued and the negative values
represent under valued options. See the example below:
Black and Scholes Calculations
Modern option pricing techniques are often considered among the
most mathematically complex of all applied areas of finance.
Financial analysis has reached the point to where we are now
able to calculate, with alarming accuracy, the fair market value of
a financial option.
Gecko Software employs the calculations developed in 1973 by
Fischer Black and Myron Scholes. This model is known as the
“Black and Scholes Options Pricing Model.”
The Black and Scholes pricing model uses a sophisticated
mathematical formula to calculate the theoretical value of an
option using variables such as; market open, high, low, close
values, interest rates, volatility calculations and other such
information to give us these all important values.
Track ‘n Trade Pro puts to use these unique abilities in several
different ways. First and foremost, Track ‘n Trade Pro is a trading
simulation software application where you are able to go back in
time nearly 30 years and “practice” trading forward, one day at a
time. In essence we are giving a trader 30 years of simulated
trading experience in a matter of hours, days, or possibly weeks.
We allow the trader to use actual historical futures market OHLC
(Open, High, Low, Close) data to simulate trading the
commodities market. In that regard, it would be nearly impossible
for us to assemble a complete set of 30 years of historical options
data which would allow users this same historical data training
privilege. Also, due to the massive amount of data this would
require and given today’s limits of computer speeds, hard drives,
and storage capacity, trying to provide this type of data history to
a typical user would simply put this capability out of reach for the
common trader.
Track ‘n Trade Pro 4.0 User Manual
275
Options Plug-In
This is where the Black and Scholes pricing model comes into
play. Our skilled computer scientists at Gecko Software have
created a way for us to use the data generated by the Black &
Scholes data formula to recreate “on the fly” historical options
data as needed by the user. This way a trader using our software
can recall acutely accurate “simulated” options data from 30 years
ago without actually having hundreds of megabytes of options
data history stored on their computer. The trader can then
simulate trading the financial options market with unparalleled
accuracy. This unparalleled capability allows new traders the
ability to learn and practice basic trading strategies that can then
be taken to the actual markets. It also allows experienced traders
the ability to create and back test advanced simulated trading
models and systems.
Another way in which Gecko Software computer scientists have
implemented the Black & Scholes formulas to help our traders is
with two very unique indicators which sit below a chart of the
underlying financial asset. As the Black and Scholes formula
dictates what the actual “theoretical” value of an option should be
on any given day, Track ‘n Trade will plot the “actual” value of the
option along side the Black & Scholes model, creating an
overvalued or undervalued indicator, letting our users know, from
a simple graphical representation, if the current price of an option
is inline with market sentiment and trading at a premium or a
discount.
One stumbling block that Gecko Software engineers had to
overcome when creating our options trade simulator was that
options data is often times very spotty and full of holes, and due to
the enormous amount of data generated by the options
exchanges there is very little done to try and repair these holes or
bad data ticks. When options trade, they begin a data stream
where they generate an open, high, low and close for each day’s
trading range, but some options, which are usually further out of
the money, don’t trade every single day, which causes gaps or
holes in the data stream. One way or another, these gaps or
holes are either filled, or just left blank. Often times, these gaps
are filled by data vendors who simply pull yesterdays values
forward to today, often times doing this for weeks on end which
only serves to create a very inaccurate and unreliable value
stream, a stream of data that would be difficult to use in any kind
of simulated trading environment or to provide much real-market
value.
Track ‘n Trade Pro 4.0 User Manual
276
Options Plug-In
Just like the genetic scientists did in the classic movie Jurassic
Park, where they filled the gaps in the dinosaurs DNA strand with
frog DNA which allowed them to recreate or clone a dinosaur; our
computer scientists here at Gecko Software fill the gaps in the live
options market data stream with Black & Scholes “theoretical”
prices, giving a more accurate representation of the actual options
value, which in turn allows our users the ability to have a more
complete and highly accurate representation of what actual
market data would have been on any given day.
To differentiate the fictitious theoretical data within the data
stream, we tag it with a trailing asterisk (*) so our users will know
when they are looking at actual market data reported by the
exchange, or a theoretical value inserted into a gap by the Black &
Scholes model. In keeping with the classic movie Jurassic Park,
the process that creates and inserts the theoretical data into the
actual data stream is code named “Frog Data.”
Track ‘n Trade Pro 4.0 User Manual
277
Seasonals Plug-In
Track ‘n Trade Pro 4.0 User Manual
278
Seasonals Plug-In
TRACK ‘N TRADE PRO
VERSION 4.0
Accumulating Wealth One Tic at a Time! ®
SEASONALS PLUG-IN
Track ‘n Trade Pro 4.0 User Manual
279
Seasonals Plug-In
Track ‘n Trade Pro 4.0 User Manual
280
Seasonals Plug-In
SEASONALS PLUG-IN
Using Seasonal Trends to Improve Your
Trading
Introduction
The seasonal markets consist of the commodities that began the
futures industry. Wheat was the first commodity traded as a
futures contact on the futures market. Commodities like Crude,
Corn, Gold, Cattle, etc. have been around longer than financial
commodities. Because they have been around longer, the
seasonal commodities have more historical data. Being able to
analyze that historical data gives you an advantage when you are
trading a seasonal commodity.
The Seasonal Plug-In consists of three separate indicators:
Seasonal Trends
Historical Averages
Market Probability
Seasonal Trends
The seasonal trend indicator represents the “normal” historical
behavior of the market. The indicator is calculated on the specific
contract month, showing you behavior of that specific chart. This is
very important in agricultural markets with new and old crop
contracts; such as wheat or corn.
The charts depict behavior on a relative basis, meaning the actual
prices are not forecasted, just the relative position of the market
versus its contract high and low. On the seasonal charts, the high is
depicted as 1.0, or 100%, while the low is depicted as 0.0 or 0%.
All similar trading days are lined up for X number of years (the
default in Track ‘n Trade Pro are 10 years for Trend 1, and 15 years
for Trend 2) and are analyzed in terms of where each day falls as a
percentage of the highest and lowest price of either the last 12
months or the life of the contract for each specific contract. These
prices are then averaged and the average is depicted in the
indicator window. When the trend line is at 100% or 1.0, it indicates
where the contract has on average been at its highest value for
specified time range and scale period.
Interpretation:
When the trend line is at 0% or 0.0, it indicates where the contract
has on average been at its lowest value for the specified time range
and scale period. The averages use data from all previous years
and are not affected by the current year's trend.
Track ‘n Trade Pro 4.0 User Manual
281
Seasonals Plug-In
Displaying the Seasonal Trend Indicator:
Once you have your settings the way you would like them in the
Program Options window, you can display the Market Probability
indicator anytime you wish. Just click on the SEAS button located
in your indicators menu bar (shown below).
Historical Averages
The Historical Average indicator is very similar to a moving average
indicator, except that it is based on the average price of the specific
contract lined up by date. The charts are made for specific contract
months, so that the trader can see the behavior of the specific
contract they are looking at. This detail is important in a market
with new and old crop contracts, such as the agricultural
commodities.
Unlike the seasonal average prices, the Historic Average lines
depicted in this feature are based on price, not a relative basis. In
essence, what this feature does is give you the average price on a
specific day. This chart will have the same basic feel and theme as
the seasonal chart, except instead of prices being scaled on a
relative basis (0 to 100%) they are the average historical price for
that day.
This feature also may help traders divine value in a commodity, in
that with a quick look not only can the trader see how current prices
line versus average prices historically, but they can also see
seasonal trends. By simply checking the Historical Average check
box within the Seasonals tab, displays the average line in the main
Track ‘n Trade Pro 4.0 User Manual
282
Seasonals Plug-In
chart window. You may also change the number of years, the color,
and line style in which the indicator is displayed. The weighted box
can be selected to provide more significance to the latter years than
the earlier years. The un-weighted is a simple average, giving equal
significance to each year included in the study.
Example of Historical Averages:
Displaying the Historical Average Indicator:
To display the Historical Average on your chart
simply right click on the chart window and
select Historical Averages from the menu.
To unselect, use the same process; right click
and select Historical Averages.
Track ‘n Trade Pro 4.0 User Manual
283
Seasonals Plug-In
Market Probability
The historic Market Probability indicator shows the cumulative
number of times the market in question has settled higher, lower, or
the same on a specific date compared to the previous trading day's
settlement price.
For example, if you are looking at a five year market probability
indicator with a reading of +1, then the market in question may
have historically settled higher three times and lower two times on
this trading day than the previous trading day, or settled higher
twice, lower once, and the same twice. The +1 reading is derived
by subtracting the number of negative settlements from positive
settlements, resulting in a net number of positive (+) or (-) settles.
In other words the +1 reading in these examples would be
indicative of a market which has settled higher one more time than
it has settled lower. If the market settled at the same price as the
previous day, the total is not changed.
Displaying the Market Probability Indicator
Click on the PROB button located in your indicators menu bar
(shown below).
Track ‘n Trade Pro 4.0 User Manual
284
Seasonals Plug-In
Customizing Seasonal Indicators
To customize your seasonal indicators pull up your Program
Options Screen by clicking on this button
on your main
Toolbar. Click on the My Default Settings to make changes to the
default options on the Seasonal Indicators. Click on the Current
Chart Settings to make changes to the currently open chart only. In
each of these sections, you can click on the Seasonal section.
1.
2.
3.
4.
5.
Seasonals Program Options
Seasonal Trends: The Trend 1 and Trend 2 boxes determine if
either or both of the Seasonal Trend lines are active.
To change the number of years the trend is based on select the
number from the drop down menu.
Style & Color: Trend lines can be displayed as a solid, dashed,
or dotted line. Click on the drop down menu to specify the type
of line style desired. Next to the drop down menu is the color
box, click on this box to open a panel and change the line color.
Fill Background: If you would like to fill the area from the Trend
line selected to the bottom of the indicator window check this
option and then choose the trend line to apply it to.
Scale Seasonal To: This setting will base the scaling on the
highest point in the entire contract or the last 12 months and the
lowest point on the option selected.
Track ‘n Trade Pro 4.0 User Manual
285
Seasonals Plug-In
6.
Historical Averages: This section changes the properties for
calculating the average lines for the Historical Averages
Indicator on the Chart Window.
7. Market Probability: This section changes how the Market
Probability indicator is displayed in the Indicator window
properties.
8. Displaying the Indicators: Click on the check box in front of the
indicator that you would like to display.
9. Click on Apply to active charts if you would like to see your
selecting settings on all the charts you open. Click on Restore
Factory Defaults if you would like to restore original software
settings.
10. Help: When you click on this button, a pdf file will open showing
the printed manual. If you do not have Adobe Acrobat Reader on
your computer, visit: http://www.adobe.com
Track ‘n Trade Pro 4.0 User Manual
286
Spreads Plug-In
TRACK ‘N TRADE PRO
VERSION 4.0
Accumulating Wealth One Tic at a Time! ®
SPREADS PLUG-IN
Track ‘n Trade Pro 4.0 User Manual
287
Spreads Plug-In
Track ‘n Trade Pro 4.0 User Manual
288
Spreads Plug-In
SPREADS PLUG-IN
Expand your Trading Options
Introduction
The futures markets provide a variety of trading opportunities. In
addition to profiting from rising prices by purchasing futures options
or from falling prices by selling futures contracts, there is an
opportunity to profit from the relationship between different
contracts, or SPREAD. A Spread refers to the simultaneous
purchase and sale of two or more different futures contracts.
When establishing - or "putting on" - a spread, a trader looks at the
price differential of the spread rather than the absolute contract
price levels. The contract that is viewed as "cheap" is purchased or a long position is established. The contract that is viewed as
"expensive" - or "dear" - is sold - or a short position is established.
If market prices move as expected, meaning the long position gains
in value relative to the short position, the trader profits from the
change in the relationship between the prices.
Remember, the concern for a spread trader is the change in the
relationship between contract he or she is long and the one that
he/she is short, not the absolute price level of the commodity in
question.
Of course, just because you are trading a spread does not
guarantee or eliminate losses. If the long contract decreases in
value RELATIVE to the short position, then the spread trader will
incur losses.
The key to spread trading is in the relative performance of one
futures contract to another. Though some spreads have a basic
market bias, known as bull and bear spreads, the absolute price
level of the underlying commodity contracts is not important, only
the relative performance of one contract versus the other. In other
words, a spread trade is a speculation that one contract will out
perform another contract.
Available online: Introduction Video to the Spreads Plug-in. Visit
us at: http://www.trackntrade.com/tour.htm and select the Spreads
video. To view this video you will need a copy of Microsoft’s Media
Player.
Track ‘n Trade Pro 4.0 User Manual
289
Spreads Plug-In
Example of a Spreads Chart in Track ‘n Trade:
Track ‘n Trade Pro 4.0 User Manual
290
Spreads Plug-In
The Spreads Plug-In includes:
Spreads Tab in the Control Panel
Margins Section in the Program Options
Opening a Spreads Chart:
Step One: Select the Spreads
tab in the Control Panel.
Step Two: Select the two
futures contracts from the
drop down menu that you
would like to use in
generating a spread chart.
Step Three: When you have
made your selections, click
the Open Chart button and
the Spread chart will be
displayed.
The Spread will be listed in
the Spread Chart list and the
individual contracts will be
listed in the Commodity Tab.
These Spreads that you open
will be part of your Chartbook
when you save and close it.
Track ‘n Trade Pro 4.0 User Manual
291
Spreads Plug-In
Spread Margins:
In the Program Options panel, under Global Settings you are able
to modify spread margin requirements.
To modify a margin: Click on the margin in the list, make changes
to the margins, and then select the Add/Modify button.
To add a new margin: Select the commodities for the spread and
then type in the values for the Initial and Maintenance amounts and
then click the Add/Modify button.
Restore factory defaults: To restore the margins to software
defaults click on the Restore factory defaults button
Track ‘n Trade Pro 4.0 User Manual
292
Commitment of Traders Plug-In
TRACK ‘N TRADE PRO
VERSION 4.0
Accumulating Wealth One Tic at a Time! ®
COMMITMENT OF TRADERS
PLUG-IN
Track ‘n Trade Pro 4.0 User Manual
293
Commitment of Traders Plug-In
Track ‘n Trade Pro 4.0 User Manual
294
Commitment of Traders Plug-In
COMMITMENT OF TRADERS
PLUG-IN
Know what the Industries are trading
In this graph, you will notice the red bars, which indicate that the
commercials are all selling, going short while the trend of the
market is going up; that is what this COT graph is representing.
(The Commercials are using the futures market to "hedge" either
the cash market, or their current inventory, that's why they are
going short or selling during an uptrend.)
You'll also notice that the blue lines, which are representative of the
large speculators, do follow the trend of the market more closely,
and that's because they are speculators, not hedgers, that's why
when the market goes up, the large speculators go long, or buy the
market in an attempt to capture profits from buying low and selling
high. But, the commercials, or hedgers go short. Again, in an
attempt to price protect their cash crop or inventory.
You'll notice that the small green bars represent the small
speculators. What you generally find is that the large speculators
and the professional traders will use the small speculators as a
contrarian indicator, if the small speculators are all buying the
market, (lines extend above the zero line.), then they begin to sell, if
they say sell, then they consider being a buyer. (This is not always
true, the small speculator is not always contrary to the general
market direction, but unfortunately for the small speculator, it is
more true than not.)
The best thing about COT, is that it is not based on the market’s
price whatsoever. The JBCOT (Jake Bernstein proprietary buy/sell
indicator.) does not even take the markets price into account. This
is strictly an indicator that looks at what the largest industry players
are doing, and then simply points out their actions.
The COT reports provide a breakdown of each Tuesday's open
interest for markets in which 20 or more traders hold positions
equal to or above the reporting levels established by the CFTC.
Track ‘n Trade Pro 4.0 User Manual
295
Commitment of Traders Plug-In
The weekly reports for Futures-Only Commitments of Traders and
for Futures-and-Options-Combined Commitments of Traders are
released every Friday at 3:30 p.m. Eastern time.
Commitment of Traders Key
The outer most numbers are the range of the largest of the three
commitment of traders (Commercial, Large, and small). The inner
numbers are the range of the Open interest of all of the
commitment of traders (shown below).
Displaying the Commitment of Traders Indicator
Click on the COT button located in your indicators menu bar
(shown below).
Track ‘n Trade Pro 4.0 User Manual
296
Commitment of Traders Plug-In
Methods of Displaying the COT Indicator
1) Bearish/Bullish – This type of chart displays as the COT as
bearish or bullish postion. It is calculated by taking the number
of Long positions minus the number of Short positions. If it is
positive, then more trades are long, if it is negative more trades
are short, if it is zero then it is equal.
2) Total Position – This type of chart displays the COT values
as a stacked column. The long position number on top and the
short position number on bottom.
Customizing Commitment of Traders Indicator
To customize your Commitment of Traders indicator pull up your
Program Options Screen by clicking on this button on your main
Toolbar. Click on the My Default Settings to make changes to the
default options on the COT Indicator. Click on the Current Chart
Settings to make changes to the currently open chart only. In each
of these sections, you can click on the COT section.
Track ‘n Trade Pro 4.0 User Manual
297
Commitment of Traders Plug-In
COT Program Options
1. Period: To specify the number of weeks used in calculating the
JBCOT Buy/Sell Indicator, simply highlight the current number
and type in a new value.
2. Style & Color: Trend lines can be displayed as a solid, dotted, or
none line. Click on the drop down menu to specify the type of
line style desired. Next to the drop down menu is the color box,
click on this box to open a panel and change the line color.
3. The three Commitment of traders: Commercial, NonCommercial(Large), and Non-Reportable(Small).
4. Open Interest: The total number of futures or futures and
options contracts of a given commodity for all three
Commitment of traders.
5. COT Graph Dataset: You can have the data be either the
Futures Only data or the Futures and Options combined data.
6. COT Graph Shows: This setting will graph the COT either as a
Histogram or a Line.
a. As shown in screen shot on previous page, the first
option in the drop down menu is the COT Indicator
displayed as Bullish/Bearish histogram.
b. As shown below the second option in the drop down
menu displays the COT Indicator as a Bullish/Bearish
line.
Track ‘n Trade Pro 4.0 User Manual
298
Commitment of Traders Plug-In
c.
As shown below the third option in the drop down menu
displays the COT Indicator as a Total Position
Histogram. To change the color of short positions, use
the slider bar labeled “Long/Short color difference
shading”.
d.
As shown below the forth option in the drop down menu
displays the COT Indicator as a Total Position line. To
change the color of short position, use the slider bar
labeled “Long/Short color difference shading”.
7. To display the indicator in the chart window, click the check
box.
8. Ruler Bar – See the Ruler Bar at the end of this section.
9. Preview Window: This Window allows you to make changes
and preview them before saving them.
10. Click on Apply to active charts if you would like to see your
selecting settings on all the charts you open. Click on Restore
Factory Defaults if you would like to restore original software
settings.
11. Help: Information from the Manual has been integrated into the
software. When clicking on the Help button and you will get
Track ‘n Trade Pro 4.0 User Manual
299
Commitment of Traders Plug-In
specific documentation based on the location of the button.
You may also press F1 on your keyboard.
Customizing JBCOT Indicator
To customize your JBCOT indicator pull up your Program Options
Screen by clicking on this button on your main Toolbar. Click on the
My Default Settings to make changes to the default options on the
JBCOT Indicator. Click on the Current Chart Settings to make
changes to the currently open chart only. In each of these sections,
you can click on the JBCOT section.
1.
2.
Period: To specify the number of weeks used in
calculating the JBCOT Buy/Sell Indicator, simply highlight
the current number and type in a new value.
Style & Color: Trend lines can be displayed as a solid,
dotted, or none line. Click on the drop down menu to
specify the type of line style desired. Next to the drop
down menu is the color box, click on this box to open a
panel and change the line color.
Track ‘n Trade Pro 4.0 User Manual
300
Commitment of Traders Plug-In
3. The drop-down menu for Show Buy/Sell Arrows
allows you to select either Always Show Arrows or
Only When Indicator is Visible to view the buy/sell
signals or Never Show Arrows to never see the
JBCOT arrows.
4. To display the indicator in the chart window, click the
check box.
5. Ruler Bar - See the Ruler Bar at the end of this
section.
6. Preview Window: This Window allows you to make
changes and preview them before saving them.
7. Click on Apply to active charts if you would like to
see your selecting settings on all the charts you
have open. Click on Restore Factory Defaults if
you would like to restore original software settings.
8. Help: Information from the Manual has been
integrated into the software. When clicking on the
Help button and you will get specific documentation
based on the location of the button. You may also
press F1 on your keyboard.
Ruler Bar
The Ruler Bar inside the Program Options windows for the indicators
that are displayed in the Indicator window, allows user's to create
highlighted regions or horizontal lines within the indicator window.
To create a highlighted region: Click at either end of the Ruler bar
and drag either up or down to the end point of the region.
To place a line: Click in side the ruler bar and drag the line to the
desired point.
To change the color of the highlighted region: You must rightclick on either the bottom edge (if it is on the top of the indicator
Track ‘n Trade Pro 4.0 User Manual
301
Commitment of Traders Plug-In
window) or the top edge (if it is on the bottom of the indicator
window). Next choose the “Select Color” option from the right-click
menu. The Color Palette will open, choose a color and click on OK.
You may also Clear the item that you right-clicked on or Clear All
items in the Indicator window by selecting these items from the rightclick menu.
Track ‘n Trade Pro 4.0 User Manual
302
Commitment of Traders Plug-In
TRACK ‘N TRADE PRO
VERSION 4.0
Accumulating Wealth One Tic at a Time! ®
CANDLESTICK CHARTING
Track ‘n Trade Pro 4.0 User Manual
303
Candlestick Charting
Track ‘n Trade Pro 4.0 User Manual
304
Candlestick Charting
CANDLESTICK CHARTING
An Introduction to Japanese Candlestick
Charting By Erik Gebhard
Introduction…a New Way to Look at Prices
Would you like to learn about a commodity price chart that is
possibly more effective than the type you are probably currently
using? If so, keep reading. If you are brand new to the art/science
of chart reading, don’t worry, this stuff is really quite simple to learn.
Technical Analysis…a Brief Background
Technical analysis is simply the study of prices as reflected on price
charts. Technical analysis assumes that current prices should
represent all known information about the markets. Prices not only
reflect intrinsic facts, they also represent human emotion and the
pervasive mass psychology and mood of the moment. Prices are,
in the end, a function of supply and demand. However, on a
moment to moment basis, human emotions…fear, greed, panic,
hysteria, elation, etc. also dramatically effect prices. Markets may
move based upon people’s expectations, not necessarily facts. A
market "technician" attempts to disregard the emotional component
of trading by making his decisions based upon chart formations,
assuming that prices reflect both facts and emotion.
Standard bar charts are commonly used to convey price activity
into an easily readable chart. Usually four elements make up a bar
chart, the Open, High, Low, and Close for the trading session/time
period. A price bar can represent any time frame the user wishes,
from 1 minute to 1 month. The total vertical length/height of the bar
represents the entire trading range for the period. The top of the bar
represents the highest price of the period, and the bottom of the bar
represents the lowest price of the period. The Open is represented
by a small dash to the left of the bar, and the Close for the session
is a small dash to the right of the bar.
Figure #: Candlesticks - Standard
Bar Chart Example
Track ‘n Trade Pro 4.0 User Manual
305
Candlestick Charting
Candlestick Charts Explained
You may be asking yourself, "If I can already use bar charts to view
prices, then why do I need another type of chart?"
The answer to this question may not seem obvious, but after going
through the following candlestick chart explanations and examples,
you will surely see value in the different perspective candlesticks
bring to the table. In my opinion, they are much more visually
appealing, and convey the price information in a quicker, easier
manner.
What is the History of Candlestick Charts?
Candlestick charts are on record as being the oldest type of charts
used for price prediction. They date back to the 1700's, when they
were used for predicting rice prices. In fact, during this era in
Japan, Munehisa Homma become a legendary rice trader and
gained a huge fortune using candlestick analysis. He is said to
have executed over 100 consecutive winning trades!
The candlesticks themselves and the formations they shape were
give colorful names by the Japanese traders. Due in part to the
military environment of the Japanese feudal system during this era,
candlestick formations developed names such as "counter attack
lines" and the "advancing three soldiers". Just as skill, strategy, and
psychology are important in battle, so too are they important
elements when in the midst of trading battle.
What do Candlesticks Look Like?
Candlestick charts are much more visually appealing than a
standard two-dimensional bar chart. As in a standard bar chart,
there are four elements necessary to construct a candlestick chart,
the OPEN, HIGH, LOW and CLOSING price for a given time
period. Examples of candlesticks and a definition for each
candlestick component are located below.
Track ‘n Trade Pro 4.0 User Manual
306
Candlestick Charting
The body of the candlestick is called the real body, and
represents the range between the open and closing prices.
A black or filled-in body represents that the close during that
time period was lower than the open, (normally considered
bearish) and when the body is open or white, that means the
close was higher than the open (normally bullish).
The thin vertical line above and/or below the real body is
called the upper/lower shadow, representing the high/low
price extremes for the period.
Bar Compared to Candlestick Charts
Below is an example of the same price data conveyed in a
standard bar chart and a candlestick chart. Notice how the
candlestick chart appears 3-dimensional, as price data almost
jumps out at you.
( 3a )
(3b)
The long, dark, filled-in real bodies represent a weak (bearish)
close ( 3a ), while a long open, light-colored real body represents a
Track ‘n Trade Pro 4.0 User Manual
307
Candlestick Charting
strong (bullish) close ( 3b ). It is important to note that Japanese
candlestick analysts traditionally
view the open and closing prices as the most critical of the day. At
a glance, notice how much easier it is with candlesticks to
determine if the closing price was higher or lower than the opening
price.
Common Candlestick Terminology
The following is a list of some individual candlestick terms. It is
important to realize that many formations occur within the context of
prior candlesticks. What follows is merely a definition of terms, not
formations.
The Black Candlestick -- when the close is lower than the open.
The White Candlestick -- when the close is higher than the open.
The Shaven Head -- a candlestick with no upper shadow.
Track ‘n Trade Pro 4.0 User Manual
308
Candlestick Charting
The Shaven Bottom -- a candlestick with no lower shadow.
Spinning Tops -- candlesticks with small real bodies, and when
appearing within a sideways choppy market, they represent
equilibrium between the bulls and the bears. They can be either
white or black.
Doji Lines -- have no real body, but instead have a horizontal line.
This represents when the Open and Close are the same or very
close. The length of the shadow can vary.
Candlestick Reversal Patterns
Just as many traders look to bar charts for double tops and
bottoms, head-and-shoulders, and technical indicators for reversal
signals, so too can candlestick formations be looked upon for the
same purpose. A reversal does not always mean that the current
uptrend/downtrend will reverse direction, but merely that the current
direction may end. The market may then decide to drift sideways.
Candlestick reversal patterns must be viewed within the context of
prior activity to be effective. In fact, identical candlesticks may have
Track ‘n Trade Pro 4.0 User Manual
309
Candlestick Charting
different meanings depending on where they occur within the
context of prior trends and formations.
Hammer: a candlestick with a long lower shadow and small real
body. The shadow should be at least twice the length of the real
body, and there should be no or very little upper shadow. The body
may be either black or white, but the key is that this candlestick
must occur within the context of a downtrend to be considered a
hammer. The market may be "hammering" out a bottom.
Hanging Man -- identical in appearance to the hammer, but
appears within the context of an uptrend.
Track ‘n Trade Pro 4.0 User Manual
310
Candlestick Charting
Engulfing Patterns -- Bullish -- when a white, real body totally
covers, "engulfs" the prior day's real body. The market should be in
a definable trend, not chopping around sideways. The shadows of
the prior candlestick do not need to be engulfed.
Bearish -- when a black, real body totally covers, "engulfs" the prior
day's real body. The market should be in a definable trend, not
chopping around sideways. The shadows of the prior candlestick
do not need to be engulfed.
Track ‘n Trade Pro 4.0 User Manual
311
Candlestick Charting
Dark-Cloud Cover (bearish)-- a top reversal formation where the
first day of the pattern consists of a strong white, real body. The
second day's price opens above the top of the upper shadow of the
prior candlestick, but the close is at or near the low of the day, and
well into the prior white, real body.
Piercing Pattern (bullish) -- opposite of the dark-cloud cover.
Occurs within a downtrend. The first candlestick having a black,
real body, and the second has a long, white, real body. The white
day opens sharply lower, under the low of the prior black day.
Then, prices close above the 50% point of the prior day's black real
body.
Track ‘n Trade Pro 4.0 User Manual
312
Candlestick Charting
These candlestick formations consist of a small real body that gaps
away from the real body preceding it. The real body of the star
should not overlap the prior real body. The color of the star is not
too important, and they can occur at either tops or bottoms. Stars
are the equivalent of gaps on standard bar charts.
Stars make up part of four separate reversal patterns:
Morning Star
Evening Star
Doji Star
Shooting Star (Inverted Hammer)
Morning Star-- this is a bullish bottom reversal pattern. The
formation is comprised of 3 candlesticks. The first candlestick is a
tall black real body followed by the second, a small real body, which
gaps (opens), lower (a star pattern). The third candlestick is a white
real body that moves well into the first period's black real body. This
is similar to an island pattern on standard bar charts.
Track ‘n Trade Pro 4.0 User Manual
313
Candlestick Charting
Evening Star --- a bearish top reversal pattern and counterpart to
the Morning Star. Three candlesticks compose the evening star, the
first being long and white. The second forms a star, followed by the
third, which has a black real body that moves sharply into the first
white candlestick.
Doji Stars -- When a doji gaps above a real body in an uptrend, or
gaps under a real body in a falling market, that particular doji is
called a doji star. Two popular doji stars are the evening star and
the morning star.
Track ‘n Trade Pro 4.0 User Manual
314
Candlestick Charting
Evening Doji Star: a doji star in an uptrend followed by a long, black
real body that closed well into the prior white real body. If the
candlestick after the doji star is white and gapped higher, the
bearishness of the doji is invalidated.
Morning Doji Star -- a doji star in a downtrend followed by a long,
white real body that closes well into the prior black real body. If the
candlestick after the doji star is black and gapped lower, the
bullishness of the doji is invalidated.
Track ‘n Trade Pro 4.0 User Manual
315
Candlestick Charting
Shooting Star -- a small real body near the lower end of the trading
range, with a long upper shadow. The color of the body is not
critical. Not usually considered a major reversal sign, only a
warning.
Inverted Hammer-- not really a star, but does look like a shooting
star. When occurring within a downtrend, may be a turning signal.
Body color is not critical.
Final Thoughts and Credits
It is important to realize that this introduction is just that, an
introduction to candlestick analysis. After having read this, you will
have merely scratched the surface of the many patterns and
variables that can go into candlestick analysis. No attempt was
made to provide a thorough analysis of each and every pattern. In
fact, many formations were left out as they cross the border into
more complicated analysis. For a more complete overview of
candlestick analysis, it is highly recommended that you read the
book that is referred to below.
Track ‘n Trade Pro 4.0 User Manual
316
Candlestick Charting
A large portion of the material in this introduction is taken from an
excellent book called Japanese Candlestick Charting Techniques:
A Contemporary Guide to the Ancient Investment Techniques of
the Far East. (You can find this book in The PitMaster's
Bookstore.) In some cases, sentences were taken almost
verbatim, as there was no better way to say what Mr. Steve Nison,
the author, already said. In his book, Mr. Nison, completely explains
candlesticks and their formations, but more importantly explains
how to combine candlestick analysis with traditional technical
analysis. It is highly recommended that you consider purchasing
this book.
As traders, we need as many trading tools in our arsenal, and a
basic knowledge of candlesticks provides a trader much needed
ammunition. Also remember that no matter what the trading tool, no
matter how advanced or ancient; it is only effective when put into
practice properly. This is, of course, your job as the trader.
Track ‘n Trade Pro 4.0 User Manual
317