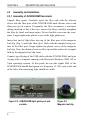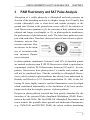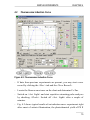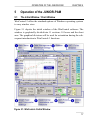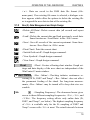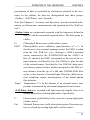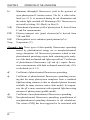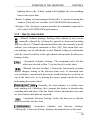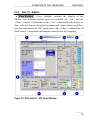
1
JUNIOR-PAM
CHLOROPHYLL FLUOROMETER
Operator's Guide
2.154 / 12.07
1. Edition: December 07
JPM_070906.doc
Erhard Pfündel
© Heinz Walz GmbH, 2007
Heinz Walz GmbH • Eichenring 6 • 91090 Effeltrich • Germany
Phone +49-(0)9133/7765-0 • Telefax ++49-(0)9133/5395
E-mail [email protected] • Internet www.walz.com
Printed in Germany
CONTENT
Content
1
Safety Instructions
1
2
2.1
2.2
2.2.1
2.2.2
JUNIOR-PAM: Description and Installation
JUNIOR-PAM Components
Assembly and Installation
Assembly of JUNIOR-PAM fluorometer
Installation of WinControl-3 software
3
3
4
4
5
3
3.1
3.2
PAM Fluorometry and SAT Pulse Analysis
Pulse-Amplitude-Modulated Fluorescence
Saturating Pulse Analysis
7
8
10
4
4.1
4.2
Simple Experiments
Testing the Fo´-Mode
Fluorescence Induction Curve
13
13
15
5
5.1
5.1.1
5.1.2
5.1.3
5.1.4
5.1.5
5.1.6
5.1.7
5.1.8
5.1.9
5.1.10
5.1.11
5.2
5.3
5.4
Operation of the JUNIOR-PAM
The Initial Window / Chart Window
Box (1) - Main Menu Bar
Box (2) -Data Management and Graph Design
Box (3) - Sidebar
Box (4) - SAT Pulse Analysis
Box (5) - Online Data
Box (6) - SAT-Pulse Trigger
Box (7) - Experimental Parameters and Procedure
Box (8) - Graph Type and Fluorometer Settings
Box (9) - Axis Control
Box (10) - Ordinate Selection and Text Field
CHART - Selecting Data
Induction Curve Window
Light Curve Window
SAT Graph Window
17
17
18
19
20
23
25
25
25
28
29
30
30
31
31
32
I
CONTENT
5.4.1
5.4.2
5.4.3
5.5
5.5.1
5.5.2
5.6
5.6.1
5.6.2
5.6.3
5.6.4
5.6.5
5.7
Box (2) – Data Management
Box (3) – Sidebar
SAT Graph Panel
Report Window
Box (11) - Data Management
Box (12) - Report Data Field
Settings Window
Box (14) - Instrument Name & Reset
Box (15) - Measuring Parameters
Box (16) - Light Parameters
Box (17) - Program Parameters
Box (18) - PAR-List & LED
System Setting
32
33
34
34
34
37
37
37
38
39
40
41
41
6
6.1
6.1.1
6.1.2
6.2
6.3
6.4
6.5
Acronyms and Equations
Relative Fluorescence Yields
Measurements with Dark-acclimated Samples
Measurements with Light-exposed (Treated) Samples
Fluorescence Quenching Coefficients
Relative Electron Transport Rate (ETR)
Light Curves
Literature Cited in Chapter 6
43
43
43
44
44
47
48
50
7
Some Reviews on Chlorophyll Fluorescence
53
8
JUNIOR-PAM Specifications*
55
9
Warranty Conditions
57
II
SAFETY INSTRUCTIONS
1
CHAPTER 1
Safety Instructions
-
Instructions. Read all the safety instructions and operating instructions thoroughly before using the device for the first time.
Keep these safety instructions and operating instructions somewhere safe in case you need to refer to them again in the future.
-
Safety warnings. Pay heed to safety warnings on the device and
in the operating instructions. Follow the instructions for operation
and use of the device in every respect.
-
Temperature. Do not install the device near any heat sources
such as a radiators, hot-air dryers, ovens, etc. Do not place naked
flame sources, such as lighted candles or Bunsen burners, on or
near the device.
-
Moisture. Keep this device out of the rain and away from moisture. Do not expose the apparatus to dripping or splashing and do
not place any object filled with liquid, such as drinking vessels,
beakers or test tubes, on or close to the device. Never use the device near water, for example near a sink.
-
Solid objects. Take great care to ensure that no sharp objects
penetrate inside the device through openings of the casing.
-
Service. Do not open the casing. There are no user serviceable
parts inside. Refer all servicing to qualified service personnel.
Servicing is required when the apparatus has been damaged in
any way, e.g., by exposure to wet conditions, excessive heat, or
has been dropped.
-
Power source. Connect the device only to the 5 Volt power
source of a USB-A socket of a computer using the USB cable
supplied with the device. Run the USB cable so that no one can
step on it and nothing can rest on or against it.
1
CHAPTER 1
2
SAFETY INSTRUCTIONS
-
Device not in use. If you are not going to use the device for some
time, remove the plug from the socket.
-
Cleaning. Clean only with dry cloth.
DESCRIPTION & INSTALLATION
CHAPTER 2
2
JUNIOR-PAM: Description and Installation
2.1
JUNIOR-PAM Components
a)
JUNIOR-PAM chlorophyll fluorometer.
b)
USB cable to connect the JUNIOR-PAM fluorometer to a computer.
c)
CD-ROM including WinControl-3 software and JUNIOR-PAM
user’s manual.
d)
Booklet: JUNIOR-PAM user’s manual (not shown in Fig. 2.1).
e)
400 x 1.5 mm (L x D) light guide.
f)
Leaf clip and magnetic leaf clip.
g)
Fluorescence standard foil.
Figure 2.1: JUNIOR-PAM components.
3
CHAPTER 2
2.2
DESCRIPTION & INSTALLATION
Assembly and Installation
2.2.1 Assembly of JUNIOR-PAM fluorometer
Unpack fiber optics. Carefully insert the fiber end with the silicone
sleeve into the fiber port of the JUNIOR-PAM until silicone sleeve and
fiber port get in contact. Frequently, the fiber encounters a resistance
during insertion: if this is the case, remove the fiber, carefully straighten
the fiber by hand, and insert again. Do not forcible overcome the resistance. Finger-tighten the plastic screw of the light guide port.
Insert free end of light fiber into top of the fiber port of the magnetic
leaf clip (Fig. 3) until the fiber tip is flush with the sample-facing surface of the fiber port. Finger-tighten the plastic screw of the magnetic
leaf clip. Now, the distance between fiber tip and the surface of a sample
held by the magnetic leaf clip 1mm.
Connect type B plug of the USB cable with the JUNIOR-PAM, and type
A plug with a computer running with Microsoft Windows 2000, XP or
Vista operating systems. At this point; the top side signal LED of the
JUNIOR-PAM should flash green at a frequency of 1 Hz, and, at the end
of the fiber, blue measuring light should be visible.
Figure 2.2: JUNIOR-PAM light guide port and
sockets.
4
Figure 2.3:
Magnetic leaf clip.
DESCRIPTION & INSTALLATION
CHAPTER 2
2.2.2 Installation of WinControl-3 software
Depending on the type of CD-ROM delivered with the JUNIOR-PAM
you have to start installation with article a ) or article b ).
a)
Your <Software & Manuals CD-ROM> contains only a setup file
(e. g., <WinControl-3-3.13-Setup.exe>) and this manual in PDF
file format.
Double click on the setup file and follow instructions. The setup routine
will create the folder <WinControl-3> containing WinControl-3 software in the <c:\Program Files> directory. Further, a USB serial converter driver will be installed, and shortcuts to the WinControl-3 software will be created in the <Program> section of the Windows <Start>
menu and elsewhere, depending on your selection.
b)
Your <Software & Manuals CD-ROM> contains the complete
collection of the Walz Software & Manuals. In this case, the CD
starts the default internet browser of your computer. (If automatic
browser start fails, double-click on <index.html> in the root directory of the <Software & Manuals> CD-ROM.)
Choose <Fluorescence Products> Î <JUNIOR-PAM> Î <PC software
WinControl-3>. Clicking on <WinControl-3> will start software installation as described above.
Using shortcuts in the <Start> menu, you can run two instances of WinControl-3 at the same time: one in the measuring mode (choose <WinControl-3>) and another one in the offline mode (choose WinControl-3 Offline>). Note that <WinControl-3 - Network Mode> does not work
with the JUNIOR-PAM fluorometer but requires WinControl-3compatible devices capable of RS485 communication (e.g., MONITORING PAM fluorometer). The measuring mode of WinControl-3 is also
initiated by double-clicking on the WinControl-3 shortcut on the Windows desktop.
5
CHAPTER 2
DESCRIPTION & INSTALLATION
After launching the measuring mode of WinControl-3, the program
scans for WinControl-3-compatible devices connected to the computer.
With the JUNIOR-PAM attached, the bottom of the opening window of
WinControl-3 displays address number and name of your JUNIORPAM, e.g., <#1: JUNIOR-PAM/II>. With the fluorescence standard or a
green leaf in the magnetic leaf clip, and “Meas. Light“ and “Rec.
Online” checked, the chart typically displays values greater than 200
digital units. Click <Autoscale> if data are not visible. In case the actually measured values are clearly lower than 200 digital units, make sure
that the silicone sleeve of the optical fiber is in contact with the fiber
port.
6
PAM FLUOROMETRY & SAT PULSE ANALYSIS
3
CHAPTER 3
PAM Fluorometry and SAT Pulse Analysis
Absorption of a visible photon by a chlorophyll molecule promotes an
electron of the absorbing molecule to a higher energy level. Usually, this
excited chlorophyll state is short-lived and returns promptly to the
ground state. Return to the ground state occurs with (1) the emission of
a red fluorescence quantum or (2) the emission of heat radiation at near
infrared and longer wavelengths, or (3), in photosynthetic membranes,
the performance of photochemical work. The latter three pathways compete with each other. Therefore, decreased rates of heat release or photochemistry increase fluorescence emission. Also,
an increase in the intensity of excitation radiation increases fluorescence emission.
In photosynthetic membranes, between 2 and 10% of absorbed quanta
are emitted as photosystem II (PS II) fluorescence which is equivalent to
a (quantum) yield for PS II fluorescence between 0.02 and 0.1. In comparison, fluorescence from photosystem I is smaller and constant, and
will not be considered here. That the variability in chlorophyll fluorescence yield is related to photosynthesis has already been understood by
Kautsky and Hirsch in 1931 (Naturwissenschaften 19: 964). In the following 50 years, highly sensitive and fast fluorometers were developed
which contributed substantially to the elucidation of the basic mechanisms involved in the complex process of photosynthesis.
Progress in photosynthesis research has been greatly stimulated by the
invention of the patented Pulse-Amplitude-Modulation (PAM) fluorometer in the mid-1980s. The first PAM-101 chlorophyll fluorometer, and
newer models like portable above-ground and underwater fluorometers
(e.g., PAM-2100 and DIVING PAM), the robust outdoor monitoring
7
CHAPTER 3 PAM FLUOROMETRY & SAT PULSE ANALYSIS
fluorometer MONI-PAM, and imaging fluorometers (IMAGING-PAM
M series) have been successfully used all over the world.
PAM fluorometers, as many conventional fluorometers, use filter combinations which prevent the fluorometer’s excitation radiation from
reaching the photodetector. Different from conventional devices, the
PAM fluorometers measure only the fluorescence resulting from an
evenly pulsed measuring beam: the fluorescence caused by continuous
radiation is not measured. This permits the use of continuous radiation
to manipulate the fluorescence yield in photosynthetic membranes and
to carry out the so-called saturating pulse analyses.
Subsequently, the Pulse-Amplitude-Modulated fluorescence signal and
the saturating pulse analysis will be briefly explained.
3.1
Pulse-Amplitude-Modulated Fluorescence
In panel A of Figure 3.1, an excitation intensity regime is depicted
which consists of two separate 80 s intervals of actinic illumination of
different intensities. Always, a pulsed light source with constant pulse
height but rather low intensity is active. The pulsed radiation corresponds to the measuring light of a PAM fluorometer.
If the latter light regime excites fluorescence from a JUNIOR-PAM
fluorescence standard, the signal obtained with a conventional fluorometer is simply proportional to the excitation intensity (Fig. 3.1 B
“standard”). If the conventional instrument records fluorescence from a
leaf, typical “Kautsky-type” induction curves appear during actinic illumination (Fig. 3.1 B “leaf”). For the same actinic light intensity, these
variations are determined by changes in the fluorescence yield. In addition, the intensity of actinic light controls the fluorescence signal as demonstrated by the upward shifted induction kinetics in the presence of
the higher actinic intensity compared to the kinetics obtained with lower
actinic light. Hence, conventional fluorometers respond to both, variations in fluorescence quantum yield and excitation light intensity.
8
PAM FLUOROMETRY & SAT PULSE ANALYSIS
Figure 3.1:
CHAPTER 3
Schematic representation of Pulse-Amplitude-Modulation
(PAM) fluorescence measurements.
PAM fluorometers measure only the height of fluorescence peaks
caused by the pulsed measuring light source (compare insert Panel B).
In the presence of uniform excitation pulses, and provided that chlorophyll optical properties remain constant during measurements, the signal
9
CHAPTER 3 PAM FLUOROMETRY & SAT PULSE ANALYSIS
recorded by PAM fluorometers is proportional to the fluorescence yield.
Therefore, the PAM measurements reveal that the fluorescence yield of
the standard is constant throughout the experiment, but the fluorescence
yield in a leaf varies significantly during the light exposure experiment
and exhibited rather similar induction curves despite the actinic light intensities differed by a factor of 2 (Fig. 3.1. C).
3.2
Saturating Pulse Analysis
As explained above, the fluorescence yield in leaves is modulated by
two competing de-excitation pathways, photochemistry and heat emission. The decrease in fluorescence yield originating in increased photochemistry is called photochemical fluorescence quenching, or photochemical quenching. All other modifications of the fluorescence yield
are attributed to heat dissipation and are summarized as nonphotochemical fluorescence quenching, or non-photochemical quenching. The saturating pulse analysis has been designed to distinguish between the two fluorescence quenching mechanisms.
Figure 3.2 shows a fluorescence curve induced by actinic (i. e., photochemically active) illumination. During the dark periods which flank the
induction curve, the integrated intensity of the pulsed measuring light is
very low and does induce noticeable rates of electron transport. Therefore, under dark conditions, virtually all PS II reaction centers are in the
open state and able to convert excitation energy into photochemistry
with maximum efficiency, that is, photochemical quenching is maximal.
A saturating pulse (SP) is delivered in the dark period preceding illumination and another one at the end of illumination. The term “saturating”
means that the light is strong and long enough to fully reduce the electron transport chain between the two photosystems so that PS II lacks
electron acceptors. In the absence of electron acceptors, PS II reaction
centers cannot perform photochemical work and become closed, that is,
photochemical quenching becomes zero. Under these conditions, maxi10
PAM FLUOROMETRY & SAT PULSE ANALYSIS
CHAPTER 3
mum fluorescence levels are reached which are denoted as Fm and Fm´
in the dark-acclimated and light-exposed sample, respectively.
In Fig. 3.2, several seconds of far red illumination succeed each saturating flash. Far red radiation is preferably absorbed by photosystem I but
to a much lesser degree by photosystem II. The selective operation of
photosystem I quickly withdraws electrons from the intersystem electron chain ensuing fast opening of the PS II reaction centers and maximal photochemical quenching. The resulting minimum fluorescence
levels are denoted as Fo and Fo´ in the dark-acclimated and lightexposed sample, respectively.
Figure 3.2:
Saturating Pulse Analysis.
11
CHAPTER 3 PAM FLUOROMETRY & SAT PULSE ANALYSIS
During actinic illumination, a proton gradient across the photosynthetic
membranes (ΔpH) is formed and the xanthophyll, zeaxanthin, is synthesized. The ΔpH and the concentration of zeaxanthin represent significant
factors for stimulating non-photochemical quenching. Subsequent to illumination, the pH gradient collapses and the zeaxanthin is retransformed into violaxanthin (sketched in Fig. 3.2).
Importantly, the far red-stimulated opening of PS II reaction centers occurs faster than the ΔpH collapse and zeaxanthin retransformation. Consequently, in the presence of far red illumination, the minimum fluorescence level right after actinic light exposure represents the fluorescence
yield of open PS II reaction centers with the previous nonphotochemical quenching still present. Without far red illumination, the
velocities of reaction center opening and ΔpH breakdown would be
comparable so that PS II reaction centers become fully open only after a
considerable part of non-photochemical quenching has decayed.
In conclusion, the primary information of saturating pulse analysis is:
(1) the fluorescence increase caused by the decrease from maximum to
minimum photochemical quenching in the dark-acclimated and lightexposed leaf (FM minus F0 and FM’ minus F0’, respectively). (2) the fluorescence decrease caused by actinic light-activated non-photochemical
quenching in the absence and at maximum photochemical quenching
(FM minus FM’ and F0 minus F0’, respectively), and (3), derived from the
position of the induction curve just before the saturating pulse (the F´
level) relative to the interval delimited by FM’ and F0’, the degree of
PS II reaction center closure.
Usually, not absolute fluorescence values or fluorescence differences are
used to measure the PS II state but fluorescence quotients. The fluorescence quotients calculated by the WinControl-3 program are summarized in Table 6.1 (Chapter 6). Some publications providing background
information to the various evaluation methods used in saturating pulse
analyses are compiled in sections 6.5 and 7.
12
SIMPLE EXPERIMENTS
4
CHAPTER 4
Simple Experiments
Chapter 4 introduces two simple experiments which can be performed
without in-depth knowledge of the WinControl-3 software. To exploit
the multifaceted functionality of the WinControl-3 software, it is recommended to study Chapter 5 which includes a complete presentation
of the software’s capabilities.
The subsequent experiments require that the JUNIOR-PAM system is
set up according to Chapter 2. Also, all experiment start with a leaf
which has been acclimated to dark or dim light conditions for30 minutes. With the leaf situated in the magnetic leaf clip, the Fo fluorescence
level should not exceed 600 counts to avoid signal saturation during
Fo,Fm determination.
4.1
Testing the Fo´-Mode
- Start WinControl-3 and locate the fluorescence trace on the chart. If
the signal is not in view, make sure that <Rec. Online> is checked
and click the <Autoscale> button.
-
Press the <Fo,Fm> button to determine the Fv/Fm ratio which indicates the maximum photochemical efficiency of PS II. The data appear on top of the <Result> sidebar (see Figure 4.1 for typical data).
Use <Autoscale> to view the entire signal.
- Make sure that the Fo´-Mode is unchecked. Click on the <Program>
tab and check <Act.+Yield>. The <Act.+Yield> command illuminates the sample for a given time and carries out a saturating pulse
analysis at start and end of the illumination period. Watch the Kautsky induction kinetics. After illumination, wait until the fluorescence
signal arrives at the initial level.
- Activate the <Fo´-Mode> and start <Act.+Yield> again. With the
<Fo´-Mode> active, far red illumination is switched on directly after
each saturating flash actinic light exposure with the result that the
13
CHAPTER 4
SIMPLE EXPERIMENTS
fluorescence intensity decreases faster and drops to a lower value
than in the previous <Act.+Yield> step (see Fig. 4.1.).
It is recommended to repeat the latter two steps to establish a clear pattern of the effect of far red illumination.
Figure 4.1: Testing the Fo´-Mode
14
SIMPLE EXPERIMENTS
4.2
CHAPTER 4
Fluorescence Induction Curve
Figure 4.2: Fluorescence Induction Curve
- If data from previous experiments are present, you may start a new
record by clicking the <Rec.> tab and the <New Record>.
- Locate the fluorescence trace on the chart and determine Fv/Fm.
- Switch on <Act. Light> and start repetitive saturating pulse analyses
by checking <Clock>. Switch off <Act. Light> after a couple of
minutes.
- Fig. 4.2 shows typical results of an induction curve experiment: right
after onset of actinic illumination, the photochemical yield of PS II
15
CHAPTER 4
SIMPLE EXPERIMENTS
(Y(II)) drops close to zero which is related to the dark idling state of
photosynthesis at which PS II electrons cannot be processed. The
subsequent activation of energy-consuming photosynthetic processes
recovers the PS II yield to intermediate values. Non-photochemical
quenching (blue symbols) is absent at start of actinic illumination because a trans-membrane ΔpH is absent. Ongoing illumination buildup the ΔpH and, hence non-photochemical quenching. Towards the
end of illumination, part of the ΔpH is dissipated via the chloroplast
ATP synthase in response to the growing ATP requirements of carbon
fixation.
- Switching off actinic illumination shuts down PS II photochemical
rates ensuing reoxidation of the intersystem electron transport and
recovery to initial values of the PS II photochemical yield. In parallel, the trans-membrane ΔpH decays and non-photochemical quenching drops.
- Note that of fluorescence induction and recovery curves can be performed automatically using the <IC+Recov.> command available in
the <Program> field.
16
OPERATION OF THE JUNIOR-PAM
5
Operation of the JUNIOR-PAM
5.1
The Initial Window / Chart Window
CHAPTER 5
WinControl-3 offers the standard options of Windows operating systems
to vary window sizes.
Figure 5.1 depicts the initial window of the WinControl software. The
window is graphically divided into 11 sections: 10 boxes and the chart
area. The graphical divisions will be used for orientation during the subsequent introduction to WinControl-3 functions.
Figure 5.1: WinControl-3 Initial Window
17
CHAPTER 5
5.1.1
OPERATION OF THE JUNIOR-PAM
Box (1) - Main Menu Bar
<File>
<Load Data>
Delete current data and load saved data. Note: loading data with <Rec. Online> checked (see Box (2))
will display the currently recorded data rather than
the loaded data. To view the loaded data, select the
<Rec.> tab in Box (3) and then record number <1>.
<Save Data>
Save all data of the current experiment.
<Quit>
Exit WinControl-3.
<View>
<Results Panel> Controls the display of Box (5) via mouse click.
<Status Panel>
Controls the display of Boxes (7) to (9) via mouse
click.
<Warnings>
Ticking prompts the display of program starting
time and non-critical errors.
<Batch Window>
Opens batch file window. Batch files are small programs for automated operation of WinControl-3
compatible devices. Currently, the batch file utility
is not available for the JUNIOR-PAM.
<Accessories>
<Temperature Units>
Allows to toggle between °Celsius and °Fahrenheit as unit of
Temp* in Box (7), but does not affect the chart temperature ordinate.
<Record File> The command prompts WinControl-3 to continuously
save data and, thereby, minimize data loss in the case of program failure. Execution of <Record File> is indicated by a tick,
18
OPERATION OF THE JUNIOR-PAM
CHAPTER 5
<D>. Data are saved in the PAM data file format (filename.pam). If an existing file name is selected, a dialogue window appears which offers the options to delete the existing file
or to append the new data to data of the existing file.
5.1.2
Box (2) -Data Management and Graph Design
<Delete All Data> Delete current data (all records and report
data).
<Load> Delete the current data and load previously saved data.
Same function as <Load Data> in the <File> menu.
<Save> Save all records of the current experiment. Same function as <Save Data> in <File> menu.
<Print Chart> Print the current chart.
q
<Switch Grid on/off> Graph design command.
U
<View Symbols> Graph design command.
<View Lines> Graph design command.
<Float> Creates a floating chart window. Graph setFloat
tings and data display of the new chart are independent of the
WinControl-3 main window.
<Rec. Online> Checking initiates continuous recording of Ft, PAR* and Temp*. <Rec. Online> does not affect
the permanent feeding of the chard. For long-term measurements, <Rec. Online> may be turned off to keep data size reasonable.
D Rec. Online
5/s
<Sampling Frequency> The downward arrow gives
access to three different sampling frequencies: <5/s>, <1/s>, and
<1/10s>. The frequency setting affects only online data (Ft,
PAR*, and Temp*, see below). The highest sampling frequency
of <5/s> is available only for the Ft: sampling of PAR* and
Temp* occurs with <1/s> at most. The actual intervals between
19
CHAPTER 5
OPERATION OF THE JUNIOR-PAM
measurements vary depending on communication between
fluorometer and computer. The exact time points of measurements are recorded. Exported data correspond to online data
along with the exact time values.
Options
<Options> includes three menu items of which two
(<Zoom to Selection> and <Export Selection>) are available
only after having selected data in the chart. To select data, place
mouse cursor in the <Chart> area, move mouse cursor with left
mouse button pressed parallel to the x-axis across the data of interest: the selection will be highlighted. The options menu is
also available by placing the cursor within the selected area and
clicking the right mouse bottom. A single left-button click in the
chart area removes an existing selection.
<Export All> Export all graphed data (online and saturating pulse
analysis data) as CSV file which can be imported by most spread
sheet or graphing programs. Exact ms time scales are provided
for each measuring point.
<Zoom to Selection> Choosing the command increases time axis resolution according to your selection. The action can be reversed by
clicking in <Ax> button (Box 11).
<Export Selection> Export selected data as CSV file similarly as described above (compare <Export All>).
D View Sidebar
5.1.3
Controls display of Box (3)
Box (3) - Sidebar
Three Tabs (<Val.>, <Rec.> and <Chan.>) permit switching between
different sidebars.
<Val.> sidebar
In the <Val.> sidebar, all types of fluorescence measurements and data
calculated by WinControl-3 are represented by acronyms. The graphical
20
OPERATION OF THE JUNIOR-PAM
CHAPTER 5
presentation of data is controlled by checkboxes attached to the acronyms. In the sidebar, the data are distinguished into three groups,
<Online>, <SAT-Pulse>, and <Quench>.
Note that Chapter 6, Acronyms and Equations, provides detailed information on fluorescence measurements and equation used by WinControl-3.
<Online> data are continuously reported with the frequency defined in
Box (2) and the reservation reported above. The data group includes:
Ft
PAR*
Temp*
Chlorophyll fluorescence yield (relative units).
Photosynthetic active radiation (µmol photons · m-2 · s-1). In
the absence of an external quantum sensor, the PAR* is taken
from the <Int. PAR list> (see <Settings>). With a quantum
sensor connected to the JUNIOR-PAM and the <PAR*> in
Box (5) checked, the PAR* corresponds to the sum of the actinic intensity, as defined by the <Int. PAR list>, plus the data
of the external sensor. Note that the <Int. PAR list> data represent factory adjusted values which correspond to the PAR at 1
mm distance from the tip of a 400 mm JUNIOR-PAM fiber
optics, in the absence of external light. Therefore, different optical conditions require measurements of the actual photon
flux densities.
Temperature (°C). In the absence of an external sensor, temperature is measured by an internal integrated-circuit sensor.
<SAT-Pulse> data are recorded with light-exposed samples close to or
during application of strong light pulses. Specifically:
F’
Fm’
Fluorescence yield shortly before onset of a strong light pulse
(relative units).
Maximal fluorescence yield when photosystem II reaction centers are closed by a strong light pulse (relative units).
21
CHAPTER 5
Fo’
Y(II)
ETR
PAR
Temp
OPERATION OF THE JUNIOR-PAM
Minimum chlorophyll fluorescence yield in the presence of
open photosystem II reaction centers. The Fo’ is either calculated (see 6.1.2) or measured during far red illumination and
the actinic light switched off. Measuring of Fo’ fluorescence is
activated by ticking <Fo’-Mode> in Box (9).
Photochemical quantum yield of photosystem II; derived from
F’ and Fm’ measurements.
Electron transport rate (µmol electrons/(m2·s) derived from
Y(II) and PAR.
Photosynthetic active radiation (µmol photons/(m2·s).
Temperature (°C)
<Quench> data These types of data quantify fluorescence quenching
caused by photochemical energy use or non-photochemical
energy dissipation. All fluorescence parameter related to nonphotochemical quenching require both, saturating pulse analysis of the dark-acclimated and light-exposed leaf. Coefficients
of photochemical fluorescence (qP and qL) require fluorescence measurements with dark acclimated material only if Fo
is calculated (see 6.1.2).
qP
qL
qN
NPQ
22
Coefficient of photochemical fluorescence quenching.
Coefficient of photochemical fluorescence quenching assuming that the many photosystem complexes form a combined
light-harvesting antenna so that an absorbed photon becomes
available for many reaction centers (lake model). In comparison, the qP is more consistent with separated light-harvesting
antennae of photosystems (puddle model).
Coefficient of non-photochemical fluorescence quenching.
Non-photochemical fluorescence quenching: quantification of
non-photochemical quenching alternative to qN calculations.
The extent of NPQ has been suggested to be associated with
OPERATION OF THE JUNIOR-PAM
CHAPTER 5
the number of quenching centers in the light-harvesting antenna.
Y(NPQ) Quantum yield of non-photochemical fluorescence quenching
due to downregulation of the light-harvesting function.
Y(NO) Quantum yield of non-photochemical fluorescence quenching
other than that caused by downregulation of the lightharvesting function.
Note that Y(II)+ Y(NPQ)+ Y(NO)=1
<Rec.> sidebar
Clicking the button <New Record> starts a new record which is added
to the currently loaded data. The <Rec.> sidebar lists, as consecutive
numbers, each experiment recorded since program start or since the last
time the command <Delete All Data> was carried out. Each record can
be selected, and displayed in the chart, by clicking on the record number.
Note: when induction and light curves are displayed, the <Rec.> sidebar
lists the presently loaded induction curves (IC) and light curves (LC),
respectively. New induction or light curves are initiated by starting the
corresponding automated exposure program (Box (9)). Several induction or light curves can be carried out during a single record.
<Chan.> sidebar
The <Chan.> sidebar lists all WinControl-3 compatible devices connected via USB to the computer. Note: only one JUNIOR-PAM can be
operated by WinControl-3 at a time but the combination of 1 JUNIORPAM and other WinControl-3 compatible devices (higher-order PAM
fluorometers or the light meters) is possible.
5.1.4
Box (4) - SAT Pulse Analysis
The headline of Box (4) displays the number of the device connected.
With the JUNIOR-PAM connected, the headline reads <Results (#1)>.
23
CHAPTER 5
OPERATION OF THE JUNIOR-PAM
Also, three groups of saturating pulse data are displayed in Box (4).
Group 1 (Fo, Fm, Fv/Fm) includes data measured with a darkacclimated sample before light-exposure but Group 3 (F´ to Fo´) represent data obtained during illumination. Group 2 represents fluorescence
parameters characterizing the state of photosynthesis in the light. Some
of the Group 3 data, however, require fluorescence measurements with
the dark-acclimated sample that is Group 1 data.
Group 1 Fluorescence data from a dark-acclimated sample with actinic
light switched off.
Fo
Fm
Fv/Fm
Basic fluorescence yield (relative units) recorded with low
measuring light intensities.
Maximal chlorophyll fluorescence yield when photosystem II
reaction centers are closed by a strong light pulse (relative
units).
= (Fm-Fo)/Fm; maximum photochemical quantum yield of
photosystem II.
Group 2 The group includes data of qP, qL, qN, NPQ, Y(NPQ), and
Y(NO) and, thus, matches the group of <Quench> data in the
<Val.> sidebar (see above). If Fo’ is calculated (see 6.1.2), calculations of all 6 types of data require both, initial fluorescence determinations with the dark-acclimated sample and
saturating pulse measurements during exposure. If Fo´-Mode
is checked, the Fo´ is measured, and, thus, Fo or Fm fluorescence data are not required for calculations of qP of qL (see
Table 6.1).
Group 3 The group corresponds to the <SAT-pulse> data in the <Val.>
sidebar (see above) and includes F’, Fo’ and Fm’ of the last
saturating pulse analysis during light exposure but also data of
Y(II), PAR and ETR. Note that a tilde as prefix of value of Fo’
indicates the Fo’ is calculated as described in 3.2 and not
24
OPERATION OF THE JUNIOR-PAM
CHAPTER 5
measured during an post-pulse interval with only the far red illumination switched on (Fo’-Mode, Box (7)).
5.1.5
Box (5) - Online Data
Online data in Box (5) represent digital values of current measurements
of the <Online> data introduced above (see <Val.> sidebar). Checking
the PAR* will add the PAR measured by an external quantum sensor to
the currently selected actinic PAR of the JUNIOR-PAM light intensity
as defined in the internal PAR list. Therefore, in the absence of external
light measurement, the PAR* in Box (5) corresponds to the actinic light
of the JUNIOR-PAM. In the case of the JUNIOR-PAM, the UBat indicates the voltage supplied by the USB socket.
5.1.6
Box (6) - SAT-Pulse Trigger
In Box (6), both, the <Fo, Fm> and the <SAT> button, manually releases a saturating light flash of interval and intensity defined in <Settings>. Clicking the <Fo, Fm> determines the fluorescence yields <Fo>
and <Fm>. By definition, the <Fo> and <Fm> levels are properties of
dark-acclimated photosynthesis. With light-exposed samples, saturating
pulse analyses is initiated by the <SAT> button to determine F’, Fo’ and
Fm’. In total, WinControl-3 derives 9 different fluorescence quotients
from the 5 types of fluorescence yield (see Box (3) and Box (4)).
Box (6) displays the current value of Y(II)=(Fm’-F’)/Fm’ together with
the corresponding fluorescence trace during saturating pulse analysis. In
the graph, dashed lines indicate the levels of Fm’ and F’ used for Y(II)
calculation. The graph is viewed enlarged after clicking the <Graph>
tab.
5.1.7
Box (7) - Experimental Parameters and Procedure
Box (7) includes 3 groups of commands which determine different aspects of experimental procedures: the <Status>, <Basics>, and <Program> field: tabs allow switching between the latter two fields.
25
CHAPTER 5
OPERATION OF THE JUNIOR-PAM
<Status>
The <Status> field provides access to the 7 central functions of the JUNIOR-PAM fluorometer. A checkbox is associated with each function
listed. Checkboxes represent on-off switches but they also report the
status of measuring and actinic light when the WinControl-3 software
runs the JUNIOR-PAM automatically. Settings of all 7 fluorimeter functions are stored on a microcontroller in the JUNIOR-PAM fluorometer
and kept until power supply is disconnected.
The fluorometer functions are:
<Meas. Light> Low frequency measuring light.
<ML-F high> High frequency measuring light. To become active,
<Meas. Light> needs to be checked. Note that measuring light
changes automatically to high frequencies at actinic light intensities
higher than level 3 and during saturating light pulses.
<SAT-Pulse> The commend initiates a saturating pulse analysis to determine F’, Fo’ and Fm’: hence, the <SAT-Pulse> function corresponds to that of <SAT> in Box (6).
<Act. Light> Actinic light.
<Far Red> Far Red Light.
<Fo’-Mode> Follow up a saturating pulse with an interval with actinic
light switched off and far red illumination switched on, and take the
fluorescence yield measured at the end of this interval as Fo’ fluorescence.
<Clock> Trigger a process with the interval defined as <Clk. Width> in
the <Basic> field (this Box) or in <Settings> (see below). Also, the
event to be triggered is defined in <Settings>.
26
OPERATION OF THE JUNIOR-PAM
CHAPTER 5
<Basic>
The <Basic> window permits adjustments of the level of PAR (<Act.
Int>) and the clock interval (Clk. Width). Similarly as settings in the
<Status> window, the <Basic> adjustments are stored in the JUNIORPAM fluorometer. Also, the lowermost line of the <Basic> window
states the WinControl-3 compatible instruments connected to the computer. If the JUNIOR-PAM is the sole WinControl-3 compatible instrument, the instrument display is invariable. Further, the <Memory:> window (lowermost line) reports the number of data sets recorded divided
by 1000. Data set numbers greater than 100 k might compromise the efficiency of WinControl-3, depending on the computer used. The accumulation of huge data set numbers during long-term measurements can
be avoided by switching off the <Rec. Online> (Box (2)).
The adjustable parameters of the <Basic> window are:
<Act. Int> 12 levels of PAR can be selected by clicking the up or down
arrow in the <Act. Int> line. In the same line, the corresponding PAR
(in µmol photons/(m2·s)) is displayed. Note that the PAR intensities
represent factory values which were established at 1 mm distance
from the tip of a 400 mm JUNIOR-PAM fiber optics, in the absence
of external light. Therefore, different optical conditions require
measurements of the actual photon flux densities.
<Clk. Width> Clock widths from 10 seconds to 50 minutes can be selected by clicking the arrow buttons in the line of <Clk. Width>.
<Program>
The commands in the program field start various exposure regimes. Except batch runs, all programs can be clock-triggered and their exact behavior is defined in the <Settings> window (see section 3.7). Short descriptions of the routines are given next.
27
CHAPTER 5
OPERATION OF THE JUNIOR-PAM
<Act.+Yield> Illuminate with actinic light and perform a saturating
pulse analysis at the end of illumination.
<Induct. Curve> Determine Fo and Fm and, subsequently, illuminate
sample with constant light intensity and repeatedly carry out saturating pulse analyses.
<IC +Recov.> Same as <Induct. Curve> but followed by a dark phase
with saturating pulse analysis performed at increasing pulse intervals.
<Light Curve> Determine Fo and Fm and illuminate sample with 8 increasing light intensities. Perform a saturating pulse analysis at the
end of each light step.
<LC +Recov.> Same as <Light Curve> but followed by a dark phase
with saturating pulse analysis performed at increasing pulse intervals.
<Batch> Run exposure program as defined by a batch file (Currently not
available for JUNIOR-PAM fluorometers).
5.1.8
Box (8) - Graph Type and Fluorometer Settings
<Induct. Curve> and <Light Curve> Clicking the latter tabs gives access
to alternative graphic representations of slow kinetics data. Only data
acquired with induction curve or light curve programs are displayed
in the <Induct. Curve> and <Light Curve> windows.
<SAT Graph> The window displays graphs of fast fluorescence kinetics
during saturating pulse analysis. Specific regions in the slow kinetics
<Chart> graph can be linked to fast fluorescence changes: selecting
slow kinetics data, using the mouse with left button pressed, will
highlight the corresponding fast kinetics in the <SAT Graph> window.
<Report> The window displays numerically the results of saturating
pulses analyses. Analogously as described for <SAT Graph>, high28
OPERATION OF THE JUNIOR-PAM
CHAPTER 5
lighting data in the <Chart> graph will highlight the corresponding
lines in the report data.
<Batch> Loading of preprogrammed batch files is carried out using this
window (Currently not available for JUNIOR-PAM fluorometers).
<Settings> The <Settings> window provides the commands required for
full control of JUNIOR-PAM performance.
5.1.9
Box (9) - Axis Control
▲
▼
<Manual Ordinate Scaling> Scaling of the ordinate (y-axis) can be
manually adjusted by clicking the upward or downward pointing
arrows in Box (9). Manual adjustment affects only the currently selected
ordinate (see subsequent comments to Box (10)). This means that various ordinates can be individually scaled. Manual scaling in combination
with the vertical scroll bar at the right chart border permits flexible positioning of data.
Ay
<Automatic Ordinate Scaling> The command scales all data
which are selected in Box (3) so that they fit on the chart.
◄►
<Manual Abscissa Scaling> Clicking the horizontally pointing
arrows changes scaling of the abscissa (time axis). At increased time
axis resolution, experimental data can be scrolled using the scroll bar on
top of the chart area, or by placing the mouse pointer inside the chart
and turning the mouse wheel.
Time:
rel
abs Normally, the chart ordinate is a relative time
scale starting at 0. Checking <abs> prompts the display of absolute data
including data and time of the day. Both, relative and absolute time data
are saved when chart data are exported.
<Automatic Abscissa Scaling> Scales the time axis so that the
Ax
entire record fits into the chart.
<Automatic Ordinate and Abscissa Scaling>
Autoscale
Clicking the <Autoscale button> displays all graphed data on the chart.
29
CHAPTER 5
OPERATION OF THE JUNIOR-PAM
Table 5.1: Chart Ordinate Types
Ordinate label, unit
Parameters scaled
ETR, µmol / (m2 · s)
F, counts
NPQ, dimensionless ratio
PAR, µmol / (m2 · s)
Quench, dimensionless ratio
Temp., °C
Yield, dimensionless ratio
ETR
Fo, Fm, Ft, Fo’, F’, Fm’
NPQ
PAR*, PAR
qN, qP, qL
Temp*, Temp
Fv/Fm, Y(II), Y(NO), Y(NPQ)
5.1.10 Box (10) - Ordinate Selection and Text Field
▼
Clicking the downward arrow in Box (10) displays 7 different
ordinate scales used for the various categories of data available. An ordinate can be picked by clicking with the mouse on one of the list items.
Table 5.1 provides a summary of ordinate labels and associated parameters. Also, Box (10) provides a text field to note down key information
of your experiment. Each record can be labeled differently, and additional text fields are available for each induction or light curve.
5.1.11 CHART - Selecting Data
As described above, to select a section of graphed data, click with the
left mouse button on the left border of the target data, and move the
mouse with the left button held down to the right border of target data.
Releasing the mouse button will highlight the selection made.
Selection in the <Chart> window highlights the corresponding data in
the <SAT Graph> and <Report Window>. Similarly, data selected in the
<Report Window> will are highlighted on the <Chart>. Therefore, data
selection is able to connect different representations of the same data
and, thus, facilitates linking between primary fluorescence data and derived fluorescence coefficients.
30
OPERATION OF THE JUNIOR-PAM
5.2
CHAPTER 5
Induction Curve Window
Generally, control buttons and checkboxes of the <Induct. Curve> window work as described for the <Chart> window.
The <Induct. Curve> window displays fluorescence induction curves,
and combinations between fluorescence induction and recovery curves
provided that the curves were automatically recorded by execution of
<Induct. Curve> or <IC+Recov.> programs, respectively. The <Rec.>
panel of the sidebar (Box (3)), lists the induction curves present as ascending numbers with prefix IC. Curves can be selected by left-clicking
on the curve number. Thereafter, sequential viewing of “IC curves” is
possible by using the up/down arrows keys on the computer keyboard.
The parameters of <Induct. Curve> or <IC+Recov.> programs can be
configured in the <Settings> window.
5.3
Light Curve Window
Time
PAR
With <PAR> checked, the <Light Curve>
window displays “Rapid Light Curves” recorded by the <Light Curve>
or <LC+Recov.> programs (Box 7) using PAR (photosynthetic active
radiation, µmoles photons/(m2 · s)) as the abscissa data.
The Rapid Light Curve function of WinControl-3 employs 8 increasing
light levels which correspond to 8 neighboring levels of the 12-partite
internal PAR list displayed in the <Settings> window. The intensity
range of the light curve and the time interval allotted to each intensity
level can be adjusted in the <Settings> window. The <Rec.> panel of the
sidebar (Box (3)), lists the light curves present as numbers with prefix
LC. The <Online> data <Ft>, <PAR*>, and <Temp*> are not available
in a light curve diagram but can be displayed by choosing experimental
time as abscissa data by checking <Time>.
The <Sidebar> in the <Light Curve> window offers the control functions introduced before. Additionally, the <Val.> panel controls the display of two different regression graphs denoted <REG1> and <REG2>.
31
CHAPTER 5
OPERATION OF THE JUNIOR-PAM
These graphs result from fitting two different empirical functions to data
of ETR versus PAR: the <REG1> function can exhibit lower ETR values at high compared to intermediate PAR data but the <REG2> function is always a monotonically nondecreasing (see 6.4).
5.4
SAT Graph Window
The SAT graph window displays all fluorescence transients recorded
since start of WinControl-3 or since <Clear All Data> was executed.
Figure 5.2 depicts the SAT Graph window divided into eight numbered
boxes and the SAT Graph Panel. Numbering and functionality of boxes
is identical to Figure 5.1 except boxes (2) and (3).
5.4.1
Box (2) – Data Management
The <Options> button includes three menu items of
Options
which two (<Jump to Selection> and <Delete Selected Data>) are only
available if saturating pulses have been selected on the <Chart> or in the
<Report> data table. In the SAT graph window, selected fluorescence
curves are shown with blue background color (see Fig. 5.2). The three
menu items are:
<Follow Selection> When <Follow Selection> is checked, the SAT
Graph window automatically displays the fluorescence transients
selected in the <Chart> window or <Report> data.
<Jump to Selection> displays the previously selected saturating pulse
data.
<Delete Selected Data> Delete saturating pulse and online data associated with the highlighted graphs.
32
OPERATION OF THE JUNIOR-PAM
5.4.2
CHAPTER 5
Box (3) – Sidebar
D View Sidebar
<View Sidebar> controls the display of the
sidebar. Two different sidebar types are available: the <Val.> and the
<Chan.> sidebar. Checkboxes on the <Val.> sidebar affect the display of
data: selected data are displayed as numerical values below each fluorescence transient in the SAT graph panel. The <Chan.> sidebar lists all
WinControl-3-compatible instruments connected to the computer.
Figure 5.2: WinControl-3 - SAT Graph Window
33
CHAPTER 5
5.4.3
OPERATION OF THE JUNIOR-PAM
SAT Graph Panel
The SAT Graph panel represents each saturating pulse analysis by a protocol panel and a graphics window.
The protocol panel lists the exact time point of the saturating pulse
analysis, as well as its numerical order in the current experiment and its
line number in the report table (<Nr:> and <Rep. Nr:>, respectively). A
single fluorescence trace can be selected by a double-click into the protocol window. Selection highlights the graph and moves it to the top of
the Sat Graph panel. Also, the respective data line in the report data is
accentuated.
Individual graphs depict fluorescence traces during saturating pulses.
Each record start 150 ms before pulse begin and lasts for 2.4 s. Fluorescence traces are automatically scaled to fit into the coordinate systems.
Also, values of F´ and Fm´ are shown as dashed horizontal lines.
A series of fluorescence transients can be quickly looked over by using
window’s scroll bar or, with the mouse pointer located inside the SAT
graph panel, by turning the mouse wheel.
5.5
Report Window
The report window logs all data associated with saturating pulse analyses. The boxes (11) to (13) indicated in Fig. 5.3 include specific functions for handling of <Report> data as explained below.
5.5.1
Box (11) - Data Management
Clicking the <Print Report> button opens the printer dialogue
window from which printing of all parameters present in the <Report
Data Field> is initiated. The parameters printed are identical to the parameters displayed in the <Report> table. Parameter selection is controlled by the checkboxes in the <Val.> sidebar. In Box (11), the buttons
for data handling (<Clear>, <Open> and <Save>) have their usual function.
34
OPERATION OF THE JUNIOR-PAM
CHAPTER 5
Clicking on the <Options> button or right-clicking
Options
in the <Report Data Field> opens the <Options> menu. Checking <Follow Selection> in the <Options> menu automatically displays selected
data in the <Report Data Field>. Data can be selected in the <Chart>
window as described above (see 5.1.11) or in the <Report Data Field>
by moving the mouse cursor with left mouse button pressed across data
lines.
Provided that data have been selected, the <Jump to Selection> command is available which moves selected data into the <Report Data
Field>.
Figure 5.3: WinControl-3 - Report Window
35
CHAPTER 5
OPERATION OF THE JUNIOR-PAM
Printing report data
The <Options> menu includes the command <Print Report> and
two extra print options:
<Page Setup for Printing> Adjust page design settings.
<Preview Printing> Show the appearance of the printout.
Provided that data have been selected, two additional print commands are available.
<Preview Print Selection> Visualize the print design of selected data.
<Print Selected Data> Print only selected data.
Export report data
Similar as described for printing, the parameters exported can be
selected by the checkboxes on the sidebar. In analogy to the print
commands:
<Export All> exports all data in CSV (comma separated values) format
which can be imported into most spread sheet programs and
<Export Selected Lines> exports only the selected data.
Table 5.2: Report Data - Abbreviations
D
F
FO
REG1
REG1
SCHS
SICE
SICS
SLCE
SLCS
36
Identification of device: number, type and user annotation (see 5.6.1)
SAT Normal operation and saturating flash
Fo, Fm determination
Parameters of regression 1 (see 6.4)
Parameters of regression 2 (see 6.4)
Start of new record/Chart start
End of induction curve
Start of induction curve
End of rapid light curve
Start of rapid light curve
OPERATION OF THE JUNIOR-PAM
5.5.2
CHAPTER 5
Box (12) - Report Data Field
In addition to the parameters chosen from <Display Control> (Box
(13)), the report data document time of action and type of data. Table
5.2 summarized the abbreviations used to log data types.
5.6
Settings Window
The <Settings> window controls the function of the JUNIOR-PAM’s
LEDs as well as the performance of preprogrammed fluorescence experiments (see 5.1.7).
5.6.1
Box (14) - Instrument Name & Reset
<Reset Settings> deletes all changes made in the settings window
and restores factory default settings. Box (14) includes two text windows. The left one is read-only information but up to 20 characters can
Figure 5.4: WinControl-3 - Settings Window
37
CHAPTER 5
OPERATION OF THE JUNIOR-PAM
be typed into the right text box. The content of the latter box is stored as
additional instrument identifier on the JUNIOR-PAM. The contents of
both text windows are written in the first line of each record file.
5.6.2
Box (15) - Measuring Parameters
<Meas. Light>
Measuring “pulses” are delivered at 5 Hz (if actinic
light is switched off or the actinic light level is smaller than 4) or at 100
Hz (after manual selection, during saturating pulses or at actinic light
levels higher than 3). Each “pulse” can include 1 to 5 “flashes”. The
numbers of “flashes”/”pulse” is adjusted in the <Freq.> field. The relative intensity of a single “flash” is set in the <Int.> field. Note that an
increase in flash intensity normally increases the Fo fluorescence level.
An increase in the numbers of flashes/pulse increases the Fo level only
if some PS II reaction become closed by the now higher integrated
measuring light intensity. In this case, the flash intensity needs to be reduced.
<System Pars.>
Two signal amplifications are available in the <Gain> field: the higher
gain level (level 2) results in about threefold increased fluorescence values than the lower one. The <ETR-F.> is used fore calculations of electron transport rates (see section 6.3). The <ETR-F.> corresponds to the
number of photosynthetically effective quanta absorbed by the sample
relative to the number of photosynthetically effective incident quanta.
<Clock>
The clock utility executes repetitively one out of 6 different functions:
saturating pulse analysis and 5 preprogrammed sequences
(<Act.+Yield>, <Induct. Curve>, <IC +Recov.>, <Light Curve> and
<LC +Recov.>). The interval time can be adjusted between 10 s and 50
min depending on the action triggered and experimental demands.
38
OPERATION OF THE JUNIOR-PAM
5.6.3
CHAPTER 5
Box (16) - Light Parameters
<SAT-Pulse>
The typical maximum (level 12) PAR value is
10000 µmoles/(m2·s). 12 different intensity
levels are available with level 1 corresponding
to about 70% of maximum saturating pulse
intensity. Pulse width can be adjusted from 0.2
to 2 seconds. The <SAT-Pulse> defaults
(intensity level 12 and 0.6 seconds pulse
width) work well with most samples that is the fluorescence transient
reaches a plateau and does not drop at the end of the saturating pulse interval.
<Actinic Light>
12 actinic light levels are available. At a distance of 1 mm from the tip
of the 400 mm JUNOIR-PAM light fiber, the values for PAR of the <Internal PAR> list (in µmoles/(m2·s)) apply. Note that damage to the light
fiber or long-term used LEDs can decrease light output by the JUNIORPAM.
<Far Red Light>
Different from saturating pulses, width of far red illumination is adjustable between 2 and 30 seconds and the 12 far red intensity levels regulate intensity from 10% (at level 1) to 100% (at level 12) of full power.
The default values for intensity and far red illumination (level 10 and 6
seconds, respectively) work well with most leaves. During adjustments
of far red illumination, the effects on the level of Fo´ fluorescence needs
to be observed carefully and short illumination periods should be preferred over longer ones.
39
CHAPTER 5
5.6.4
OPERATION OF THE JUNIOR-PAM
Box (17) - Program Parameters
<Act. +Yield>
<Width> determines the time interval of sample illumination with actinic light of the intensity selected under <Light Parameters>. Always, a
saturating pulse analysis is carried out at the end of actinic illumination.
Checking <With Initial Pulse> causes saturating pulse analyses at start
and end of the time interval of actinic illumination.
<Induct. Curve>
Time courses of fluorescence induction curves are determined by three
parameters: <Delay> indicates the dark time interval between determination of Fo and Fm with dark-acclimated material, and onset of actinic
illumination. The delay time can be adjusted between 5 seconds and 10
minutes. Default value is 40 seconds. <Width> is the time interval between saturating pulse analyses during fluorescence induction and
<Length> determines the number of saturating pulses analyses carried
out. Therefore, the time interval of actinic illumination in a fluorescence
induction experiment is approximately given by <Width> times
<Length>. Fluorescence recovery measurements under dark conditions
can be appended to the induction curve by choosing <IC + Recov> (see
5.1.7). During fluorescence recovery, time points of saturating pulse
analyses are set automatically.
<Light Curve>
Always, 8 levels of consecutively increasing actinic light intensities are
applied when a light curve program is carried out (see 5.1.7). Therefore,
the time course of a light curve is determined by only two parameters:
<Width> determines the time interval (5 seconds to 10 minutes) of each
light step, and <Int.> defines the initial intensity level of actinic illumination. In the case of a subsequent recovery curve, time points of saturating pulse analyses are chosen automatically.
40
OPERATION OF THE JUNIOR-PAM
5.6.5
CHAPTER 5
Box (18) - PAR-List & LED
Box (18) Lists the photon flux data of actinic light levels. See 5.6.3 for
comments on actinic light intensity.
<Sign. LED active>
The checkbox associated with <Sign. LED active> switches the LED on
the JUNIOR-PAM front panel on and off. Signal codes of the LED are
compiled in Table 5.3.
Table 5.3: LED Signal Code
LED Color
Frequency Process
M e a s u r i n g m o d e
green
1 Hz
Normal operation
green/red alternating 1 Hz
Normal operation and clock running
red
1 Hz
Normal operation and actinic light
red
continuous
Normal operation and saturating flash
Additional codes during firmware update
green/red alternating high
Waiting for software
red
continuous
Update running
5.7
System Setting
Normal operation of the JUNIOR-PAM does not require changes of system setting. In case system settings have been altered, default setting can
be restored using the button <Reset System Settings>.
<Ext. PAR-Sensor> and < Ext. Temp. Sensor > If a quantum or temperature sensor is connected to the JUNIOR-PAM, data input can be
adjusted via <Offset> and <Gain> settings.
<F-Offset> The number displayed corresponds to the counts of the false
signal level which is subtracted from all fluorescence signals.
False signal can originate from internal electronic "pick-up" and
41
CHAPTER 5
OPERATION OF THE JUNIOR-PAM
from traces of scattered measuring light which reach the photodetector.
<Trim Values> Factory adjustments.
<Fm-Corr.> In the JUNIOR-PAM, the same blue LED emits measuring,
actinic and saturating light. During the high intensities required
for Fm or Fm´ determination, the LED warms up resulting in
some decrease in output. The decreased output affects fluorescence measurements. The <Fm-Corr.> function is used to correct
for such temperature artefacts. <Fm-Corr.> can be adjusted using
the JUNIOR-PAM fluorescent standard. By using the standard,
correct adjustment is achieved when the levels of F’ and Fm’ are
equal.
<Meas. Light> Adjustment of measuring light. The factory-set value for
<Meas. Light>, in combination with the of intensity variations
available, works with virtually all photosynthetic samples.
<Act. light> The <Act. light> function permit the adjustment of the
JUNIOR-PAM’s actinic light intensities to match the internal PAR
list. The setting is carried out at maximum intensity in comparison
with a calibrated quantum sensor. Usually, one-point adjustment
is sufficient because the relationships between the 12 levels of actinic light intensities is rather stable for a given value for <Act.
light>.
42
ACRONYMS AND EQUATIONS
6
Acronyms and Equations
6.1
Relative Fluorescence Yields
CHAPTER 6
Typically, five different types of fluorescence yields are acquired by
saturating pulse analyses. Two of these yields need to be established
with the dark-acclimated sample. The three remaining yields are repeatedly measured during subsequent sample treatments, for example, exposure to actinic light (see Figure 6.1).
6.1.1
Measurements with Dark-acclimated Samples
F0
Minimum fluorescence level excited by very low intensity of
measuring light to keep PS II reaction centers open.
FM
Maximum fluorescence level elicited by a strong light pulse
which closes all PS II reaction centers.
Figure 6.1: Measurements for Saturating Pulse Analysis. AL, actinic light; D,
dark; SP, saturating pulse; FR, far-red illumination.
43
CHAPTER 6
ACRONYMS AND EQUATIONS
6.1.2
Measurements with Light-exposed (Treated) Samples
F0 ´
Minimum fluorescence level during a treatment: in the
<F0´-Mode>, F0´ fluorescence levels are attained after a saturating pulse during a dark interval in which PS I is selectively
driven by far-red light to quickly drain off intersystem electrons,
and, thus, to open PS II reaction centers (see Fig. 6.1, time 75 s).
Alternatively, the F0´ is estimated according to Oxborough and
Baker (1997):
F0′ = 1 (1 F0 − 1 FM + 1 FM′ )
FM´
Maximum fluorescence levels during a treatment is induced by a
applying saturating light pulse with temporarily closes all PS II
reactions centers.
F´
The F’ is the level of the fluorescence curve (Ft) during treatments and shortly before a saturating pulse is applied.
6.2
Fluorescence Quenching Coefficients
To quantify photochemical use and non-photochemical losses of absorbed light energy, fluorescence quotients have been derived which use
as data input the relative fluorescence yield measurements introduced
above. Table 6.1 compiles the fluorescence quotients available in WinControl-3. Subsequently, these fluorescence quotients will be briefly explained.
FV/FM and Y(II) Maximum and effective photochemical quantum
yield of PS II
Both fluorescence quotients estimate the fraction of absorbed quanta
used for PS II photochemistry, i.e., for stable charge separation in the
PS II reaction center. For measurements of FV/FM, it is important that
samples are well-acclimated to dark conditions so that all reactions centers are in the open state and non-photochemical dissipation of excitation energy is minimal. Requirements for dark acclimation can differ be44
ACRONYMS AND EQUATIONS
CHAPTER 6
tween plants: in extreme shade leaves, substantial closure of PS II centers can occur already at PAR values of 0.1 μmol photons/(m2·s) but
many sun leaves exhibit mostly open PS II centers even at 10-40 μmol
μmol photons/(m2·s).
Table 6.1: Fluorescence Quotients.
Source
Maximum photochemical quantum
yield of PS II (Kitajima and Butler,
1975)
Effective photochemical quantum
yield of PS II (Genty et al., 1989)
Coefficient of photochemical fluorescence quenching (Schreiber et al.
1986 as formulated by van Kooten
and Snel, 1990)
Coefficient of photochemical fluorescence quenching assuming interconnected PS II antennae (Kramer et al.
2004)
Coefficient of photochemical fluorescence quenching (Schreiber et al.
1986 as formulated by van Kooten
and Snel, 1990)
Stern-Volmer type non-photochemical fluorescence quenching (Bilger
and Björkman, 1990)
Equation
FV
F − F0
= M
FM
FM
Y ( II ) =
qP =
FM′ − F ′
FM′
FM′ − F ′
FM′ − F0′
qL = qP ⋅
F0′
F′
qN = 1 −
FM′ − F0′
FM − F0
NPQ =
FM
−1
FM′
1
Quantum yield of non-light induced Y ( NO ) =
F
non-photochemical
fluorescence
NPQ + 1 + qL ⋅ ( M − 1)
quenching (Kramer et al. 2004)
F0
Quantum yield of light-induced (ΔpH
and zeaxanthin-dependent) nonphotochemical fluorescence quenching (Kramer et al. 2004)
Y ( NPQ) = 1 − Y ( II ) − Y ( NO)
45
CHAPTER 6
ACRONYMS AND EQUATIONS
The Y(II) estimates the photochemical use of excitation energy in the
light. To derive from the Y(II) information on the overall state of photosynthesis, control of light conditions is required because a leaf may be
severely damaged in Calvin cycle activity and still show a high value of
Y(II) in weak light. Therefore, photosynthetic performance should be
assessed during steady state illumination at a photon flux density which
is somewhat below saturation in a control sample.
qP and qL
Coefficients of photochemical fluorescence quenching.
Both parameters estimate the fraction of open PS II reaction centers. The
qP is based on concept of separated PS II antennae (puddle model) but
the qL assumes interconnected PS II antennae (lake model) which appears the more realistic situation in leaves (cf. Kramer et al., 2004). Determinations of qP an qL do not require fluorescence measurements with
the dark-acclimated sample except the F0´ is calculated (<Fo´-Mode>
unchecked) according to Oxborough and Baker (1997) (see 6.1).
qN and NPQ Parameters of non-photochemical quenching
Both parameters are associated with non-photochemical quenching of
excitation energy by thylakoid lumen pH- and zeaxanthin-dependent
processes. In contrast to previous fluorescence quotients, calculations of
the qN and the NPQ parameters always require fluorescence measurements with the sample in the dark-acclimated and in the light-exposed
state (see Table 6.1). Calculation of NPQ (or SVN; Gilmore and Yamamoto, 1991) corresponds to the Stern-Volmer equation for fluorescence
quenching which predicts proportionality between fluorescence quenching (NPQ) and concentration of fluorescence-quenching centers in the
photosynthetic antennae (e.g. zeaxanthin).
Y(NO) and Y(NPQ) Yields of non-photochemical quenching
Based on lake-type organization of photosynthetic antennae, Kramer et
al. (2004) derived the parameter Y(NPQ) to quantify the fraction of excitation energy which is dissipated as heat via photo-protective mecha46
ACRONYMS AND EQUATIONS
CHAPTER 6
nisms: the yield of all other non-photochemical losses is given by the
parameter Y(NO). Finally, the yields of photochemistry and nonphotochemical losses equal 1:
Y(II)+Y(NPQ)+Y(NO)=1
6.3
Relative Electron Transport Rate (ETR)
Relative electron transport rates are calculated according to:
ETR = PAR · ETR-Factor · PPS2/PPPS · Y(II).
The basic idea of the ETR equation is to multiply, Y(II), the effective
photochemical quantum yield of PS II, by an estimate for the photon
flux density absorbed by PS II. The letter approximation uses three parameters which are explained below:
PAR
Photosynthetic active radiation
To calculate ETR, WinControl-3 uses the PAR values of the JUNIOR
PAM’s internal PAR list which apply only with a 400 mm fiber and a
distance between sample and fiber tip of 1 mm. For other illumination
conditions, the PAR entering ETR calculations does not apply. Also, decreased LED output after long-term use or defective light fiber might affect the PPDF delivered by the JUNIOR-PAM. In any case, when external light sources are used, the PPDF needs to be measured using an appropriate quantum sensor. In the latter cases, ETR calculations requires
export of Y(II) data into a spread sheet program.
ETR-Factor
Absorptance of photons by photosynthetic pigments
The ETR-Factor corresponds to the ratio of photons absorbed by photosynthetic pigments to incident photons. The WinControl-3 default value
for the ETR-Factor is 0.84 which matches reasonably well the average
absorptance in the visible range (400-700 nm) of many green leaves.
However, at 450 nm, the peak wavelength of the JUNIOR-PAM actinic
light, leaf absorptance is close to 0.9, but the presence of anthocyanins
47
CHAPTER 6
ACRONYMS AND EQUATIONS
can reduce availability of blue photons for photosynthesis (Pfündel et al
2007). Hence, the ETR-Factor is variable and this variability needs to be
considered when different samples are compared.
PPS2/PPPS Photons absorbed by PS II relative to photons absorbed by
photosynthetic pigments.
WinControl-3 uses 0.5 as default value for PPS2/PPPS. The value of 0.5 is
reasonable if one assumes the presence of only linear electron transport
and, hence, equal electron transport rates in PS I and PS II, and comparable photochemical quantum yields of PS I and PS II under strongly
light-limiting conditions.
6.4
Light Curves
The measuring program <Light Curve> exposes the sample to increasing intensities of actinic illumination. Usually, the time interval of each
intensity level is too short for full equilibration of photosynthetic reactions. Therefore, these so-called “Rapid Light Curves” (RLC) provide
information on the present state of photosynthesis and they should not
be confused with classical photosynthetic light response curves in which
photosynthetic rates under steady state conditions are plotted against
light intensities. By plotting ETR versus PAR (see previous section),
Rapid Light Curves provide subsequent key parameters:
• α, electrons/photons: Initial slope of RLC which is related to quantum efficiency of photosynthesis.
• ETRm, µmol electrons/(m2 · s): Maximum electron transport rate.
• EK, µmol photons/(m2 · s): Minimum saturating irradiance.
WinControl-3 uses two empirical functions to estimate these cardinal
data: the functions <REG1> and <REG2> which have been introduced
by (Platt et al., 1980) and (Jassby and Platt, 1976), respectively, to describe classical light response curves of photosynthesis (Figure 6.2).
48
ACRONYMS AND EQUATIONS
CHAPTER 6
<REG1> In case of <REG1>, the α results from fitting
ETR = ETRmPot ⋅ (1 − e
−
α ⋅PPFD
ETRmPot
)⋅e
−
β ⋅PPFD
ETRmPot
to the light curve data using the Levenberg-Marquardt algorithm. Also,
Figure 6.2: Model Functions of Rapid Light Curves.
49
CHAPTER 6
ACRONYMS AND EQUATIONS
the fitting procedure yields estimates for β, the “photoinhibition parameter“(Platt et al., 1980), and ETRmPot, the maximum potential lightsaturated electron transport rate.
Platt et al. (1980) suggested to quantify photoinhibition by the
“Photoinhibition Index” (Ib = PAR required to photoinhibit ETRmPot by
the factor of 1/e) according to:
I b = ETRmPot β
With the results from curve fitting, WinControl-3 computes the ETRm
and EK according to:
ETRm = ETRmPot ⋅ (
α
α +β
)⋅(
β
α +β
)
β
α
and EK =
ETRm
α
.
<REG2> The function <REG2> is monotonically nondecreasing and,
hence, does not allow for photoinhibition:
ETR = ETRm ⋅ tanh(
α ⋅ PPFD
ETRm
)
Here, the α and ETRm are estimated by the fitting procedure. With the
latter two parameters, the EK is calculated as described above.
6.5
Literature Cited in Chapter 6
Bilger W, Björkman O (1990) Role of the xanthophyll cycle in photoprotection elucidated by measurements of light-induced absorbance
changes, fluorescence and photosynthesis in leaves of Hedera canariensis. Photosynth Res 25:173-185
Genty B, Briantais J-M, Baker NR (1989) The relationship between the
quantum yield of photosynthetic electron transport and quenching of
chlorophyll fluorescence. Biochim Biophys Acta 990: 87–92
50
ACRONYMS AND EQUATIONS
CHAPTER 6
Gilmore AM, Yamamoto HY (1991) Zeaxanthin formation and energydependent fluorescence quenching in pea chloroplasts under artificially
mediated linear and cyclic electron transport. Plant Physiol 96: 635–643
Jassby AD, Platt T (1976) Mathematical formulation of the relationship
between photosynthesis and light for phytoplankton. Limnol Oceanogr
21: 540-547
Kitajima M, Butler WL (1975) Quenching of chlorophyll fluorescence
and primary photochemistry in chloroplasts by dibromothymoquinone.
Biochim Biophys Acta 376:105-115
Kramer DM, Johnson G., Kiirats O, Edwards GE (2004) New flux parameters for the determination of QA redox state and excitation fluxes.
Photosynthesis Res 79: 209-218)
Oxborough K, Baker NR (1997) Resolving chlorophyll a fluorescence
images of photosynthetic efficiency into photochemical and nonphotochemical components - calculation of qP and Fv'/Fm' without
measuring Fo'. Photosynth Res Volume 54 135-142
Pfündel EE, Ben Ghozlen N, Meyer S, Cerovic ZG (2007) Investigating
UV screening in leaves by two different types of portable UV fluorimeters reveals in vivo screening by anthocyanins and carotenoids. Photosynth Res 93. 205-221
Platt T, Gallegos CL, Harrison WG (1980) Photoinhibition of photosynthesis in natural assemblages of marine phytoplankton. J Mar Res 38:
687-701
Schreiber U, Schliwa U, Bilger W (1986) Continuous recording of photochemical and non-photochemical chlorophyll fluorescence quenching
with a new type of modulation fluorometer. Photosynth Res 10: 51–62
van Kooten O, Snel J (1990) The use of chlorophyll fluorescence nomenclature in plant stress physiology. Photosynth Res 25: 147–150
51
52
ADDITIONAL CITATIONS
CHAPTER 7
7 Some Reviews on Chlorophyll Fluorescence
Bernhardt K, Trissl H-W (1999) Theories for kinetics and yields of fluorescence and photochemistry: how, if at all, can different models of antenna organization be distinguished experimentally? Biochim Biophys
Acta 1409: 125-142
Butler WL (1978) Energy distribution in the photochemical apparatus of
photosynthesis. Annu Rev Plant Physiol 29:345-378
Dau H (1994) Molecular mechanisms and quantitative models of variable photosystem II fluorescence. Photochem Photobiol 60:1-23
Demmig-Adams B and Adams WW, III (1992) Photoprotection and
other responses of plants to high light stress. Annu Rev Plant Physiol
Plant Mol Biol 43:599-626
Govindjee (1995) Sixty-three years since Kautsky: Chlorophyll a fluorescence. Aust J Plant Physiol 22:131-160
Haldrup A, Jensen PE, Lunde C, Scheller HV (2001) Balance of power:
a view of the mechanism of photosynthetic state transitions. Trends
Plant Sci 6: 301-305
Krause GH and Weis E (1991) Chlorophyll fluorescence and photosynthesis: The basics. Annu Rev Plant Physiol Plant Mol Biol 42:313-349
Krause GH, Jahns P (2004) Non-photochemical energy-dissipation determined by chlorophyll fluorescence quenching: characterization and
function. In: Papageorgiou GC, Govindjee (eds.) Chlorophyll a Fluorescence: A Signature of Photosynthesis. Springer, The Netherlands, pp.
463-495
Logan BA, Adams III WW, Demmig-Adams B (2007) Avoiding common pitfalls of chlorophyll fluorescence analysis under field conditions.
Funct Plant Biol 34, 853–859
53
CHAPTER 7
ADDITIONAL CITATIONS
Maxwell K, Johnson GN (2000) Chlorophyll fluorescence – a practical
guide. J Exp Bot 51, 659–668.
Nedbal L, Koblížek M (2006) Chlorophyll fluorescence as a reporter on
in vivo electron transport and regulation in plants In: Grimm B, Porra
RJ, Rüdiger W, Scheer H (eds) Advances in Photosynthesis and Respiration, Vol 25, Chlorophylls and Bacteriochlorophylls: Biochemistry,
Biophysics, Functions and Applications. Springer, The Netherlands, pp
507-519
Schreiber U (2004) Pulse-amplitude-modulation (PAM) fluorometry
and saturation pulse method: an overview. In: Papageorgiou GC, Govindjee (eds.) Chlorophyll a Fluorescence: A Signature of Photosynthesis. Springer, The Netherlands, pp. 279-319
54
SPECIFICATIONS
CHAPTER 8
8 JUNIOR-PAM Specifications*
General
Design: Aluminum housing with texture finish including one USB-B
and one M8 4-pole socket, a port for the JUNIOR-PAM light guide and
swiveling sample support
Light guide: 400 x 1.5 mm (length x diameter) plastic fiber
Sample Clips: Spring leaf clip (angle between incident radiation from
JUNIOR-PAM and leaf surface, 60°) and magnetic leaf clip (angle between incident radiation from JUNIOR-PAM and leaf surface, 90°)
Power consumption: 100 mW at normal operation and 500 mW during
saturation pulse
Power supply: 5 V DC from USB voltage source
Dimensions: 112 x 60 x 31 mm (L x W x H)
Weight: 200 g
Operating temperature: 0 to +40 °C
Operating humidity range: 35 to 85% RH (avoid condensation)
Light sources
Measuring light: Blue LED (wavelength of maximum emission: 450
nm). Two modulation frequencies (5 and 100 Hz)
Actinic light: Blue LED (wavelength of maximum emission: 450 nm).
Photon flux densities at 1 mm distance from the tip of the 400 mm JUNIOR-PAM light guide: 25 to 1500 µmol photons/(m2*s), adjustable at
12 different levels
55
CHAPTER 8
SPECIFICATIONS
Far red light: LED with 730 nm maximum emission wavelength) for
selective excitation of photosystem I
Saturating pulses: Blue LED (wavelength of maximum emission: 450
nm). Maximum photon flux density 10000 µmol photons/(m2*s) at 1
mm distance from the tip of the 400 mm JUNIOR-PAM light guide
Signal Detection
Fluorescence: PIN-photodiode protected by long-pass filter (lambda(T
50%) = 645 nm). Selective window amplifier to measure pulseamplitude modulated (PAM) fluorescence
Temperature: Integrated-circuit temperature sensor
User interface
Software: WinControl-3 software for PAM fluorometers
Data/power cable: 1.2 m USB-cable type A-B
Computer minimum requirements: Processor, 1 GHz. RAM, 256 MB.
Hard disc space, 20 MB. Screen resolution: 800 x 600 pixels. Interface,
USB 1.1 or USB 2.0. Operating system: Microsoft Windows
2000/XP/Vista
Measured and calculated parameters: Fo, Fm, Fo’ (measured or calculated), Fm’, Fv/Fm, qP, qL, qN, NPQ, Y(II), Y(NPQ), Y(NO), ETR.
Two different fitting routines for ETR versus light intensity curves.
*Subject to change without prior notice
56
WARRANTY CONDITIONS
CHAPTER 9
9 Warranty Conditions
All products supplied by the Heinz Walz GmbH, Germany, are warranted by Heinz Walz GmbH, Germany to be free from defects in material and workmanship for one (1) year from the shipping date (date on
invoice).
The warranty is subject to the following conditions:
1. This warranty applies if the defects are called to the attention of
Heinz Walz GmbH, Germany, in writing within one year (1) of the
shipping date of the product.
2. This warranty shall not apply to any defects or damage directly or
indirectly caused by or resulting from the use of unauthorized replacement parts and/or service performed by unauthorized personnel.
3. This warranty shall not apply to any product supplied by the Heinz
Walz GmbH, Germany which has been subjected to misuse, abuse,
abnormal use, negligence, alteration or accident.
4. This warranty does not apply to damage caused from improper
packaging during shipment or any natural acts of God.
5. This warranty does not apply to underwater cables, batteries, fiberoptic cables, lamps, gas filters, thermocouples, fuses or calibrations.
To obtain warranty service, please follow the instructions below:
1. The Warranty Registration form must be completed and returned to
Heinz Walz GmbH, Germany.
2. The product must be returned to Heinz Walz GmbH, Germany,
within 30 days after Heinz Walz GmbH, Germany has received written notice of the defect. Postage, insurance, custom duties, and/or
shipping costs incurred in returning equipment for warranty service
are at customer expense.
57
CHAPTER 9
WARRANTY CONDITIONS
3. All products being returned for warranty service must be carefully
packed and sent freight prepaid.
4. Heinz Walz GmbH, Germany is not responsible or liable, for missing components or damage to the unit caused by handling during
shipping. All claims or damage should be directed to the shipping
carrier.
58