1
Version 4.1
Copyright © 2007. Northwestern University. All rights reserved.
Created August 15, 2002 ─ Last Revised May 8, 2007
Developed by the GEODE Initiative
Learning Sciences Program
School of Education and Social Policy
Northwestern University
My World GIS is distributed by PASCO Scientific under an exclusive worldwide
arrangement with Northwestern University.
For more information or to purchase My World, please visit www.pasco.com/myworld
Or contact PASCO via phone or email:
Within the United States: (800) 772-8700
Outside the United States: 1-916-786-3800
Email: [email protected]
This work has been supported in part by the National Science Foundation grants ESI9720687, 0085946, 0352478, 0333529, and 0422545. However, any opinions, findings,
conclusions, and/or recommendations herein are those of the authors and do not
necessarily reflect the views of the National Science Foundation.
1
2. What is My World™?
My World is a Geographic Information Systems (GIS) application developed by the
GEODE initiative using the Java™ platform. It is used for assembling, storing,
manipulating, and displaying geographically referenced information (i.e., data identified
according to their locations). It is intended to provide a useful subset of the features found
in professional GIS environments but with an interface designed for use by students and
teachers. It is also designed to be easier to administer in educational computing
environments.
For more information on what a GIS is, and how it can be used, see the US Geological
Survey's GIS poster.
My World is a trademark of Northwestern University.
Java is a registered trademark of Sun Microsystems, Inc.
What is the GEODE Initiative?
The GEODE Initiative is dedicated to the improvement of Earth and
environmental science education through the use of data visualization and
analysis tools to support inquiry-based pedagogy. Through an integrated program
of research and development, the GEODE Initiative is advancing our
understanding of learning in the Earth and environmental sciences, design of
curriculum and educational software, and teacher professional development.
Equally important, the GEODE Initiative is creating useful and useable products
for students and teachers at levels ranging from middle school through college.
2
3. Construct Mode
Figure 1. Parts of the My World window in Construct Mode
In Construct Mode there are four parts to the My World window. At the top of the
window are the tabs used to select the mode. Each mode is used for interacting with the
map in a different way. Construct mode is used for adding new Layers to the Layer List,
to construct a Map.
Below the Mode tabs on the left edge of the window is the Data Library. The Data
Library is a collection of all of the Layer and Project files My World was able to find on
your computer when it started up. These files are organized into Libraries, and you can
select which Library is displayed using the Library menu. To the right of the Library
menu is the Import Layer From File button, which you can use to open a Layer data file
that wasn't found by My World's automatic search. You can drag data files and projects
from the Data Library into the Layer List to add them to the Map.
To the right of the Data Library is the Layer List. As its name suggests, the Layer List
displays a list of Layers currently displayed in the Map. The Layer List also has four
Layer Buttons for operating on the active Layer in the Layer List.
To the right of the Layer List is the Map, which is where Layers are displayed. The Map
Tools determine what action My World performs when you click on the Map. And The
Zoom Controls allow you to change the scale and location of the Map to see different
parts. For a more detailed description of these buttons and tools, see Section 4: Visualize
Mode.
3
4. Visualize Mode
Visualize Mode looks very similar to Construct Mode, except that the Data Library is not
present, Legend panels may appear below and/or to the right of the Map, and there are
more buttons in the Toolbar. Also, each Layer's Control Panel contains more details
about that Layer.
Layer Control Panels
Figure 2. Parts of the Layer Control Panel in Visualize Mode
•
•
•
•
•
•
•
Example Icon: Shows what features in this layer look like on the map (i.e., what
color, shape, size, etc...).
Layer Name: The name of the layer. You can edit the name by making the layer
active and clicking the "Edit Layer Appearance" button.
Remove Button: Removes the Layer from the Layer List and the Map.
Show/Hide Layer Button: Makes the Layer visible (if checked) or invisible (if
unchecked).
Aspect Menus: Adjust how each aspect of the Layer's appearance is determined.
In the example above, the Size aspect is determined by the "Population" field, and
the Color aspect is constant (red) for each feature.
Legend Buttons: Make the legend for each aspect of appearance visible (when
colored in) or invisible (not colored in). Legends are not shown for aspects that
are constant for each feature in the Layer, as with the Color aspect in the above
example.
Selections Twist-Down: Make the Selections for the Layer visible (twisted down)
or invisible (twisted up, as in the example above). Selections are a sub-set of the
records in the Layer, and each Layer can have any number of Selections. For
more information on Selections, see Section 8: Selections
4
Layer Buttons
Here are the Layer Buttons available in Visualize Mode:
Figure 3. Layer Buttons in Visualize Mode
•
•
•
•
•
•
Show Data Documentation Button: Opens a new window with information about
the source of the data for the active Layer.
Edit Layer Appearance Button: Opens a new window with controls for changing
the appearance of the active Layer.
Show Table Button: Opens a new window containing the data table associated
with the active Layer. This button is disabled if the active Layer has no data table.
Remove Button: Removes the active Layer from the map or, if the active Layer
currently has a Selection highlighted, deletes that Selection.
Show Statistics Button: Opens a new window displaying statistics (i.e., sum,
median, mode, standard deviation, etc...) for the data table of the active Layer or,
if the active Layer currently has a Selection highlighted, for the table of that
Selection. This button is disabled if the active Layer has no data table.
Show Histogram Button: Opens a new window displaying a histogram (a bar
graph of the number of observations by value) for the data table of the active
Layer or, if the active Layer currently has a Selection highlighted, for the table of
that Selection. This button is disabled if the active Layer has no data table.
5
Map Tools
Here are the Map Tools available in Visualize Mode:
Figure 4. Map Tools available in Visualize Mode
•
•
•
•
•
•
•
•
Arrow Tool: Clicking on the map will highlight the value of the feature(s) you
clicked on (if any) in all visible Layer Legends.
Get Information Tool: Clicking on the map will display a pop-up window with
information about the features you clicked on (if any) in the active Layer. Also
highlights the value of of those features' records in any layer that has visible
Legends, just like the Arrow tool does. For more information on the pop-up Layer
Information window, see Section 6: The Layer Information Window
Link Tool: When this tool is selected, orange flags appear over each feature in the
Map which has a link associated with it. Click on one of the flags to display a
pop-up menu of all the links at that location, and select one to open that link. A
link may be to a Web Page, a picture, a movie, or any other kind of file.
Move Map Tool: Clicking and dragging moves the contents of the map, allowing
you to see parts of the map that aren't currently visible.
Zoom In Tool: Clicking once zooms in on the clicked point. Clicking and
dragging draws a rectangle then zooms in on that rectangle when you release the
mouse button.
Zoom Out Tool: Clicking once zooms out and centers on the clicked point.
Clicking and dragging draws a rectangle then zooms out and centers the map on
the center of the rectangle.
Re-Center Projection Tool: Some map projections can only display features
within a certain distance from their center, and some projections distort shapes in
different ways depending on the shapes' location relative to the center of the
projection. You can use this tool to change the center of projection to change the
visible area or to minimize projection-related distortion.
Measure Distance Tool: Allows you to measure distances on the map. Click once
to start measuring. Each subsequent click adds a new segment to the measurement
line. The length of the current segment and total length of the measurement line
are displayed in the status bar at the bottom of the My World window. Doubleclick to stop measuring.
Distances are measured in great circles on a spherical Earth using the equatorial
6
•
•
•
radius of the WGS 84 Datum, and are only accurate to within approximately 10
meters.
Marquee Selection Tool: Clicking and dragging with this tool will draw a
rectangle on the Map. When the mouse is released, My World will create a new
Selection containing any features of the active Layer that are at least partly
contained by that rectangle. If the active Layer doesn't have any features in the
rectangle, or if it has no data table, the tool will have no effect.
Lasso Selection Tool: Clicking and dragging with this tool will draw a freehand
shape on the Map. When the mouse is released, My World will close that shape
create a new Selection containing any features of the active Layer that are at least
partly contained by that shape. If the active Layer has no features inside the shape,
or if it has no data table, the tool will have no effect.
Vertical Profile Tool: This tool only works when there is a Grid layer with a
numeric Field in the Layer List. It allows you to draw a line across a grid layer to
create a graph of numeric grid values along that line. When you first select the
tool, a dialog appears in which you must select a Grid Layer and its numeric field
you want to profile. Click on the Map once to start drawing a line. Once you have
started drawing a line, click once to add a new segment to the profile line, or
double-click to stop drawing the line and show the profile graph.
Zoom Controls & The Map View Menu
Here are the Zoom Controls available in Visualize Mode, along with the Map View
Menu:
Figure 5. Zoom and Map View controls
•
•
•
•
Zoom to Previous (Back) Button: Returns the map to its previous location and
zoom state. My World saves the last ten locations, so you can go back at most ten
times.
Zoom to Next (Forward) Button: Returns the map to the location and zoom state it
was in before the "Back" button was pressed. Only available when the "Back"
button has been used at least once.
Zoom to All Button: Adjusts the Map so that all the contents of each visible Layer
in the Map are visible.
Zoom to Selected Button: Adjusts the Map so that all the contents of the active
Layer are visible.
7
•
Map View Menu: allows you to save the current appearance of the Map, including
which layers are visible and which are hidden, how those layers are colored, and
what part of the map you're looking at. You can use this feature to save several
interesting views on your data so you can easily re-create them later, or to save
your place in the world before you explore other areas, so you can quickly return
to the same place later.
Projection and Scale Controls
The projection and scale controls are available in every mode that features a map, but you
will probably use them most often in Visualize mode. The Projection Menu and Map
Scale are shown below in figure 6.
Figure 6. The Projection and Scale controls
The Projection Menu allows you to select what Map Projection is used to convert threedimensional geographical coordinates to two-dimensional pictures on your computer
screen. For more information on Map Projections, see Map Projection Basics.
The Map Scale control shows you the scale of the map currently displayed on the screen.
For example, in figure 6 above, the map scale is 1:100,000,000, which means that one
inch on the computer screen is equivalent to 100,000,000 inches on the surface of the
earth (around 1,578 miles). You can type into the field and press Return or Enter to
change the current scale of the Map.
8
5. The Edit Layer Appearance Window
The Edit Layer Appearance Window is used for making finer adjustments of a Layer's
appearance than are possible with the Layer Control Panel. The controls available in the
window will vary, depending on the type of Layer, what aspect of a Layer's appearance
you are adjusting, and what kind of field you are using to determine the appearance of
that aspect.
In this section, we will examine the Edit Appearance window for Point, Line, Polygon
and Grid Layers, because the basic structure of the Edit Appearance window is the same
for all of these Layer types. Other Layer types have very few or no appearance settings
that can be customized in the Edit Appearance window.
Figure 6 below shows the basic structure of the Edit Appearance window for Shape and
Grid Layers:
Figure 7. The basic structure of the Edit Layer Appearance Window
•
•
•
•
The Layer Name Editor is used to change the name of the Layer.
The Aspect Tabs are used to select which aspect of the Layer's appearance is
being adjusted.
The Aspect Field Menu is used to choose which of the Layer's fields will be used
to determine the appearance of the chosen aspect. If Uniform is chosen (as in
figure 7 above), the appearance of the chosen aspect will be the same for every
feature in the Layer.
The Field Controls are used to adjust how the selected field determines the
selected aspect of the Layer's appearance. When "Uniform" is chosen, instead of a
9
•
field in the Layer. as in figure 7 above, the controls are used simply to set the
appearance of the chosen aspect.
The Apply Button is used to apply the selected changes to the Layer's appearance
and re-draw the Map. None of the changes you make in the Edit Appearance
Window will appear on the map until you press the "Apply" button.
For the purposes of Layer Appearance, there are two major types of Layer Fields:
Numeric Fields, which include numbers and dates, and Categorical Fields, which include
text values, boolean (true or false) values, and web links.
Choosing Appearance by a Numeric Field
Choosing the appearance of a Layer's aspect using a Numeric field is done by assigning
colors, shapes, etc... to Intervals of values. You can see an example of this in figure 8
below.
Figure 8. Choosing an aspect of appearance (Color) using a Numeric Field (Population)
10
•
•
•
•
•
•
•
•
•
The Copy... button allows you to copy all of the settings from this field to one or
more other fields. This is especially useful for Grid layers, which often have a
series of similar fields that you want to display using the same colorscheme and
scale.
The Show Histogram/Bar Chart... button opens a new window with a Histogram
for the selected field. a Histogram is a bar graph that plots the number of values in
each of a set of intervals.
The Colorscheme menu allows you to change how colors are assigned to
intervals. For the Symbol Shape aspect, the Colorscheme menu is replaced by the
Symbol Type menu. You can read more about Symbol Types in the Glossary
under Symbol.
The Transparency setting determines how much of the Layers beneath this layer
will show through. At 0%, the Layers beneath this one will be completely
obscured. At 100%, this Layer will be completely transparent.
The Number of Fill Colors editor determines how many different intervals the
range of values is divided into. Studies have shown that people find it difficult to
discriminate among more than about seven categories, so it is recommended that
you keep this number relatively low, but My World supports up to 512 different
values for a given aspect.
The Reverse button reverses the order of Fill Colors (or Shapes, etc...), for
example to go from dark-to-light instead of light-to-dark, or large-to-small instead
of small-to-large.
The Interval Table table below those controls lists the Intervals values will be
divided into. You can modify these ranges manually by typing into the table, and
you can change the Fill Color of a given Interval by double-clicking on the color
in the leftmost column.
The Maximum and Minimum editors. These determine the low and high end of the
Range of values. You can also edit these values in the Interval table, but they are
also provided here as separate fields for the sake of clarity. Clicking on the Reset
To Defaults button will re-set these values to the actual minimum and maximum
values of the field's data.
The Classify By: menu determines how the range of values of the selected field
are divided into Intervals, to which colors (or symbol shapes, or other aspects of
appearance) are assigned. For more information on Classification, see the
Glossary entries for Equal Interval, Natural Breaks, and Quantiles.
Choosing Appearance by a Categorical Field
Compared to the controls for choosing an aspect of Layer Appearance based on a
Numeric value, the controls for using a Categorical value are quite simple, as you can see
in figure 9 below.
11
Figure 9. Choosing an aspect of appearance (Color) using a Categorical Attribute
The Colorscheme and Transparency controls do the same thing for Categorical fields as
for Numeric fields. Below them is a table of Categories. Each category consists of a
Color (or Shape, Size, etc..., depending on the selected Aspect), a Name, and a set of
Values. You can change the color of a category by double-clicking on the patch of color
in the leftmost column. You can also change the Name of a category by double-clicking
on the name and typing. The set of Values, on the other hand, can only be changed by
merging the category with another category, or by splitting apart a category that contains
multiple Values. To see how this works, begin by selecting the first two Countries in the
list and pressing Merge Selected Categories, as shown below in figure 10.
12
Figure 10. Merging categories
The two categories are combined into one, with the name and the color of the first
category, as shown in figure 11 below. Now Afghanistan and Albania will be drawn in
the same color on the Map.
Figure 11. Merged categories
You can split the category back into two by selecting it and clicking the Split Selected
Category button.
13
6. The Layer Information Window
This window appears when you click on a Layer's features using the Get Information
Tool to display the record(s) associated with the feature(s) you clicked on. It can also
retain records whose features you've clicked on previously.
Figure 12. The Layer Information Window, split in half to fit on the page.
At the upper-left corner of the window My World displays the number of records in the
table, along with the total number of records in the Layer (in parentheses).
Next to that is the Find Button, which displays a search window that allows you to search
through the table for a specific piece of text.
Next to that there are two buttons for creating a new, named Selection from the list of
records in the table. The first, Make Selection From Rows is only available if some rows
in the table are selected. It creates a new Selection containing only those records whose
rows are selected in the table. In figure 12 above, the button is disabled because no rows
of the table are selected. The second, Make Selection From All, creates a new Selection
that contains all of the records in the table. For more information on Selections, see
Section 8: Selections.
Normally, each time you click on a new feature on the map, any records already in the
Layer Information Window are replaced by the new feature's record (or removed, if you
clicked on a blank area of the Map). However, if the Keep Records In Table checkbox is
checked, records always stay in the table, and any new records whose features you click
on are added to the top of the table (or moved to the top of the table, if they are already in
14
it). So the record whose feature you've most recently clicked will be listed at the top of
the table, unless the table is sorted.
Checking the Exchange Rows & Columns checkbox will cause the table to be transposed,
displaying each record as a column and each field as a row. This is useful for tables that
have very few records and many fields, because it can make better use of the space
available to fit more information on the screen at once.
The Export button allows you to save the table to a file that can be opened, for example,
in Microsoft Excel for further analysis.
15
7. Analyze Mode
Analyze mode is where you perform analysis on your Map data. In Analyze mode, the
Map is not visible; on the left side of the My World window is a list of analysis
operations to select from and on the right side are controls for adjusting the options for
the selected analysis operation.
The following are the analysis operations as they appear on the left hand side of the My
World window in Analyze mode.
•
o
Select By Value creates a new Selection with records chosen based on
their value in a particular field in their Layer's data table.
o
Select By Comparing Values creates a new Selection with records chosen
by comparing their values in two fields in their Layer's data table.
o
Select By Distance creates a new Selection with records chosen by
their features' distance on the map from features in another Layer
or Selection.
Select by Crossing creates a new Selection with records chosen
based on whether or not their features cross or overlap features in
another Layer or Selection.
Select by Spatial Containment creates a new Selection with records
chosen by whether or not their features partially or completely
contain or are contained by features in another Layer or Selection
16
Select by Latitude & Longitude creates a new Selection with
records chosen by whether or not their features lie within a specific
range of latitude and longitude values.
•
o
If the inputs are two Selections from the same Layer, computes the list of
records the two Selections have in common.
If the inputs are two Polygon or Grid Layers, or Selections from two
different Polygon or Grid Layers, computes the area that the two have in
common.
o
If the inputs are two Selections from the same Layer, computes the
combined list of records of two Selections.
If the inputs are two Polygon or Grid Layers, or Selections from two
different Polygon or Grid Layers, computes the combined area of the two
inputs.
o
If the inputs are two Selections from the same Layer, computes a new
Selection with the records from the first Selection that are not in the
second Selection.
If the inputs are two Polygon or Grid Layers, or Selections from two
different Polygon or Grid Layers, computes a new polygon containing the
area of the first minus the area of the second.
o
Creates a new layer by cropping all features of the first input Layer or
Selection to retain only those portions that lie inside the second input
Layer or Selection (which must consist of Polygons), discarding any
records whose features lie completely outside the clipping area.
17
•
o
Math Operation can compute the sum, difference, average, etc... of two or
more fields of a Layer's data Table. The resulting data can be used to
create a new field, or copied into an existing field.
o
Add Field by Copying Values copies values from one Layer's data table to
another's, based on the containment relationship of their features. For
example, you can use this operation to copy population information from
cities (Points) to the states (Polygons) that contain them, or vice- versa.
o
Add Field by Reclassifying allows you to create a new field from an old
one by dividing the old field's values into classes, each of which becomes
a value in the new field. For example, you could classify a range of
numeric temperature values from -20 to 110 degrees Fahrenheit into the
categories "Cold", "Temperate" and "Hot".
o
Add Field by Computing Distance adds a field to one Layer whose value
for each record is the shortest distance between that record's feature and
the nearest feature in a second Layer or Selection. If the second Layer is a
Polygon Layer, the distance is always measured from the edge of the
polygon, so that the distance value for features contained by a polygon
will represent the distance to the nearest edge.
o
Add Field By Selection Membership adds a new field to a Layer with one
value for records contained in a given Selection, and a different value for
records not in that Selection. Essentially, it turns a Selection into a field.
This is useful for when you want to customize the appearance of a Layer's
features based on membership in a Selection, or when you want to use the
results of a Selection in a Math Operation.
18
•
o
Create Chart by Scatter Plot allows you to plot two fields in the same
Layer or Selection against one another, to see if there is a relationship
between them. It includes the ability to compute the correlation coefficient
and linear relationship of two fields.
o
Create Chart by Vertical Profile allows you to create a profile of grid
values along Lines in a Line layer.
•
Make Buffer creates a new Layer consisting of one or more polygons that contain
all the area within a given distance from the features of a given Layer or
Selection. It provides a menu for choosing the input. Buffers may be created
outside Lines and Points, and either inside, outside, or surrounding the edge of
Polygons.
•
Dissolve creates a new layer by combining records that have a the same value in a
selected field, dissolving the borders between their features if they touch one
another.
•
Summarize creates a new Data Table by summarizing values in an existing Layer
or Selection's Data Table, combining records that have the same value in a
selected field. This operation is similar to Dissolve, but it creates only a Data
Table instead of a whole Layer.
•
o
Convert Selection to Layer creates a new Layer consisting of only the
records in the chosen Selection. The new Layer's Data Table contains the
same data as the source layer, but only for the records in the Selection.
Convert Selection To Layer can convert a Grid selection to a Shape Layer,
but cannot turn Shape Selections into Grid Layers.
19
o
Convert Polygons To Points creates a new Point layer from a Polygon
layer by placing a point at the Centroid (center of gravity) of each
polygon, copying all the values from that Polygon's record in the Data
Table to the new Point's record.
o
Make Grid From Points by Interpolation creates a new Grid Layer
where the values of each grid cell are estimated based on the
values at the points in a given Point Layer or Selection from a
Point Layer. The estimate can be calculated by Inverse Distance
Weighted, which takes a weighted average of either the k nearest
samples or of all samples, weighted by the square of their distance
from the interpolation point, or by Simple Kriging, which builds a
model Variogram (a model of the relationship between variance
and distance), then uses that to weigh the averages of the k nearest
samples.
Make Grid From Points by Counting (density) creates a new Grid
Layer where each grid cell will have as its data the number of
points in a given Point Layer or Selection contained by that cell, as
well as the sum or average of all the numeric data for those points
contained by the grid cell. You may choose the size of the grid and
the number of cells, or the number of cells and the size of each cell
(other values will update automatically), and whether to sum or
average the values of points within each cell.
Make Grid By Resampling An Existing Grid allows you to change
the location and/or cell size of a Grid layer. Those settings can be
modified in the Edit Layer Information window for Grid Layers,
but changing values there does not affect the underlying data. To
resample the underlying data to a new resolution or boundary, you
must use the Make Grid By Resampling An Existing Grid analysis
tool.
20
o
Make Polygon from Grid by Selection Boundary creates a new
Layer consisting of a single polygon (which may contain more
than one ring) that contains all the area covered by a Selection
from a Grid Layer. Numeric data associated with those grid cells
may be summed or averaged across that Selection. Non-numeric
data is discarded.
Make Lines from Grid by Contour Lines creates a Layer of lines of
equal value for a particular column of data in a Grid Layer. Each
line has its value associated with it in the new Layer's data table.
When an Analysis Operation is selected on the left hand side of the My World window in
Analyze mode, controls for the selected operation will appear on the right hand side.
Each operation has its own set of controls, but all operation controls have some elements
in common. Those common elements are shown below in figure 13.
21
Figure 13. Analysis Operation Controls
The Description of the Selected Operation explains what action the selected operation
performs.
The Controls for the Selected operation are specific to each operation. Shown here are
the controls for the Select By Value operation.
The Result Description describes what the result of the selected operation will be, given
the current settings of its Controls.
When you are satisfied that the Result Description matches what you're trying to
compute, press the OK Button to perform the analysis. The OK Button may be disabled if
the settings for the selected operation's controls are invalid, or if there are no layers for
the operation to act on in the Layer List.
22
8. Selections
Selection Controls in the Layer Control Panel
Figure 14 below shows a Layer Control Panel in Visualize Mode, with its Selections
Twist-Down twisted down to reveal the Selection Controls for the Layer.
Figure 14. Selection Controls in Visualize Mode
When the Selection Controls are visible, a Selection may be highlighted by selecting the
Highlight Button next to its name. For example, in Figure 14 above, the Selection named
"Population >= 10,000,000" is highlighted. Clicking on the radio button for a Selection
will highlight that Selection and un-highlight all other Selections in that Layer. Clicking
on the radio button marked "Show All (highlighting off)" will un-highlight all selections.
When a Selection is highlighted, features whose records are in that Selection will be
drawn on the Map in a different way than features whose records are not. Exactly how
they will be drawn is determined by the the Highlight Mode Menu. The different ways of
highlighting Selections are:
•
•
•
•
Color Selected (Yellow): Selected records' features are drawn in yellow; all other
records are drawn normally.
Color Selected (Magenta): Selected records' features are drawn in magenta (a
light purple color); all other records are drawn normally.
Transparent Unselected (Polygon layers only): Un-Selected records' features are
drawn with a transparent fill color; selected records' features are drawn normally.
This mode is only available for Polygon layers because Points, Lines, and Grids
are completely invisible when their fill color is transparent.
Dim Unselected (Grid layers only): Un-Selected records' grid cells are drawn with
60% higher transparency than selected records' grid cells. The color of the cells is
not affected.
23
•
Hide Unselected: Unselected records' features are not drawn; selected records'
features are drawn normally.
When a Layer Control Panel's Selections Twist-Down is twisted down to reveal that
Layer's Selection Controls, the Layer Buttons (Show Table, Remove, Show Histogram,
and Show Statistics) will act on the highlighted Selection instead of the active Layer,
unless the highlighted Selection is "Show All (highlighting off)", in which case the
buttons will all act on the Active Layer as usual.
Double-clicking on a Selection in the list has the same effect as highlighting it and
clicking on the Show Table button: opening a Selection Window for that Selection.
The Selection Window
The Selection window allows you to examine and modify an existing Selection.
Figure 15. Viewing a Selection in a Selection Window
At the top of the window is a text box showing the name of the Selection, which you may
edit. Below that is the text description of how the Selection was created, which cannot be
modified, and a Highlight Button that allows you to highlight or un-highlight the
Selection.
24
Below that, the window looks very similar to the Layer Information Window. The only
difference is that this table lists only the records in the Selection, instead of the records
whose features you've clicked on with the Get Information Tool.
As shown in figure 15 above, you can Sort the table, in either ascending or descending
order, by a particular field. To sort the table, click on the column header containing the
name of the field. Click once to sort in ascending order (lowest to highest), click again to
sort in descending order (highest to lowest, as shown above in figure 15), and click a
third time to turn sorting off. This works for any table in My World, except in Edit Mode.
25
9. Edit Mode
Edit Mode is where you can edit Point, Line, or Polygon, Grid, and Annotation Layers.
Point, Line, and Polygon Layers are know collectively as Shape Layers.
The Layer List in Edit Mode works like the list in Visualize Mode, except that it only
lists Layers that can be edited, and it has a different set of action buttons available, as
shown below in figure 16.
Figure 16. Layer List Buttons available in Edit Mode
The New Layer Button, as its name suggests, is used to create a new layer. It displays a
dialog box with controls for creating new Shape, Grid, and Annotation layers.
The Import From GPS Button launches an application for loading waypoints from a
Garmin GPS device directly into My World. For more information on getting GPS data
into My World, see the PASCO GIS page.
To start editing a layer, double-click on its Control Panel in the Layer List. Once you
begin editing a layer, the options available will depend on what type of layer you are
editing.
Editing Shape Layers
When editing a Shape Layer in Edit Mode, the right hand side of the My World window
is divided into the Edit Shapes Panel and the Edit Table Panel, as shown below in figure
17.
26
Figure 17. Editing a Shape Layer in Edit Mode
The Edit Shapes Panel
The Edit Shapes Panel is where you can use the mouse to modify existing shapes, and to
draw new ones. Several new tools appear in the Toolbar for this purpose when you are
editing a Shape Layer.
27
Figure 18. Tools for editing a Shape Layer
The Move Shape Tool and Move Shape Part Tool are used for selecting and moving
existing shapes. A shape in My World can consist of any number of Points, Lines, or
Polygons. Thus, a single record in the data table might have multiple features on a Map.
For example, an record representing the United States would have at least nine Polygons:
one for the continental States, one for Alaska, and seven for the islands of Hawaii. This
collection of nine Polygons is considered a single Shape by My World, consisting of nine
Shape Parts. You can select and move them as a group, using the Move Shape Tool, or
select and move the individual parts, using the Move Shape Part Tool.
Each Shape Part is in turn made up of Vertices -- single points. Point Shape Parts consist
of a single Vertex, Line shape parts each have at two or more Vertices, and Polygon
Shape Parts must have at least three Vertices.
You can select and move individual Vertices using the Move Vertex Tool. When you
select a Vertex, it is drawn in red, as shown above in figure 17. The location of the
selected Vertex is shown in the text boxes at the bottom of the Edit Shapes Panel, either
in Latitude and Longitude or in Easting and Northing. Easting and Northing are simply
horizontal and vertical locations (respectively) in the 2-dimensional plane defined by the
current Projection. The Projection converts the 3-dimensional Latitude and Longitude
coordinates into 2-dimensional Easting and Northing coordinates. You can change the
location of the selected Vertex by typing into those text boxes or by clicking and
dragging on the vertex in the Map portion of the Edit Shapes Panel, as shown in figure 17
above.
You can also add a new Vertex to a Line or Polygon using the Add Vertex Tool. Clicking
on the map with the Add Vertex Tool will split the segment of the shape you are
currently editing into two parts, then add a Vertex to it at the point you clicked.
Sometimes the segment you would like to add a Vertex to is not the closest segment to
the location you want to place the Vertex at. In that case, click directly on the segment
you want to add the Vertex to, then use the Move Vertex Tool to move it to the desired
location.
28
While a Shape, Shape Part, or Vertex is selected, you can use the keyboard to perform
some editing operations. Press Delete or Backspace to delete the selected shape element,
or use the arrow keys to move the selected Shape or Shape Part, or to select the next or
the previous Vertex of the shape.
Moving, adding, or deleting a Shape, Shape Part, or Vertex can be undone by selecting
Undo from the Edit menu.
The Edit Table Panel
The Edit Table Panel is where you can edit the values in the layer table that are
associated with the selected shape. You can edit the values of existing fields, or add and
delete new fields, either by inserting an empty field, copying an existing field, or
importing new data from a file.
Only one record in the Layer may be selected at a time, and that records's row in the Edit
Table Panel will be highlighted to show that it is the selected record. Also, one field may
be selected, and its column will be highlighted to show that it is the selected field. In
figure 17 above, Hawaii is the selected record, and "Name" is the selected field.
You can change the selected record by clicking on a shape in the Edit Shapes Panel with
one of the editing tools, or by clicking on that record's row in the Edit Table Panel. You
can edit the values in the table for the row you are editing by clicking on the value in the
table. Press Return or Enter to stop editing.
You may also delete the selected record by pressing the Delete Record... button. This
operation cannot be undone, so My World will ask you to confirm that you really want to
delete the record before performing the deletion.
In addition to editing existing data, you can use Edit Mode to create new data. You can
add a new record to the layer by clicking on the New Record button in the Edit Table
Panel. To add new shapes to an record, click on its row to select it, then use one of the
New Shape tools. The New Shape tool that appears in the toolbar will depend on what
kind of layer you're editing: the New Point Tool is for adding a new Point to a Point
Layer, the New Polyline Tool is for adding new Polylines to a Line Layer, and the New
Polygon Tool is for adding new Polygons to a Polygon Layer. A Layer may only have
one kind of shape in it, so only one of these tools will appear at a time.
You can also add new fields to the Layer's data table. Clicking on the New Field... button
in the Edit Table Panel will open a dialog window that you can use to select whether to
copy an existing field or create a new, empty field, and select what type of empty field
you want to create.
You may also delete the selected field by pressing the Delete Field... button. This
operation cannot be undone, so My World will ask you to confirm that you really want to
delete the field before performing the deletion.
29
Add New Fields From File... is used to add data to an existing layer by matching up the
records in a new data table loaded from a file to records in the existing layer's data table
based on values of one of each Layer's fields. For more information on this feature, see
Importing Tabular Data.
Editing Grid Layers
When editing a Grid Layer, the right hand side of the My World window is divided into
top and bottom sections, as shown in figure 19 below, similar to the way it's divided
when editing a Shape Layer. The top section is used for modifying the grid by painting
values or "pouring" values with a paint can, and the bottom section is where you select
which field to paint or pour into, and what value you want to paint with.
Figure 19. Editing a Grid Layer in Edit Mode
The Paintbrush Tool is used to paint the selected value (in this case, 22) into the grid, in a
square whose size is determined by the Brush Size setting.
The Paint Can Tool is used to "pour" values into the grid. Clicking on the Grid with the
Paint Can Tool will fill the grid cell you click on with the selected value, then fill any
30
adjacent cells whose value is the same as the cell you originally clicked on, then continue
filling until it encounters a cell with a different value or reaches the edge of the grid.
The Eyedropper Tool selects the value of whatever grid cell you click on in the value
selection panel below the grid, so you can use it to paint or fill in a different place. You
can access the Eyedropper tool any time you are using the Paintbrush or Paint Can tool
by holding down the Alt key (also known as the Option key on the Mac).
Editing Annotation Layers
When editing an Annotation Layer, the My World window in Edit mode appears as
shown in figure 20 below.
Figure 20. Editing an Annotation Layer in Edit Mode
You can create a new Annotation using the New Annotation Tool. When you click on the
Map using the New Annotation Tool, My World may create a new annotation at the
31
location where you click, depending on what is selected in the Source Layer Menu and
Source Field Menu. If the Source Layer is "None", then an empty Annotation will always
be created when you click on the Map, and you will have to enter the text for each
Annotation yourself. If a Layer is selected in the Source Layer Menu, My World will
only create an Annotation when you click on an feature in that Layer, and the Annotation
it creates will have the value of the field selected in the Source Field Menu as its text. For
example, in figure 20 above, the Source Layer is "Countries", and the Source Field is
"Name", so when you click on a country (in this case the US), My World creates a new
Annotation with that country's name ("United States") as its text.
To change the text of an Annotation once it has been created, you can click on the text
using the Edit Text Tool. To stop editing the text and save your changes, press the Return
or Enter key on your keyboard, or just click on the Map outside of the text.
Each Annotation points to a particular place on the Map, and the text of the Annotation
can be moved separately from the location it's pointing to. If the location an Annotation is
pointing to is not within its text, the Annotation will draw an arrow pointing to that
location. You can move either the text or the arrow using the Move Annotation Tool.
Sometimes Annotation will end up overlapping one another, especially if they are created
automatically by My World using the "New Layer..." button. The Declutter button can
automatically re-arrange Annotations so that none of them overlap. However, this
operation will permanently move your Annotations, and can sometimes make things look
worse than they did before. We recommend using Declutter only with automatically
generated Annotations, then re-arranging the labels manually using the Move Annotation
Tool to achieve the best results.
You can return each Annotation to the current location of the feature it points to by using
the Reset button. This can be useful if the Declutter button produces bad results. It is also
very important when you change the Projection of the map, because features will often
move far away from their original locations when you change projections, leaving the
Annotation text far away from the feature it points to. The Reset button can fix this
problem.
32
10. Editing Data Libraries
My World does not limit you to using only the Data Libraries that come with the
software. You can create new Data Libraries, and edit existing ones, using the Edit Data
Libraries Window, as shown below in figure 21, by selecting "Data Libraries..." from the
"Edit" Menu.
Figure 21. Adding a file to a Data Library in the Edit Data Libraries Window
The All Data Files & Projects list on the left-hand side of the window contains every data
file and project file that My World is aware of. The list on the right contains only those
data and project files that are in the Library selected by the Library Menu. When the
window first opens, no Data Library is selected and this list is empty. To edit an existing
Data Library, select it from the Library Menu. To create a new Data Library, select
"New..." from the Library Menu and enter a name for the new Library. Once a Data
Library is selected, you can add files to the Library by selecting them in the All Data
Files list and copying them to the Data Library using the Add Button, as shown above in
figure 21. You can also remove files from the current Data Library by selecting them and
pressing the Remove Button.
The Default Checkbox determines which Data Library My World will display when it is
launched. If you are setting up My World for a particular activity, you may want to set
that activity's Data Library to be the default so that it opens automatically in Construct
mode, and so is the first thing students see when My World is launched. Only one Data
33
Library can be the default, so if you check the Default checkbox for one Data Library, it
will become unchecked for every other Data Library.
For information on how My World finds the files to fill the "All Data Files & Projects"
list, see Section 13: How My World Finds Data.
11. File Types
Shape Data File Types
My World supports the following types of data files and/or folders for reading and
writing shape data:
•
ESRI Shapefile:, a set of three files with the same name and the file extensions
".dbf", ".shp", and ".shx" respectively. All three files are required. Other files,
such as ".prj" files, may be present, but My World doesn't require or use them.
The shapefile must contain unprojected latitude and longitude values, in decimal
degrees, in the range -180 to 180. My World can automatically un-project
shapefiles as they are imported, but you must know the original projection for this
to work. Import the data using the "Import Data From File..." button or menu item
to access the un-projection tool.
My World supports Point, Arc (line), Polygon and MultiPoint shapefiles.
•
Comma-Separated Values: a single text file with the extension ".csv", and comma
(",") characters separating each value. The first row of the file should list the field
names, and the first two columns must be latitude and longitude, respectively, in
decimal degrees, in the range -180 to 180. When you import a CSV file, My
World will give you the opportunity to re-arrange the columns so that latitude and
longitude are in the proper place.
My World uses the same CSV format as Microsoft Excel. If you want a comma
character to appear inside a cell value, the entire cell value must be enclosed in
double quotes ("). To include a double-quote character inside a quoted value, use
two double quotes in a row ("").
CSV files can only contain Point data.
•
Tab-Separated Values: a single text file with the extension ".tsv". Other
requirements are the same as for comma-separated files, except that tab (" ")
characters separate the values instead of comma characters.
If you want a tab character to appear inside a cell value, the entire cell value must
be enclosed in double quotes ("). To include a double-quote character inside a
quoted value, use two double quotes in a row ("").
34
TSV files can only contain Point data.
•
GPX Waypoint File: a single xml file with the extension ".gpx". This file is used
for importing GPS data into My World. If you need to import data from a GPS
device not supported by My World's built-in GPS importing functionality, the
easiest way to accomplish it is to save the data in GPX format.
My World can read GPX files, but it does not support saving data in GPX format.
Grid Data File Types
My World supports the following types of data files and/or folders for reading and
writing grid data:
•
•
ASCII Grid file: a single file with the extension ".asc".
Folder of ASCII Grid files: a folder whose name ends with ".asc", containing a set
of ASCII Grid files (whose names must also have the extension ".asc"). The files
will be listed as fields of the layer, in alphabetical order by file name.
By default, the origin, cell size, and dimensions of the grid will be those of the file
whose name is first alphabetically. Those settings can subsequently be adjusted in
the Edit Layer Appearance window.
•
•
•
NetCDF file: a single file with the extension ".nc". My World only supports
NetCDF files that use the Unidata Common Data Model. Also, My World can
only read NetCDF files, it cannot currently write data in NetCDF format.
WorldWatcher Grid file: a single file with the extension ".wwf". WorldWatcher is
a GIS that only handles grid data. It was the predecessor to My World GIS.
Folder of WorldWatcher files: a folder whose name ends with ".wwf", containing
any number of WorldWatcher files (whose names must also have the extension
".wwf"). The files will be listed as fields of the layer, in alphabetical order by file
name.
By default, the origin, cell size, and dimensions of the grid will be those of the file
whose name is first alphabetically. Those settings can subsequently be adjusted in
the Edit Layer Appearance window.
ASCII Grid files can be very memory-intensive, so it's better to save your data in
WorldWatcher format once you have imported it into My World.
Image Data File Types
My World supports the following types of data files and/or folders for reading and
writing image data:
35
•
•
JPEG image: a set of two files with the same name and the file extensions "jpg"
and "jgw". The "jpg" file contains the image, and the "jgw" file is called the
World File, and contains information about where on the map the image should be
displayed.
TIFF image: a set of two files with the same name and the file extensions "tif" or
"tiff" and "tfw". The "tif"/"tiff" file contains the image, and the "tfw" file is called
the World File, and contains information about where on the map the image
should be displayed.
My World can only read 1-band and 3-band TIFF files.
•
GeoTIFF image: a single file with the extension "tif" or "tiff".
Unfortunately, it's often impossible to distinguish GeoTIFF files from regular
TIFF files without using a program to open them. Sometimes, a GeoTIFF will
have ".geo." in its name, before the file extension, but not always.
If a "tfw" file is available, the file is probably a regular TIFF, and if not, then
nothing is harmed by putting a "tfw" file with a GeoTIFF, so always keep the
"tfw" file with the "tif" file if one is available.
My World can only read 1-band and 3-band GeoTIFF files.
Links to Dynamic Web Data
Using a dynamic web layer requires a working internet connection, on which port 80 (the
port used for World Wide Web traffic) is not blocked.
•
•
WMS link: a single file with the extension "wms_xml". The file does not contain
any data itself, just the address of a server that uses the Web Mapping Service
(WMS) to dynamically provide images to My World.
THREDDS link: a single file with the extension "thl". The file does not contain
any data itself, just a link to a THREDDS Server, which may provide either shape
data or grid data.
THREDDS stands for Thematic Realtime Environmental Distributed Data
Services and is a project of Unidata, a community of over 160 institutions vested
in the common goal of sharing data, and tools to access and visualize that data, to
support Earth-system education and research.
•
ArcIMS link: a single file with the extension "aims_lnk". The file does not contain
any data itself, just a link to an ArcIMS Server, which may provide either shape
data or dynamic image data.
ArcIMS Server is a commercial product produced by ESRI, and "ArcIMS" is a
registered trademark of ESRI, Inc.
36
The ability to connect to an ArcIMS server is only present in registered copies of
My World licensed for educational use.
Annotation File Types
My World supports the following types of data files and/or folders for reading and
writing annotations:
•
My World Annotation file: a single file with the extension "mwa". Annotation
files are My World-specific; no other programs are likely to be able to open them.
My World Annotation files contain only Annotation data.
Additional Layer Files
In addition to the data files specific to the particular file type, My World will add two
new files when it saves a layer. Both of these files will have the same name as the layer's
data file(s), but a different file extension.
•
The Layer File ends with the extension ".myl" and contains information about
how by My World should display the data file, such as default appearance settings
for each field, and information about each field, such as its category and units.
If you lose or delete the Layer File, My World will still be able to read the data
file, but any appearance settings you might have customized will be re-set to their
default values.
•
The Data Documentation file is a text file (.txt) file which contains information
about where the data came from, who owns it, and where to look for more
information about it.
Project Files
My World can save two different types of Project files.
•
•
Project Folder (.m3vf): is a folder whose name ends in ".m3vf", containing all of
the project's data files, included files, linked files, and all of its appearance
settings.
Compressed Project File (.m3vz): is a single file, containing a m3vf folder that
has been compressed using ZIP compression. You can examine the contents of an
m3vz file by opening it using a program that can read ZIP files, such as WinZip.
While you are working on a project, it is best to save it as a m3vf folder, because reading
and writing to the folder is faster, since it doesn't involve compressing the data.
37
If you want to share your project with someone using another computer, you should save
it as an m3vz file, because the file will be smaller and it's easier to copy a single file from
one computer to another than a whole folder full of files.
If you are downloading an m3vz file and your web browser unzips it without asking you
(as Safari sometimes does, unfortunately), you can simply add ".m3vf" to the end of the
name of the resulting folder and open it as a project folder in My World.
Tour Files
A tour is an HTML file that has been specially formatted for My World, to break it up
into individual screens -- usually corresponding to steps the user should take as he or she
navigates through the tour. Tour file names must end with the extension ".mwht".
In addition to standard HTML (including styles, but not CSS), My World tour files
support several additional tags:
•
<!--break-->
indicates where the break between one tour section and the next
should occur.
This tag may occur any number of times, but only between the <body> and
</body> tags of the document.
•
<!--size: [number] [number]-->
indicates the preferred window size for this
tour.
This should occur only once, between the <head> and </head> tags of the
document.
In addition to these special tags, My World also supports several special hypertext
references you can use in your anchor tags in a tour document:
•
the link will cause the My World window to switch to Construct Mode,
and select the "All Projects" Data Library from the Library menu.
#project
Example: <a href="#project">Open Projects Library</a>
•
#welcome
will close the current tour and re-open the Welcome Window.
Example: <a href="#welcome">Return To Welcome Window</a>
To see more examples of what a tour file should look like, take a look at the files in My
World's tours folder.
38
12. Importing Data
Importing Map Data
There are two important things to assess about map data you'd like to import into My
World:
1. File Format
The data must be in one of the File Formats supported by My World.
You may need to use another program to convert the data into a format that My
World understands.
2. Units & Projection
My World accepts shape data only in Unprojected Latitude and Longitude in
Decimal Degrees, and the longitude must be in the range -180 to +180 (rather
than 0 to 360).
If your data uses another projection or different units, you can use My World to
un-project and convert it to the proper units by selecting Un-Project Shapefile...
from the File menu, or by clicking the Import Data From File... button in
Construct mode.
My World accepts projected grid and image data, but you must know all the
details of the projection used to project that data before you can use it in My
World.
Once you have the data in the proper file format, units, and projection, you need only
copy it into the "data" folder inside the My World folder and (re-)launch My World. The
new data file will appear in the "All Data Files" Data Library. The Import Data From
File... button that appears in the Toolbar in Construct mode will also add the chosen file
to the "All Data Files" library.
If the data file is not located in the "data" folder, or in another folder that My World is
configured to search when it launches, that file will disappear from the Data Library the
next time My World is launched. See Section 13: How My World Finds Data for more
information on how My World searches for data, and why your data files should go in the
"data" folder.
Now You're ready to add the new data to your map and proceed to edit the Layer's
information.
39
Editing Layer Information
Almost as important as the data itself is how that information is formatted and displayed.
You can control most aspects of that using the Layer Information window. It is very
important that you open this window and customize the settings whenever you import a
new data file. A number of features of My World depend on the information in the Layer
Information window being accurate, and the only way to ensure that the settings are
accurate in every project the Layer appears in is to set it up properly when you first
import the layer.
Once this information has been entered, don't forget to select "Save Layer" or "Save
Layer As..." from the "Layer" menu, or you will have to re-enter all of the settings in the
Layer Information window the next time you add the data file to a project.
To open the Layer Information window, make the target layer active, then select Edit
Layer Information... from the Layer menu. You will see a window similar to the window
in figure 22, below:
Figure 22. The "General" tab of the Edit Layer Information window.
Every Layer's Edit Information Window has a General tab, to edit general settings for
that layer. The other tabs that appear in the window depend on what kind of layer you are
editing. In this case, we are editing the information of a Shape layer.
At the top of the General tab is a text box for editing the Layer Name. Below that is a text
box for Data Documentation. In this space, you should enter a brief description of the
40
data in the Layer, where it came from, and who owns the copyright to the data, if it is not
in the Public Domain.
Below the Data Documentation area is a check box that allows you to Lock Layer Data.
If the data is locked, any changes that are made to the Layer cannot be saved back to the
original data file; they must instead be saved to a new file, with a new name. This is
useful for maintaining the integrity of the source data and keeping it separate from any
computed or modified data.
Below the layer-locking button, there are controls for setting Minimum and Maximum
Scales for the layer. Some extremely detailed layers can slow down drawing the map
when the entire layer is visible, so it may be necessary to set the Layer to hide itself when
the scale is above a certain value. Likewise, some low-detail layers may look good when
you are zoomed out, but look terrible when you zoom in on them. These layers can be set
to hide themselves automatically when the scale drops below a certain value.
An Edit Information Window for a Shape and Grid Layers will also have a Fields tab, as
shown below in figure 23. This is used to set up the appearance and behavior of the
Layer's Data Table.
Figure 23. The "Fields" tab of the Edit Layer Information window.
The Fields tab consists of a table whose columns represent the Fields of the layer, and
whose rows represent aspects of each Field's behavior that can be customized. The rows
are used as follows:
41
•
•
Name is used to give the field a more descriptive name than is present in the data
file.
Category is the general category of data the field falls in. This is used by the Data
Library to list fields by category. Some categories your data may fall into include:
o Physical Geography: information about the physical characteristics of the
features, such as their length, height, area, etc...
o Political Geography: political information about features on the map, such
as their names, what state or country they belong to, etc...
o Population: information about population.
o Demographic: information about sub-groups of people, such as those of a
particular race or sex.
o Economic: information about the economic activity of people, such as the
Gross National Product of a country.
If the field's data doesn't fall into any of the listed categories, you can just choose
"Other", or select "New..." from the category menu and create a new category.
•
•
•
•
Subcategory is currently not used by My World, but we plan on eventually using
this space to hold temporal (time) information about each field, such as when the
data was collected, or what date or range of dates the data is valid for. If you have
that information, we suggest you enter it here to take advantage of those new
features when they are completed. But it's not necessary to do so.
Data Type is not editable. It tells you what kind of values the field has in the data
file.
Effective Type is editable, and tells My World how to treat the values of the field.
For example, you might have an field that contains Number values, but you want
to treat them as Text instead. You can do this by selecting "Text" as that field's
Effective Type. When you save this Layer, values in this field will be permanently
converted to their Effective Type, so be cautious when using this feature. You
may want to make a copy of the field in Edit mode first.
Format is also only meaningful for numeric fields. It determines how numbers
will be converted to text when they are displayed. Here are the four built-in
choices and how some numbers are displayed using each:
Built-In Formats
Default
Fixed-Point
Scientific
Zip Code
3,124
3124
3.124e3
03124
1,000,000 1000000
1.0e6
99999
0
0.000001
1.0e-6
00000
3.141
3.14159265359 3.14159265359 00003
42
•
•
•
The Format menu also allows you to create a Custom Format. At its most basic, a
custom format consists of some combination of "0" representing a digit that is
always displayed, "#" representing a digit that is only displayed if necessary, and
"." representing the decimal separator. For example, you might use "0.00" or
"0.##" as formats for displaying monetary values less than $10.
The Format also determines how numeric values are converted to string values
when a field's effective type is changed from "Number" to "String".
Units is only meaningful for numeric fields. It should describe what measurement
units the values in the field represent. My World understands the units for many
different kinds of quantities. You can enter the abbreviation of the field's units
directly into this row in the table, and My World will make the text bold if it
recognizes the units, as shown below in figure 24.
Figure 24. Editing Units
You can also press the Select Units button, which will display a dialog box that
lists all of the units that My World understands, along with several ways for
creating new units.
It is not required that you select units that My World understands, but the ability
to change the Display Units is only supported for units that My World
understands.
•
Display Units is where you select what units the values in this field should be
displayed. For example, you might want to display temperature values in degrees
Fahrenheit instead of degrees Kelvin.
The ability to change the Display Units is only supported for units that are built
into My World.
When you save the Layer, values in this field will be permanently converted to
their Display Units, and the Display Units will become the regular Units. All unit
conversions are completely reversible, so no data will be lost in the process.
•
Missing-Value is only meaningful for numeric fields. Frequently a particular
number, often -99 or -9999, is used to represent a missing value. Entering that
number here allows My World to treat that number specially when computing
statistics and categorizing values.
43
If your data file uses empty values rather than using a particular number to
represent missing values, you should enter "NaN" (short for "Not a Number")
rather than leaving this value blank, so that My World knows there are missing
values in the field.
•
Display is an on/off switch that allows you to hide certain fields from users of
your data. If there are extra fields that you don't expect people using your data to
need, you can hide them rather than deleting them. That way, if those fields
become useful at some point in the future, you still have them available.
Once you have made the necessary changes to the Layer Information, remember to save
your changes by selecting "Save Layer" or "Save Layer As..." from the "Layer" menu.
Importing Image Data
To display a TIFF or JPEG image in My World, you must have a World File for that
image. My World cannot display an image without a World File. A World file for JPEG
images must have the same name as the image file, and its name must end with the file
extension ".jgw". A World File for a TIFF image must have the same name as the image
file, and its name must end with the extension ".tfw".
If you don't have a World File but you know the location of the upper-left corner of the
image and the size of each pixel, you can create a new World File for the image using the
Edit Layer Information window. The space to enter that information is on the Image
Location & Size tab, as shown in figure 25 below.
Figure 25. Setting the location and size of an Image Layer.
44
As with map data, it is also important to know the Units and Projection of image data you
are importing. My World can display an image even if its projection information is
missing or incorrect, but the image will not line up properly with other Layers if the
projection information is not correct. You must tell My World what projection the image
uses using the Projection tab in the Edit Layer Information window, as shown in figure
26 below. The website or person you obtained the image from should be able to tell you
what projection the image uses.
Figure 26. Setting the Projection of an Image Layer.
If an image is labeled as "unprojected" or as having no projection, use the Standard tab in
Projection Controls, and select Geographic as the projection type, and Degrees as the
units, as shown in figure 26 above.
Be sure to select "Save Layer" from the "Layer" menu after setting up an Image's
Location and Projection, so that My World will remember those settings if you add the
Image to another project.
For information on how to acquire and import aerial photographs and topographic maps
of your area, visit the online help center.
Importing Tabular Data
If you have Tabular data (that is, data in the form of a table) as opposed to map data, you
can still import that data into My World by Joining that data to an existing map data file.
Of course, this only works if the rows of your table correspond to records in the map
data, but it's a powerful way to add value to the data files included with My World. To
join data to an existing file, you'll first have to add that file to the Map to create a Layer,
45
then switch to Edit mode and double-click on the Layer's Control Panel to begin editing
the Layer. Click on the Add New Fields From File... button in the Edit Table Panel (as
shown below in figure 27).
Figure 27. The Import Data button.
This will open a File Chooser window, where you can choose the file you are importing.
My World can import tabular data from three types of files:
•
dBase Files: this is the type file used to hold tabular data for ESRI Shapefiles.
This format can be written and read by many commercial database and
spreadsheet programs. It consists of a single file, with the ".dbf" file extension.
dBase files are binary files, which means they can't be read with a text editor. You
need a database or spreadsheet program (or My World) to edit the values in the
file.
•
Comma-Separated Values: a single text file with the extension ".csv", and comma
(",") characters separating each value. The first row of the file may list the column
names, or it may be the first row of data. When you import a CSV file, My World
will show you the first row of the file and ask you if it contains column names or
the first row of data.
My World uses the same CSV format as Microsoft Excel. If you want a comma
character to appear inside a cell value, the entire cell value must be enclosed in
double quotes ("). To include a double-quote character inside a quoted value, use
two double quotes in a row ("").
•
Tab-Separated Values: a single text file with the extension ".tsv". Other
requirements are the same as for comma-separated files, except that tab (" ")
characters separate the values instead of comma characters.
If you want a tab character to appear inside a cell value, the entire cell value must
be enclosed in double quotes ("). To include a double-quote character inside a
quoted value, use two double quotes in a row ("").
Once you have chosen the file to import and, if necessary, told My World whether the
first row contains field names or data, you will see the the Import Data Window, as
shown below in figure 28.
46
Figure 28. The Import Data window.
In order to match up rows in your data file with records in the Layer's Data Table, you
need to pick which field will be used to do the matching. Usually the best field for this
will be a name, but any field that has a unique value for each row and is present in both
the Layer Data Table and the data file being imported will work. If both tables have an
field called FIPS or FIPSCODE, that will usually be the best field to use for matching
rows. FIPS stands for Federal Information Processing Standards, a service of the National
Institute of Standards and Technology, which assigns a unique identifier to each city,
county, state, province, country, etc..., for this exact purpose (i.e., enabling sets of data in
different files to be joined together). Use the two menus at the top of the Import Data
window to choose the field from the Layer Table and from the imported data which are to
be linked.
For those of you familiar with databases, My World is performing an Inner Join on the
new data and Layer data. If a record in the Layer matches multiple records of the
imported data, only the data from the first match will be used.
13. How My World Finds Data
The File Index
To make it possible to copy Data Library files from one computer to another, My World
uses a File Index to associate file names with actual files on your computer. The Data
Library file only contains the file names, making it possible to copy the Data Library file
and its associated data files from one computer to another without ever worrying about
the file paths on the two computers being the same. The File Index takes care of mapping
the file name to an actual file on disk. This introduces a significant limitation on the File
Index:
The File Index can't contain two files with the same name.
If the File Index contained two files with the same name, when My World opened a Data
Library containing a file by that name, it would have no way of knowing which of the
two files was supposed to be in that Data Library.
47
When My World launches, it searches one or more folders for data files and project files
(see below for more details), and adds everything it finds to the File Index. If it
encounters two files with the same name, it has to either ignore or rename one of the two
files, because it can't have both of them in the File Index at the same time.
That is why My World will sometimes ask you to ignore or rename one of two files when
it launches. In general, it is best to rename whichever of the two files you have created
more recently, as the older file may appear in some Data Libraries, and it would be
replaced by the newer file if it were renamed.
Getting My World to Index Your Data
My World will always index the "data" folder inside the My World program folder,
because that is where the data that comes with My World is installed. My World will also
look for a "data" folder inside a folder named "MyWorld" in the current user's home
directory, and index its contents if it exists. If the current user doesn't have permission to
add files to the program data folder, My World will automatically create the data folder in
the user's home directory, so the user always has a place to save his or her files.
The preferred way of getting My World to index your data is to put it in one of those two
locations. If for some reason you can't put your data in either of those locations, My
World can still index it in one of two ways:
•
Add the folder containing your data to the list of folders My World searches at
startup, using the Preferences... item in the Edit menu. My World will always
search the "data" folders at startup, but you can also tell it to search additional
folders anywhere on your computer using the Preferences dialog.
Use this option if you will be using data in that folder on a long-term basis.
•
Manually index the folder containing your data, by selecting Index Folder... from
the File menu and choosing the folder or disk containing your data.
Use this option if you are using data in that folder only for the duration of your
My World session, as the folder will not be automatically indexed the next time
My World is launched.
When you manually index a folder this way, My World will create a new Data
Library with the same name as the indexed folder, containing all the files it found
in that folder.
If you open a Data Library that contains a reference to a file that is not in the current
index, My World will allow you to find the file manually, by using a File Chooser. If you
successfully find the file, it will be added to the current index, but only until you quit My
World.
48
14. The Menu Bar
•
File menu
o New Project: Clear all Layers and Selections from the current Map and
start fresh with an empty Map. You will be prompted to save the current
Map if you have made changes to it since the last time you saved it.
o Open Project...: Prompts you to select a Project folder (.m3vf) or file
(.m3vz) and loads the project into the Map. You will be prompted to save
the current Map if you have made changes to it since the last time it was
saved.
o Open Data Library...: Prompts you to select a Data Library (.dlb) file,
switches to Construct Mode, adds that file to the Data Library menu and
selects it.
o Index Folder...: Prompts you to select a folder and searches that folder for
any data and project files that My World can open. Creates a new Data
Library containing all those files, and also adds them to the "All Data
Files" or "All Project Files" Library, as applicable.
o
Import Layer From File...: Prompts you to select a Data File and adds it to
the "All Data Files" Data Library if you are in Construct mode, or adds a
new Layer to the map using that data file if you are in another mode.
This menu item will also give you the opportunity to un-project or
otherwise re-format the data if necessary.
o
o
Import Layer From The Internet...: Opens a dialog with a number of
options for downloading data from the internet. The options available will
depend on settings in the Preferences... dialog and on whether or not your
copy of My World is licensed for educational use.
Import Layer From GPS Device...: Launches a special application for
reading data from GPS device, and imports that data into My World.
This feature only works on Mac OS X and Microsoft Windows. It is not
yet implemented for Linux.
o
o
Combine Grid Layers...: Opens a dialog that allows you to select multiple
Grid Layer data files and combine selected fields from them into a single
Layer.
Merge Shape Layers...: Opens a dialog that allows you to select multiple
Shape Layer data files (of the same Shape Type) and merge them into a
single layer.
49
o
Un-Project Shapefile(s)...: Prompts you to select a shapefile (.shp) or
folder of shapefiles, choose the projection used by the file(s) and the
parameters for that projection, and select a new location to save the unprojected data. Converts the projected data into unprojected latitude and
longitude in decimal degrees (the format used by My World) and saves the
converted data in the new location.
o
Layout And Print...: Opens the Print Preview window, which allows you
to lay out your map with legends, scale information, and labels and allows
you to print your map to a file in a number of different formats.
Save Project: Saves the current state of the Map to a Project folder or file.
If the current Map has already been saved to a file (or was loaded from a
project file), it will save to that same file. Otherwise it will prompt you for
a new file in which to save the Map.
o Save Project As...: Prompts you for a new file location and saves the
current Map to that location. By default, projects are folders with the
extension "m3vf". If you select the "Compress Into A Single File" option,
the project will instead be saved in a single file with the extension "m3vz".
If any of your layers use Link fields, you may want to include the linked
files in the project folder/file. This will increase the size of the project, but
it will ensure that the file will work properly on other computers.
o Quit: Exits My World.
Edit menu
o Undo: Undoes the previous editing operation. Only some operations (e.g.,
changing a shape or data table value in Edit mode, deleting a Selection)
can be undone.
o Redo: Re-does the last operation that was undone.
o
•
o
o
o
Cut: Places a copy of the selected text or shape on the Clipboard and then
deletes it.
Copy: Places a copy of the selected text or shape on the Clipboard without
deleting it.
Paste: Places the contents of the Clipboard into the selected text box or
shape record.
50
o
o
o
•
Preferences...: Opens the Preferences Dialog, which you can use to
change the default measurement units and background color, and to
customize the RAM usage and startup behavior of My World.
Colorschemes...: Opens the Colorschemes Dialog, which you can use to
edit the Colorschemes available for choosing map colors, and create new
Colorschemes.
Data Libraries...: Opens the Edit Data Libraries window, where you can
add or remove data files from existing Data Libraries, and create new Data
Libraries (see Section 10: Editing Data Libraries).
Project Menu
o Files...: Opens a window which allows you to add and remove files stored
inside the current project. Files stored in the current project are accessible
using the Link Tool, in a special link flag icon that appears in the lowerleft corner of the map. The special link only appears when the Link Tool is
selected and when there are files stored in the current project.
o Settings...: Allows you to edit certain project settings, such as the name
that appears in the My World window's title bar when the project is open,
and the background color of the Map.
The Project Settings window is also where you can delete and rename
saved Map Views, and edit the Tour associated with the project.
o
Projection...: Is a hierarchical menu that allows you to change the
Projection of the Map, just like the Projection Menu in the toolbar.
Sometimes a computer's monitor is too small to use the Projection Menu
in the toolbar, so in that case the Projection menu item can be used
instead.
For more information on Map Projections, see Map Projection Basics.
•
Layer menu
o Edit Layer Information...: Opens a window which you can use to control
how the fields (columns) of the selected Layer's data table are displayed.
Generally, using this window should only be necessary when importing a
new data file into My World. For more information on editing Layer
information, see Section 12: Editing Layer Information
o
Show Data Documentation...: Opens a new window with information
about the source of the data for the selected Layer. Has the same effect as
clicking the Show Data Documentation button in Construct or Visualize
mode.
51
Data Documentation can be edited in the Layer Information window.
o
Edit Layer Appearance...: Opens a window which you can use to change
how the active Layer is displayed. Has the same effect as clicking the Edit
Layer Appearance button on the Toolbar in Construct or Visualize Mode.
For more information on editing Layer appearance, see Section 5: The
Edit Layer Appearance Window.
o
o
o
Show Layer Table...: Opens a new window containing the data table
associated with the active Layer. Has the same effect as clicking the Show
Table button in Construct or Visualize Mode.
Delete Field...: Allows you to delete a field from the active Layer's data
table.
Remove Layer From Map/Delete Selection: If a Layer is active, removes
the active Layer from the map. If a Selection is highlighted, deletes that
selection from its containing Layer.
Which menu item title appears depends on whether a Layer or Selection is
active.
Has the same effect as clicking the Remove button in Construct or
Visualize Mode.
o
o
o
o
Show Layer Histogram/Bar Chart...: Opens new window displaying a
histogram (a bar graph of the number of observations per range of values)
or bar chart showing the number of records per category, for the data table
of the active Layer. Has the same effect as clicking the Show Histogram
button in Visualize Mode.
Show Layer Statistics...: Opens new window displaying statistics (i.e.,
sum, median, mode, standard deviation, etc...) for the data table of the
active Layer. Has the same effect as clicking the Show Statistics button in
Visualize Mode.
Save Layer: Saves the active Layer to the data file it came from. If the
active Layer was created by analysis and didn't come from a data file, or if
the Layer's data files is locked, prompts you for a new file to save the data
in.
Save Layer As...: Prompts you for a new file and file type and saves the
active Layer to that file, in the selected format.
52
•
Windows menu
o Welcome Window...: Re-opens the Welcome Window: the window full of
links to documentation that opens automatically when you launch My
World.
o Memory Monitor...: Opens a window that displays information about how
much of your computer's memory My World has claimed, and how much
of that memory My World is currently using. If you're having trouble with
My World running out of memory, this can help you diagnose exactly
which Layer or Analysis tool is causing the problem.
o New Child Window...: Opens a Child Window, a floating window which
contains a Map with the same data as the Map in the main window, with
all the same appearance characteristics. You may then modify the
appearance of the main window's Map, but the Child Window's map will
remain the same.
This is especially useful for comparing two different fields of a Grid Layer
(or two different Grid Layers, for that matter).
o
New Notes Window...: Opens a Notes Window, a simple text document
editor for saving notes about your work in My World. Your notes can
easily be saved inside the current project, so you can come back to them
later.
The remainder of the Windows menu consists a list of all the currently
open My World windows. Select a window's name from the menu to bring
it to the front.
Help menu
o My World Help...: Opens the document you're looking at right now.
o Welcome Window...: Re-opens the Welcome Window: the window full of
links to documentation that opens automatically when you launch My
World.
o About My World...: Opens the small splash screen with version and
copyright information.
o Enter License Key...: Allows you to upgrade from a trial version to a fully
licensed version of My World, or to renew an expired license.
o
•
o
o
Online Help Center...: Opens My World's Online Help Center, where you
can find help on additional topics not covered in this document, in your
default web browser.
Online Data Center...: Opens My World's Online Data Center, where you
can download additional data not included in the default installation of My
World, in your default web browser.
53
o
Online Activity Center...: Opens My World's Online Activity Center,
where you can download complete activities using My World, in your
default web browser.
A working internet connection is required to use the Online Help, Data, and
Activity Centers.
54
15. Glossary
Colorscheme
A Colorscheme is a system for assigning colors to an ordered series of categories.
The categories may be determined by ranges of numbers, or by a set of text
values.
Data Library
A Data Library is a collection of data files, usually data about a particular place or
data to be used in a particular activity.
Equal Interval
Equal Interval is a method for dividing a range of numeric values into categories.
It divides the values up in such a way that each category covers an equal amount
of space along the range. For example, the range 0 to 100 would be divided
equally into categories containing values from 0 to 25, 25 to 50, 50 to 75, and 75
to 100.
Feature
Used to refer to a Shape or a single cell of a Grid. The Feature is what appears on
the Map, and each Feature is associated with a Record, which holds all the other
information about what that Feature represents.
Field
A Field is a single aspect of each piece of data in a Layer. For example, a Layer of
cities might contain one field for the name of the city, one for the population of
the city, and another for whether or not the city is a capital. Each piece of data
consists of one or more Features on the Map, which are associated with a Record,
and each Record in the Layer will contain a value for each of that Layer's Field's.
A Field corresponds to a column the Table view of a Layer.
Fill Color
Fill Color is the color used to fill in the interior of a Polygon. This is distinguished
from the Outline Color, which is the color used to draw the edges of the Polygon.
Graticule
A Graticule is a type of grid, consisting of lines of equal longitude (also known as
Meridians), and lines of equal latitude (also known as Parallels). Using a
55
cylindrical projection, the lines are straight and perpendicular to one another.
Other types of projections may render them as curved lines.
Grid
A Grid Layer consists of Cells that, together, entirely cover an area of the Earth's
surface. The edges of the Cells are rectangular with respect to latitude and
longitude, which means they may or may not appear rectangular on the map,
depending on the projection. The cells are equal in size with respect to latitude
and longitude, but not in terms of area of the Earth's surface. Cells closer to the
poles cover less area than those closer to the equator.
Layer
A Layer is a component of a My World Map. Layers are stacked on top of one
another to produce the overall appearance of the Map. Layers may be transparent,
to allow you to see the Layers beneath them, or opaque, to obscure the layers
beneath them. You can re-order the stack of layers at any time by dragging a
Layer's Control Panel up and down the Layer List.
Layer Control Panel
A set of controls for displaying and adjusting the appearance of a Layer of the
Map. The order of the Layer Control Panels in the Layer List also serves to
determine the stacking order of Layers in the Map. You can click and drag a
Layer Control Panel within the list to adjust its position in the stack.
Layer List
The Layer List is a collection of Layer Control Panels, one for each Layer of the
map. The order of those Control Panels determines the stacking order of Layers in
the Map.
Lines
A Lines Layer is a type of Shape layer, where each shape consists of one or more
Polylines. A Polyline is a series of line segments joined together at their end
points. Lines layers are often used for representing rivers, roads, railroads, and
other linear (line-like) features.
Map View
A Map View is a saved appearance of the Map. It captures the appearance of
every Layer, as well as the current Scale and Projection, without saving any of the
associated data. It can be used to return later to the current appearance and
location.
56
Natural Breaks
Natural Breaks is a method for dividing a range of numeric values into categories.
The non-technical explanation is that it uses a mathematical formula to give you
the best breaks between categories for a good map. The technical explanation is
that it uses an iterative process to minimize the within-category variance.
Computing Natural Breaks may take 5-10 seconds for very large data sets (i.e.,
those with more than 20,000 records or so).
Outline Color
Outline Color is the color used to draw the edges of a Polygon. This is
distinguished from the Fill Color, which is the color used to fill in the interior of a
Polygon.
Points
A Points Layer is a type of Shape Layer where each shape consists of one or more
points.
Polygon
A Polygon Layer is a type of Shape Layer where each shape consist of one or
more Polygons. A polygon is a region on the map enclosed by three or more
straight edges. Polygons may also have holes in them.
Project
A Project is a file that captures the overall state of the map, including all the
Layers, their appearance, and any Selections associated with them. A Map View
may also include other files linked to specific features in a Layer, or to the project
as a whole.
Projection
A Projection is a system for translating the 3-dimensional points on the Earth into
2-dimensional points on your computer screen. For more information on
Projections, see CUNY's Map Projection Basics page.
Quantiles
Quantiles is a method for dividing a range of numeric values into categories.
Quantiles divides the range up so that each category has the same number of
values in it.
Record
57
A Record contains all the information about a single member of a Layer, other
that its location and shape on the Map. A Record contains a value for each Field
in the Layer. Records correspond to rows in the Table view of a Layer.
Selection
A Selection is a subset of the records of a Layer. For Shape Layers, a Selection
will contain some of the Shapes of the Layer and their associated records. For
Grid Layers, a Selection will contain some of the Cells of the Grid and their
associated records.
Shape
A Shape Layer is a type of Layer made up of shapes and their associated records.
The shapes may be points, lines, or polygons, and the records may consist of
numbers, names, dates, web links, or other pieces of data.
Symbol
A Symbol is a small icon drawn at a particular point on the map. For Point Shape
Layers, Symbols are drawn so they are centered around each point. For Polygon
Shape Layers, Symbols are drawn at the center of the Polygon. There are three
kinds of Symbols that My World produces:
•
•
•
Map Symbol: Symbols are chosen from a set of more or less meaningful
shapes, including circles, stars, squares, triangles, pushpins, flags, and a
number of standard map symbols for such features as campgrounds,
schools, churches, mines, etc...
Pie Chart: Symbols are pie charts that range from empty to full. The first
interval or category will have an empty pie as its symbol, the last interval
or category will have a full pie as its symbol, and intervals or categories in
between will have pies evenly spaced from empty to full.
Arrow: Symbols are arrows which vary in direction. The first interval or
category have an arrow pointing up, and the direction arrows for
subsequent intervals or categories will move clockwise by an equal
amount so that the last symbol is exactly that amount in the counterclockwise direction from pointing straight up again.
58
16. Frequently Asked Questions (FAQ)
•
Q: I changed the transparency of one of my Layers, now it seems to have
disappeared. Where did it go?
A: If you set the transparency of a Layer to 100%, it will not appear at all; the
Layers beneath it will show through completely. To see the Layer again, set its
transparency to a value less than 100%.
•
Q: I'm trying to enter a value into a table (in the Layer Appearance Window, the
Layer Information Window, or the Edit Table Panel), but every time I finish
typing and click somewhere else, it goes back to its original value. What gives?
A: Some Java implementations require that you press Return or Enter when you
are editing a table before you click elsewhere, or the changes will not "stick". Try
pressing Return or Enter after making your changes.
•
Q: I'm trying to enter a Date or Time in Edit mode, and My World keeps telling
me that the value I'm entering doesn't appear to be a Date. How I make this
work?
A: My World prefers Date and/or time values in ISO 8601 format, but it will
accept values in any of the following formats:
1. y
year only, any number of digits, negative values for BCE
2. y e
year followed by era (BC/AD or BCE/CE)
3. yyyy-mm-dd
ISO 8601 year-month-day format
4. m/d/y
month/day/year, any number of digits, separated by "/"
5. hh:mm:ss
hours:minutes:seconds, two digits apiece, separated by ":"
6. hh:mm:ss am/pm same as above, plus "am" or "pm"
7. hh:mm
hours:minutes, two digits apiece, separated by ":"
8. hh:mm am/pm
same as above, plus "am" or "pm"
9. #2 or #3 above followed by any of #5-8
Times you enter are assumed to be in the local time zone. My World stores times
internally in Coordinated Universal Time (UTC), and always displays them using
the local time zone.
59
•
Q: Can I put images on my Map?
A: Yes! As of Version 3.0 My World does support images. See Section 12:
Importing Image Data for information on how to import new images data My
World.
•
Q: Where can I find an aerial photo or topographic map for my area?
A: See the online help center for step-by-step instructions on how to download
and import aerial photographs and topographic maps of your area.
•
Q: How can I put labels on my Map?
A: Go to Edit Mode and click the "New Layer..." button. Select "Annotation" as
the type of the new layer, then either select the Layer or Selection you want to
label, or simply click OK, then create the labels one-by-one. See Section 9:
Editing Annotation Layers for more information on how to do this.
If you don't see the answer to your question here, try the Online Help Center
Acknowledgments
Software
Early versions of My World were based on OpenMap™, a toolkit built on the
JavaBeans™ component architecture by BBNT Solutions. My World still calls some
library functions from OpenMap, modified as described in the OPENMAP_README
file in the notes folder.
My World also uses the Java Topology Suite (JTS) library, developed by Vivid
Solutions. JTS is Free Software released under the LGPL license. You can access the
source code to the library here.
My World also uses the JFreeChart chart library, developed by Object Refinery Limited
and Contributors. JFreeChart is Free Software released under the LGPL license. You can
access the source code to the library here.
My World also uses the Joda Time Library, developed by Stephen Colebourne. The
License for the Joda Time Library can be found in the notes folder. For more information
on Joda Time, see joda-time.sourceforge.net.
My World also uses the Java Advanced Imaging (JAI) Library developed by Sun
Microsystems. The license for the JAI library can be found in the notes folder.
60
My World also uses the JDOM Document Object Model Library, developed by the
JDOM Project. The License for the JDOM Library can be found in the notes folder. For
more information on JDOM, see www.jdom.org.
My World also uses the Xerces XML Parser, developed by the Apache Software
Foundation. The License for the Xerces Library can be found in the notes folder. For
more information on Xerces or the Apache Group, see www.apache.org.
My World also uses the BrowserLauncher class developed by Eric Albert. For more
information on BrowserLauncher, see browserlauncher.sourceforge.net.
My World also uses the THREDDS data access libraries, developed by the Unidata
Program Center at the University Corporation for Atmospheric Research. THREDDS is
Free Software released under the LGPL license. You can access the source code to the
libraries here.
My World also uses the MapObjects library, to connect to ArcIMS servers. MapObjects
© copyright 2005, Environmental Systems Research Institute, Inc. All rights reserved.
My World also uses several libraries from FreeHEP, an Free Software library for High
Energy Physics developed by contributors from CERN, SLAC, and UC Santa Cruz.
FreeHEP is released under the LGPL license. My World uses a slightly modified version
of one the libraries. The source code for both My World's version of that library and the
original version can be found here. For the complete FreeHEP source code, or more
information on FreeHEP, visit the project's home page.
A small portion of My World (the handler for file: URL's) is based on code from the
Geronimo J2EE Container from the Apache Software Foundation. For more information
on Geronimo, see geronimo.apache.org.
OpenMap is a trademark of BBN Technologies, a part of Verizon
JavaBeans is a trademark of Sun Microsystems, Inc.
ESRI and the ESRI globe logo are trademarks, registered trademarks, or service marks of
ESRI in the United States, the European Community, and certain other jurisdictions.
Data
Some of the data files in the My World distribution contain proprietary and confidential
property of Environmental Systems Research Institute, Inc. (ESRI), Redlands, CA, and
its licensor(s). Northwestern University is distributing these data under the terms of a
license from ESRI. The list of these data files and the terms and conditions for the use
and re-distribution of that data are available here.
61
Support
My World GIS was prepared with the support of NSF Grants ESI-9720687, 0085946,
0352478, 0333529, and 0422545. However, any opinions, findings, conclusions, and/or
recommendations herein are those of the authors and do not necessarily reflect the views
of the National Science Foundation.
References
My World makes use of algorithms from the following publications:
•
•
•
•
•
•
M. Bevis and G. Cambareri, "Computing the Area of a Spherical Polygon of
Arbitrary Shape", Mathematical Geology, Vol. 19, 1987.
Bourke, Paul, "CONREC: A Contouring Subroutine", Byte Magazine, June, 1987.
George F. Jenks and Fred C. Caspall, "Error on Chloroplethic Maps: Definition,
Measurement, Reduction", Annals of the Association of American Geographers,
Vol. 61, No. 2, 1971.
William H. Press et. al., Numerical Recipes in C, Cambridge University Press,
New York, 1992.
Joeseph O'Rourke, Computational Geometry in C. Cambridge University Press,
New York, 1998.
John P. Snyder, Map Projections -- A Working Manual. US Geological Survey
Professional Paper 1395, US Government Printing Office, Washington, DC.,
1987.
62


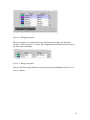
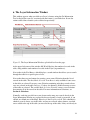
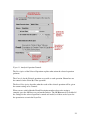
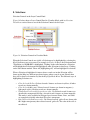
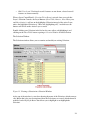

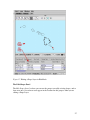
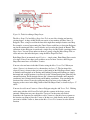
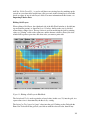
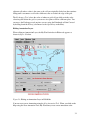
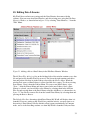
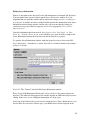

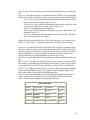
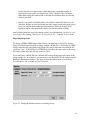


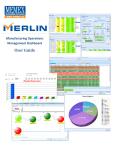


![MapInfo [v9.5 - v10.0] User manual PDF](http://vs1.manualzilla.com/store/data/005662542_1-c58f11f989f54f88b5c049879cd1b1b4-150x150.png)