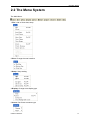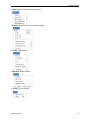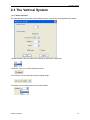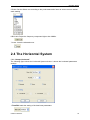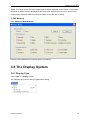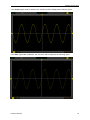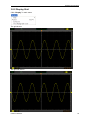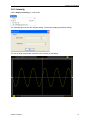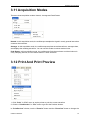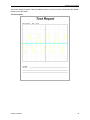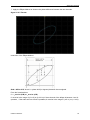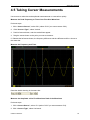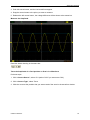
1
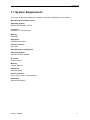
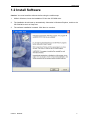
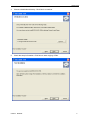
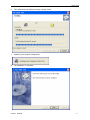
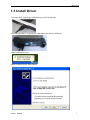
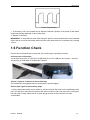
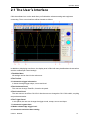
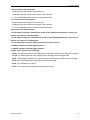
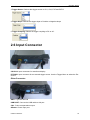
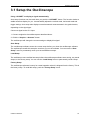
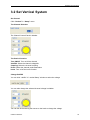
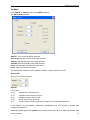
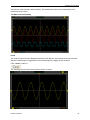
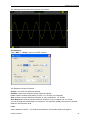
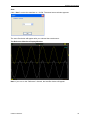
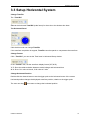
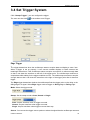
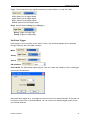
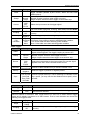
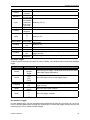
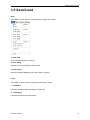
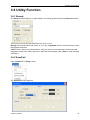
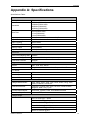
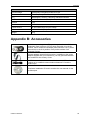
PC Based Digital Oscilloscope USER MANUAL DSO3102 DSO3102A DSO3202 DSO3202A www.hantek.com Content General Safety Summary .............................................................................. 1 Chapter 1 Getting Start ................................................................................. 2 1.1 System Requirement ............................................................................................ 3 1.2 Install Software..................................................................................................... 4 1.3 Install Driver ......................................................................................................... 7 1.4 General Features ............................................................................................... 10 1.5 General Check ................................................................................................... 11 1.6 Function Check .................................................................................................. 12 1.7 Self Calibration ................................................................................................... 13 1.8 Accessories ........................................................................................................ 13 Chapter 2 Operating Basics ....................................................................... 14 2.1 The User’s Interface ........................................................................................... 15 2.2 The Menu System .............................................................................................. 17 2.3 The Vertical System ........................................................................................... 19 2.4 The Horizontal System ....................................................................................... 20 2.5 The Trigger System ............................................................................................ 21 2.6 Input Connector.................................................................................................. 22 Chapter 3 Oscilloscope Functions ............................................................ 23 3.1 Setup the Oscilloscope ...................................................................................... 24 3.2 Set Vertical System ............................................................................................ 25 3.3 Setup Horizontal System .................................................................................... 31 3.4 Set Trigger System............................................................................................. 32 3.5 Save/Load .......................................................................................................... 37 3.6 Utility Function.................................................................................................... 38 3.7 Measure Signal .................................................................................................. 42 3.8 The Display System ........................................................................................... 48 3.9 Zoom In/Out and Drag Waveforms .................................................................... 53 3.10 Interpolation ..................................................................................................... 55 3.11 Acquisition Modes ............................................................................................ 57 3.12 Print And Print Preview .................................................................................... 57 Chapter 4 Application Example.................................................................. 59 4.1 Simple Measurement ......................................................................................... 60 4.2 Capturing a Single-Shot Signal .......................................................................... 61 4.3 The Application of the X-Y Operation ................................................................. 61 4.5 Taking Cursor Measurements ............................................................................ 63 Chapter 5 Appendix .................................................................................... 66 Appendix A: Specifications ....................................................................................... 67 Appendix B: Accessories.......................................................................................... 68 Appendix C: General Maintenance .......................................................................... 69 General Safety Summary General Safety Summary Review the following safety precautions carefully before operate the device to avoid any personal injuries or damages to the device and any products connected to it. To avoid potential hazards use the device as specified by this user’s guide only. To Avoid Fire or Personal Injury Use Proper Power Cord. Use only the power cord specified for this product and certified for the country of use. Connect and Disconnect Properly. Do not connect or disconnect probes or test leads while they are connected to a voltage source. Connect and Disconnect Properly. Connect the probe output to the measurement device before connecting the probe to the circuit under test. Disconnect the probe input and the probe reference lead from the circuit under test before disconnecting the probe from the measurement device. Observe All Terminal Ratings. To avoid fire or shock hazard, observe all ratings and markings on the product. Consult the product manual for further ratings information before making connections to the product. Use Proper Probe. To avoid shock hazard, use a properly rated probe for your measurement. Avoid Circuit or Wire Exposure. Do not touch exposed connections and components when power is on. Do Not Operate With Suspected Failures. If suspected damage occurs with the device, have it inspected by qualified service personnel before further operations. Provide Proper Ventilation. Refer to the installation instructions for proper ventilation of the device. Do not operate in Wet/Damp Conditions. Do not operate in an Explosive Atmosphere. Keep Product Surfaces Clean and Dry. USER’S MANUAL 1 Getting Start Chapter 1 Getting Start The oscilloscope is small, lightweight, no external power required, portable oscilloscopes! The oscilloscopes is ideal for production test, research and design and all of the applications involving analog circuits test and troubleshooting, as well as education and training. In addition to the list of general features on the next page, this chapter describes how to do the following tasks: System Requirements Install software Install Driver General Features General Check Probe Compensation Function Check Self Calibration Accessories USER’S MANUAL 2 Getting Start 1.1 System Requirement To run the oscilloscope software, the needs of computer configuration are as follows: Minimum System Requirements Operating System Window XP/Vista/Win 7/Win 8 Processor Upwards of 1.00G processor Memory 256M byte Disk Space 500M disk free space Screen resolution 800 x 600 Recommended Configuration Operating System Windows XP SP3 System Processor 2.4G Processor Memory 1G Byte Memory Disk Space 80G Disk Space Screen resolution 1024 x 768 or 1280 x 1024 resolution DPI Setting Normal Size (96DPI) USER’S MANUAL 3 Getting Start 1.2 Install Software Caution: You must install the software before using the oscilloscope. 1. While in Windows, insert the installation CD into the CD-ROM drive. 2. The installation should start up automatically. Otherwise in Windows Explorer, switch to the CD-ROM drive and run Setup.exe. 3. The software Installation is started. Click 'Next' to continue. USER’S MANUAL 4 Getting Start 4. Choose a destination directory. Click 'Next' to continue. 5. Check the setup information. Click Next to start copying of files. USER’S MANUAL 5 Getting Start 6. This Status dialog is displayed during copying of files. 7. Updating Your System Configuration. 8. The installation is complete. USER’S MANUAL 6 Getting Start 1.3 Install Driver 1.Connect the A-Type Plug of USB cable to your PC’S USB port. 2.Connect the other A -Type Plug of USB cable to the device’s USB port. 3.New hardware is found. 4.New hardware search wizard starts. USER’S MANUAL 7 Getting Start 5.Select the specific location. 6.New hardware search wizard starts to search the driver. USER’S MANUAL 8 Getting Start 7. The wizard has finished installing for the device. 8.The new hardware is installed and ready to use. USER’S MANUAL 9 Getting Start 1.4 General Features Product Features: Four Channels, Bandwidth: 100MHz (DSO3102) 150MHz (DSO3102A) 200MHz (DSO3202) 250MHz (DSO3202A) Maximum real-time sample rate: 1GSa/s Memory depth: 10K-256M/CH Automatic setup for ease of use (AUTOSET); Pass/Fail; Built-in Fast Fourier Transform function(FFT); 20 Automatic measurements; Automatic cursor tracking measurements; waveform storage, record and replay dynamic waveforms; User selectable fast offset calibration; Add, Subtract , Multiply and Division Mathematic Functions; Selectable 20 MHz bandwidth limit; External trigger; Waveform average; Adjustable waveform intensity, more effective waveform view; User interface in several user-selectable languages; USER’S MANUAL 10 Getting Start 1.5 General Check Please check the instrument as following steps after receiving an oscilloscope: Check the shipping container for damage: Keep the damaged shipping container or cushioning material until the contents of the shipment have been checked for completeness and the instrument has been checked mechanically and electrically. Check the accessories: Accessories supplied with the instrument are listed in "Accessories" in this guide. If the contents are incomplete or damaged, please notify the franchiser. Check the instrument: In case there is any mechanical damage or defect, or the instrument does not operate properly or fails performance tests, please notify the franchiser. Probe Compensation Perform this function to match the characteristics of the probe and the channel input. This should be performed whenever attaching a probe to any input channel at the first time. ■ From the “Probe” menu, select attenuation to 1:10. Set the switch to “X10” on the probe and connect it to CH1 of the oscilloscope. When using the probe hook-tip, insert the tip onto the probe firmly to ensure a proper connection. ■ Attach the probe tip to the Probe Compensator and the reference lead to the ground connector, select CH1, and then press the “AUTOSET” button into the menu or the toolbar. ■ Check the shape of the displayed waveform. Correctly Compensated Over Compensated USER’S MANUAL 11 Getting Start Under Compensated 1. If necessary, use a non-metallic tool to adjust the trimmer capacitor of the probe for the fattest square wave being displayed on the oscilloscope. 2. Repeat if necessary. WARNNING: To avoid electric shock while using the probe, be sure the perfection of the insulated cable, and do not touch the metallic portions of the probe head while it is connected with a voltage source. 1.6 Function Check Perform this functional check to verify that your oscilloscope is operating correctly. ■ Connect the oscilloscope You should connect the A-Type Plug of USB cable to your PC USB port and connect the other A-Type Plug of USB cable to oscilloscope USB port. ■ Input a signal to a channel of the oscilloscope The oscilloscope is equipped with two channels plus external trigger. Please input signal in the following steps: 1. Set the attenuation switch on the probe as 10X and connect the probe on the oscilloscope with CH1. Aim the slot in the probe connector at the faucet on BNC of CH1 and insert, then, turn right to lock the probe. Finally, attach the tip of probe and ground nip to the Connector of Probe compensator. USER’S MANUAL 12 Getting Start 2. Set the CH1 probe attenuation of the oscilloscope to X10. (The default is X1). 3.Attach the tip of probe and ground nip to the Connector of Probe compensator. Click the button. A square wave will be displayed within a several seconds. (Approximately 1 kHz, 2V, peakto- peak). 4. Inspect CH2 with the same method. Repeat steps 2 and 3. 1.7 Self Calibration The self calibration routine lets you optimize the oscilloscope signal path for maximum measurement accuracy. You can run the routine at any time but you should always run the routine if the ambient temperature changes by 5v or more. For accurate calibration, power on the oscilloscope and wait twenty minutes to ensure it is warmed up. To compensate the signal path, disconnect any probes or cables from the input connectors. Then, access the “Utility -> Calibration” option and follow the directions on the screen. The self calibration routine takes about several minutes. 1.8 Accessories All the accessories listed below are standard accessories for the oscilloscope: Probe×2 (1.5m), 1:1, (10:1) Passive Probes A Power Adapter A USB Cable A PC software CD USER’S MANUAL 13 Operation Basics Chapter 2 Operating Basics The User’s Interface The Menu System The Vertical System The Horizontal System The Trigger System Input Connectors USER’S MANUAL 14 Operation Basics 2.1 The User’s Interface Click the software icon on the desk after you finished the software setting and equipment connecting. Then a user interface will be showed as follows: In addition to displaying waveforms, the display area is filled with many details about the waveform and the oscilloscope control settings. 1.The Main Menu All settings can be found in the main menu. 2.The Toolbar 3. It shows the trigger information It shows the edge trigger slope, source and level. 4.The Horizontal Panel The user can change Time/Div, format in the panel. 5.The Vertical Panel The user can turn on/off the CH1/CH2. Also the user can change the CH1/ CH2 volt/div, coupling and probe attenuation. 6.The Trigger Panel In this panel, the user can change the trigger mode, sweep, source and slope. 7. It shows the system time. 8. Marker shows Edge trigger level. 9. It shows the main time base setting. USER’S MANUAL 15 Operation Basics 10.It shows the CH2 information Readouts show the coupling of the channels. Readouts show the vertical scale factors of the channels. A “B” icon indicates that the channel is bandwidth limited 11. It shows the CH1 information Readouts show the coupling of the channels. Readouts show the vertical scale factors of the channels. A “B” icon indicates that the channel is bandwidth limited 12. It shows the software status. 13.The markers show the CH2reference points of the displayed waveforms. If there is no marker, the channel is not displayed. 14. The markers show the CH1reference points of the displayed waveforms. If there is no marker, the channel is not displayed. 15. A window that shows the display waveform in buffer position. 16. Marker shows horizontal trigger position. 17. Marker shows horizontal trigger position. Trigger status indicates the following: AUTO: The oscilloscope is in auto mode and is acquiring waveforms in the absence of triggers. Trig’D: The oscilloscope has seen a trigger and is acquiring the post trigger data. WAIT: All pretrigger data has been acquired and the oscilloscope is ready to accept a trigger. STOP: The oscilloscope has stopped acquiring waveform data. RUN: The oscilloscope is running. PLAY: The oscilloscope is displaying the record waveforms. USER’S MANUAL 16 Operation Basics 2.2 The Menu System The Main Menu: 1.File: Load or Save data, setup 2.View: Change the user interface 3.Setup: Setup setting 4.Display: Change wave display type 5.Cursor: Set Cursor measure type USER’S MANUAL 17 Operation Basics 6. Measure: Set measurement parameters 7.Acquire: Run ,Stop or other operation setting 8. Utility: Utility setting 9. Window: Window setting 10. Help: Turn on help file USER’S MANUAL 18 Operation Basics 2.3 The Vertical System Click “Setup->Vertical” The following figure shows the vertical Setup window. It shows the vertical parameters setting. 1.Select channel: User can select the channel by clicking the Combo box. 2.ON/OFF: Turn on or off the selected channel. 3.VOLTS/DIV: Set the selected channel voltage range. 4.Coupling: Set the selected channel to DC/AC/GND. USER’S MANUAL 19 Operation Basics 5.Probe: Set the Select one according to the probe attenuation factor to ensure correct vertical scale reading 6.BW Limit: Reject the frequency component higher than 20MHz. 7.Invert: Invert the selected wave. 2.4 The Horizontal System Click “Setup->Horizontal” The following figure shows the Horizontal System window. It shows the horizontal parameters settings. 1.Time/DIV: leads the setting of the time base parameters USER’S MANUAL 20 Operation Basics 2. Format: leads the setting of the horizontal format parameters 2.5 The Trigger System Click “Setup-> Trigger” The following figure shows the trigger system control. 1.Trigger Mode: Sets the trigger mode 2.Trigger Sweep: Selects the trigger sweep mode to AUTO, NORMAL or SINGLE USER’S MANUAL 21 Operation Basics 3.Trigger Source: Selects the trigger source to CH1, CH2, EXT and EXT/5. 4.Trigger Slope: Selects the trigger slope to Positive or Negative slope 5.Trigger Coupling: Selects the trigger coupling to DC or AC. 2.6 Input Connector CH1/CH2: Input connectors for waveform display. E-TRIG/S: Input connector for an external trigger source. Use the Trigger Menu to select the Ext. source. Other Connector: GND.: A ground terminal USB PORT: Connect the USB cable to this port. CAL.: Probe compensation output. GPower: Power Input port. USER’S MANUAL 22 Oscilloscope Functions Chapter 3 Oscilloscope Functions Set Oscilloscope Set Vertical System Set Horizontal System Set Trigger System Save/Load Utility Function Measure Signal Zoom In/Out Waveforms Acquire Signal Print USER’S MANUAL 23 Oscilloscope Functions 3.1 Setup the Oscilloscope Using “AUOSET” to display a signal automatically. Auto setup functions one time each time you push the “AUTOSET” button. The function obtains a stable waveform display for you. It automatically adjusts the vertical scale, horizontal scale and trigger settings. Auto setup also displays several automatic measurements in the graticule area, depending on the signal type. Connect a signal to the CH1 input: 1. Connect a signal to the oscilloscope as described above. 2. Click the “Acquire -> Autoset” button. The oscilloscope will change the current settings to display this signal. Save Setup The oscilloscope software saves the current setup before you close the oscilloscope software. The oscilloscope recalls this setup the next time you run the software. You can use the “Save Setup” menu to permanently save up to several different setups. Load Setup The oscilloscope can recall the last setup before the oscilloscope software was running, any saved setups, or the factory setup. You can use the “Load Setup” menu to permanently recall a setup. Factory Setup The oscilloscope software is set up for normal operation when it is shipped from the factory. This is the factory setup. To recall this setup, push the “Factory Setup” menu. USER’S MANUAL 24 Oscilloscope Functions 3.2 Set Vertical System Set Channel Click “Vertical” in “Setup” menu. The Channel Selection The Channel Control Panel in sidebar The Vertical function: Turn ON/Off: Turn on/off the channel Volt/DIV: Select the channel voltage/div Coupling: Select the channel coupling Probe: Select the channel probe attenuation Invert: Turn on/off the invert function. Change Volt/DIV You can click “volt/Div” in” vertical Setup” window to select the voltage You can also change the selected channel voltage in sidebar You can left click and drag the mouse on the knob to change the voltage. USER’S MANUAL 25 Oscilloscope Functions Set Channel Coupling Click “Coupling” in “Vertical Setup” window. In the sidebar, you can change the channel coupling too. You can set the coupling to DC, AC or GND. If you set the coupling to DC, it blocks the AC component of the input signal. Probe Attenuation Setting Select the attenuation factor for the probe. To check the probe attenuation setting, toggle the probe menu to match the attenuation factor of the probe. This setting remains in effect before you changed again. Click “Probe” in Vertical Setup window to select the probe attenuation The probe setting window in the sidebar Note: The attenuation factor changes the vertical scale of the oscilloscope so that the measurement results refect the actual voltage levels at the probe tip. USER’S MANUAL 26 Oscilloscope Functions Set Math Click “MATH” in Channel menu to set MATH channel. The MATH Setup window: ON/OFF: Turn On/Off the MATH Channel. Source A/B: Set the sources of the math channel. Operate: Set operates type of the math channel. Volt/DIV: Set the resolution of the math channel. Probe: Set the math channel probe attenuation. Invert: Turn on/off the invert function The mathematic functions include addition, subtract, multiply, division and FFT. Source A/B Source A and Source B Menu Operate Four Types: A+B Add source A and source B A-B Subtract source B from source A AxB Multiply source A by source B A/B Divide source A by source B FFT Convert a time-domain signal into its frequency components (spectrum). In this function, use the addition, subtraction, multiplication and FFT function to operate and analyze the waveform. Select the operate type in the Operate menu. Select source A and B. Then adjust the vertical scale USER’S MANUAL 27 Oscilloscope Functions and offset to view the math channel clearly. The mathematic result can be measured by the measure and the cursor. The Math Function Display Invert The invert function turns the displayed waveform 180 degrees, with respect to the ground level. When the oscilloscope is triggered on the inverted signal, the trigger is also inverted. Click “Invert” in MATH. The following picture shows the waveform before inversion: USER’S MANUAL 28 Oscilloscope Functions The following picture shows the waveform of inversion: Set Reference Click “REF” in “Setup” menu to set REF channel. The Reference Channel Function: On/Off: Turn on/off the reference channel. Volt/DIV: Channel the resolution of the reference channel. Load: Load the reference waveform from the “.rfc” file from your computer. Save: Save the current reference waveform to your computer as “.rfc” format. Save Reference: Save the current reference waveform to your computer as “rfc” format. You can change the vertical scale of a waveform. The waveform display will contract or expand relative to the reference level. Load Click “Load” to load the “*.rfc” file that was selected. The load file window will appear. USER’S MANUAL 29 Oscilloscope Functions Save Click “Save” to save the waveform to *.rfc file. The saved source window appears. The save file window will appear after you selected the saved source. The Reference Waveform Display Window: Note: If you turn on the “Reference” channel, the load file window will appear. USER’S MANUAL 30 Oscilloscope Functions 3.3 Setup Horizontal System Change Time/Div The “Time/Div” Selects the horizontal Time/DIV (scale factor) for the main or the window time base The Horizontal Panel Click the blue knob can change Time/Div. If the waveform acquisition is stopped, Time/Div control expands or compresses the waveform. Change Format Click “Time/Div” you can set the Time base in Horizontal Setup window. In the “Format” item, set the waveform display format (Y-T, X-Y). Y -T: Show the relative relation between vertical voltage and horizontal time X -Y: Show CH1 value at X axis; CH2 value at Y axis Change Horizontal Position Double click the channel button to set the trigger point to the horizontal center of the screen. Horizontal position changes the displayed waveform position, relative to the trigger point. The user can drag USER’S MANUAL on screen to change the horizontal position. 31 Oscilloscope Functions 3.4 Set Trigger System Click “Setup->Trigger”, you can configure the trigger. The user can also click in the toolbar to set Trigger. Edge Trigger The trigger determines when the oscilloscope starts to acquire data and display a wave- form. When a trigger is set up properly, it can convert unstable displays or blank screens into meaningful waveforms. If the oscilloscope wants to acquire a waveform, it collects enough data so that it can draw the waveform to the left of the trigger point. The oscilloscope continues to acquire data while waiting for the trigger condition to occur. The oscilloscope continues to acquire enough data so that it can draw the waveform to the right of the trigger point after it detects a trigger. The Edge trigger determines whether the oscilloscope finds the trigger point on the rising or the falling edge of a signal. Select Edge trigger mode to trigger on Rising edge or Falling edge. Mode: Select the trigger mode. Sweep: Set the sweep mode to Auto, Normal or Single. Auto: Acquire waveform even no trigger occurred Normal: Acquire waveform when trigger occurred. Single: Acquire waveform when trigger occurred then stop Source: You can use the trigger source options to select the signal that the oscilloscope uses as a USER’S MANUAL 32 Oscilloscope Functions trigger. The source can be any signal connected to a channel BNC, or to the EXT. BNC. CH1: Select CH1 as trigger signal CH2: Select CH2 as trigger signal EXT.: Select EXT as trigger signal EXT/5: Select EXT/5 as trigger signal Slope: Set the slope to Rising (+) or Falling (-). Rising: Trigger on rising edge Falling: Trigger on falling edge Set Pulse Trigger Pulse trigger occurs according to the width of pulse. The abnormal signals can be detected through setting up the pulse width condition. Mode: Sweep: Source: PW Condition: Pulse Width: The Pulse Width adjust range is 10ns~10s. When the condition is met, it will trigger and acquire the waveform. When alternative trigger is on, the trigger sources come from two vertical channels. This mode can be used to observe two non-related signals. You can choose two different trigger modes for the four vertical channels. USER’S MANUAL 33 Oscilloscope Functions Options Settings Pulse Auto, Normal, Single CH1 CH2 EXT EXT/5 Sweep Source Pulse Width Comments With Pulse highlighted, the trigger occurs on pulses that meet the trigger condition (defined by the Source, When and Set Pulse Width options). Auto: Acquire waveform even no trigger occurred Normal: Acquire waveform when trigger occurred Single: Acquire waveform when trigger occurred then stop. Select the input source as the trigger signal. Set Pulse Width highlighted, including Time Unit and Pulse Width Coupling Polarity PW Condition AC DC Positive Negative Equal Not Equal Less More Selects the components of the trigger signal applied to the trigger circuitry. Settings Comments With Video highlighted, an NTSC, PAL or SECAM standard video signal will be triggered. The trigger coupling is preset to AC. Auto: Acquire waveform even no trigger occurred Normal: Acquire waveform when trigger occurred Single: Acquire waveform when trigger occurred then stop. Select to trigger on positive or negative pulses. Equal: Pulse width equal than selecting pulse condition. Not Equal: Pulse width not equal to selected pulse condition. Less: Pulse width less than selecting pulse condition. More: Pulse width more than selecting pulse condition. Video Trigger: Options Video Sweep Source Standard Polarity Sync Auto, Normal Single CH1 CH2 EXT. EXT/5 NTSC PAL/SECAM Positive Negative All Lines Line Number Odd Field Even Field All Fields Select the input source as the trigger signal. Ext use the signal applied to the EXT TRIG connector as the source. Choose a video standard for sync and line number count. Select to trigger on positive or negative pulses. Choose a proper video sync. When selecting Line Number for the Sync option, you may use the User Select knob to specify a line number. Set Alter Trigger: Options Settings Comments CH1 CH2 Push an option such as CH1, select the channel trigger type and set the menu interface. Alter Trigger Channel Below list options in submenus. Alter Trigger allows CH1 and CH2 to select different trigger modes and to display waveforms on a same screen. That is, both channels can choose the following four trigger modes. Type Slope Coupling USER’S MANUAL Edge Rising Falling AC DC Select the components of the trigger signal applied to the trigger circuitry. 34 Oscilloscope Functions Type Polarity Standard Sync Type Polarity When Pulse Width Video Normal Inverted NTSC PAL/SECAM All Lines Line Number Odd Field Even Field All Fields Pulse Positive Negative = ≠ < > Pulse Width AC DC O.T. Coupling Type Overtime Coupling Polarity AC DC Positive Negative Select by F4, F5. Select by F3. Push F4 to select. Adjust the multi-functional knob V0 to set the pulse width. Select by F5. Click it and pop up a dialog. Selects the components of the trigger signal applied to the trigger circuitry. Select to trigger on positive or negative pulses. Set Slope Trigger: Judges trigger according to the time for rising or falling, more flexible and accurate than the Edge trigger. Options Slope Sweep Source Time Coupling Slope When Settings Auto Normal Single CH1 CH2 EXT EXT/5 20ns to 10.0sec AC DC Rising Falling = ≠ < > Comments Select the type of trigger. The Normal mode is best for most pulse width trigger applications. Select the input source as the trigger signal. Selects the components of the trigger signal applied to the trigger circuitry. Select the slope type of signal. Select the trigger condition. Set Overtime Trigger: In Pulse Width trigger, you may sometimes be puzzled with the long time for trigger, as you do not need a complete pulse width to trigger the oscilloscope, but want the trigger occurs just upon the overtime point. This is called Overtime Trigger. USER’S MANUAL 35 Oscilloscope Functions Options O.T. Sweep Source Settings Auto Normal Single CH1 CH2 Overtime Coupling Polarity AC DC Positive Negative Comments Select the trigger source. Click it and pop up a dialog. Selects the components of the trigger signal applied to the trigger circuitry. Select to trigger on positive or negative pulses. The user can also change the trigger setting on trigger panel in sidebar. High Frequency Rejection Select “HF Rejection” in “Trigger Setup” window The user can turn on “HF Rejection” to eliminate trigger higher-frequency (20M above) USER’S MANUAL 36 Oscilloscope Functions 3.5 Save/Load Save Click “File” in main menu to save waveform, setups and screen. 1. Save Data Save waveform data as a type file 2. Save Setup Save the current oscilloscope setup to file 3. Save Image Save the software display window as a .bmp or .jpg file Load Click “File” in main menu to recall saved waveform, setup 1. Load Data Load the waveform that had saved as a type file 2. Load Setup Load the instrument that had saved USER’S MANUAL 37 Oscilloscope Functions 3.6 Utility Function 3.6.1 Record The Record window displays on right sidebar. The following picture shows the Record Interface. This function can record input waveform form CH1 or CH2. Storage: Record waveform and save it as “.drc” file. “Play Back” button: Click this button to start playing back waveform. “Start” button: Start to record waveforms. After you start to record waveforms, this window will disappear. Please click “Utility->Record” to open the window again. Click “Stop” to stop recording waveforms. 3.6.2 Pass/Fail Click “Pass/Fail” in “Utility” menu. The Pass/Fail window appears: USER’S MANUAL 38 Oscilloscope Functions The Pass/Fail function monitors changes of signals and outputs pass or fail signals by comparing the input signal with the pre-created mask. Control Setting Source: Select the Pass/Fail channel Output: Select the Pass/Fail output condition. Stop When Output: If it was checked, the Pass/Fail will stop when output. Mask Setting Vertical: Set the vertical limit range Horizontal: Set the horizontal limit range “Create” button: Click this button to create Pass/Fail area according to the mask “Save” button: Click this button to save the setups to file “Load” button: Click this button to load the saved setups file USER’S MANUAL 39 Oscilloscope Functions Information Display Fail: It shows the fail waveform number Pass: It shows the pass waveform number Total: It shows the l total Pass/Fail waveform number Operation Click “Start” button to start the Pass/Fail test. Click “Stop” button to stop the Pass/Fail test. The Pass/Fail function display NOTE: Pass/Fall function is unavailable in X-Y mode. USER’S MANUAL 40 Oscilloscope Functions 3.6.3 Frequency/Counter Click “F/C” in UNTILITY menu. Counter: Record the number of a waveform. Frequency: Measure the frequency of a waveform. USER’S MANUAL 41 Oscilloscope Functions 3.6.4 Factory Setup Click “Factory Setup” in “Utility” menu to load default setups When you click the Factory Setup in Utility menu, the oscilloscope displays the CH1/CH2 waveform and removes all other waveforms. The oscilloscope set up for normal operation when it is shipped from the factory and can be recalled at anytime by user. The Factory Setup function does not reset the following settings: Language option Date and time 3.6.5 Language Click “Language” in “Utility” menu. There are four languages in “Language” menu. The default language is English. 3.7 Measure Signal 3.7.1 Cursor Menu Click “Cursor” in main menu. This method allows you to take measurements by moving the cursors USER’S MANUAL 42 Oscilloscope Functions 1. Source The user can set the source to CH1, CH2 and MATH. When you use cursors, be sure to set the Source to the waveform on the display that you want to measure. 2. Type There are four types of cursors: Cross, Trace, Vertical and Horizontal 1) Cross The Cross cursors appear as cross lines on the display and measure the vertical and horizontal parameters. The Cross cursor display window: The Cross measure result displays on status bar USER’S MANUAL 43 Oscilloscope Functions 2)Trace The Trace cursors appear as vertical lines on the display and measure the waveform amplitude at the point the waveform crosses the cursor. The Trace cursor display window: Read the details showing in the status bar. 3)Vertical The Vertical cursors appear as vertical lines on the display and measure the vertical parameters. The Vertical cursor display window: USER’S MANUAL 44 Oscilloscope Functions Read the details showing in the status bar. 4)Horizontal The Horizontal cursors appear as horizontal lines on the display and measure the horizontal parameters. The Horizontal cursor display window: Read the details showing in the status bar. 3.7.2 Measure Menu Click “Measure” in main menu. The oscilloscope provides 20 parametric auto measurements (12 voltage and 8 time measurements). USER’S MANUAL 45 Oscilloscope Functions 1.Source The user can use the “Source” menu to select a measure source. 2. Vertical Maximum: Voltage of the absolute maximum level, Measured over the entire waveform Minimum: Voltage of the absolute minimum level, Measured over the entire waveform Peak To Peak: Peak-to-peak = Max –Min, Measured over the entire waveform Top: Voltage of the statistical maximum level, Measured over the entire waveform Base: Voltage of the statistical minimum level, Measured over the entire waveform Middle: Voltage of the 50% level from base to top RMS: The Root Mean Square voltage over the entire waveform Amplitude: Amp = Base - Top, Measured over the entire waveform Mean: The arithmetic mean over the entire waveform Cycle Mean: The arithmetic mean over the first cycle in the waveform Preshoot: Positive Overshoot = (Max - Top)/Amp x 100 %, Measured over the entire waveform Overshoot: Negative Overshoot = (Base - Min)/Amp x 100 %, Measured over the entire waveform. USER’S MANUAL 46 Oscilloscope Functions 3.Horizontal Period: Time to take for the first signal cycle to complete in the waveform Frequency: Reciprocal of the period of the first cycle to complete in the waveform Rise Time: Time taken from lower threshold to upper threshold Fall Time: Time taken from upper threshold to lower threshold +Duty Cycle: Positive Duty Cycle = (Positive Pulse Width)/Period x 100%, Measured of the first cycle in waveform. -Duty Cycle: Negative Duty Cycle = (Negative Pulse Width)/Period x 100%, Measured of the first waveform. +Pulse Width: Measured of the first positive pulse in the waveform. The time between the 50% amplitude points -Pulse Width: Measured of the first negative pulse in the waveform. The time between the 50% amplitude points 4. Clear Measure Clear all measure items on display screen. The Measure Display Window: USER’S MANUAL 47 Oscilloscope Functions Note: The results of the automatic measurements will be displayed on the bottom of the screen. Maximum 8 results could be displayed at the same time. When there is no room, the next new measurement result will make the previous results moving left, out of screen. 5. Edit Measure Click “Measure->Edit Measure”. User can select Maximum 8 measure options to measure. 3.8 The Display System 3.8.1 Display Type Click “Type” in “Display” menu. The following figure shows the type parameters setting. USER’S MANUAL 48 Oscilloscope Functions If the Vectors type mode is selected, the waveform will be displayed as following figure. If the Dots type mode is selected, the waveform will be displayed as following figure. USER’S MANUAL 49 Oscilloscope Functions 3.8.2 Display Grid Click “Display” in main menu. The grid shows: The grid not shows: USER’S MANUAL 50 Oscilloscope Functions 3.8.3 Intensity Click “Display->Intensity” in main menu. The following figure shows the intensity dialog. It shows the display parameters setting. You can change the grid and waveform color intensity in this dialog. USER’S MANUAL 51 Oscilloscope Functions 3.8.4 Grid Background Color Click “Display->Grid Background Color” in main menu. The following figure shows Grid Background Color dialog. It shows the background color setting. If you click the color rectangle, the color dialog will be showed: USER’S MANUAL 52 Oscilloscope Functions The background color was changed: 3.9 Zoom In/Out and Drag Waveforms The software will stop updating waveform after the user clicked “Stop” button. The user can change the waveform display by adjusting the scale and position. When you change the scale, the waveform display will increase or decrease in size. When you change the position, the waveform will move up, down, right, or left. The channel reference indicator identifies each waveform on the display. The indicator points to the reference level of the waveform record. Zoom In/Out The user can click “Zoom In/Out” in “Acquire” menu, then left or right click the mouse button on display screen to zoom in/out the waveform. Also the user can change Time/Div in Horizontal menu or in Horizontal panel to zoom in/out the waveform. USER’S MANUAL 53 Oscilloscope Functions Drag button on toolbar to stop acquire waveform. Then clicked Click waveform position as the following steps. on toolbar to modify the 1.Select Channel: 2.Set the Move Step: 3.Change the waveform position: Also, you can drag waveform on right sidebar. USER’S MANUAL 54 Oscilloscope Functions 3.10 Interpolation At the time base 40ns/div or faster, user can use the 3 different interpolation mode to get waveforms of different smoothness. Click “Acquire->Interpolation” menu. The Step Interpolation: The Linear Interpolation: USER’S MANUAL 55 Oscilloscope Functions The Sin(x)/x Interpolation: Note: The default interpolation mode is Sin(x)/x. Acquisition When you acquire a signal, the oscilloscope converts it into a digital form and displays a waveform. The acquisition mode defines how the signal is digitized and the time base setting affects the time span and level of detail in the acquisition. USER’S MANUAL 56 Oscilloscope Functions 3.11 Acquisition Modes There are three acquisition modes: Normal, Average and Peak Detect. Normal: In this acquisition mode, the oscilloscope samples the signal in evenly spaced intervals to construct the waveform. Average: In this acquisition mode, the oscilloscope acquires several waveforms, averages them, and displays the resulting waveform. You can use this mode to reduce random noise. Peak Detect: In this acquisition mode, the oscilloscope finds the maximum and the minimum in every sampling interval, and use these values to show waveform. 3.12 Print And Print Preview 1. Click “Print” in “File” menu to set the printer to print the current waveform 2. Click the “PrintPreview” in “File” menu to get into the Preview window. In “PrintPreview” window, use the “Zoom In” button and the “Zoom Out” button to change the USER’S MANUAL 57 Oscilloscope Functions size of the waveform graph. Click the “Close” button to turn this window off and click the “Print” button to print the report. The Print report: USER’S MANUAL 58 Application Example Chapter 4 Application Example Simple Measurement Capturing a Single-Shot Signal The Application of the X-Y Taking Cursor Measurement USER’S MANUAL 59 Application Example 4.1 Simple Measurement To acquire and display a signal, please do the steps as follows: 1. Connect signal to CH1 by using probe 2. Click the button on toolbar or “Acquire -> Auto Setup” on menu. The DSO set the vertical, horizontal, and triggers controls at the best status automatically. Also, you can adjust the controls to meet your measurement to optimize the waveform display. To measure the frequency and “Vpp”, you can do these steps as follows: 1. Click the “Measure->Horizontal->Frequency” button, the frequency of the signal display on the bottom of the waveform interface. 2. Click the “Measure->Vertical->Peak-to-Peak” button, the “Vpp” of the signal will also display on the bottom of the waveform interface. To clear the measurement on the waveform interface, click the “Measure->Clear Measure” button. USER’S MANUAL 60 Application Example 4.2 Capturing a Single-Shot Signal To capture a single event, it needs to gather some pre-test knowledge of the signal in order to set up the trigger level and slope correctly. For example, if the event is derived from 3.3V COMS logic, a trigger level of 1.2 or higher Volts should work on a rising edge. Do these steps as follows: 1. Set the probe and the channel attenuations to X 10. 2. Set up the trigger in the Trigger Menu, or in the Trigger Setting window. 1) Adjust the Trigger Mode to Edge. 2) Set the Trigger Sweep to Single. 3) Set the Trigger Source to CH1. 4) Set the Trigger Slope to “+” which means you select the rising edge. 5) Adjust the Volts/Div and the time base in a proper range for the signal. 6) Drag the trigger level sign on the waveform display screen to proper position. It ally higher a little above the normal level. 7) Click START button to start capturing. When the trigger conditions are met, data appears on the display representing the data points that the oscilloscope obtained with one acquisition. This function helps to capture the signal occurrence easily, such as the noise with large amplitude; set the trigger level higher a little above the normal level and press and wait. When noise occurs, the instrument will record the waveform before and after the trigger. 4.3 The Application of the X-Y Operation X-Y Plot acts to analyze correlation of data of two channels. Lissajous diagram is displayed in the screen when you use X-Y Plot, which enables to compare frequencies, amplitudes and phases of counterpart waveform against the reference waveform. This makes it possible to compare and analyze frequency, amplitude and phase between input and output. Do these steps as follows: 1. Set the probe attenuation to “x10” Set the switch to “x10” on the probes. 2. Connect the CH1 probe to the input of the circuit, and connect the CH2 probe to the output of the circuit. 3. Click button. 4. Adjust the vertical scale and offset to display approximately the same amplitude signals on each channel. 5. Select X-Y format at Horizontal window. The oscilloscope will displays a Lissajous pattern representing the input and the output characteristics of the circuit. 6. Adjust the scale and offset of the horizontal and vertical to a desirable waveform display. The following picture shows a typical example. USER’S MANUAL 61 Application Example 7. Apply the Ellipse Method to observe the phase difference between the two channels. Signal in X-Y Format: Instruction of the Ellipse Method Sinθ = A/B or C/D, where θ = phase shift (in degrees) between the two signals. From the formula above: θ = _arcsine (A/B) or _arcsine (C/D) θ must be in the range of (0~π/2) or (3π/2~2π) if the main axis of the ellipse is between I and III quadrant, . If the main axis is at II and IV quadrant, θ must be in the range of (π/2~π) or (π~3π/2). USER’S MANUAL 62 Application Example 4.5 Taking Cursor Measurements Use cursors to make time and amplitude measurements on a waveform quickly. Measure the Peak Frequency or Time of the First Sine Waveform Do these steps: 1. Click “Cursor->Source”, select CH1 (select CH2 if you want measure CH2). 2. Click “Cursor->Type”, select Vertical. 3. Push left mouse button, and the vertical lines appear. 4. Drag the mouse button to the point you want to measure. 5. Release the left mouse button, the frequency difference and time difference will be shown at the status bar. Measure the Frequency and Time: Read the details showing in the status bar. Measure the Amplitude of the First Waveform Peak of the Waveform Do these steps: 1. Click “Cursor->Source”, select CH1 (select CH2 if you want measure CH2). 2. Click “Cursor->Type”, select Horizontal. USER’S MANUAL 63 Application Example 3. Push left mouse button, and the Horizontal lines appear. 4. Drag the mouse button to the point you want to measure. 5. Release the left mouse button, the voltage difference will be shown at the status bar. Measure the Amplitude: Read the details showing in the status bar. Trace the Amplitude of a fixed position on X-axis in a Waveform Do these steps: 1. Click “Cursor->Source”, select CH1 (select CH2 if you want trace CH2). 2. Click “Cursor->Type”, select Trace. 3. Click the cursor at the position that you want traced of the wave in the waveform window. USER’S MANUAL 64 Application Example Trace the Amplitude: Read the details showing in the status bar. Note: Click “Cursor->Type”, select “Cross”, you can measure time and amplitude at one time. USER’S MANUAL 65 Appendix Chapter 5 Appendix Appendix A: Specifications Appendix B: Accessories Appendix C: General Maintenance USER’S MANUAL 66 Appendix Appendix A: Specifications Specifications Table: Vertical Analog Channel Input Impedance 2 100MHz (DSO3102) 150MHz (DSO3102A) 200MHz (DSO3202) 250MHz (DSO3202A) 3.5ns (DSO3102) 2.3ns (DSO3102A) 1.7ns (DSO3202) 1.4ns (DSO3202A) Resistance: 1MΩ; Capacitance: 25 pF Input Sensitivity 1mV/div to 5V/div Input Coupling AC/DC/GND Vertical Resolution 8 bits Memory Depth 10K-256M/CH Input Protection 400V (DC+AC Peak) Bandwidth Rise Time Horizontal Real-Time Sampling Rate 1GSa/s Time Base Range 5ns/div to 1000s/div(1-2-5 sequences) Time Base Precision ±50ppm Trigger Source CH1, CH2, EXT, EXT/5. Mode Edge, Pulse, Video, Alternative, Slope and OverTime X-Y MODE X-Axis Input CH1 Y-Axis Input CH2 Phrase Shift Max.3 degree Cursor and Measurement Voltage Measurement Vpp, Vamp, Vmax, Vmin, Vtop, Vmid, Vbase, Vavg, Vrms, Vcrms, Preshoot, Overshoot Time Measurement Frequency, Period, Rise Time, Fall Time, Positive Width, Negative Width, Duty Cycle Cursors Measurement Horizontal ,Vertical, Track, Auto Measure Modes Waveform Signal Process +,- , x,÷, /,FFT, Invert Voltage Range 1mV to 5V/div @ x 1 probe 10mV to 50V/div @ x 10 probe 100mV to 500V/div @ x 100 probe 1V to 5000V/div @ x 1000 probe 10V to 50000V/div @ x 10000 probe 20mV to 100V/div @ 20:1 USER’S MANUAL 67 Appendix Others Current Range CC65(20A),CC65(60A),CC650,CC1100 Cursor Time/frequency difference, voltage difference FFT Rectangular, Hanning, Hamming, Blackman Window MATH Addition, subtraction, multiplication, division Autoset Yes Interface USB 2.0 Power Source 8--36V Wide range of input voltage Volume 255 x 190 x 45 (mm) Weight 1Kg Appendix B: Accessories X1, X10 two passive probes. The passive probes have a 6MHz bandwidth (rated 100Vrms CAT III) when the switch is in the X1 position, and a maximum bandwidth (rated 300Vrms CAT II) when the switch is in the X10 position. Each probe consists of all necessary fittings. A power adapter special for this product. In addition to the power adapter shipped with your instrument, you may purchase another one certified for the country of use. A USB line, used to connect external devices with USB interface like a printer or to establish communications between PC and the oscilloscope. A software installation CD and it contains the user manual for the oscilloscopes. USER’S MANUAL 68 Appendix Appendix C: General Maintenance General Care Do not store or leave the oscilloscope where the device will be exposed to direct sunlight for long periods of time. Caution To avoid damages to the device or probes, do not expose them to sprays, liquids or solvents. To avoid damages to the surface of the device or probes not use any abrasive or chemical cleaning agents. Cleaning Inspect the device and probes as often as operating conditions require. Make sure the device disconnect form all power sources. To clean the exterior surface, perform the following steps: 1. Remove loose dust on the outside of the oscilloscope and probes with a lint-free cloth. Use care to avoid scratching the clear glass display filter. 2. Use a soft cloth dampened with water to clean the device. USER’S MANUAL 69