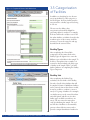
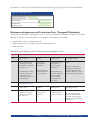
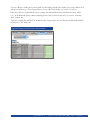
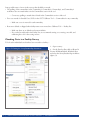
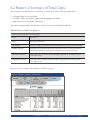
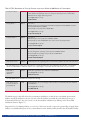
1
Supply Chain Costing Tool
User’s Manual
SEPTEMBER 2013
This publication was produced for review by the U.S. Agency for International Development. It was prepared by the USAID | DELIVER PROJECT, Task Order 4.
Supply Chain Costing Tool
User’s Manual
The authors’ views expressed in this publication do not necessarily reflect the views of the U.S. Agency for International Development or
the United States Government.
USAID | DELIVER PROJECT,Task Order 4
The USAID | DELIVER PROJECT, Task Order 4, is funded by the U.S. Agency for International Development (USAID)
under contract number GPO-I-00-06-00007-00, order number AID-OAA-TO-10-00064, beginning September 30, 2010.
Task Order 4 is implemented by John Snow, Inc., in collaboration with Asociación Benéfica PRISMA; Cargo
Management Logistics; Crown Agents USA, Inc.; Eastern and Southern African Management Institute; FHI 360;
Futures Institute for Development, LLC; LLamasoft, Inc; The Manoff Group, Inc.; OPS MEND, LLC; PATH;
PHD International (a division of the RTT Group); and VillageReach. The project improves essential health
commodity supply chains by strengthening logistics management information systems, streamlining distribution
systems, identifying financial resources for procurement and supply chain operation, and enhancing forecasting and
procurement planning. The project encourages policymakers and donors to support logistics as a critical factor in the
overall success of their health care mandates.
Recommended Citation
Tien, Marie, Elaine Baruwa, and Darwin Young. 2013. Supply Chain Costing Tool User’s Manual. Arlington, Va.:
USAID | DELIVER PROJECT, Task Order 4.
Abstract
The USAID | DELIVER PROJECT has designed the Supply Chain Costing Tool (SCCT) to support the implementation
of public health supply chain costing exercises. Based in Excel, the software tool greatly facilitates data collection,
analysis, and report generation of a supply chain costing exercise. Reading this manual prior to applying the tool
will help the user gain an understanding of the structure and organization of the tool and will help the user plan
and prepare better for a costing exercise. The manual includes detailed instructions on every aspect of conducting
a costing study using the SCCT. This manual provides users with working knowledge of the SCCT as a software
tool and includes step-by-step instructions, screen shots, and troubleshooting tips to help the user get the most out
of the software. For more information on why it is important to cost the supply chain, the steps and human and
financial resources required, how long a costing will take, and how data can be used for policy decisionmaking, see
the USAID | DELIVER PROJECT companion document to this manual, A Guide to Public Health Supply Chain
Costing: A Basic Methodology.
Cover photo: A logistics worker inventories boxes of malaria rapid diagnostic tests in Zambia. USAID | DELIVER PROJECT.
USAID | DELIVER PROJECT
John Snow, Inc.
1616 Fort Myer Drive, 16th Floor
Arlington, VA 22209 USA
Phone: 703-528-7474
Fax: 703-528-7480
Email: [email protected]
Internet: deliver.jsi.com
Contents
Acronyms ....................................................................................................................................................xi
Acknowledgments .......................................................................................................................................1
1. At a Glance: Overview of the Supply Chain Costing Tool (SCCT) ....................................................3
1.1 The USAID | DELIVER PROJECT’s Supply Chain Costing Tool .................................................................................. 3
1.2 Why cost the supply chain? ................................................................................................................................................. 4
1.3 Minimum System Requirements and Offer of Technical Support .............................................................................. 4
1.4 Audience .................................................................................................................................................................................. 5
1.5 Limitations of the SCCT ..................................................................................................................................................... 5
1.6 Contents of this Manual ...................................................................................................................................................... 6
2. Supply Chain Costing Framework .........................................................................................................7
2.1 Organization of the SCCT and Overview of Costing Framework............................................................................ 7
2.2 Data Requirements of the SCCT .................................................................................................................................... 11
3. Setting Up the Tool................................................................................................................................17
3.1 Opening the File .................................................................................................................................................................. 17
3.2 SCCT Contents................................................................................................................................................................... 18
3.3 Home Page ........................................................................................................................................................................... 19
3.4 Calibration ............................................................................................................................................................................ 19
3.5 Categorization of Facilities .............................................................................................................................................. 22
3.6 Generating Surveys............................................................................................................................................................. 28
3.7 Generating, Printing, and Editing a Survey ..................................................................................................................... 30
4. Data Collection: Collecting Data and Completing Surveys ..............................................................33
4.1 Survey Management............................................................................................................................................................ 33
4.2 Data Entry Instructions ..................................................................................................................................................... 35
4.3 Currency ............................................................................................................................................................................... 39
4.4 General1: General Information ........................................................................................................................................ 41
4.5 Procurement Costs (Procurement1 Worksheet) ........................................................................................................ 44
4.6 Storage Costs ...................................................................................................................................................................... 46
4.7 Transportation Costs.......................................................................................................................................................... 51
4.8 Management Costs ............................................................................................................................................................ 58
SEPTEMBER 2013
|
S U P P LY C H A I N C O S T I N G T O O L : U S E R ’ S M A N U A L
|
V
4.9 Commodity Throughput (Commodity1, Commodity2, Commodity3, Commodity4 Worksheets) ................. 65
5. Data Collection: Data Management and Verification ........................................................................67
5.1 Data Import.......................................................................................................................................................................... 67
5.2 Survey Validation.................................................................................................................................................................. 68
6. Generating Results ................................................................................................................................77
6.1 Report 1: Facility Summary Report ................................................................................................................................ 79
6.2 Report 2: Summary of Total Costs .................................................................................................................................. 81
6.3 Report 3: Detailed Supply Chain Function Costs ........................................................................................................ 82
6.4 Report 4: Total Delivered Cost Calculator ................................................................................................................... 89
6.5 Making Cost Comparisons ............................................................................................................................................... 93
References ..................................................................................................................................................95
Annex 1. Glossary of Terms ..................................................................................................................................................... 97
Annex 2. Sample Timeline ......................................................................................................................................................... 99
Annex 3. Sample: Scopes of Work..........................................................................................................................................101
Annex 4. Data Sources .............................................................................................................................................................105
Annex 5. Formulae for Supply Chain Costing Metrics ......................................................................................................109
Figures
1. Supply Chain Costing Tool: Inputs and Outputs ............................................................................................................... 7
2. Supply Chain Costing Tool Framework............................................................................................................................... 9
3. Supply Chain Structure: An Illustrative Example ............................................................................................................ 10
4. USAID | DELIVER PROJECT Supply Chain Costing Tool ............................................................................................. 17
5. Opening the Tool: Click on Enable Content .................................................................................................................... 17
6. Creating a Separate File for Surveys ................................................................................................................................. 18
7. SCCT Navigation Bar............................................................................................................................................................ 19
8. Subsections under Calibrate Tool ...................................................................................................................................... 20
9. Completed General Info Worksheet................................................................................................................................. 22
10. Entering Facility Types ......................................................................................................................................................... 22
11. Completed Facility List Worksheet ................................................................................................................................. 24
12. Completed Commodities Worksheet ............................................................................................................................ 28
13. Obtaining the Directory Address from Windows Explorer ...................................................................................... 28
14. Inserting the Survey Directory Address......................................................................................................................... 29
VI
|
S U P P LY C H A I N C O S T I N G T O O L : U S E R ’ S M A N U A L
|
SEPTEMBER 2013
15. Pop-up Window to Select Location of Survey Folder................................................................................................. 29
16. Creating Survey Workbooks for Each Facility .............................................................................................................. 29
17. Cutting and Pasting the Survey Folder Directory Address ........................................................................................ 30
18. Creating All Surveys at Once ............................................................................................................................................ 30
19. Creating Survey Files for Each Facility ............................................................................................................................ 31
20. Creating Survey Workbooks for Each Facility .............................................................................................................. 31
21. Worksheet Tabs for Each Facility Survey ........................................................................................................................ 34
22. Where to Enter Data in the Survey Worksheets ......................................................................................................... 35
23. Using the Notes Cells ........................................................................................................................................................ 37
24. Shared Transportation Cost Feature ............................................................................................................................... 39
25. General 1 Worksheet ......................................................................................................................................................... 42
26. Procurement Survey ........................................................................................................................................................... 44
27. Procurement Survey Showing Where to Enter Procurement Costs ...................................................................... 45
28. Completing Labor Costs ................................................................................................................................................... 47
29. Storage Space Costs ........................................................................................................................................................... 49
30. Allocating Equipment Costs ............................................................................................................................................. 50
31. Transportation Labor Costs (Transport1 worskheet) ................................................................................................ 52
32. Garage Space Costs ............................................................................................................................................................ 53
33. Transport2 Worksheet........................................................................................................................................................ 54
34. Completed Transport Costs for Pickup or Drop-off .................................................................................................. 55
35. Transport3 Worksheet........................................................................................................................................................ 55
36. Fuel Costs in Transport3 Tab ............................................................................................................................................ 56
37. Route Information ............................................................................................................................................................... 58
38. Adjusting Transportation Costs from Calibration, General Info Section of Tool................................................... 58
39. Illustrative Management Costs ......................................................................................................................................... 61
40. Illustrative Operating Costs .............................................................................................................................................. 62
41. Miscellaneous Management Costs ................................................................................................................................... 63
42. Calculating Operating Costs from Less Than One Year of Data .............................................................................. 64
43. Choosing Commodity Information ................................................................................................................................. 66
44. Data Import Section .......................................................................................................................................................... 68
45. Survey Validation Screen .................................................................................................................................................... 68
46. Facility Survey That Does Not Have Data .................................................................................................................... 69
47. Facility Showing an Error ................................................................................................................................................... 71
SEPTEMBER 2013
|
S U P P LY C H A I N C O S T I N G T O O L : U S E R ’ S M A N U A L
|
VII
48.Viewing Column and Row Headings................................................................................................................................ 71
49. Detailed SC Function Costs Showing an Error ............................................................................................................ 72
50. Finding the LocalDatabaseExp Worksheet .................................................................................................................... 72
51. Locating the LocalDatabaseExp Worksheet .................................................................................................................. 73
52. Local DatabaseExp Worksheet......................................................................................................................................... 73
53. Finding the SurveyDatabaseExp Worksheet .................................................................................................................. 74
54. Locating the SurveyDatabaseExp Worksheet ............................................................................................................... 75
55. Locating a Cost Entered in the Survey ........................................................................................................................... 75
56. SurveyDatabaseExp Worksheet ....................................................................................................................................... 75
57. Hiding the SurveyDatabaseExp Worksheet ................................................................................................................... 76
58. Supply Chain Costing Exercise, Overview of the Required Steps............................................................................ 77
59. Reports Produced by the SCCT ...................................................................................................................................... 77
60. Facility Categories Created by the User........................................................................................................................ 80
61. Report 2, Summary of Total Costs .................................................................................................................................. 81
62. Report 2, Summary of Total Costs .................................................................................................................................. 82
63. Data Validation Using the Detailed Supply Chain Function Costs by Facility Table .............................................. 82
64. Filtering Costs by Facility Type ........................................................................................................................................ 83
65. Reviewing the Function Costs and Graphs by Tier ..................................................................................................... 84
66. Reviewing the Function Costs and Graphs by Facility Types ..................................................................................... 85
67. Navigating Scatterplots Through Chart Drop-Down Menu ...................................................................................... 85
68. Data Validation Using the Graphing Function of the Detailed Costing Table ........................................................ 86
69. Data Validation Using the Graphing Function of the Detailed Costing Table to Identify Outlier Names ....... 86
70. Report 4, TDC Calculator ................................................................................................................................................ 89
71. Report 4, TDC Calculator Report for a Single Procurement Agency ..................................................................... 90
72. Intermediate Calculations for TDC Report .................................................................................................................. 91
73. Using the Detailed Supply Chain Function Costs Report to Obtain Average Costs........................................... 94
Tables
1. Functions of the Supply Chain ............................................................................................................................................ 11
2. Basic Costing Data Collected for Supply Chain Labor Costs ..................................................................................... 12
3. Calculating Personnel Time Spent on Supply Chain Activities ..................................................................................... 13
4. Example of Basic Costing Data Needed for Supply Chain Equipment ...................................................................... 14
5. SCCT Sections ...................................................................................................................................................................... 18
6. Summary of Calibration Parameters for General Information About the Supply Chain ...................................... 20
VIII
|
S U P P LY C H A I N C O S T I N G T O O L : U S E R ’ S M A N U A L
|
SEPTEMBER 2013
7. Facility Index/Survey Generation Calibration Parameters .......................................................................................... 23
8. Aggregating Supply Chain Costs into a Dummy Facility to Aggregate Tier 1 Costs ............................................... 25
9. Commodity Database Calibration Parameters ............................................................................................................. 27
10. Survey Worksheets ............................................................................................................................................................. 34
11. When Notes Are Critical: Selected Examples ............................................................................................................... 36
12. Shared Costs Examples ...................................................................................................................................................... 38
13. General Information, Basic Facility Information ........................................................................................................... 41
14. General Information, Defining Facility Relationships................................................................................................... 43
15. Procurement Facilities and Activities .............................................................................................................................. 45
16. Storage Function–Related Tasks ....................................................................................................................................... 48
17. Data Needed To Estimate Storage Space Costs........................................................................................................... 49
18. Transport1 Worksheet, Transport Labor Cost .............................................................................................................. 51
19. Transport1 Worksheet, Garage Space Costs ............................................................................................................... 52
20. Transport2 Worksheet, Parts I and II: Maintenance and Equipment Costs ............................................................. 53
21. Transport2 Worksheet, Costs for Facility Pickup/Drop-off........................................................................................ 54
22. Transport3 Worksheet, Part I:Vehicle Costs.................................................................................................................. 56
23. Transport3 Worksheet, Routes and Per Diems ............................................................................................................ 57
24. Management Labor Costs ................................................................................................................................................. 59
25. Management2 Worksheet, Management Operating Costs......................................................................................... 62
26. Commodity Worksheets 1 through 4, Commodity Information .............................................................................. 66
27. Data Import Tab - Survey Validation: Facility List .......................................................................................................... 70
28. Costing Indicators Produced by the SCCT ................................................................................................................... 78
29. Facility Summary Report Details ..................................................................................................................................... 80
30. Summary of Total Costs (Report 2) ................................................................................................................................ 81
31. Detailed Supply Chain Functions Costs Report........................................................................................................... 83
32. Supply Chain Costing Metrics .......................................................................................................................................... 87
33. TDC: Breakdown of Costs by Function Incurred to Deliver $1,000 Worth of Commodities ......................... 92
34. Cost Comparison Matrix Utilizing the Costing Tool Outputs .................................................................................. 93
SEPTEMBER 2013
|
S U P P LY C H A I N C O S T I N G T O O L : U S E R ’ S M A N U A L
|
Ix
x
|
S U P P LY C H A I N C O S T I N G T O O L : U S E R ’ S M A N U A L
|
SEPTEMBER 2013
Acronyms
AIDS
acquired immune deficiency syndrome
ARV
antiretroviral
CCW
Central Contraceptive Warehouse
CFO
chief finance officer
CMS
Central Medical Stores
DHO
District Health Officer
FP
family planning
GFATM
Global Fund to Fight HIV/AIDS, Tuberculosis and Malaria
HIV
human immunodeficiency virus
Kg
kilogram
Km
kilometer
LIAT
Logistics Indicators Assessment Tool
LMIS
logistics management information system
LOE
level of effort
LSAT
Logistics System Assessment Tool
m
square meter
m3
cubic meter
MB
megabyte
MOH
Ministry of Health
NGO
nongovernmental organization
QA
quality assurance
QT
quantification time
SC
supply chain
SCCT
Supply Chain Costing Tool
SDP
service delivery point
SLD
straight line depreciation
SOP
standard operating procedure
SOW
scope of work
TB
tuberculosis
TDC
total delivered cost
UNFPA
United Nations Population Fund
Yrs
years
2
SEPTEMBER 2013
|
S U P P LY C H A I N C O S T I N G T O O L : U S E R ’ S M A N U A L
|
xI
xII
|
S U P P LY C H A I N C O S T I N G T O O L : U S E R ’ S M A N U A L
|
SEPTEMBER 2013
Acknowledgments
Marie Tien of John Snow, Inc., led the development of this manual. Elaine Baruwa and Darwin Young of Abt
Associates, Inc., contributed to earlier drafts and versions of the manual and tool. The development of this
manual would not have been possible without the comments and contributions from the following people: Laila
Aklaighi, Joseph McCord, Sylvia Ness, Leslie Patykewich, James E. Rosen, David Sarley, Adriano Sommerlatte,
and Cary Spisak. Many thanks also go to Zakir Sarker for his work on the tool.
SEPTEMBER 2013
|
S U P P LY C H A I N C O S T I N G T O O L : U S E R ’ S M A N U A L
|
1
2
|
S U P P LY C H A I N C O S T I N G T O O L : U S E R ’ S M A N U A L
|
SEPTEMBER 2013
1. At a Glance: Over view of the
Supply Chain Costing Tool (SCCT)
1.1 The USAID | DELIVER PROJECT’s
Supply Chain Costing Tool
The USAID | DELIVER PROJECT has designed the supply chain costing tool (SCCT) to support the
implementation of public health supply chain costing exercises. Based in Excel, the software tool greatly facilitates
data collection, analysis, and report generation of a supply chain costing exercise.
The software tool guides users through a process of specifying the parameters of the system being costed, creating
unique facility surveys, aggregating completed surveys, and generating summary tables that present the results of
the exercise and support further analysis.
The tool ultimately helps users determine total supply chain costs and provides insight into the cost drivers of those
supply chains—the operational factors that most directly affect total costs. By providing both detailed and “big
picture” cost estimates of the entire supply chain, the results from a supply chain costing can provide critical information
to assist government and development partners, technical assistance providers, supply chain managers, policy
makers, procurement managers and other interested stakeholders with a range of supply chain decisions.
The costing tool collects and categorizes supply chain costs for each tier of the health system and across four main
supply chain functions:
• Procurement includes in-country handling charges, clearance fees, and staff time spent on procuring
commodities.
• Storage includes staff time at medical stores or health facilities receiving commodities, conducting physical
inventory, or completing logistics management forms (registers, stock cards, bin cards, request and requisition
forms); it also includes cost of the space where the commodities are stored.
• Transportation includes the cost of moving commodities from one facility to another, as well as the cost of
using commercial transport or vehicle rental. It also accounts for per diem of drivers.
• Management includes labor to supervise, conduct monitoring, and also includes working with the logistics
management information systems, and quantification, operating costs (utilities), and training costs.
Based on collected surveys, the tool also supports calculation and presentation of supply chain costs in terms of
the following metrics:
•
•
•
•
•
supply chain cost as a percentage of the total value of commodities
supply chain cost per dollar of value, volume, or weight of commodities
the total costs of specific supply chain functions
the cost by supply chain tier (central, district, service delivery point [SDP], etc.)
labor cost for procurement, transportation, storage, management.
SEPTEMBER 2013
|
S U P P LY C H A I N C O S T I N G T O O L : U S E R ’ S M A N U A L
|
3
1.2 Why cost the supply chain?
Supply chain costing is a point-in-time assessment conducted to estimate the costs attributable to the activities
that make commodities available to end customers. Essential health commodities such as medicines and
contraceptives are key to improving health outcomes in developing countries, and strong supply chains play
a critical role in making those commodities available where and when users need them. Knowing the total
costs of the system can provide useful information to assist governments and partners in meeting the financial
requirements of operating and strengthening a country’s supply chain. Understanding the cost drivers of the
supply chain can also help managers supervise and monitor their systems (see figure 1). It can also map out the
organizations that support and fund the supply chain.
The results of a supply chain costing exercise can be used—
• To advocate and plan for funding: Knowing the costs of the supply chain is essential to ensuring adequate
financing and helping countries work towards increased sustainability of the supply chain system. A costing
exercise can provide guidance on the costs at each tier (central, regional, SDP) and how much it costs to
deliver commodities from the central level to the health facility. This also helps in estimating the incremental
costs of scaling up drug programs. Governments can use this information to determine whether current
budgets are sufficient and to plan for the appropriate level of investment.
• To better design, plan, and manage systems: A costing exercise can provide useful insight into cost drivers—those
elements of the system that most influence costs—and thus support strategic supply chain management and
planning decisions.
• To inform decisionmaking on supply chain policies and financing: A clear view of costs can help partners, governments,
and Central Medical Stores (CMS) allocate the appropriate funding for managing or distributing commodities.
Good cost information can also be the basis for negotiating outsourcing agreements for functions such as
transportation or warehousing, as governments and donors often set supply chain fees on little actual evidence.
Cost information can help set more realistic prices and margins for commodities that use a cost recovery.
The approach estimates the actual delivered cost of getting a product to an SDP, enabling partners to base
pricing policies or cost recovery strategies on specific supply chain costs rather than an arbitrary percentage of
commodity values that may or may not be a good approximation of the actual costs incurred.
• To provide a clearer understanding of the sources of funding for the supply chain: A costing exercise helps provide
stakeholders with a clear understanding of the different functions being performed by different development
partners. It provides a clearer definition of the resources being used to perform supply chain functions and
what volumes of goods are being distributed through the supply chain. It provides an integrated view of the
supply chain and can help partners fine-tune their contribution, identifying where additional resources might
be available and how these can be prioritized. For example, knowing the cost of the supply chain can help
countries more accurately request funds for improving the supply chain under initiatives such as the Global
Fund to Fight AIDS, Tuberculosis and Malaria (GFATM).
1.3 Minimum System Requirements and Offer of
Technical Suppor t
In order to experience full functionality of the tool, the following resources are recommended for use with the SCCT:
• Personal computer (PC) with Microsoft Windows 7
• Microsoft Office 2000/2003/2007/2010 with 32 bit
• 30–40 megabytes (MB) of hard drive space
4
|
S U P P LY C H A I N C O S T I N G T O O L : U S E R ’ S M A N U A L
|
SEPTEMBER 2013
The tool has been developed through successive pilot testing in Zambia (Baruwa, Tien, and Sarley 2009),
Zimbabwe (Sarley, Baruwa, and Tien 2010), Nigeria (Sommerlatte and Spisak 2010), and Rwanda (USAID |
DELIVER PROJECT 2012). As additional costing studies are conducted, the tool will be updated to reflect the
most current practices, methodologies, and definitions for supply chain costing. Suggestions and comments by
users are welcome to help improve the manual and tool and can be sent to the project at [email protected].
The project can provide targeted assistance to users of the tool to help with setting up the tool, generating
surveys, importing surveys, and some general troubleshooting. For assistance, contact [email protected].
1.4 Audience
The SCCT can be used by technical assistance providers, country program offices, government technicians, and
finance and costing personnel who want to conduct a costing study. The user will be able to set up the tool, create
surveys, import survey data, and generate reports. Successful application of the SCCT requires moderate abilities
in Excel. Users of this manual (and of the tool) should ideally have experience in planning and conducting
quantitative and qualitative assessments of public health supply chains. They should specifically refer to this
manual, both to gain a better understanding of the SCCT to help plan for a costing exercise using the SCCT, and
as a reference when using the tool.
1.5 Limitations of the SCCT
When using the SCCT (and subsequently analyzing the findings), it is important to keep in mind the tool’s
limitations. One important limitation is the fact that the costing exercise will capture the supply chain as it is
currently functioning, meaning that the costing tool presents estimated cost figures that stay the same whether
a system is operating at full supply or is experiencing a number of stockouts. It does not measure supply chain
performance or optimize supply chains; it is therefore important to consider the stockout rate and other contextual
factors as identified by separate sources when analyzing the findings and assessing the supply chain costs.
In the SCCT, a limit of up to 50 different facilities and 200 different commodities can be included as part of the
costing analysis. However, if a supply chain manages more than 200 commodities, it will be necessary to combine
or create “bundles” of commodities during the calibration stage. For example, different product bundles can be
created for groups of individual commodities that would be managed by a health facility, hospital, or other type
of SDP (see Commodities in section 3.5).
The tool is also sensitive to user errors such as misnaming files or entering incorrect figures. Although this manual
provides guidance to avoid these issues, th e Excel knowledge requirements may prove difficult for some users.
If this or other concerns lead the user to decide not to use the full SCCT in a costing exercise, components
of the tool can still be helpful: in particular, partners can use a generic version of the survey produced by the
tool (available independently) to quickly collect costing data in a manner that supports further analysis. Your
comments and feedback on the tool are welcome and can be sent to [email protected].
1.6 Contents of this Manual
Reading this manual prior to applying the tool will help the user gain an understanding of the structure and
organization of the tool and will help the user plan and prepare better for a costing exercise.
The manual includes detailed instructions on every aspect of conducting a costing study using the SCCT.
SEPTEMBER 2013
|
S U P P LY C H A I N C O S T I N G T O O L : U S E R ’ S M A N U A L
|
5
This manual provides users with working knowledge of the SCCT as a software tool and includes step-by-step
instructions, screenshots, and troubleshooting tips to help the user get the most out of the software. It includes
the following chapters:
• Chapter 1 provides a brief overview of the objective of the SCCT manual, intended audience, outputs
produced by the tool, what the tool can and cannot do, and limitation and challenges.
• Chapter 2 describes the costing framework that the supply chain costing tool uses to carry out the analysis. A
separate glossary of logistics and costing terms is included in the annex
• Chapter 3 introduces the Excel-based tool and provides detailed instructions on how to set up the tool, how to
create categories to group results for analysis, and how to create surveys for data collection
• Chapter 4 is a step-by-step walkthrough of each of the surveys generated by the SCCT to be used for data
collection and describes in detail what data are to be collected for analysis during the data collection process
and how these data are to be entered into the survey.
• Chapter 5 instructs the user on how to organize the data collected in the surveys so that they can be imported
into the SCCT for analysis; the chapter also provides instructions on how to identify and correct any issues
that may arise because the data are not in the format that the SCCT requires or because critical data needed by
the SCCT are missing.
• Chapter 6 reviews each of the four reports produced by the tool and the contents of the reports.
For more information on why it is important to cost the supply chain, the steps and human and financial resources
required, how long a costing will take, and how data can be used for policy decisionmaking, see A Guide to Public
Health Supply Chain Costing: A Basic Methodology. It includes a complete description of the supply chain costing
process from the planning steps, through each analytical step, to interpreting, reporting, and discussing the results.
In addition to the manual, please refer to the document Costing Survey Job Aid, which will help you complete the
surveys during data collection and when entering data into the electronic Excel facility surveys. This document can
be found at http://deliver.jsi.com/dlvr_content/resources/allpubs/guidelines/CostSurvJob.pdf.
6
|
S U P P LY C H A I N C O S T I N G T O O L : U S E R ’ S M A N U A L
|
SEPTEMBER 2013
2. Supply Chain Costing Framework
This chapter describes the supply chain costing framework which organizes the SCCT.
2.1 Organization of the SCCT and Over view of
Costing Framework
The SCCT takes an activity-based or a “bottom-up” approach to estimating the cost of each supply chain
function by each level (or tier) of the supply chain. The costs are then aggregated to determine the total cost of
the supply chain. This allows the user to perform the three types of analyses necessary for the costing study: total
costs, unit costs, and cost drivers.
Three supply chain characteristics (structure, function, and commodity throughput) provide the framework for
identifying the input costs to calculate total costs, unit cost, and cost drivers. Detailed information on these
characteristics must be collected by the costing team and entered into the SCCT. Figure 1 illustrates the inputs
(white arrows) required by the costing tool to produce the outputs (blue boxes) required to perform a supply
chain costing analysis.
Figure 1. Supply Chain Costing Tool: Inputs and Outputs
Inputs
Outputs
Total Costs
Supply Chain Structure
Supply Chain Function Costs
Supply Chain Costing Tool
Commodity Throughput
Unit Costs
Cost Drivers
SEPTEMBER 2013
|
S U P P LY C H A I N C O S T I N G T O O L : U S E R ’ S M A N U A L
|
7
Figure 2 is adapted from the work of Christopher Martin (Christopher 1998), which was first adapted to
cost Ghana’s public health supply chain (Huff-Rousselle and Raja 2002).The figure shows how the costs of a
supply chain can be described in terms of tiers and functions. Different functions are performed by facilities in
different tiers. The term facility in this manual refers to a single institution that performs at least one function
(procurement, storage, transportation, management) in the supply chain. This is not to be confused with the
term health facility, which only applies to SDPs such as hospitals, maternity clinics, or health clinics.
Total Supply Chain Costs in figure 2 refers to the total costs of every function performed by each tier of the
supply chain. An example of a tier 1 cost is the cost of procuring family planning (FP) commodities for a country
by the procurement division of the Ministry of Health (MoH). An example of a tier 2 cost is the storage costs
incurred by a regional medical store. A tier 3 cost could be the staff time spent each month conducting physical
inventory of its commodities. Some functions (e.g., management) may be performed across all tiers, whereas
others (e.g., transport) may be performed by only one or two tiers. Total costs can be delineated by other
categorizations, such as grouping supply chain facilities by tier, facility type, region, or by any other category
determined by the user.
“Total Delivered Cost” is defined as the total cost of acquiring and delivering a unit of some commodity to the
end user. This cost (detailed in section 6.4) includes—
• the cost of procuring that unit at whatever tier the cost was incurred (usually tier 1)
• the cost of storing that unit at every point where storage occurred as the commodity was distributed through
the supply chain
• the cost of transporting that unit between each storage point in the supply chain, up to and including storage
at the end point of the commodity’s journey (usually the last tier)
• only the management operating cost of that unit at each tier as the commodity was distributed through the
supply chain (total delivery costs do not include labor for quantification, quality assurance [QA], training, LMIS).
Providing a denominator for any of the costing metrics estimated by the SCCT requires the types and quantities
of public health commodities distributed by the supply chain. The types of commodities that can be costed using
the SCCT include—
•
•
•
•
•
FP commodities
essential medicines and non-drug commodities
human immunodeficiency virus (HIV) and acquired immune deficiency syndrome (AIDS) medicines and test kits
malaria commodities
tuberculosis (TB) commodities
The SCCT can cost any commodity as long as value, volume, and weight data are available. Costs are estimated
for each facility, by function, using data collected from that facility. If a facility only procures commodities but
does not have any expenditure on storage, transportation or management, only procurement costs are collected
for that facility and included in the analysis. But if a facility carries out all four functions, expenditures on all four
functions should be collected and analyzed. The facility costs can then be categorized and aggregated (e.g., across
tier 1 to obtain total tier 1 supply chain costs or down a chain of facilities in the supply chain to obtain the Total
Delivered Cost1 for a commodity).
1 Total Delivered Cost is defined as the total cost of delivering a unit of some commodity to the end user and is discussed in section 6.
8
|
S U P P LY C H A I N C O S T I N G T O O L : U S E R ’ S M A N U A L
|
SEPTEMBER 2013
Figure 2. Supply Chain Costing Tool Framework
Supply Chain Tiers
Tier 1
Tier 3
Tier 2
Supply Chain Functions
e.g. procurement
costs of the
ministry of health
Tier 4
Procurement
e.g. storage costs
at a rural hospital
Storage
Supply
Chain
Costs by
Function
e.g. driver per
diems paid by a
ministry of health
Transportation
e.g. operating
costs of facility
Supply Chain Cost by Tier
Management
Total Supply Chain Costs
Supply Chain Structure
Public health supply chains are usually characterized by several tiers—typically two, and sometimes as many
as four. The first tier (tier 1) comprises national facilities or organizations that do in-country procurement,
central storage, and distribution to lower levels. In systems with additional tiers, the first-tier facilities provide
commodities to intermediate facilities such as regional stores (tier 2) that are responsible for storage. The
intermediate (tier 2) facilities may then deliver to a subsequent tier (tier 3; e.g., SDPs) that then dispenses the
commodities to clients.
The SCCT collects and analyzes data by facility, and it assigns facilities to only one tier. Figure 3 illustrates how
the SCCT organizes facilities into tiers.
SEPTEMBER 2013
|
S U P P LY C H A I N C O S T I N G T O O L : U S E R ’ S M A N U A L
|
9
Figure 3. Supply Chain Structure: An Illustrative Example
MOH procurement
office, development
partners, central
medical stores
Tier 1
Provincial health
offices, regional
stores
District health
office, district
stores
Clinics, rural
health posts,
service delivery
points
Tier 2
Tier 3
Tier 4
Tier 3
Tier 4
Tier 2
Tier 3
Tier 4
Tier 2
Tier 3
Tier 4
Tier 4
Where several parallel supply chains exist, it is important to capture costs from facilities at different tiers in each
supply chain. In some instances, different funding sources may procure products that are handled by the same
CMS and distributed to separate and sometimes overlapping facilities at lower tiers. Also, products may be
procured by different tiers within the system. In any of these cases, the costing exercise should capture a relatively
representative depiction of the existing system.
10
|
S U P P LY C H A I N C O S T I N G T O O L : U S E R ’ S M A N U A L
|
SEPTEMBER 2013
Supply Chain Functions
The costs of the supply chain are organized into four main supply chain functions as described in table 1.
Table 1. Functions of the Supply Chain
Procurement
Storage
Transportation
•
Only procurement-related tasks performed in-country are included in the costing analysis
•
Managing bids and tenders to identify reliable suppliers of good quality, competitively priced
products
•
Executing procurement contracts with suppliers
•
Receiving and warehousing commodities
•
Receiving or picking up commodities, conducting physical inventory, completing logistics
management forms, and performing other commodity-management activities
•
Moving goods from one facility to another either by the use of vehicles owned by the facility, the
use of hired vehicles such as courier companies, or by public transport
•
Supervising and coordinating all supply chain activities by logistics managers, supervisors responsible
for providing monitoring of staff who manage commodities
•
Training of supply chain staff and commodity managers
•
Conducting QA of commodities at point of entry into a country and through the supply chain until
delivery to the end user
•
Managing supply chain data using LMIS
•
Identifying and quantifying* which commodities are required by the health facilities in the service
delivery system
•
Collect any operating and training costs
Management
*Quantification is a pre-procurement activity but is classified under management for the purposes of the costing tool. In most countries, quantification is a multipartner activity. Procurement, on the other hand, is undertaken by each partner individually with more circumscribed costs.
2.2 Data Requirements of the SCCT
To determine supply chain costs, the SCCT requires collection of input data through surveys and existing
financial reports. This section describes where to find data and lists some considerations the user needs to be
aware of when collecting data. Some suggestions on data sources are provided in this section and also in annex 4,
Data Sources, which contains tables of data inputs and sources by function.
Detailed cost data should be collected for each function and tier of the supply chain. This section describes some
considerations the user should be aware of when collecting this data, including labor, space, and building costs;
asset depreciation; and management/overhead costs. To complete the costing exercise, it may be necessary to
collect information from both quantitative and qualitative data sources.
• Quantitative data sources may come from annual financial reports, commodity databases, health facility
records, or distribution schedules. Specific examples of these are noted under each of the sections below.
• Qualitative data sources may come from interviews with key informants such as ministry of health staff,
health facility workers, government staff based at the regional and district levels, CMS personnel, development
partners, and nongovernmental organizations (NGOs) that can provide supply chain costing data.
SEPTEMBER 2013
|
S U P P LY C H A I N C O S T I N G T O O L : U S E R ’ S M A N U A L
|
11
• Building on the supply chain function cost metrics for each facility, the tool generates aggregate costs.
In estimating supply chain costs, it is important to balance the ease of collecting information and the
desire to be comprehensive in capturing costs with the likely accuracy of the information being collected.
As Terry Pohlen stated at the Council of Supply Chain Management Professionals annual meeting in
Chicago in 2009 when talking about supply chain costing, “It is better to be approximately right than
precisely wrong.” Although the SCCT seeks to capture all of the costs listed above, in some settings the
information will either be unavailable or impossible to estimate. If the user needs to make assumptions
to cover for missing data, these assumptions need to be explicitly stated. Where actual evidence of costs is
hard to find, it may be better to simply omit them than to include proxy estimates that may be incorrect.
Labor Costs
Labor costs are estimated for each function of the supply chain but can be difficult to assess for several reasons
(table 2). In interviews, staff may not know or may not wish to share salary information with data collectors. One
approach to this is to collect salary grade information for each staff member. Before traveling to the field, the data
collection team should obtain a copy of the civil service salary schedule. The user can include civil service proxy
grades, bundle staff, or use an average salary so that individual salaries are not shared. Using proxy civil service
salary will reflect, in most cases, a lower cost estimate—this would likely be the cost if the host government took
over the supply chain.
Table 2. Basic Costing Data Collected for Supply Chain Labor Costs
Position
Names of staff should not be used when collecting data,
only the position held. It is not appropriate to share salary
information without the permission of the specific member of
staff.
Annual Salary
Annual salary and all non-salary benefits should be included.
Typically, respondents do not know the currency value of
all their benefits and a civil service salary scale/document, if
available, would be a more appropriate data source.
Number of Staff Providing Support
to the Supply Chain
If several clerks are working on the supply chain but each
is paid a different salary then it may be possible to enter
an average salary. Otherwise, each staff member should be
entered into that facilities survey.
Number of Hours Worked per Week
Should be specific to each supply chain activity. For example,
time spent on transportation activities should be kept
separate from supervision time.
The user may need to ask additional questions to disaggregate personnel time if the costing exercise looks at one
type of commodity. This is especially true at the health facility level, where staff members are responsible for
managing all commodities. If the exercise assesses ARVs, for example, the health worker needs to estimate only
the time he or she spends on ARV commodities. Table 3 outlines the approach that can be used to establish the
time spent on supply chain activities by health workers. Notice that in this approach a final estimate of time spent
is derived through intermediate variables or pieces of information rather than by asking the worker to give an
outright estimation of time spent. The time estimate needs to be converted into a weekly ratio, which the SCCT
uses to determine costs for a one-year period; an example is provided in table 3. This may also apply to other
labor costs associated with transportation, such as drivers, or staff time spent on procuring commodities. Further
12
|
S U P P LY C H A I N C O S T I N G T O O L : U S E R ’ S M A N U A L
|
SEPTEMBER 2013
information on management labor costs are provided in Management Labor Costs later in this section.
Table 3. Calculating Personnel Time Spent on Supply Chain Activities
How much time do you spend managing ARV commodities?
Question to
Interviewee
(Illustrative tasks could be filling out logistics management forms,
[e.g., bin cards, stock cards, order forms], conducting physical
inventory, reviewing logistics management forms.)
Assume 40 hours worked per week for each full-time staff member.
Possible Answers
Conversion Into Hours per Week
2 hours per day
= 10 hours a week
4 hours per week
= 4 hours a week
= 16 hours a month
2 days per month
= divide by 4.33 to get hours per week
= 3.7 hours a week
Space or Building Costs
Supply chains typically utilize government-owned buildings. There is no annual cost associated with the use of
these buildings as far as the budget is concerned. Nonetheless, the cost of these assets should be included for two
reasons:
1. The replacement cost of these assets needs to be factored in and is not zero. Buildings depreciate and,
depending on the depreciation schedule, warehouses and stores should be renovated or replaced over time.
In many countries, the accounting life of a building may be between 20 and 30 years. In reality, the building
will typically need renovation, rebuilding, or refurbishment before this time.
2. In the event of damage, the cost of using another building may not be zero, at which point space costs will
become an actual cash expenditure (ie, in the form of rent).
Governments use a building cost estimate, established for their buildings, to determine how much a new building
would cost. This cost typically varies by region, and may be different in the capitol city than in rural areas. These
estimates should be obtained from a ministry of works and housing or a ministry of health planning department.
Typically, storage space can be estimated in a three-step process:
1. Estimate the square meter (m2) storage space where the commodities are stored.
2. Apply the standard government construction replacement cost to estimate the total cost of the storage space.
3. Convert this to an annual cost by applying the financial depreciation rate for buildings; in some cases, if
buildings are depreciated over too long a period in a country’s accounting code, a shorter more economic
depreciation rate may be needed.
SEPTEMBER 2013
|
S U P P LY C H A I N C O S T I N G T O O L : U S E R ’ S M A N U A L
|
13
Equipment Costs and Depreciation
All depreciation in the SCCT is calculated using straight line depreciation2 of fixed assets (e.g., buildings,
vehicles, equipment). The information required for the costing is the price of the fixed asset at purchase and the
expected working life when purchased. Government facility vehicles and equipment have set depreciation rates
and implied useful lives, which the government uses to account for its capital and that is frequently used within
a country by other implementing partners/facilities. Partners should always be asked what depreciation rates they
use; this will usually be readily available in their audited accounts. The costing exercise should include capital
costs such as buildings, vehicles, and equipment used for storage.
The data required to determine an annual charge or an annual depreciation charge are shown in table 4.
Table 4. Example of Basic Costing Data Needed for Supply Chain Equipment
Type of equipment
10-ton truck
Number of equipment units
1
Cost or purchase price
$25,000
Accounting life
4
Annual depreciation charge
= 1 x (25,000/4)
= $6,250 (calculated by tool)
Another cost to consider is when a donor has funded technical assistance support over several years to design,
introduce, and manage a system. The value of previous-year investments can be treated as an investment cost
that should be depreciated or shared over multiple years. In these cases, the total estimated cost of the project
technical assistance may be amortized over a four- or five-year period.
Management Costs
The tool classifies management as one of the four main supply chain functions, providing cross-cutting support to
the other three main functions.
Management Labor Costs
As previously shown in table 1, management includes quantification, LMIS, supervision, and training. The
MOH, CMS, or development partner may have staff members who perform tasks that would be categorized
under the management function. Staff may be responsible for conducting forecasts and quantification, they
may support the LMIS (i.e., entering data or reviewing logistics reports), they may conduct supervision visits to
monitor the management and quality of reporting and commodity management, or they could conduct training
on logistics or standard operating procedures (SOPs). Other management-related costs to oversee the supply
chain can be entered in the miscellaneous section of the survey.
2 Straight line depreciation means that the value of the equipment or building for each year of its life is equal to the total value divided by the number of years of useful life.
A car with a useful life of 5 years that costs $10,000, for example, would be given an annual value or depreciation charge of $2,000.
14
|
S U P P LY C H A I N C O S T I N G T O O L : U S E R ’ S M A N U A L
|
SEPTEMBER 2013
Management Operating Costs
The tool also includes operating costs, defined as the overhead costs incurred by a facility. Examples of these costs
include utilities (e.g., electricity, water, security, maintenance). Only line items that relate to the supply chain
overhead should be counted. For example, a large hospital’s operating costs might include overtime labor, drug
and lab commodity costs, and other costs that are hospital overhead costs but are unrelated to the supply chain.
These costs do not directly relate to the supply chain and thus should not be counted toward the supply chain
costs, as this would greatly overestimate the overhead required for the storage space at these facilities.
Only a few facilities perform supply chain activities solely, and therefore only a proportion of a facility’s overhead
costs will usually be counted as supply chain operating costs. In most cases, the administrative function of a
facility covers several functions that are unrelated to logistics. It will therefore be necessary, before the exercise
begins, to determine criteria for apportioning these costs to the supply chain functions. It will also be necessary to
apply these criteria consistently throughout the exercise. For example, the user may determine the total overhead
for a facility and then apportion a percentage of the total overhead to the supply chain according to square
footage, number of employees, or any other basis that is considered most appropriate—if the facility is 5,000
square feet, has a storage facility of 500 feet (10 percent of total area), and has a total overhead charge of $1,000
per year, 10 percent of the overhead costs—or $100—may be assigned as the operating costs of that facility in the
supply chain costing exercise. However, it will frequently be the case that no one at the facility knows the square
footage of the buildings that make up the facility, or the facility may be so small that the overhead charges are
negligible. In such cases, it may be necessary to simply take a given percentage of operating costs and apportion
that percentage to all facilities.
However, there may be issues with this approach for facilities with very high operating costs (e.g., referral
or teaching hospitals). Because these types of facilities have operating costs that may be several orders of
magnitude larger than smaller health facilities (possibly over a million U.S. dollars compared to a few
thousand dollars for small health posts), using the same percentage may not be appropriate. In such cases,
a smaller percentage may be assumed. Although there may be no way of accurately capturing this cost, the
important considerations when implementing a costing study is that the percentage used is consistent for
similar facilities and that the assumptions are clearly stated. This is critical: if some facilities show very large
supply chain costs for small quantities of commodities, the user must be able to determine whether operating
costs account for a substantial proportion of the supply chain costs. If so, facilities may be overly sensitive to
the percentage of operating costs used.
Several line items labeled Other are included in the management2 survey to accommodate any other costs (usually
fairly small) that do not fall neatly into any of the larger function categories.
Commodity Throughput
The SCCT is designed to accommodate a wide variety of public health commodities. The tool requires a detailed
description of each commodity’s landed cost, volume, and weight per unit. The tool also requires an estimate of
the commodity throughput, defined as the total number of units received plus the total number of units shipped
or consumed, divided by two. This definition applies for the entire system and for each facility at all levels in
the supply chain. The throughput data is combined with the supply chain function costs and the supply chain
structure data to produce the outputs previously illustrated in figure 1.
For some costing exercises, the assessment team is tasked with identifying the supply chain costs associated with
all commodities handled by the public health system. This eliminates the need to identify the ratios of labor and
management resources dedicated to a particular subset of commodities, but it does present additional challenges.
SEPTEMBER 2013
|
S U P P LY C H A I N C O S T I N G T O O L : U S E R ’ S M A N U A L
|
15
Most public health systems manage hundreds of different commodities, particularly within essential medicines,
but do not track logistics data for all products at all facilities within a centrally accessible database. As a further
challenge, some essential medicines may enter the system through decentralized procurement mechanisms,
making it difficult to assign a particular value, weight, and volume to those products. The team conducting
the costing exercise should have discussions early on with partners who are familiar with the supply chain’s
information logistics systems to determine how to collect throughput data at each level and facility. This will
allow the team to determine the best approach for setting up the tool and will also give survey facilities advance
notice of the need to have the necessary commodity reports or data available. Suggestions on how to calculate
commodity throughput in this context can be found in Commodities in section 6.4.
16
|
S U P P LY C H A I N C O S T I N G T O O L : U S E R ’ S M A N U A L
|
SEPTEMBER 2013
3. Setting Up the Tool
This chapter and chapters 4–6 provide detailed instructions for using the Excel workbook, Supply Chain Costing
Tool (figure 4).
The first, major step is to set up and customize the tool’s Excel workbook. To the extent possible, the user should
set up the General Info and Facility components of the tool prior to arriving in the country or as early as possible
during the field visit. This can actually be done as discussions take place to finalize the scope of work and as the
user determines the structure of the supply chain. Completion of the Facility List and Commodities components
will most likely take place in-country after consulting, verifying, and discussing with the team’s counterparts.
As the user reviews this section, he or she
should open a copy of the SCCT on a
computer to practice navigating and using
the software.
Figure 4. USAID | DELIVER PROJECT Supply Chain Costing Tool
3.1 Opening
the File
A security warning is displayed when the
file is opened (figure 5). The user must
click on “Enable Content” to activate all
of the tool’s features.
Saving the SCCT File
• Saving a copy of the blank version of
the SCCT Excel file “Supply Chain
Costing Tool”, on a computer is
recommended so that an empty version
to start from is available when needed.
Figure 5. Opening the Tool: Click on Enable Content
• When saving the file, the user must not
rename the Excel file “Supply Chain
Costing Tool”. Instead, the user should
create a new folder, give the folder a
name that includes the name of the
country or supply chain or date, and save
the “Supply Chain Costing Tool” Excel
file there. For example, for a field visit
taking place in July, the user would create
a folder named “July 1,” within which
there should be a “Surveys” folder and
the Supply Chain Costing Tool Excel file (figure 6).
The SCCT file name—Supply Chain Costing Tool.xls—MUST be kept as is.
SEPTEMBER 2013
|
S U P P LY C H A I N C O S T I N G T O O L : U S E R ’ S M A N U A L
|
17
• Changing the name of the Excel file will disable some features of the tool. Creating folders for different
datasets is recommended (this may be needed if one wants to keep older versions).
Figure 6. Creating a Separate File for Surveys
Tip
How to Save the Workbook
1. Create a folder exclusively for the
workbook file: “Supply Chain Costing
Tool.”
2. Name the folder with:
• Name of country or supply chain
• Date (for version control).
User must NOT rename the original
Excel file (“Supply Chain Costing
Tool.xls”)!
3.2 SCCT Contents
The SCCT is divided into five sections, each of which can be reached from the main navigation toolbar
summarized in table 5 (also see figure 7).
Table 5. SCCT Sections
18
|
Tool Section
Sub-Sections
Home Page
No worksheets in this section
Calibrate Tool
3.
4.
5.
6.
General Info
Facility Types
Facility List
Commodities
Data Capture/Entry
1.
2.
3.
4.
5.
6.
7.
8.
Survey Management
Facility Name
File path to store facility surveys
Does the survey already exist?
Menu to create, print and edit surveys
Create survey(s)
Edit Survey
Print survey(s)
Data Import
1. Import Survey Data
2. Survey Validation
7
Reports
1. Facility Summary - Table 1
2. Summary of Total Costs- Table 2
3. Detailed supply chain Function Costs- Table 3 (includes graphing
worksheets)
4. Total Delivered Cost (TDC) Calculator- Table 4 (per $/m3/kg)
5
S U P P LY C H A I N C O S T I N G T O O L : U S E R ’ S M A N U A L
Manual Chapter
3
|
SEPTEMBER 2013
4
The following sections provide step-by-step guidance on each component of the Excel tool. Users are strongly
advised to follow these steps in order when conducting an analysis and when familiarizing themselves with the
tool (figure 7).
3.3 Home Page
Figure 7. SCCT Navigation Bar
The front page of the SCCT (figure 7),
referred to as the home page, features two
buttons: About provides information about
the version of the SCCT, and Help provides
further information about the tabs on the
home page.
3.4 Calibration
Calibrating, or setting up, the SCCT is a
critical preparatory step in the costing study.
Many of the inputs entered into the Calibrate Tool component cannot be changed at a later date; many of these
inputs are used to provide drop-down menus in later components of the SCCT and to generate the surveys to be
used for data collection. Therefore, changes made after the surveys are produced or after data are collected will require
the surveys to be rerun or reproduced and the data to be re-entered. In such cases, it may be simpler if the user
starts over from a blank Supply Chain Costing Tool file (being sure to save it to a new folder as described above).
The Calibrate Tool component includes four subsections (figure 8). Instructions for each of these are provided below.
The user should follow the steps from left to right as laid out in the navigation toolbar, starting with the General
Info subsection (figure 8).
Tips
• Do not delete rows, cells, columns or tables in any of the worksheets. Otherwise, the calculations will not work
properly. To clear data entered into green cells, right click and “clear contents.” However, do not leave blank rows
within the Facility List or commodities table.
• Do not alter or reformat cells.
• “?” buttons provide help on the elements of the tool, definitions of terms used in the tool and information on the
steps that need to be taken by the user to utilize the tool’s function. These help buttons appear throughout the tool.
• A toolbar appears at the top of every page and in some sections there may be a sub-toolbar to navigate between
subsections. The SCCT toolbar provides easy access to all five sections of the SCCT, without having to return to
the Home Page.
• Do not copy data from one section to another in the tool.
• “Paste, Paste Values,Values” can be used to copy data from another (non-costing tool) Excel document into the tool.
SEPTEMBER 2013
|
S U P P LY C H A I N C O S T I N G T O O L : U S E R ’ S M A N U A L
|
19
General Information Regarding the Supply Chain
Figure 8. Subsections under Calibrate Tool
Home Page
General Info
Calibrate
Tool
Facility Types
Data
Capture/Entry
Data
Import
Facility List
Commodities
Analysis
The user should be able to complete the General Info component after reviewing background information on the
supply chain structure and speaking with the country counterparts regarding how they want the costing results to
be organized. This information is essential to ensuring that the results can be sorted to meet the objectives of the
costing exercise. Use table 6 as a guide to enter data in the General Info subsection.
Table 6. Summary of Calibration Parameters for General Information About the Supply Chain
Parameter
What You Should Do
1
Name the country and the supply chain
Enter the name of the supply chain (e.g., Delivery Team Topping Up,
Contraceptive Logistics Management Systems)
2
Number of tiers in the supply chain
Select number from drop-down list.
For example the central level would be Tier 1. A region could be Tier 2. A
district Tier 3. All SDPs Tier 4. Each supply chain will have a different number
of tiers.
3
Name the tiers in the supply chain
Enter the name of each tier.
After you enter tier names, the names populate the drop-down menus
used in other parts of the SCCT.You must place every facility in a tier.
4
20
|
Tier 1
Enter the name
Tier 2
Enter the name
Tier 3
Enter the name
Tier 4
Enter the name
If you want to analyze results in groupings
other than “Tier,” you can create up to
four new categories.
Create additional categories if relevant.
Examples of facility categorizations and category tags
Category Name
Category tag (‘drop down list’ that will be
created in each facility survey)
Region
North
South
East
West
Urban/Rural
Urban
Rural
Density
High
Medium
Low
Accessibility
Easy
Medium
Difficult
S U P P LY C H A I N C O S T I N G T O O L : U S E R ’ S M A N U A L
|
SEPTEMBER 2013
5
Parameter
What You Should Do
What currencies will you use in this
analysis?
Enter the currencies that data will be collected in and the currency conversion.
All currencies must be entered at this point.
A currency for US$ must be entered.
Additional currencies must also be entered. Note that the currency conversion
should be entered at equivalents of U.S.$1.
Once a currency is chosen, all costs must be entered in that currency in the
surveys.
For example:
Name: Zambian Kwacha or ZKW
Currency Conversion: 5,051 ZKW (= U.S.$1)
Note: If you do not enter the information here, at this step, you cannot change
it later.
6
How many work hours are there in a
week?
Leave default value unless different for the country.
This should be the value for the standard work week for the employees of the
supply chain you are costing.The default value is 40 hours, but it might vary by
country so you should double-check this and change if necessary.
The tool uses this value to calculate the percent time for costing labor.
Example: Someone who works 10 hours a week on the supply chain is working
10/40, or 25%, of the week.Thus, one quarter of his or her weekly salary is
assigned to the cost of the supply chain.
7
Are transportation costs to be adjusted
for volume of commodities transported?
Select Yes or No.
“Yes” means that total transportation costs for each facility will be
apportioned according to the volume of commodities in that particular facility.
The tool will add all the transportation costs that are entered into the system
(fuel, per diem, etc). However, when the user activates the volume adjustment
function it adjusts for the volume that the specified commodities occupy in
the trucks or other vehicles.The SCCT calculates the total volume that the
costed commodities occupy and the total transport volume available (by
multiplying the size of the vehicles and the number of times they run a route).
The tool then creates a ratio (volume of commodities/total volume available
on vehicles) that is unique for each facility.The transport costs for each facility
are reduced by multiplying the original transportation costs by this ratio.
For example:
To cost only ARVs in an integrated supply chain:
volume of ARV’s = 200 m3
volume of vehicle = 500 m3
200m3 / 500m3 = 40%
Cost of transportation for ARVs = $5000 × 40% = $2,000
“No” means that all transportation costs for each facility are included in the
analysis.
SEPTEMBER 2013
|
S U P P LY C H A I N C O S T I N G T O O L : U S E R ’ S M A N U A L
|
21
3.5 Categorization
of Facilities
Figure 9. Completed General Info Worksheet
In addition to classifying by tier, the user
can group facilities by other categories as
shown in figure 10. Every facility must be
categorized into a facility type and as being
in one tier.
The user can also define other
categorizations that will be helpful in
generating tables for analysis. For example,
if the user will need to analyze costs for all
the urban facilities or facilities located in the
northern region of the country, it will be
necessary to create the categories and tags
described in the sections below.
Facility Types
After completing the General Info
component, the user must click on the
Facility Types tab (figure 10) to enter the
different types of facilities in the sample. To
be able to extrapolate from a sample, it is
essential to always include each major type
of facility in the sample. Table 7 provides
further guidance on completing the Facility
Types component.
Figure 10. Entering Facility Types
Facility List
After completing the Facility Type
worksheet, the user clicks on the Facility
List tab to list all of the facilities that will
be sampled. A limit of 50 different facilities
can be entered; if more than 50 are needed,
it may be possible to combine or create a
survey for a group of facilities. For example,
one facility survey can be created for urban
referral hospitals, and all costs for these
facility types would be entered into one
survey. The user enters the names here
only after finalizing the sample. The tool
uses this list of facilities to automatically
generate a data collection survey and to
provide a unique identification number for
22
|
S U P P LY C H A I N C O S T I N G T O O L : U S E R ’ S M A N U A L
|
SEPTEMBER 2013
Home Page
General Info
Calibrate
Tool
Facility Types
Data
Capture/Entry
Data
Import
Facility List
Commodities
each facility. Facilities can be listed in any order; however, once the user
enters the name and generates the surveys, the order cannot be changed.
If the user subsequently decides not to sample a particular facility, it must
still be left on the list. The user must not delete the facility from the list or
delete any rows from the Facility List. Figure 11 provides an example of a
completed Facility List worksheet.
Analysis
Tip
All subsequent rows
must be filled in when
entering facility names.
Only blank rows are allowed
after all facilities have been
entered in the Facility List.
Table 7. Facility Index/Survey Generation Calibration Parameters
Parameter
What You Should Do
ID
Enter nothing.
Unique facility identification number (generated by tool)
Facility Name
Enter the facility name.
Use a unique name for each facility.
Do not skip any rows when entering facility names.
Note: In cases where two or more facilities or agencies procure the same commodities for
the same program, it is recommended to enter the names of both facilities and then create
and enter a name of a dummy facility consolidating the two organizations buying the same
commodities.This will allow the SCCT to generate survey forms to the facilities individually
as well as generate a dummy facility to aggregate shared costs among programs.
Tier?
Select the tier in which the facility is classified.
Choose the tier from the drop-down menu at the right of each cell.
Procurement
Select Yes or No.
Select “Yes” if the facility procures commodities OR incurs handling charges, customs
clearance, or other fees related to clearing commodities from port. For example, a
procurement unit would be responsible for procuring commodities and would pay the fees
for clearing commodities from port.
Select “No” if the facility does not procure goods (i.e., it receives goods from another higherlevel facility within the supply chain) or if it incurs no fees to clear commodities from port.
SDP
Select Yes or No.
Choose from drop-down menu at the right of each cell to indicate whether this facility is an
SDP.
SEPTEMBER 2013
|
S U P P LY C H A I N C O S T I N G T O O L : U S E R ’ S M A N U A L
|
23
Figure 11. Completed Facility List Worksheet
Creating Dummy Supply Chain Facilities
It is not unusual to find costs within the supply chain functions spread across more than one facility, particularly
at tier 1. For example, the trucks used by a CMS could be maintained by a development partner, which incurs
the costs of tires, servicing, etc. Another partner may pay the drivers. To ensure a complete accounting of costs,
the user must collect data from each agency and record the data in their respective surveys. To determine the
aggregate cost of the various organizations supporting the supply chain at the central or tier 1 level, the user needs
to create a dummy facility to represent and aggregate all the costs of all the participating facilities. To calculate
the delivered cost, the tool requires one facility (i.e., a dummy facility) that contains all of the tier 1 costs in
one survey. The total supply chain costs at the tier 1 level are then aggregated, showing the total for all of the
supply chain functions (table 8). The dummy facility survey should be populated with all the line items in the
participating surveys. This is most accurately done by printing out those surveys, entering each line item into the
new dummy survey, and crossing off each line item as it is entered.
24
|
S U P P LY C H A I N C O S T I N G T O O L : U S E R ’ S M A N U A L
|
SEPTEMBER 2013
Table 8. Aggregating Supply Chain Costs into a Dummy Facility to Aggregate Tier 1 Costs
Tier 1 Facilities
CMS
MOH
Development
Partner 1
Transport
Vehicles (to
distribute
commodities):
$10,000
(depreciated
cost)
Salaries (for
drivers): $50,000
Per diem (for
drivers): $10,000
Storage
Salaries (CMS
staff): $30,000
Development
Partner 2
Dummy
“Master” Facility
Function
Equipment
(Racking and
renovation at
CMS): $80,000
$70,000
Equipment (fork
lifts at CMS):
$60,000
$170,000
Management
Quality Assurance
Salary of quality
manager (testing
condoms):
$20,000
$70,000
Salary of
logistics officer
(supervision
time): $35,000
Salary of
program
manager
(supervision
time): $15,000
LMIS
Salary of data
entry clerks at
CMS: $50,000
$95,000
Salary of
program
manager at
CMS (pay for
salary managing,
reviewing, and
verifying LMIS
data): $45,000
Training
Salary of logistics
officer (training
time on SOPs):
$25,000
LMIS manager
(training time
on LMIS system
for CMS staff):
$20,000
Cost for SOP
training: $15,000
$45,000
Operating Costs
$40,000
Total
$100,000
$65,000
$165,000
$175,000
$505,000
Value of Commodities
$1,000,000
$50,000
$650,000
$300,000
$1,000,000
SEPTEMBER 2013
|
$55,000
S U P P LY C H A I N C O S T I N G T O O L : U S E R ’ S M A N U A L
|
25
Commodities
Home Page
General Info
Calibrate
Tool
Facility Types
Data
Capture/Entry
Data
Import
Facility List
Commodities
Analysis
After providing all the information required in the Facility List tab, the user clicks on the Commodities tab
and enters information on the value, volume, and weight of the commodities carried by the supply chain. This
enables the tool to determine the quantity of goods that flow through each facility and tier of the supply chain
and to calculate the metrics (value, volume, and weight of commodities) of the supply chain. The commodity
database requires the information listed in table 9, which must be entered for each commodity (see figure 12).
The commodities list automatically generates drop-down menu options in each facility survey. Although no
more than 200 commodities can be entered in the facility survey, up to 400 commodities can be entered in the
Commodities worksheet.
One approach to entering more than 200 commodities is to reconfigure the tool after throughput data has been
collected to create a set or bundle of products for each surveyed facility (e.g., creating bundles of products titled
“Facility 1 throughput,” “Facility 2 throughput,” etc.). For each of these, the user enters the total value, volume,
and weight captured at that facility. Then, in the individual facility surveys (on the Commodity1 through
Commodity4 tabs), the user selects the appropriate facility as the commodity name (i.e., “Facility 1 throughput”)
and enters 1 as the quantity. Using this approach, the costing tool bases its calculations on the total throughput
values, but the user does not have to create and enter quantity data for hundreds of commodities.
For supply chain systems for which logistics data may not be available at the lower level, or if commodities enter
the system in a decentralized system where procurement takes place at the lower level, it may be difficult to collect
throughput data, values, weights, and volumes. In such cases one of the following approaches can be attempted:
1. If all facilities maintain electronic records of commodity receipts and issues, plan to collect and use this data.
2. If facilities do not uniformly capture commodity throughput electronically, the most thorough approach
is to copy stock card data for all products at each facility, as recommended in this manual for capturing
throughput data for vertical programs. However, if the system handles hundreds of different commodities,
this approach can be extremely time-consuming and may introduce data quality problems into the analysis.
3. If copying physical stock cards is not a viable option, the next best approach is to pursue product financial
data, particularly in systems that operate cost recovery schemes. Monetary transactions are more likely to be
tracked electronically and can be used to calculate the value of commodity throughput. Volume and weight
is then calculated based on the product quantities (if available) or on an average value/volume/weight ratio
calculated for different commodity groups.
Ultimately, the approach used to capture throughput data depends on the local data systems available and may
require comparison of several different data systems to inform a national assessment. To determine the best
approach, the assessment team should hold advance conversations with knowledgeable partners about the existing
logistics data systems and inform survey facilities in advance of the need to make reports available.
26
|
S U P P LY C H A I N C O S T I N G T O O L : U S E R ’ S M A N U A L
|
SEPTEMBER 2013
Table 9. Commodity Database Calibration Parameters
Parameter
What You Should Do
Name of Commodity
Enter the name of the commodity.
Add the formulation for medicines such as ARV where the same generic names may
come in different combinations. Also add the volume per individual package, for example:
600 mL bottle, 750 mL bottle, 100 tablets, etc.
Regardless of whether a commodity is generic or a brand name, all commodities a
country receives should be included. If there are several brands, each brand should
be entered separately. If there are different generics for a product type, each different
generic should be entered separately, as well. Determine whether a commodity should
have a separate entry requires considering how the commodities are managed at
the SDP. If the SDP manages both Depo-Provera and Noristerat, then both of these
injectables require a separate entry in the commodity database.
Procurement Agency
From the drop-down list, select the agency that procures the commodity.
If multiple agencies procure the same product, select the dummy facility that has been
created (see section 4.2)
Quantity Procured
Enter the annual quantity procured for the entire supply chain.
This is the annual quantity procured for a commodity by a particular agency. Enter the
unit by which the commodity is forecasted (i.e., one condom, one vial of antibiotic, one
bottle).
Landed Costs (USD)
Enter the total landed cost of the procurement.
Enter the total landed cost of the quantity.
If more than one agency procures the same drug, enter the weighted average of the
landed cost.
All prices should be consistent in terms of whether or not the entered price includes
cost, insurance, freight, or just the landed cost.This should be noted in the notes section
Unit Prices with Shipping
Do no enter any quantity. Calculated by the SCCT.
Shipping Volume per Box (m³)
Enter volume of the shipping box.This is the volume of the shipping box, which contains
multiple units. For volume, use cubic meters (m3).
Box Shipping Weight (kg)
Enter the weight of the shipping box.This is the weight of the shipping box, which
contains multiple units. For weight, use kilograms (kg).
Unit Volume (m³)
Do not enter any quantity. Calculated by the SCCT.
Unit Weight (kg)
Do not enter any quantity. Calculated by the SCCT.
Units per Shipped Box
Enter number of units contained in each shipping box.
SEPTEMBER 2013
|
S U P P LY C H A I N C O S T I N G T O O L : U S E R ’ S M A N U A L
|
27
Figure 12. Completed Commodities Worksheet
Tip
Do not type over
the grey cells in the
commodities tab.
3.6 Generating Sur veys
Once the user completes the steps under the Calibrate Tool tab, the SCCT is ready to generate data collection
surveys for each facility. The user has two choices for data collection:
• If data collectors take laptops with them to the field, they can directly enter the data into the electronic version
of each facility survey.
• Alternatively, the user can print the survey, have data collectors record the information on paper, and then
enter it into the electronic facility survey.
Creating the Survey Folder and Assigning the Directory Address
Before generating any surveys, the user must follow a few simple steps to create a survey folder and assign a
directory address.
Step 1: Create a separate folder on your computer that will contain only the surveys (see figure 13).
Figure 13. Obtaining the Directory Address from Windows Explorer
Separate folder
containing surveys
28
|
Directory
address
Supply Chain
Costing Tool
S U P P LY C H A I N C O S T I N G T O O L : U S E R ’ S M A N U A L
|
SEPTEMBER 2013
Step 2: On the Data Capture/Entry worksheet clicks on the blue folder button to assign the directory address
(i.e., where the survey folder is stored on the computer) See figure 14.
Figure 14. Inserting the Survey Directory Address
Figure 15. Pop-up Window to Select Location
of Survey Folder
A window will pop up (figure 15), allowing the user to
browse and select the destination of the newly created
survey folder.
When the survey folder is located, the user clicks on OK to
be automatically brought back to the Data Capture/Entry
worksheet; the directory address field is now populated
(figure 16).
To manually cut and paste the directory
address, the user takes the following steps:
Step 1: Create a separate folder on the
computer that will contain only the surveys
(see figure 16).
Figure 16. Creating Survey Workbooks for Each Facility
SEPTEMBER 2013
|
S U P P LY C H A I N C O S T I N G T O O L : U S E R ’ S M A N U A L
|
29
Step 2: Highlight and copy the directory address from the address bar in Windows Explorer (see figure 17).
Step 3: Paste the directory address of this folder into the Data Capture/Entry tab of the SCCT. The address
should be pasted in the green box to the right of blue button folder (see figure 17). Inputting this address tells the
tool where to store the created surveys.
Figure 17. Cutting and Pasting the Survey Folder Directory
Address
3.7 Generating, Printing, and Editing a Sur vey
After establishing the folder and directory address, the user can generate the surveys individually or all at once. To create all surveys at one time (figure 18):
Step 1: Click in the green box to the right of blue folder button. Figure 18. Creating All Surveys at Once
Step 2: Click on the grey Create All Surveys button in the blue menu. The menu is located on the right side of the
page.
30
|
S U P P LY C H A I N C O S T I N G T O O L : U S E R ’ S M A N U A L
|
SEPTEMBER 2013
The tool will generate an individual, blank survey for each facility listed in the Facility List in the survey folder
(generation of the surveys may take a few minutes).
Once the survey generation process finishes, the user should go into the survey folder to confirm that surveys for
each facility have been created. The folder should look similar to the example in figure 19.
Figure 19. Creating Survey Files for Each Facility
To create an individual survey:
Step 1: Click in the green box to the right of Facility Name.
Step 2: Select the desired facility from the drop-down menu.
Step 3: Click on the grey Create Survey button in the blue menu. The menu is located on the right side
of the page.
Step 4: Repeat steps 1–3 for each facility
The tool will generate an individual empty survey for the facility selected in the survey folder (generation of the
survey may take a minute). Once the process finishes, the user should go to the survey folder to confirm that a survey file has been created for the selected facility.
The Data Capture/Entry worksheet is completed when (figure 20)— 1. The user has created a Survey folder
and entered a directory address into the
SCCT.
Figure 20. Creating Survey Workbooks for Each Facility
2. The user has selected a facility from the
drop-down list to create an individual
survey.
3. Survey File Exists appears in the grey
box.
SEPTEMBER 2013
|
S U P P LY C H A I N C O S T I N G T O O L : U S E R ’ S M A N U A L
|
31
Printing
The user can print surveys from the blue menu—one at a time or all at
once—after surveys have been generated for each facility. The surveys are
preformatted for printing.
Editing
To edit an existing survey, the user clicks on the Edit Survey button from
the blue menu to open the desired survey. Alternatively, the user can open
the survey by going into the survey folder on the computer.
32
|
S U P P LY C H A I N C O S T I N G T O O L : U S E R ’ S M A N U A L
|
SEPTEMBER 2013
Tip
• If any adjustments are
made in the “Calibrate
Tool” sheets, all of the
surveys must be created again.
• Old surveys must be deleted
first or moved to another
folder.
4. Data Collection: Collecting Data
and Completing Sur veys
After setting up the tool, the user is ready to collect data and complete the surveys. This chapter describes what
facility data to collect and how to enter the data electronically. The chapter also discusses what to do when data
are not available in the form the SCCT requires. To help ensure data quality, the user must review this chapter in
detail with the data collectors. We also strongly recommend that each data collector carry a copy of this chapter
during their facility visits. Another useful resource to assist in data collection is the Costing Survey Job Aid,
which can be found at http://deliver.jsi.com/dlvr_content/resources/allpubs/guidelines/CostSurvJob.pdf.
4.1 Sur vey Management
Capturing and Entering Data into the Surveys
The user can capture data for the surveys in two ways:
1. Paper-and-pen data collection: The data collectors enter data on paper copies of the surveys during
interviews. Data is later entered into the electronic survey file (one per facility).
2. Date collectors enter data directly into the electronic survey file during an interview or visit to the health facility.
If the data collector brings a laptop to the field, we recommend option 2. Each survey includes space for notes along
the right side of each data entry field. Data collectors should enter all notes, assumptions, comments, and calculations
received from key informants directly into this notes section. In addition, any available electronic financial data
such as budgets or expenditure reports can be copied and pasted directly into the notes section of the survey or in
the SCCT (for more information on the importance of the notes section, please refer to section 4.2)
All non-green cells are locked to protect the programming integrity of the tool.
Organization and Storage of Surveys
All surveys are stored in an electronic folder that is separate from the tool file. An incomplete survey may have
partial, missing, or no data at all. This means that incomplete surveys will still be imported. However, surveys can
be re-imported once more data is available or if corrections are made. Furthermore, surveys can also be emailed to
the team leads for data checking and incorporation into the analysis once the surveys have been completed.
SEPTEMBER 2013
|
S U P P LY C H A I N C O S T I N G T O O L : U S E R ’ S M A N U A L
|
33
Orientation to Surveys
When the user generates a facility survey, a separate Excel workbook file containing 14 tabbed worksheets is
created (table 10).
Table 10. Survey Worksheets
Worksheet Name on Tab
Worksheet title
General1
General Facility Information and categorizations
Procurement1
Procurement Labor Salary Data
Storage1
Storage Labor and Space Salary Data
Storage2
Storage Equipment
Transport1
Transport Labor and Space
Transport2
Transport Maintenance, Equipment and Extra Pick-up Costs
Transport3
Vehicle Costs, Depreciation and Fuel
Transport4
Transport Routes, Distances, Frequency and Per diems
Management1
Management Labor Salary Data
Management2
Operating Costs and Miscellaneous
Commodity1
Commodities (throughput per year)
Commodity2
Commodities (throughput per year) continued
Commodity3
Commodities (throughput per year) continued
Commodity4
Commodities (throughput per year) continued
To access any of the worksheets, click on the tab at the bottom of the survey. An example of the worksheet tabs is
shown below (figure 21):
Figure 21. Worksheet Tabs for Each Facility Survey
34
|
S U P P LY C H A I N C O S T I N G T O O L : U S E R ’ S M A N U A L
|
SEPTEMBER 2013
4.2 Data Entr y Instructions
The following instructions are critical. Failure to follow them will result in surveys with data that cannot be
imported into the SCCT and cannot be used for costing analysis by the SCCT.
• Enter data only in the green cells (see figure 22).
Figure 22. Where to Enter Data in the Survey Worksheets
Tip
Follow the guidance in the
Costing Survey Job Aid as you are
entering the survey worksheets
• The user must not, under any circumstances delete cell, rows, or columns in any of the survey worksheets.
Reminders for Data Entry
• Do not copy and paste data between surveys or worksheets within surveys.
– Data should be manually typed or entered via the drop-down menu.
– “Paste, Paste Values,Values” can be used to copy data from another (non-costing tool) Excel document into the
survey. Formulas should not be copied into any of the survey cells.
• Do NOT delete any rows or columns in the surveys.
• Make sure the correct currency is selected in each survey worksheet where data has been entered or data may
not be calculated correctly. If not selected, U.S. dollars is automatically assumed.
• For the survey to import, numerical data (where appropriate) must be entered in either Storage1 or procurement
or Transport1 or Transport2.
• If a drop-down menu exists it will appear when clicking in the green cell in the survey or within the tool.
• Notes section: use this section in each survey worksheet to make calculations, document assumptions, or make
other comments regarding the data entered into the survey.
SEPTEMBER 2013
|
S U P P LY C H A I N C O S T I N G T O O L : U S E R ’ S M A N U A L
|
35
Using The Notes Cells
The Notes cells have special importance, and the user should encourage data collectors to take detailed notes.
The Notes cells are to the right of the survey questions and can accommodate either numerical or text input.
Although in green, this information is not imported for analysis. It is, however, critical that the information be
available for users to refer to when the data collection teams have disbanded. Examples of instances where notes
are useful are provided in table 11.
Table 11.When Notes Are Critical: Selected Examples
Example 1: Data Sources
Survey respondents may refer to existing documents or provide further documentation to the data collector. References to these
documents should be included in each worksheet’s Notes section of the facility survey where appropriate.
Example 2: Missing Data/Proxy Data
A facility may be unwilling or unable to provide financial or salary data to the data collector. In these situations, the alternative is to
choose a similar facility or similar staff person at another facility and use those costs as proxy data.When this occurs, the following
information should be noted in the Notes section:
•
which pieces of data were not provided by the facility
•
what proxy data was used
•
where the proxy data came from
Example 3: Accounting Information
Many facilities make their budget or expenditure information available electronically.These data can be copied and pasted into the Notes section of the survey for reference purposes and then entered into the appropriate place in the green cells (see figure 23).
36
|
S U P P LY C H A I N C O S T I N G T O O L : U S E R ’ S M A N U A L
|
SEPTEMBER 2013
Figure 23 shows how the Notes cells are used to document how data was adjusted. The operating cost data for the
facility that were available electronically were copied into the notes section of the survey in the cells to the right
of the data cells, the 10 months of data were adjusted to represent 12 months, and the attributable cost for 12
months was entered into the cell labeled Total annual costs if breakdown is unavailable.
• The user decided to allocate 1.00 percent of the facility’s relevant operating costs to the supply chain.
• The Total operating costs per year if breakdown is unavailable cell (see arrow) has been set to equal the final
cost on the right. Alternatively, the user could have scaled up each line item to 12 months, taken 1.00 percent
of the costs, and entered them directly into the Breakdown of Yearly Operating Costs table on the left.
Figure 23. Using the Notes Cells
SEPTEMBER 2013
|
S U P P LY C H A I N C O S T I N G T O O L : U S E R ’ S M A N U A L
|
37
Shared Costs
Depending upon the supply chain under consideration, some costs may be shared between functions and
facilities (see table 12).
Table 12. Shared Costs Examples
Example 1: Shared Labor Costs
Splitting management time: One person may participate in quantification activities but also spend some time supervising the logistics
management activities of commodity managers. In such cases, the time spent on each activity must be correctly recorded in the
appropriate section of the SCCT (i.e., allocated between the Management labor costs for quantification and Management labor costs
for quality assurance within the Management function).
Procurement vs. quantification: It is not uncommon to find that people who participate in procurement activities also participate
in the quantification process.Therefore, during the survey a respondent might say that he or she works 100 percent, or 40 hours
a week, on procurement. Later in the conversation, the data collectors may learn that the same person also participates for 5 days
in the quantification exercise every quarter.The data collector should take notes on these findings, separate out the time spent
on quantification, and remember to subtract that time from the 40 hours a week on procurement.Therefore, the time spent on
quantification would be entered in the Management1 tab and the time spent on procurement would be entered in the Procurement1
tab.
Example 2: Shared Equipment Costs
Large storage facilities may have several pieces of equipment whose value may be entered in the survey with a depreciation charge
determined by the SCCT. However, if the annual expenditure of the facility used to determine the facility’s operating costs under
management also contains an equipment or capital goods depreciation charge, it is necessary to remove that line item when
determining operating costs to avoid double counting the equipment charges.
Example 3: Shared Transportation Costs
Shared transportation costs arise when the costing study covers only one group of commodities—for example, FP commodities—
but the transportation system is integrated, delivering FP commodities in addition to essential medicines. The tool has a functionality
to allocate a proportion of transportation costs according to the volume the costed commodities occupied in the transportation
vehicles.
If the user wants to determine the costs of delivering contraceptives that are delivered on the same trucks as ARVs and antimalarials,
the tool will apportion the costs of transportation that can be attributed to the contraceptives. For example, if contraceptives
occupy 30 percent of the space on the trucks, 30 percent of the transportation costs would be allocated, since only contraceptives
are being costed. An optional function for this can be turned off and on in the General Info worksheet under Calibrate Tool (see
figure 24).
38
|
S U P P LY C H A I N C O S T I N G T O O L : U S E R ’ S M A N U A L
|
SEPTEMBER 2013
Figure 24. Shared Transportation Cost Feature
The user should, in the Notes cells, explain any adjustments and record estimated values based on the
information supplied during data collection and should describe clearly and in mathematical terms any
adjustments or conversions made.
Calculating Staff Time
4.3 Currency
During the survey, Evelyn says she spends 100% of her
time, or 40 hours a week, on procurement. However,
each quarter (which is equal to 12 weeks) she
participates for 5 days in the quantification exercise.
The SCCT is set up to perform all calculations and
present all results in U.S.$. However, the user may
enter cost data in the local currency. During the
calibration of the SCCT (section 3.4), the user can
provide exchange rates for other currencies. The user
can enter costs in the survey in any of the currencies
defined during calibration. Once the user chooses a
currency, all costs on the specific survey worksheet
must be entered in that currency. When moving to
the next worksheet, the user will be asked again what
currency he or she wishes to use. For example, the
user can enter data in U.S.$ for Transport1 costs
and in shillings for Transport2 costs.
How much time does Evelyn actually spend on
procurement each week?
Quantification time (QT):
QT = 5 days (40 hours) / (40 hours x 12 weeks)= .0833
QT = 0.833 * Weekly working hours (40 hours) = 3.3
hours (round to 3 hours)
Procurement time (PT)
PT= 40 hours (one week) – 3 hours (PT) = 37 hours
Evelyn actually only spends 37 hours a week on procurement.
Missing Data
Missing data is common for a variety of reasons. Facilities may be
small, one-room, one-worker sites lacking readily available financial
information. Nearby, larger facilities or the local health department
are often responsible for paying the salaries and costs incurred
by smaller sites. In addition, some facilities may refuse to share
financial information, despite official authorization.
SEPTEMBER 2013
|
Note:
Where proxy data have been
used, the data entry user must
note this in the “Notes” cells
of the facility’s survey file.
S U P P LY C H A I N C O S T I N G T O O L : U S E R ’ S M A N U A L
|
39
Using Proxy Data
To address these problems, the user can decide to use proxy data. That means substituting data from similar
facilities already in the sample or identifying similar facilities to add to the sample. Where proxy data have been
used, the data entry user should note this in the Notes cells of the facility’s survey file. The user performing the
costing analysis must pay particular attention to surveys that include proxy data on costs when performing the
data validation to ensure that the proxy data used are appropriate or that any reclassified facilities are not being
used as proxies for other facilities.
40
|
S U P P LY C H A I N C O S T I N G T O O L : U S E R ’ S M A N U A L
|
SEPTEMBER 2013
4.4 General1: General Information
The General Information worksheet is divided into different sections. The user should use the Notes cells to
document any explanations, comments, observations, or assumptions made regarding the data for a facility. Each
section should be filled out as shown in table 13.
Table 13. General Information, Basic Facility Information
Parameter
What You Should Do
ID#
This is found at the top of
the worksheet.
This identification number is assigned to the facility during the setup of the SCCT when
all the facility names are entered into the facility list and when the facility survey is
created (see section 3.4).
Q1
Name of facility
Automatically generated
Q2
Does this facility store any
quantity of the commodities
being costed in this analysis?
Enter Yes or No
Q3
Does this facility transport
any quantity of the
commodities being costed in
this analysis?
Enter Yes or No
“Yes” may be the appropriate response even if the facility does not own any vehicles or
does not officially do its own transportation. For example, the facility may occasionally
have to use public transportation to pick up goods.The user should collect data on
these costs.
Q4 –
Q4d
Does this facility provide any
management support to the
supply chain, such as:
Enter Yes or No
Quantification
if a regional health facility has staff who supervise lower-level health facilities or
perform other management related tasks; enter “yes” for quality assurance. Note: the
actual time spent on this function is entered under Management labor time for quality
assurance in the Management1 tab in this worksheet.
LMIS
QA
Training
Other
Enter “Yes” if the facility is supposed to stock items but is currently stocked out
If the response is “yes,” the user must enter commodity data in the commodity section
of the survey.
These activities refer to the management of the entire supply chain, including other
tiers. For example, enter “Yes” for the following situations:
if the health facility has a nurse-in-charge responsible for oversight and supervision of
managing commodities in the storeroom. Enter “Yes” for quality assurance. Note: the
actual time spent on this function is entered under Management labor time for quality
assurance in the Management1 tab in this worksheet.
if a regional medical store is responsible for collecting and aggregating logistics data into
the LMIS. Enter “yes” for LMIS.The actual time spent is entered under Management
labor for logistics information systems in Management1.
Enter management costs consistently to make sure management costs reflect the specific
management functions (i.e., quantification, LMIS, QA, training, other). For example, if
a nurse-in-charge is responsible for managing contraceptives in a storeroom and for
supervision of other staff, time in the storeroom should be entered in Storage1 and
supervision time should be entered in Management labor time for quality assurance in
Management1.This should be recorded the same way in each facility survey.
Supervision
Enter Yes or No
Quality assurance
Enter Yes or No
LMIS
Enter Yes or No
Training
Enter Yes or No
SEPTEMBER 2013
|
S U P P LY C H A I N C O S T I N G T O O L : U S E R ’ S M A N U A L
|
41
The General1 worksheet is shown in figure 25.
Figure 25. General 1 Worksheet
Defining Basic Facility Relationships
The user enters data on the structure of the supply chain in the Basic Facility Relationships component of the
General1 survey (see sections 2.1 and 3.4 on supply chain structure and describing the supply chain). Defining
facility relationships is important in determining the total delivered cost of getting a unit of a commodity to an
end user. Aggregated supply chain costs incurred at each facility at each tier for each supply function make up the
total delivered costs. This pathway is defined by the SCCT using the data inputs described in table 14 below.
Each facility in the supply chain can be classified in different ways. Each categorization should correspond to a
question that the study must address. For example, the user may want to compare supply chain costs of rural
versus urban facilities. The SCCT can present these aggregated costs for each category of facilities using the
data entered (table 14). The user must determine these category names and options and enter them during the
calibration of the SCCT (see section 3.4).
42
|
S U P P LY C H A I N C O S T I N G T O O L : U S E R ’ S M A N U A L
|
SEPTEMBER 2013
Table 14. General Information, Defining Facility Relationships
Question
Parameter
What You Should Do
Q5
Does this facility receive goods from any other facility
included in this analysis? (Even if you have to pick up
the commodities only sometimes)
Enter Yes or No
Q6
If yes, please indicate the name of the facility?
Select the facility from the drop-down menu.
The drop-down menu appears when clicking in this cell
and gives all the facilities previously entered in the Facility
List worksheet during the calibration process.
Facilities are limited to receiving goods from one other
facility.
Important Note: If the facility receives commodities from
more than one facility, use the dummy facility created in
the Facility List worksheet that represents these facilities
(see section 3.4).
Q7
Both the category name and the category options for
each of the following will have been determined during
the calibration process before any surveys are created.
Therefore, the following are only example categories.
Please categorize this facility via the following
categories:
(Examples of categories are provided below.)
For national partner facilities or those at tier 1, some
of the categories may not be relevant and can therefore
be left blank. For example, the CMS will not need to be
categorized as urban/rural or high/low density.
Q7a
Facility Type
Select answer from drop-down menu
Q7b
Region
Select answer from drop-down menu
Q7c
Urban_Rural
Select answer from drop-down menu
Q7d
High_Low_Pop_Density
Select answer from drop-down menu
Q7e
Accessibility
Select answer from drop-down menu
Q7f
How many facilities are supplied by this facility?
SEPTEMBER 2013
This helps determine the number of lower-level facilities
that are supplied by a facility. For example, a regional store
could be responsible for supplying a number of SDPs. Enter
the number of facilities that receive commodities from this
facility.This can be used for secondary analysis or left blank.
|
S U P P LY C H A I N C O S T I N G T O O L : U S E R ’ S M A N U A L
|
43
4.5 Procurement Costs (Procurement1 Worksheet)
This worksheet captures only all in-country costs associated with procurement, typically tier 1 facilities (i.e., by a
ministry of health or a development partner)(figure 26). Time spent on forecasting and quantifying commodities
at the central level is captured under management costs (see section 4.8).1 Other procurement costs include any
handling fees or charges, additional to the procurement price of the commodity, that are incurred in-country and
are associated with the commodities once they reach the port.
Figure 26. Procurement Survey
Procurement Labor Costs (Procurement1 Worksheet)
In this section the user identifies procurement activities and enters the job titles, years of experience, annual
salary, number of people in service, and hours worked per week. For the number of people in service, the user
enters the number of positions that perform procurement-related activities. For governments procuring their own
commodities, it is necessary to determine the amount of staff time spent on procurement activities (see examples
in table 15). The user should interview the government staff involved in the procurement process to obtain
information on the labor involved with procurement activities.
1 The costs associated with quantification are placed under management to reflect the fact that, typically, many partners participate in the quantification exercise but those
partners do not necessarily procure commodities.
44
|
S U P P LY C H A I N C O S T I N G T O O L : U S E R ’ S M A N U A L
|
SEPTEMBER 2013
Table 15. Procurement Facilities and Activities
Procurement Facilities
•
MOH procurement unit
•
Pharmaceutical/regulatory units
•
National tender boards
•
Bid review committees
•
Development partners
Procurement Activities
•
Preparing, issuing bids/tenders for commodity contracts
•
Reviewing bids/tenders
Procurement Staff
•
MOH coordinators for FP, HIV or primary care programs
•
Staff of development partners that fund commodities
The user should also include any time and effort spent by bid review committees. Bid review committees are
frequently required when tender amounts exceed a certain threshold. Any staff time spent on these activities
should be entered as labor costs. If these committees meet offsite, the user must enter meeting expenses, travel,
and per diem costs as a lump sum under Management miscellaneous in the Management2 worksheet; these must
be given clear labels such as “tender review board” (see section 4.8). Time to fill out requisition and issues forms,
bin cards, etc. should be entered in STORAGE costs.
Procurement Miscellaneous Fees and Charges
The process of importing, clearing, and delivering commodities to a country is likely to incur several types of fees.
It is important that all of these costs be included as part of the costing exercise.
Key informant interviews with procurement officers should ascertain which fees are applicable and how these fees
are calculated. The SCCT requires only the total annual expenditure for each line item. A dummy facility can be
created to aggregate all fees if needed (see Creating Dummy Supply Chain Facilities in section 3.5). A review of any
relevant documentation would be beneficial, and it is important to note in the Notes cells where such
documentation is not available because fees can make up a substantial proportion of procurement costs. These
fees should be entered into the procurement worksheet of the facility’s survey (figure 27).
Figure 27. Procurement Survey Showing Where to Enter
Procurement Costs
SEPTEMBER 2013
|
S U P P LY C H A I N C O S T I N G T O O L : U S E R ’ S M A N U A L
|
45
Examples of potential fees and charges include—
•
•
•
•
•
clearing agent fees
customs clearance fees
commodity tax/duty
insurance
inspection fees at port of origin.
These fees should be entered in one of the four categories shown in figure 27. Import fees as well as insurance
and freight charges are sometimes charged separately, or they could be part of the landed cost of a commodity. To
avoid duplicate reporting, the landed cost of commodity should be entered in the Commodities worksheet under
Calibration Tool when the tool is being set up.
4.6 Storage Costs
Commodities can be stored at several points along the supply chain. Typically, the first point of storage (once
the commodity leaves the port of entry) is a CMS (classified as tier 1). From the CMS, the commodities would
be transported to a regional or district warehouse (classified as tier 2) and then to a health facility (classified as
tier 3). However, this typical pathway could vary substantially between supply chains. For example, a vertical
supply chain may exclude an intermediate tier. Comparing the cost of delivering a good with and without the
intermediate tier may be an important objective of the analysis. It is important to determine the number of tiers
at which a commodity will be stored during the calibration of the tool. There are two worksheets for surveying
storage costs which are described below.
Storage Labor Costs (Storage1 worksheet)
Table 16 provides examples of the different storage tasks. Storage labor costs (figure 28) include time spent by
staff on—
• commodity storage tasks such as
recordkeeping and completing logistics
forms (completing order forms, bin
cards, receipt vouchers)
• conducting physical inventory
• ensuring that the storage areas are in
order.
If a costing exercise only looks at a set of
commodities, such as contraceptives within
an integrated system, then the interviewer
needs to determine the proportion of time
spent only on contraceptives (see table 12).
46
|
Is It a Storage Function or a Management Function?
Example: A pharmacist at an urban clinic is responsible
for completing the request and requisition voucher form,
completing stores ledger and bin cards, verifying the receipt
voucher, conducting physical inventory, keeping track of expired
commodities, and ensuring that the stores are organized.
This time is considered to be a storage function.
Example: The QA manager sits at the CMS. He oversees QA for
the entire country.
This is considered to be a management function because the individual
is working to supervise several facilities.
Example: For a very large program with data-intensive
recordkeeping, there may be a dedicated LMIS clerk or LMIS unit.
This time should be captured under management, because the position
is solely dedicated to managing data. Additionally, LMIS costs can be
easily separated out during the analysis and reporting process.
S U P P LY C H A I N C O S T I N G T O O L : U S E R ’ S M A N U A L
|
SEPTEMBER 2013
Figure 28. Completing Labor Costs
When LMIS and QA activities are carried out by the same person managing the commodities, it should be
recorded as part of management costs and not storage costs. LMIS and QA activities are related to the oversight
of a group of facilities or of the country as a whole. Sometimes there may be a single quality assurance person at
a very large site (CMS) that oversees several facilities for all QA activities in-country. The labor for this individual
or team would be entered under Management Labor Costs for Quality Assurance in the Management1 tab for
that facility’s survey. This categorization is also appropriate for LMIS activities, if the person conducting LMIS is
actually overseeing/conducting LMIS activities for several facilities—for example, all the facilities in one region.
See Labor Costs for Management Functions in section 4.8 for capturing these costs.
The SCCT is flexible about how to categorize these costs. The key factor is consistency; the costs must be
categorized the same way across all facilities.
SEPTEMBER 2013
|
S U P P LY C H A I N C O S T I N G T O O L : U S E R ’ S M A N U A L
|
47
Table 16. Storage Function–Related Tasks
Logistics Management by Health Facility Staff
•
Stockkeeping, recording, reporting, warehousing
•
Filling out bin or inventory cards
•
Conducting physical inventory
•
Completing stores ledgers
•
Assessing stock status
•
Taking in or distributing commodities
•
Transaction activities using packing slips, receiving records, issues vouchers, requisition and issues vouchers
•
Recording consumptions using daily activity registers, ledgers
•
Summary reporting: monthly or quarterly reports, feedback reports
Warehouse Staff at Central, Regional, or District Medical Stores
• Transaction activities using packing slips, receiving records, issues vouchers, requisition and issues vouchers
• Filling out bin or inventory cards
• Conducting physical inventory
• Completing stores ledgers
• Assessing stock status
• Putting away
• Picking and packing
• Staging
• Shipping
Storage Space Costs (Storage1 worksheet)
The space where the commodities are kept is a cost. To determine the space costs for a commodity or a set of
commodities, the user must enter several data points in the Storage1 worksheet (figure 29, table 17).
Whether the space is owned or purchased, these data points include—
• cost of the building or space where commodities are stored
• value per square meter of the building
• straight-line depreciation (SLD) rate of the building (see section 2.2 for more on how to calculate depreciation
rate).
If the space is rented, the data points include—
• rent per (m2)
• total storage area in (m2)
48
|
S U P P LY C H A I N C O S T I N G T O O L : U S E R ’ S M A N U A L
|
SEPTEMBER 2013
Table 17 describes the questions in the Storage1 worksheet of a survey.
Table 17. Data Needed To Estimate Storage Space Costs
Question
Parameter
What You Need to Do
Q13
Do you currently rent space or did you
buy it?
Choose either “rent” or “purchased” from drop-down menu.
The user must choose either “rent” or “purchased.”
“Purchased” is the default value. If “purchased” is chosen, the user must
answer the next question on depreciation.
Q14
If purchased: How many years for SLD?
Enter numerical response
The user must determine the useful (depreciated) life of owned space
used by the government to account for its capital used within the country
by the government. See also guidelines for depreciation rate in section 2.2.
Q15
Enter total cost of storage space
If “purchased” is chosen:
Total cost of purchased storage space
OR
Q16
If “rent” it chosen:
Enter cost of monthly rent
Total cost of monthly rent
Total facility storage area (m2)
Enter numerical response
The user must determine the total storage area by measuring the space
used by the commodities that are being costed
Q17
Official building cost per m2
Enter numerical response
The user must enter the cost of the building/storage space based on
information provided by the government or other source
Figure 29 shows a survey with storage data filled in. Both Q16 and Q17 must have data in order for the storage
space cost to be calculated if “Purchased” is chosen.
Measuring and Calculating the Cost
of Storage Space
Figure 29. Storage Space Costs
Storage space is measured in square meters.
For smaller facilities, the interviewer must
measure the space with a tape measure;
larger facilities such as a CMS may already
have this information available. However,
the data collector is advised to measure
all storage space. For commodities that require a cold chain, the equipment or cold room may be in a different
location or area, so the data collector should also measure that space.
SEPTEMBER 2013
|
S U P P LY C H A I N C O S T I N G T O O L : U S E R ’ S M A N U A L
|
49
Commodities That Share Storage Space
To calculate the storage cost for one type of commodity that shares storage space with other commodities, a data
collector may need to estimate the percentage of the space utilized by the single commodity. For example, ARVs
may be stored with other essential medicines, but the costing exercise may only be costing the ARV supply chain.
Therefore, only the space occupied by the commodities being costed should be entered into the SCCT. It may
be useful to also collect the total size of the storage room for later use; if desired, this value can be stored in the
Notes cells, but it is not required for the costing analysis.
Storage Equipment Costs (Storage2 worksheet)
This section of the costing tool determines the costs of equipment used for the storage and warehousing of
commodities.
Larger warehouses have equipment (e.g., forklifts, refrigerators) to store and move commodities. Such equipment
falls under the category of capital costs and must be included in the costing exercise. Smaller health facilities are
unlikely to have such equipment or, if they do, the costs may be negligible. For example, at small facilities such
as health posts, all commodities may be carried by hand and stored in cupboards rather than a dedicated storage
room. Additionally, the equipment at either large warehouses or small facilities may be very old and unusable.
The data collectors should ask the staff if the equipment is used and if they know how old it is. The equipment
should be recorded and the condition should be noted. It is necessary for the costing team to determine what
criteria to use to assign a depreciation cost to the equipment. Whatever decision is made should be entered into
the Notes cells of the Storage2 worksheet to document any decisions and assumptions made.
Allocating Equipment Costs by Supply Chain
The user should keep in mind that in an integrated supply chain the storage equipment will be shared among
other commodities. If it is possible to cost out equipment specific to a commodity, the user should include that cost
in the Storage1 survey. However, in some cases the costs will be subsumed in the operating costs for the entire
facility because the equipment is utilized by the facility for other supply chain activities.
If this is the case, the total operating costs for the facility are multiplied by the proportion of space that the
commodity occupies in that facility so that not all the annual depreciation would be charged to that particular
commodity’s supply chain
and that cost would not
Figure 30. Allocating Equipment Costs
be unaccounted for (see
Management Costs in section
Formula for Allocating Equipment Costs
2.2). The storage area available
• Total storage space = 100m2
and the storage area occupied
2
• Space of commodity = 15m
by the commodities included
• Proportion of commodity space = 15%
in the costing analysis have
• Total equipment costs of facility x proportion of space commodity occupies in facility
to be measured by the data
$500 x 15%
collectors, and only the
= Equipment costs for commodities of interest
relevant proportion of the
=$75
annual depreciation charge
Total operating costs of facility x proportion of space commodity occupies in facility
should be used (figure 30).
$1000 x 15%
= Operating costs for commodities of interest
= $150
50
|
S U P P LY C H A I N C O S T I N G T O O L : U S E R ’ S M A N U A L
|
SEPTEMBER 2013
Determining Storage Costs Within a Tier
The user should treat storage costs consistently, especially within a particular tier. For example, if comparing
storage costs within a tier is an objective of the costing exercise, the user should ensure that equipment costs are
specifically stated in the storage section. The user must also keep in mind the proportion of equipment costs
to be assigned to the supply chain being costed. This situation can arise when hospital equipment costs and its
annual depreciation have been estimated in an annual report but only a proportion of that cost is being assigned
to the storage supply chain costs. In such cases, it is appropriate to copy the operating cost source data into the
Notes cells of the management section of the survey. This allows the user to clarify that an appropriate fraction
of the costs is applied under the storage section of the survey and that the rest of the cost is not included under
operating costs.
Threshold for Including Low-Cost Equipment
Some equipment such as computers, air conditioning units, or even the construction of the facility itself may
have been provided by development partners.
These costs also need to be quantified and entered into the SCCT if possible. These costs can be very low for the
following reasons:
• The purchase costs themselves are relatively small (<U.S.$1,000).
• The implied depreciated value is low.
• The piece of equipment is used in an integrated supply chain and only a subset of commodities are being
costed out. In this situation the final costs may be relatively small and contribute little to the analysis when
compared to the effort that may be required to obtain all the necessary data.
4.7 Transpor tation Costs
There are four transportation worksheets:
•
•
•
•
Transportation labor and garage space costs
Transportation maintenance equipment, and distribution (pick up/drop off)
Vehicle and fuel costs
Delivery route and per diem costs.
Transportation Labor and Garage Costs (Transport1 Worksheet)
Labor costs for drivers and other related transportation labor costs need to be collected for the Transport1
worksheet (figure 31).Examples of transport labor tasks are shown in table 18.
Table 18. Transport1 Worksheet, Transport Labor Cost
• Driver’s time driving and loading/unloading vehicles
• Recording issues at facilities (if this is part of the job duties)
• Time spent maintaining vehicles, if performed in the facility
• Time spent developing Transport plans and schedules
If any health facility staff need to leave their facility and go pick up commodities from a storage facility, their time
SEPTEMBER 2013
|
S U P P LY C H A I N C O S T I N G T O O L : U S E R ’ S M A N U A L
|
51
can be entered here. Enter their job title (years of working experience) here and other information required in the
other fields. Enter detailed information in the notes section. For example, “Nurse goes to pick up contraceptives
at storage facility “X” using public transportation, on a regular basis (or emergency orders) “x” times a year”.
Figure 31. Transportation Labor Costs (Transport1 worskheet)
At the bottom of the Transport1 survey
worksheet are some questions regarding
garage space (see figure 32). Use table 19 as
a guide to answer the questions.
Table 19.Transport1 Worksheet, Garage Space Costs
Question
Parameter
What You Need to Do
Q22
Do you currently rent space or did you buy
it?
Select answer from drop-down menu.
The user must choose either “purchased” or “rent.” “Purchased” is
the default value. If “purchased,” the user must answer the following
question on depreciation.
Q23
If purchased: How many years for SLD?
Enter years for SLD.
The user must determine the useful (depreciated) life of purchased
space by using the guidelines for depreciation rate in section 2.2..
Q24
If “purchased” is chosen:
Enter total purchased garage space.
Total cost of purchased garage space
OR
Q25
If “rent” it chosen:
Enter monthly rent.
Total cost of monthly rent
Total garage area (m2)
Enter total garage area in square meters.
The user must determine the total area used for garage
space by measuring the square footage of the garage.
Q26
Official garage cost per m2
Enter garage cost per square meter.
The user must enter the cost of the building/garage space based on
information provided by the government.
52
|
S U P P LY C H A I N C O S T I N G T O O L : U S E R ’ S M A N U A L
|
SEPTEMBER 2013
If “Purchased” is chosen, Q25 and Q26 must have data entered for garage space cost to be correctly calculated.
Figure 32. Garage Space Costs
Maintenance Equipment and Distribution Costs (Transport2 Worksheet)
Transportation maintenance and equipment costs are entered in Transportation Worksheet 2 (figure 33). Use table
20 below as a guide to enter maintenance costs. Examples of maintenance costs include—
• annual vehicle servicing or maintenance costs
• vehicle running costs (e.g., engine oil and other fluids, spare parts)
• vehicle insurance.
Table 20.Transport2 Worksheet, Parts I and II: Maintenance and Equipment Costs
Question
Part I: Maintenance Costs
Q29
Type of Costs
Number
Purchase Price
Accounting Life (yrs)
Enter each type of cost
pertaining to transport
maintenance in a separate
line of the tool.
Enter number
associated with
maintenance.
Enter total purchase
price for this
type of transport
maintenance.
Enter 1
Example:Vehicle servicing,
tires, oil change, shock
absorbers, insurance,
maintenance service cost
from third party.
Example: Number of
times all vehicles are
serviced in a year.
Example: Total price
to service all vehicles
in one year. Or if
preferred, enter
maintenance costs
per vehicle
Entering 1 ensures that no
adjustment for depreciation
is made on the maintenance
line items. Otherwise, enter an
appropriate depreciation figure.
Part II: Equipment Costs
Type of Costs
Number
Purchase Price
Accounting Life (yrs)
Enter each type of cost
pertaining to transport
equipment in a separate
line of the tool.
Enter number
associated with
equipment.
Enter total purchase
price for this type of
transport equipment.
Enter numerical response.
SEPTEMBER 2013
|
The user must determine
the useful (depreciated) life
of owned space by using the
guidelines for depreciation rate
in section 2.2..
S U P P LY C H A I N C O S T I N G T O O L : U S E R ’ S M A N U A L
|
53
Figure 33. Transport2 Worksheet
Picking Up or Dropping Off Commodities
Many health facilities or medical stores have to pick up their commodities from another facility and/or distribute
to other facilities even if official policies state that commodity distribution be done by another tier or facility.
Commodity pickup/drop-off costs must be captured for facilities performing these functions, regardless of
whether the facility is officially mandated to do so. Facility costs for commodity pickup/drop-off includes public
transportation, private vehicles, or other modes of transport.
The frequency and cost per pickup or drop-off can be entered in the Transport2 worksheet (table 21). The user
should add any documentation to the Notes cells.
Table 21.Transport2 Worksheet, Costs for Facility Pickup/Drop-off
Question
Parameter
What You Need to Do
Q30
How many times during the year did you
have to pick up commodities from or
deliver commodities to a storage facility?
Enter number of times commodities picked up/ dropped off during
year, including all emergency orders or regular orders paid for by this
facility.
Q31
Provide the amount charged to your facility
per pick up or delivery (per trip)
Enter amount charged per pickup or drop-off.
Example: If pick-up is made by a shipping company, enter amount paid
to company. If pick-up is made by staff car, estimate cost to pick up.
54
|
Q32
How many times during the year did you
use public transportation (taxis; buses; vans;
trains; etc.) to pick up commodities from or
deliver commodities to another a storage
facility
Enter number of times public transportation was used to pick up or
drop off commodities during the year.
Q33
Provide the cost using public transport per
pickup or delivery (per trip)
Enter public transport costs for each pickup or delivery cost.
S U P P LY C H A I N C O S T I N G T O O L : U S E R ’ S M A N U A L
|
SEPTEMBER 2013
The example below illustrates the costs a facility accrued in the past year for picking up and dropping off
commodities (figure 34).
Figure 34. Completed Transport Costs for Pickup or Drop-off
Vehicle and Fuel Costs (Transport3 Worksheet)
This worksheet captures costs related to the number, cost, and age of a facility’s vehicles. A standard depreciation
rate for vehicles is required to determine the annual depreciation charge or annual cost of the vehicles. In
standard accounting practice, this rate is usually four or five years at most (figure 35).
Figure 35. Transport3 Worksheet
The SCCT uses data entered in the transport3 worksheet (table 22) to calculate the total volume that can be
carried according to the trucks’ capacity and the routes scheduled. If the transport adjustment option is used, Vehicle
type and Maximum cargo volume (m3) capacity must be filled in. See section 3.4 for instructions on utilizing this
measure to determine the capacity used by specific commodities of an integrated system.
SEPTEMBER 2013
|
S U P P LY C H A I N C O S T I N G T O O L : U S E R ’ S M A N U A L
|
55
Table 22.Transport3 Worksheet, Part I:Vehicle Costs
Question
Vehicle type
Quantity
Purchase Price
Accounting Life
(yrs)
Maximum Cargo
Capacity - Volume
Carried
Q35
Enter description
of each vehicle
type. Each
description should
be entered in a
separate line of the
tool.
Enter quantity
of each vehicle
type.
Enter purchase
price
Enter years of
accounting life.
Use standard
accounting
practices (e.g., 4
or 5)
Enter maximum volume
this vehicle can carry.
Numerical
response should be in
cubic meters (m3).
Include all modes
of commodity
pickup/drop-off
(i.e., bicycles,
motorcycles,
private, commercial
transport)
The vehicle
manufacturer’s manual
should have the vehicle’s
cargo capacity.
This must be filled
in if the transport
adjustment option is
being used.
Each vehicle
entered will
be used in the
Transport 4
worksheet
This must be filled
in if the transport
adjustment option
is being used
Example: 10-ton
Toyota
Example:2
Example: 35,000
Example:5
Example: 40
The final part of this sheet is for entering fuel costs per kilometer (figure 36). This figure is used by the SCCT,
along with the frequency and distance of each transportation route, to determine the total cost of fuel for a year.
If the price of fuel fluctuates during the year, we recommend taking an average and entering it into the survey.
Figure 36. Fuel Costs in Transport3 Tab
56
|
S U P P LY C H A I N C O S T I N G T O O L : U S E R ’ S M A N U A L
|
SEPTEMBER 2013
Route and Per Diems (Transportation4 Worksheet)
The data required to populate the Transport4 worksheet on routes and per diems can be found in the
transportation schedule at a CMS, for example, or through interviews with the finance office at a CMS or an
implementing partner (table 23).
Table 23.Transport3 Worksheet, Routes and Per Diems
Question
Route
Distance (km) per
Round Trip
Number of Trips
per Year
Per Diem per Trip
Vehicle Type Used
Q38
Enter name of
route. The route
name may be
predetermined; a
list of routes with
names should be
available from a
transportation
manager.
Enter the total
round trip
distance in
kilometers. This is
the total distance
to complete the
named route.
Enter number of
times in a year
this route is
driven.
Enter the total cost of
the per diem allocated
for each trip, not the
number of per diems.
Select vehicle type
from the drop
down list.
This must be filled
in if the transport
adjustment option
is being used
It may be necessary to
calculate per diems per
trip if they not readily
available.
For total distance,
enter an annual
amount. Enter 1 in
the next column,
Number of trips
per year (figure
37).
Calculate per diems
using the following
parameters:
•
Number of days
each staff member
spends with the
truck for which they
are eligible for per
diem.
•
An annual amount
can be entered for
per diem. Enter 1 in
the Number of trips
per year column
(figure 37)
•
If no per diem is
provided, enter 0
•
Make a note of these
calculations in the
Notes section of the
survey.
The vehicle must
be listed on the
Vehicle Type in
the Transport3
worksheet.
This must be filled
in if the transport
adjustment option
is being used
This information provides the final parameters that the SCCT needs to calculate transport costs. Each route
needs to be described by name, distance, frequency, and total per diem costs per trip. Typically, distance, number
of days required, and frequency for each route are available from a transportation manager. The per diem is the
total amount provided to the staff during a delivery. For example, a corresponding amount of per diem may
be attached to Route A, since a route may have a specific number of days in which it will be completed. In this
example, the per diem for this route is U.S.$120 (figure 37). However, if there is more than one driver, the figure
entered in the per diems per trip cell needs to be adjusted to account for two people receiving per diem during
each delivery. The user may have to calculate an estimated per diem per trip before entering data. The Notes cells
should be used to document calculations, explanations, and assumptions used.
SEPTEMBER 2013
|
S U P P LY C H A I N C O S T I N G T O O L : U S E R ’ S M A N U A L
|
57
Figure 37. Route Information
Apportioning Transport Costs
Transportation and distribution of commodities begins at the central level. This is typically the CMS, the
largest facility in the supply chain and the one that is responsible for storing and distributing several types
of commodities. We propose that the entire transportation function for a CMS or regional facility be costed
and that the costs for a particular commodity group be apportioned by volume transported, if necessary. This
apportionment depends on the assumptions that all the trucks delivering commodities leave the warehouse fully
loaded and that the commodities in the supply chain being costed amount to a proportion of the total volume
being delivered.
An option in the SCCT permits the user to allocate a proportion of transportation costs according to the volume
that the costed commodities occupy in the transportation vehicles. In other words, if the user wants to determine
the costs of delivering ARVs that are delivered on the same trucks as condoms and antimalarials, the tool will
apportion the costs of transportation that can be attributed to the ARVs. For example, if ARVs occupy 30 percent
of the truck’s space, then 30 percent of the transportation costs would be allocated since only ARVs are being
costed. This feature can be activated in the customization stage of the tool under Calibration, General Info (figure
38).
Figure 38. Adjusting Transportation Costs from Calibration,
General Info Section of Tool
If the transport adjustment feature is being
used, values for Vehicle type and Maximum
cargo volume (m3) capacity must be added
in Transport3, and in Transport4 the
Number of trips per year cell must have data
entered in it and the vehicle type must be
selected in the Vehicle Type Used cell.
4.8 Management Costs
There are two worksheets for supply chain management costs: Management Labor Costs: Management1 and
Management Operating Costs: Management2. The SCCT treats management as a separate function because
managing a supply chain is a substantial and important task and one with significant cost implications.
58
|
S U P P LY C H A I N C O S T I N G T O O L : U S E R ’ S M A N U A L
|
SEPTEMBER 2013
Labor Costs for Management Functions (Management1 Worksheet)
Table 24 shows the various management labor inputs and how
to enter data for each. It is important to recall that different
management functions can be carried out by a person who is
also carrying out other specific supply chain functions (i.e.,
storage, procurement). Therefore, the user must ensure that
the person’s management time is separated out and included
in this section. To avoid double-counting, the user must also
remove that time from any other section (see Storage Labor
Costs in section 4.6). Costs are categorized according to—
When Is It a Management Function?
Example: The District Health Officer (DHO)
collects order requests and reviews them
for accuracy from several lower-level health
facilities.
This is considered to be a QA aspect of
management function because the individual
is working to supervise several health facilities
overall.
However, if this same DHO spends time
managing commodities at their own district
store, then count this time under storage in
the Storage1 worksheet.
• Management labor for quantification
• Management labor for LMIS (i.e., a LMIS manager or
equivalent or for supervising data entry clerks who enter
data into an LMIS )
• Management Labor for QA (i.e., staff who conduct
monitoring and evaluation supervision visits to the lower levels to ensure that the supply chain is operating
correctly. These staff provide feedback to health facility staff to complete logistics forms and storing
commodities according to SOPs.)
• Management labor for logistics training
• Management labor (other).
Table 24. Management Labor Costs
Question
Labor type
Salary
Q40
Management labor costs for quantification
Enter the title of the position
associated with quantification.
If this facility does
procurement, the same
person/persons are likely to
participate in quantification
activities. If so, ensure that
that person’s labor costs are
divided among procurement
in the Procurement1
worksheet and not ignored
or double-counted.
Q41
Enter annual salary of
person working on
quantification.
Number of People
Hours worked per week per
person
Enter number of
people performing
quantification.
Enter number of hours
worked per week per person.
However many hours are
devoted to quantification
should be converted to
hours per week per person.
Management labor costs for logistics information systems
Enter the title of the position
for those performing logistics
information systems–related
tasks.
Enter annual salary of
person working on
logistics information
systems task.
Examples: Monitoring a LMIS,
data entry, or producing
reports for several facilities
or for the entire LMIS.
SEPTEMBER 2013
|
Enter number of
people performing
logistics information
systems task.
Enter number of hours
worked per week per
person. However many hours
are devoted to logistics
information systems should
be converted to hours per
week per person.
S U P P LY C H A I N C O S T I N G T O O L : U S E R ’ S M A N U A L
|
59
Question
Labor type
Q42
Management Labor Costs for Quality Assurance
Enter title of position
associated with quality
assurance.
This person is a supervisor
who oversees supply chain
activities for several facilities
or the entire supply chain.
Q43
Salary
Enter annual salary of
person working on
this quality assurance
task.
Enter annual salary of
person working on
supply chain training.
Note that additional costs
associated with trainings
including meeting rooms,
materials, per diem,
transportation, etc. should be
entered under management
miscellaneous costs in the
Management2 worksheet.
This should include any
management labor costs
that do not fit in the above
categories.
|
Enter number of
people performing
this quality assurance
task.
Enter number of hours
worked per week per person.
However many hours are
devoted to quality assurance
should be converted to
hours per week per person.
Enter number of
people performing
this supply chain
training task.
Enter number of hours
worked per week per person.
However many hours are
devoted to supply chain
training should be converted
to hours per week per
person.
Enter number of
people associated
with this type of
other management
labor.
Enter number of hours
worked per week per person.
However many hours are
devoted to this labor type
should be converted to
hours per week per person.
Management Labor Costs (Other)
Enter title of position
associated with other
management labor.
60
Hours Worked per Week per
Person
Management Labor Costs for Logistics Training
Enter title of position for
staff person providing training
on the supply chain.
Q44
Number of People
Enter annual salary of
person working on
other management
labor tasks.
S U P P LY C H A I N C O S T I N G T O O L : U S E R ’ S M A N U A L
|
SEPTEMBER 2013
The example below shows sample management costs for a facility (figure 39).
Figure 39. Illustrative Management Costs
Operating Costs (Management2 Worksheet)
Every facility incurs some standard operating costs (table 25). The user can
enter these into the SCCT by line item or by entering one amount into the
Breakdown of Yearly Operating Costs box. Table 25 lists common operating
cost line items that should be requested if the facility does not have any
compiled expenditure reports available.
SEPTEMBER 2013
|
Tip
Enter operating
costs only in one
place. Either as a
total amount or by line item.
S U P P LY C H A I N C O S T I N G T O O L : U S E R ’ S M A N U A L
|
61
Table 25. Management2 Worksheet, Management Operating Costs
Q46 Total operating costs per year
Enter total annual operating costs. Information should
be entered into this box only if a cost breakdown is
unavailable.
OR
Breakdown of Yearly Operating Costs
Operating Cost Category
Utilities
Enter cost
Security
Enter cost
Communications
Enter cost
Printing
Enter cost
Supplies
Enter cost
Maintenance
Enter cost
Other (Can be user defined) User can overwrite “other” in the table.
Enter cost
Other (Can be user defined) User can overwrite “other” in the table.
Enter cost
An example of operating costs entered into the management worksheet of the survey (figure 40).
Figure 40. Illustrative Operating Costs
62
|
S U P P LY C H A I N C O S T I N G T O O L : U S E R ’ S M A N U A L
|
SEPTEMBER 2013
In addition, this survey worksheet includes a section where the user can enter miscellaneous management costs,
such as—
• supplies, room rental, per diem, and food costs required for training
• expenses for evaluating procurement proposals
• LMIS software or computer equipment.
The user can overwrite the word “other” in the survey (figure 41).
Figure 41. Miscellaneous Management Costs
Where to Find Operating Costs
Operating costs for health facilities can be obtained from monthly income and expenditure reports if these are
available at the health facility level. These reports contain operating expenses such as—
•
•
•
•
•
administrative staffing (which the SCCT refers to as overhead labor) outside of management labor costs
stationary
utilities
fuel
maintenance.
Although this report may be made available, it is still important for the user to spend time at the facility
reviewing the report and asking questions to clarify budget line items that may not be familiar and the costs that
comprise these line items. Additionally, it is also important that the user disregard expenses that would not fall
under daily operating costs and should therefore not be included in the costing tool.
For example, some reports may include housing allowances, short-term contracts for staff, specific clinical
programs (e.g., labor and delivery), or expenses associated with nonroutine meetings that would be counted as
part of regular operating costs. These expenses should not be included in the supply chain costing operating costs.
If annual operating expenses are not available at the health facility level, the next level up (such as a district or
regional health office) may have records, as the lower-level facilities may be required to send these reports in on a
regular basis.
SEPTEMBER 2013
|
S U P P LY C H A I N C O S T I N G T O O L : U S E R ’ S M A N U A L
|
63
Private organizations may not be willing to provide copies of annual operating expenses. In this case the
interviewer could ask for general estimates of the basic operating cost categories shown in table 25.
Once the relevant line items for the annual operating costs have been identified, the user should enter the data
into the notes section of the survey to be able to manipulate the data as necessary.
Calculating Operating Costs From Less Than One Year of Data
Figure 42 illustrates a situation in which the user was only able to obtain operating costs for 10 months and had
to scale up these costs to 12 months.
As shown in figure 42, the user copied the cost data that were available electronically into the Notes cells to the
right of the data cells. The user adjusted the 10 months of data to represent 12 months, and the attributable cost
for 12 months was entered in the “total operating costs per year if breakdown is unavailable” (green data cell).
• The user allocated 1.00 percent of the facility’s relevant operating costs to the supply chain.
• The Total operating costs per year if breakdown is unavailable cell (see arrow) was set to equal the final cost on
the right. Alternatively, the user could have scaled up each line item to 12 months, taken 1.00 percent of the
costs, and entered this into the Breakdown of Yearly Operating Costs table on the left.
Figure 42. Calculating Operating Costs from Less Than One Year of Data
Allocating Joint Operating Costs When a Facility Handles Multiple Commodities
Prior to collecting data, the user should determine, with the team and country counterparts, the percentage
of each facility’s operating costs to allocate to the supply chain. For facilities that only perform supply chain
activities (e.g., Central Medical Stores), the user may allocate 100 percent of the operating costs. For facilities that
perform several other functions (e.g., a hospital or health clinic) and that store a number of different commodity
types (e.g., ARVs, test kits, antimalarials, contraceptives), operating costs should be apportioned based on one of
the following:
64
|
S U P P LY C H A I N C O S T I N G T O O L : U S E R ’ S M A N U A L
|
SEPTEMBER 2013
• The percentage value of the commodities being costed as a percentage of the value of all the commodities
handled by the facility.
• The percentage by volume of the commodities that are handled by the facility. For example, if the facility is a
warehouse and 50 percent of the space is occupied by the commodities in the supply chain being costed, the
user would allocate 50 percent of the facility’s operating costs to the supply chain costing.
Whichever method is used, the user should remain consistent between facilities.
4.9 Commodity Throughput
(Commodity1, Commodity2, Commodity3,
Commodity4 Worksheets)
The Commodity Throughput worksheets capture the total number of units received plus units shipped, divided
by two. This is essentially the average number of units that went through a facility in a one-year period. The
commodity names can be selected by using the drop-down menu based on the information entered during setup
of the SCCT. Only a total of 200 commodities can be entered in the commodity worksheets, though there may
be up to 400 to select from. (see Management Operating Costs in section 2.2)
The user needs to enter throughput data in the most recent
year for which complete data are available. These data are
usually available from the facility that manages the overall
LMIS; it should not be necessary to obtain this information
from health facilities or medical stores below tier 1. If the
information is missing for a health facility or medical store,
the data collectors should ask to see the facilities stock records
to determine the number of commodities that were received
by the facility and consumed or shipped by the facility
over a one-year period. The Commodity2, Commodity3,
and Commodity4 worksheets are a continuation of the
Commodity 1 worksheet; the instructions in table 26 apply
to all sheets.
SEPTEMBER 2013
|
Tip
• An exact copy of the commodities
entered in the Calibration section can
be copied into an Excel file outside
of the survey. The commodity names
can then be cut and pasted into the
Commodity worksheets using
Paste à Paste Values àValues.
• The throughput units can also be cut and
pasted using Paste à Paste Values à Values
from an Excel file outside of the survey.
S U P P LY C H A I N C O S T I N G T O O L : U S E R ’ S M A N U A L
|
65
Table 26. Commodity Worksheets 1 through 4, Commodity Information
Please list out the type and quantity of commodities that flowed through your facility
Parameter
What You Need to Do
Name of commodity
Total issued (units)
Select commodity from drop-down menu.
Enter throughput—the total number of units received plus the total
number of units shipped or consumed, divided by two
Make sure to select the correct brand or formulations if there are
different varieties for the same product
Figure 43 shows how to choose a commodity from the drop-down menu.
Figure 43. Choosing Commodity Information
66
|
S U P P LY C H A I N C O S T I N G T O O L : U S E R ’ S M A N U A L
|
SEPTEMBER 2013
5. Data Collection:
Data Management and Verification
Managing the data collected in the surveys is the final step in the data collection process. The Excel-based SCCT
performs three important roles in the costing process:
1. Data import
2. Validation
3. Data management: all of the surveys are created in, and can be edited from, the Data Capture Entry/Data
Import sections of the SCCT (see section 3.6).
After completing some of the surveys and storing them in the designated folder, the user is ready to import the
data for analysis.
After importing the surveys into the tool, the SCCT generates the results shown through a set of tables and
graphs. These can then be analyzed and presented as outputs of the costing study (this is discussed further in
chapter 6).
5.1 Data Impor t
Once some of the data collection surveys have been
completed, the SCCT can import data from each survey to
create a costing database and a commodity database. Prior to
doing this, the user must—
1. close any open surveys files
2. make sure that all surveys are in the folder labeled Surveys
(see section 3.6)
3. ensure that the correct directory address is entered in the
Data Capture/Entry tab
Tip
Before importing data remember to—
1. close any open surveys files
2. make sure all surveys are in the folder
labeled surveys (see section 3.6)
3. ensure that the correct directory address is
entered in the Data Capture/Entry tab.
After verifying these steps, the user can click on the blue Data
Import button (figure 44) to import the data. This takes several minutes to complete depending on the number
of surveys to be imported. When the import is complete, the tool returns to the screen shown in figure 44. It
should be noted the import process takes a couple of minutes to complete. To ensure a smooth import process, the
computer should be permitted to run uninterrupted during survey import.
SEPTEMBER 2013
|
S U P P LY C H A I N C O S T I N G T O O L : U S E R ’ S M A N U A L
|
67
Figure 44. Data Import Section
The SCCT uses the data from each of these databases to create
the results and output reports (see chapter 6). The user must
remember to re-import all surveys by clicking on the blue
button in the Data Import worksheet any time an existing
survey is updated or changed—or a new survey is completed.
5.2 Sur vey Validation
Tip
• Remember to re-import when a
new surveys is created or an existing
survey is changed or updated.
• Remember to click on Refresh in the survey
validation tab after re-importing surveys.
• Refreshing each report takes about two
minutes each.
The survey validation is a step to verify—
• whether a file was created for each facility
• if data has been entered into the files
• if data has been imported successfully.
The Survey Validation screen (figure 45) also provides a place to deselect any facilities that are not to be included
in the final analysis. To follow this data validation process, the user must—
1. Go to Survey Validation under the Data
Import section of the tool
2. Click on Refresh; this table will show
whether a survey has been created for each
facility
3. If a survey has not been created for a
facility, this will be indicated as shown in
figure 45 for “maternity clinic.”
Figure 45. Survey Validation Screen
68
|
S U P P LY C H A I N C O S T I N G T O O L : U S E R ’ S M A N U A L
|
SEPTEMBER 2013
To create a file for a facility, the user must make sure the facility is listed in the Facility List (in the Calibrate Tool
subsection) and then go to Data Capture/Entry to create a file for the facility (see section 3.5 and 3.6).
If the survey has been created but the survey is empty, the table will show Survey File Exists but there will be
a “no” in the Returned Survey column, indicating that no data yet exist for this survey (as seen for “maternity
clinic” in figure 46).
To deselect a facility that will NOT be included in the costing analysis, the user changes the field under Include
in Analysis? to “No” (figure 46).
Figure 46. Facility Survey That Does Not Have Data
SEPTEMBER 2013
|
S U P P LY C H A I N C O S T I N G T O O L : U S E R ’ S M A N U A L
|
69
Table 27 explains each column of the Facility List in the Survey Validation tab. Only the last column in the
report requires any action by you.
Table 27. Data Import Tab - Survey Validation: Facility List
Parameter
What You Should Do
ID
This is the unique identification number generated by the tool for each facility.
Facility Name
The facility name is pulled from the Facility List in the Calibrate Tool tab of the tool.
Created Survey?
This cell reads Survey File Exists if the SCCT found the survey in the survey folder.
This cell reads Survey File Does Not Exist if the SCCT did not find the survey and did not
import it.
•
Returned Survey?
To create a survey file, go to Data Capture/Entry and select the facility
This cell reads “Yes” if the SCCT imported the survey for this facility and the survey
contained data.
This cell reads “No” if the survey for this facility did not contain any costing data.
Include in Analysis
•
If a survey file has data in it but the report says “No,” do a reimport.
•
Check to make sure that the facility name was not changed in the survey directory.
•
Check to make sure that the facility ID has not been changed and matches the ID in the
Facility List in the Calibrate Tool subsection of the tool.
Select Yes/No from the drop-down menu.
The default value is “Yes” and assumes that all surveys containing data are to be included in
the analysis.
If the user does not want to include any of the data available in this facility survey, he or she
uses the drop-down menu to change the value to “No.”
Having performed a survey validation, the user would also want to perform some sort of data validation. Section 6.3
describes how to use the results from the Detailed Supply Chain (SC) Functions Costs and the graphs feature to
check the costing results for outliers and other questionable findings.
Review Raw Data or Error Checking After Data Importation
After ensuring that all of the surveys have been correctly
imported, the user can review the results for each of the surveys
or check for errors (indicated by “#N/A”). To do so, the user
clicks on Reports.
To review results or check for errors in the Summary of Total
Costs report—
Tip
• Remember to re-import when
new surveys are added or updated.
• Remember to click on Refresh in
any of the reports after re-importing the
surveys.
1. Go to Summary of Total Costs report
2. Click on Refresh
70
|
S U P P LY C H A I N C O S T I N G T O O L : U S E R ’ S M A N U A L
|
SEPTEMBER 2013
3. If any errors occurred during the data importation, this table or columns of this table will not be populated
and will instead read “#N/A” (figure 47).
Figure 47. Facility Showing an Error
The user can also check for errors in the Detailed SC Function Costs report:
1. Click on the Detailed SC Function Costs report (highlighted in blue in figure 48 and 49)
2. Click on Refresh
3. If any errors occurred during the data importation, some of the rows or columns of this table will not be
populated and will instead read “#N/A”.
To see the column and row headings in any of the reports, the user selects View and clicks on Headings (figure
48).
Figure 48.Viewing Column and Row Headings
SEPTEMBER 2013
|
S U P P LY C H A I N C O S T I N G T O O L : U S E R ’ S M A N U A L
|
71
Figure 49. Detailed SC Function Costs Showing an Error
To find the source of an error, the user can view all the imported data in a hidden worksheet of the tool named
LocalDatabaseExp (figure 50). The user can also review the raw data for each survey in the LocalDatabaseExp
worksheet within each facility survey.
To view the data in LocalDatabaseExp—
Figure 50. Finding the LocalDatabaseExp Worksheet
1. On the Excel toolbar, click on Homeà
Format à Hide&Unhide àUnhide Sheet
and select the LocalDatabaseExp” worksheet
72
|
S U P P LY C H A I N C O S T I N G T O O L : U S E R ’ S M A N U A L
|
SEPTEMBER 2013
2. Click on OK on the LocalDatabaseExp (figure 51)
Figure 51. Locating the LocalDatabaseExp Worksheet
3. Scroll to columns AB and AC (highlighted in red, figure 52)
4. Scroll down columns AB and AC to review the data or locate any error messages reading “DIV/0!” or “#N/A”
5. The facility/survey in which the error is located can be determined by scrolling to the left and reading
columns A, Y, and Z, which contain the facility/survey name, the expenditure category (for example
“procurement”), and the line item (for example “labor”), respectively
6. The facilities are ordered alphabetically first, then by procurement, storage, transport, and management costs
7. To leave the LocalDatabaseExp worksheet, use Ctrl+Page Up until you return to the reports worksheet
8. Open the identified survey and check that all the required cells have been filled in correctly (see instructions
below).
Figure 52. Local DatabaseExp Worksheet
SEPTEMBER 2013
|
S U P P LY C H A I N C O S T I N G T O O L : U S E R ’ S M A N U A L
|
73
Some possible causes of errors in the surveys that should be corrected:
• The spelling of the commodities in the Commodity1, Commodity2, Commodity3, and Commodity4
worksheets does not match what is in the Commodities section in the tool
– Correct any spelling to match what is listed in the Commodities section of the tool
• Zero was entered for Landed Costs (USD) in the SCCT Calibrate Tool — Commodities for any commodity
– Make sure a cost is entered for each commodity
• Rows were deleted or skipped when facility names were entered into Calibrate Tool — Facility List
– Make sure there are no blank rows between facilities
– If a row has been deleted in the Facility List, we recommend starting over, creating a new file, and
calibrating the tool for the costing exercise
Checking Costs in a Facility Survey
To look at the individual costs that have been entered in a facility—
1. Open a survey
2. On the Excel toolbar, click on Homeà
Format à Hide&Unhide àUnhide Sheet
and select the SurveyDatabaseExp worksheet
(figure 53)
Figure 53. Finding the SurveyDatabaseExp Worksheet
74
|
S U P P LY C H A I N C O S T I N G T O O L : U S E R ’ S M A N U A L
|
SEPTEMBER 2013
1. Click on OK on the SurveyDatabaseExp (figure 54)
Tip
Figure 54. Locating the SurveyDatabaseExp Worksheet
• Use the Costing Survey Job
Aid document to make sure
data was entered correctly in
the survey.
• Ensure only numbers are entered
in fields where numbers are
requested. No letters or words
should be entered in these cells.
Entering letters or words can
cause an error to occur and may
prevent the survey from being
imported.
2. Scroll to columns AB and AC (highlighted in red, figure 55)
3. Scroll down columns AB and AC to review the data that has been entered; these are the calculated costs that
were entered in one of the supply chain function tabs in the survey
4. If data was entered incorrectly, “#N/A” or “DIV/0!” will appear in the red columns AB and AC.
5. To find a cost or the error, look in Column Y to determine whether to go to the procurement, storage,
transport, or management tabs.
6. Once the data point is found, scroll to the right to look in the cells under column AD, AE, AF, or AG to find
where the data was entered within the tab. Figure 55 shows that the labor cost of 20,000,000 can be found in
cell D10 in the Storage1 tab.
7. All error messages--”#N/A” or “DIV/0!”--must be resolved for the survey to be
imported. There cannot be any “#N/A” or “DIV/0!” in the red columns.
8. Once the “#N/A” or “DIV/0!” have been resolved, re-import and refresh the reports.
Figure 55. Locating a Cost Entered in the Survey
9. Column Z is the type of expenditure category (e.g., labor, equipment, vehicle, misc., operating costs).
Figure 56. SurveyDatabaseExp Worksheet
SEPTEMBER 2013
|
S U P P LY C H A I N C O S T I N G T O O L : U S E R ’ S M A N U A L
|
75
The SurveyDatabaseExp can be left open or it can be hidden by right-clicking on the worksheet and selecting
Hide (figure 57).
Figure 57. Hiding the SurveyDatabaseExp Worksheet
Clearing Old Data From the SCCT
The user can start a new costing exercise using data from a previous exercise by clearing an existing tool using
the following steps:
• Delete old data from Calibrate Tool tabs: General Info, Facility Types, Facility List, commodities
– Do not delete any rows or columns
– Manually delete data in the green shaded cells
– Do not delete any data in the grey cells in the Commodities sheet.
• Go to Data Import after all data has been deleted from the Calibrate Tool sheets
Click on the blue Import button and let the tool run
• Input new background data into Calibrate Tool tabs and refer to section 3.4 Calibration, to set up the tool.
76
|
S U P P LY C H A I N C O S T I N G T O O L : U S E R ’ S M A N U A L
|
SEPTEMBER 2013
6. Generating Results
After completing data collection, the user can generate the reports and see costing results. The SCCT reports
provide all the basic data, results, and supply chain costing metrics necessary for deriving the answers needed for a
costing study.
Figure 58. Supply Chain Costing Exercise, Overview of the Required Steps
Conducting a Costing Study of the Supply Chain
Planning
Scope of work
Secure study team
Describe supply chain
Sampling
Budget & timeline
Data collection
Preparation
Set up & customize the tool
Data
Collection
Reporting
Analysis
Train data collectors
Collect data
Complete surveys
Data management &
verification
Summarize data
Determine total
costs
Determine unit
costs
Delivered costs
Comparisons
Extrapolation
Interpreting results
Report writing
Present findings
Consensus
This section explains each of the four reports generated by the tool and the outputs they produce (figure 59):
•
•
•
•
Report 1: Facility Summary
Report 2: Summary of Total Costs
Report 3: Detailed supply chain Function Costs
Report 4: Total Delivered Cost (TDC) Calculator
Figure 59. Reports Produced by the SCCT
Home Page
Facility
Summary
Calibrate
Tool
Summary of
Tital Costs
Data
Capture/Entry
Detailed SC
Function Costs
SEPTEMBER 2013
|
Data
Import
Reports
TDC
Calculator
S U P P LY C H A I N C O S T I N G T O O L : U S E R ’ S M A N U A L
|
77
The reports provide a wealth of information. The tool creates a set of reports and graphs that show the outputs
of the SCCT analysis (table 28). These reports can be copied and pasted directly into presentations and reports.
Depending upon the specific objectives of the costing analysis, these data may be further analyzed and presented
as diagrams. The A Guide to Public Health Supply Chain Costing: A Basic Methodology suggests ways to process the
data, draw conclusions, and present these reports.
Table 28. Costing Indicators Produced by the SCCT
78
|
Indicator
Description
Facility Name
The breakdown is provided for each of the facilities the user has chosen to
include in this table.
Procurement Costs
The total cost of any procurement activities undertaken at this facility or
group of facilities
Storage Costs
The total cost of any storage activities undertaken at this facility or group of
facilities
Transport Costs
The total cost of any transportation activities undertaken at this facility or
group of facilities
Management Costs
The total cost of any management activities undertaken at this facility or group
of facilities
Cost per $ of Annual Pass Through
The total cost incurred by a facility when undertaking all its supply chain
functions in terms of the total value of commodity throughput it in one year.
Care must be taken in its interpretation, since some facilities undertake several
functions and others perform a single supply chain function.
Cost per m3 of Annual Pass Through
The total cost incurred by a facility when undertaking all its supply chain
functions in terms of the total volume of commodity throughput in one year.
Care must be taken in its interpretation, since some facilities undertake several
functions and others perform a single function.
Cost per kg of Annual Pass Through
The total cost incurred by a facility when undertaking all its supply chain
functions in terms of the total weight of commodity throughput in one year.
Care must be taken in its interpretation, since some facilities undertake several
functions and others perform a single function.
Procurement Costs per $1,000 of Commodities
The cost incurred by a facility when undertaking procurement in terms of the
total value of commodity throughput in one year multiplied through by 1,000.
Storage Costs per $1,000 of Commodities
The cost incurred by a facility when undertaking storage in terms of the total
value of commodity throughput in one year multiplied through by 1,000
Transport Costs per $1,000 of Commodities
The cost incurred by a facility when undertaking transportation in terms of the
total value of commodity throughput in one year multiplied through by 1,000
Management Costs per $1,000 of Commodities
The cost incurred by a facility when undertaking management activities in
terms of the total value of commodity thoughput in one year multiplied
through by 1,000
S U P P LY C H A I N C O S T I N G T O O L : U S E R ’ S M A N U A L
|
SEPTEMBER 2013
A common feature of reports 2–4 allows the user to see total costs for a subset of facilities. The subsets are
selected through a drop-down menu on each report. Drop-down menus are located in the green-shaded cells. At
a minimum, reports can be generated by—
• tier (e.g., all the facilities in tier 2 of the supply chain)
• type of facilities
– hospitals
– regional hospitals
– rural clinics
Choosing a category and tag generates a report containing that data after
clicking on the Refresh button.
Important note on refreshing tables: All tables have a blue Refresh button
near the navigation toolbar. The data in the tables are not automatically
updated when each worksheet is opened after a re-import. The user must
always refresh the table before using the data, even if the categorization tags
already display the selection that the user wishes to generate.
Tip
Use “refresh” button
to update reports after
re-importing surveys
6.1 Repor t 1: Facility Summar y Repor t
The Facility Summary report provides an overview of the sampled facilities. It is the first report in the Reports
subsection. This report should only be generated after the user has completed the survey validation process
and ensured that all the necessary data has been imported into the SCCT. This report provides the following
information:
•
•
•
•
•
Facility names
The tier each facility belongs to
The type of facility a facility belongs to
The category(s) of each facility
The functions performed by each facility
The SCCT summarizes the characteristics of all the facilities included in the costing study (table 29). The
default is to compile a table of all the facilities with survey data. The tool sorts the facilities by tier and then
alphabetically. In figure 60, the user has created custom categories to sort facilities by region, urban or rural
location, population density, and accessibility.
SEPTEMBER 2013
|
S U P P LY C H A I N C O S T I N G T O O L : U S E R ’ S M A N U A L
|
79
Table 29. Facility Summary Report Details
Column
Data Shown
Facility Name
Name of the facility visited
Tier Classification
Tier in which the facility is classified. Each facility can only be in one tier.The list is ordered by tier, and
facilities are listed in alphabetical order within their tier.
Facility Type
Each facility is classified by type. Examples include tertiary hospital, rural health facility, national facility.
Typically, all tier 1 facilities are classified as national.
1st User-Defined
Categorization
This is the first user-defined categorization.
2nd User-Defined
Categorization
This is the second user-defined categorization.
3rd User-Defined
Categorization
This is the third user-defined categorization.
4th User-Defined
Categorization
This is the fourth user-defined categorization.
List of Functions
Performed
The last four columns are markers for whether the imported data for each facility includes costs for
any or all of the four specific supply chain functions. For example, an “x” under storage indicates that
the relevant facility has incurred some costs due to storage activities.
The report also notes whether the facility performs any of the four supply chain functions. If data was entered in
the procurement, storage, transportation, or management surveys, an “X” will appear, which indicates that the
facility has costs for that function (figure 60). The zeros indicate that the user chose not to classify those facilities
by those categories.
The user can copy and paste
this table into reports or
presentations to provide an
overview of the facilities
sampled in the costing
study.
Figure 60. Facility Categories Created by the User
80
|
S U P P LY C H A I N C O S T I N G T O O L : U S E R ’ S M A N U A L
|
SEPTEMBER 2013
6.2 Repor t 2: Summar y of Total Costs
The second report produced by the tool is the first to contain any cost data. This report summarizes—
• total supply chain costs at each facility
• total value, volume, and weight of supply chain throughput at the facility
• supply chain costs by each facility and function
The summary data provided in the Summary of Total Costs report are described in table 30.
Table 30. Summary of Total Costs (Report 2)
Summary of total supply chain costs and throughput
Column
Data Shown
Facility
Name of the facility visited.
Total Cost ($)
Total cost of supply chain activities carried out at this facility for the period covered by the study.
Total Value of Goods
Total value of the commodities delivered (the total number of units received plus units shipped,
divided by two) through the supply chain to this facility in the year covered by the study.
Total Volume of Goods (m3 )
Total volume of the commodities delivered through the supply chain to this facility in the year
covered by the study.
Total Weight of Goods (kg)
Total weight of the commodities delivered through the supply chain to this facility in the year
covered by the study.
Figure 61 shows an example of the Summary of Total Costs report.
Figure 61. Report 2, Summary of Total Costs
SEPTEMBER 2013
|
S U P P LY C H A I N C O S T I N G T O O L : U S E R ’ S M A N U A L
|
81
The user can filter costs by tier through the drop-down, which can be accessed by selecting a tier tag (highlighted
in green in figure 62) and clicking on Refresh to update the report.
Figure 62. Report 2, Summary of Total Costs
6.3 Repor t 3: Detailed Supply Chain Function Costs
Report 3, Detailed Supply Chain Function Costs (figure 63), helps to validate results and provides a detailed
summary of—
•
•
•
•
•
•
total and average supply chain costs for all the facilities sampled in the costing exercise
total supply chain costs for each facility
supply chain function costs for each facility
key supply chain metrics for each facility
key cost indicators for each function (i.e., procurement, storage, transportation, management)
all the costs collected in the surveys (presented in a line-item view).
Figure 63. Data Validation Using the Detailed Supply Chain
Function Costs by Facility Table
The SCCT can also show costs broken down by the categories defined by the user (e.g., tier, facility type,
accessibility, urban/rural). The user can choose to view the supply chain costs by facility type by selecting one of
the Facility Type” tags and clicking on Refresh (figure 64). For instance, the user can choose to see all of the rural
clinics or hospitals that were part of the sample.
82
|
S U P P LY C H A I N C O S T I N G T O O L : U S E R ’ S M A N U A L
|
SEPTEMBER 2013
Figure 64. Filtering Costs by Facility Type
The detailed supply chain function cost table shows data for all facilities by default. To see any similarities or
variations, the user should use the graph features and categorization tags to look at different groups of facilities.
Graphs can be produced and explored for any of the supply chain costing metrics listed in table 31.
Table 31. Detailed Supply Chain Functions Costs Report
Metrics
Total supply chain costs
Total transport costs
Cost per $ of annual pass through
Transport costs: labor
Cost per m of annual pass through
Transport costs: per diems
Cost per kg of annual pass through
Transport costs: fuel
Procurement costs per $1,000 of commodities
Transport costs: equipment
Storage costs per $1,000 of commodities
Transport costs: vehicle
Transport costs per $1,000 of commodities
Transport costs: misc
Management costs per $1,000 of commodities
Cost per m3 transported
3
Cost per kg transported
Total km
Total procurement costs
Total management costs
Procurement costs: labor
Management labor costs for quantification
Procurement costs: misc
Management labor costs for logistics training
Cost per $1,000 of procured commodities
Management labor costs for QA
Management labor costs for LMIS
Management labor costs: other
Management operating costs
Management costs: misc
Total storage costs:
Storage costs: labor
Storage costs: space
Storage costs: equipment
Cost per m3 for stored product
Cost per kg for stored product
SEPTEMBER 2013
|
S U P P LY C H A I N C O S T I N G T O O L : U S E R ’ S M A N U A L
|
83
All different categories and tag selections should be validated. Two examples are shown below:
Example 1:Validating Results by Tier
Use the following steps to create reports to validate results by tier (figure 65):
1.
2.
3.
4.
Select Tier under Category as shown above
Select the tier level desired
Click on Refresh
Double-click on Cost Categories to view a graph of the particular cost category. Cost categories are any of the
line items shown in the table on the left OR
5. Once in a selected graph, click on View Original Chart to see all graphs for the facilities that fall under the
category and tag selected
6. Each graph has a button that reads either Return to Table 3 or Return to Static Chart
7. Go through steps 1–6 to filter the results by tier.
Figure 65. Reviewing the Function Costs and Graphs by Tier
Example 2:Validating Results by Facility
Create a table for all facility types. Use the following steps to create reports for validating results by facility (figure
66):
1.
2.
3.
4.
Select Facility Type under Category as shown above
Select the facility type desired, starting with the first choice on the drop-down menu
Click on Refresh
Double-click on Cost Categories to view a graph of the particular cost category. Cost categories are any of the
line items shown in the table on the left OR
5. Once in a selected graph, click on View Original Chart to see all graphs for your delineated category and tag
selection
6. Each graph has a button that reads either Return to Table 3 or Return to Static Chart. Click on these buttons
to return to the main page
7. Go through steps 1–6 to filter the results by facility.
84
|
S U P P LY C H A I N C O S T I N G T O O L : U S E R ’ S M A N U A L
|
SEPTEMBER 2013
Figure 66. Reviewing the Function Costs and Graphs by Facility Types
The process to validate results serves two important purposes:
1. Ensuring that the data have been entered correctly in the surveys
2. Identifying cost outliers
If outliers emerge during validation, it may that the user incorrectly categorized a facility and thus needs to
recheck. An outlier may also point out facilities whose data may need to be double-checked.
Example 3: Creating Graphs to Identify Outliers
Once each report has been created, the user can navigate to other graphs by clicking on any of the options in the
Select Chart Category cell to display a scatterplot of that cost category value for a group of facilities (figure 67).
Figure 67. Navigating Scatterplots Through Chart Drop-Down
Menu
SEPTEMBER 2013
|
S U P P LY C H A I N C O S T I N G T O O L : U S E R ’ S M A N U A L
|
85
Outliers will show clearly in a graphical display as points located far from the others on the graph. In figure 68, it
can be seen that there is an obvious outlier amongst this group of facilities.
Figure 68. Data Validation Using the Graphing Function of the
Detailed Costing Table
To identify the name of the outliers and from where they originate, the user must click on the blue View Original
Chart button to be taken to the original chart. From here, the user can hover the mouse over the outlying data
point; a yellow pop-up box displays the name of the facility (figure 69).
• If there is an outlier, the user must decide whether it should be excluded from the group, reclassified into
another more appropriate category, or kept as is
• If there are no outliers, the user can hit the blue Return to Table 3 button to return to the report. To return to
the previous chart, the user can hit the blue Return to Static Chart button.
Figure 69. Data Validation Using the Graphing Function of the
Detailed Costing Table to Identify Outlier Names
86
|
S U P P LY C H A I N C O S T I N G T O O L : U S E R ’ S M A N U A L
|
SEPTEMBER 2013
Example 4: Costing Metrics for Identifying Cost Drivers by Function
Having looked at costs at a big picture level, the next step is to disaggregate tier and facility level costs into their
components. This report breaks the cost of supply chains into component functions. It is an initial step in
understanding cost drivers and to see if any one of these four functions accounts for a large proportion of costs
relative to the other functions, and whether this function is sensitive to change in the quantity of goods passing
through the system. All the data required for this analysis is available in the Detailed Supply Chain Function
Costs report (table 32).
Table 32. Supply Chain Costing Metrics
Indicator
Description
Facility Name
The breakdown is provided for each of the facilities that the user has chosen to
include in this table.
Procurement Costs
The total cost of any procurement activities undertaken at this facility
Storage Costs
These figures represent the total cost of any storage activities undertaken at this
facility.
Transport Costs
These figures represent the total cost of any transportation activities undertaken at
this facility.
Management Costs
These figures represent the total cost of any management activities undertaken at
this facility.
Cost per $ of Annual Pass Through
The total cost incurred by a facility when undertaking all its supply chain functions
in terms of the total value of commodities passing through it in one year. Care must
be taken in its interpretation, since some facilities undertake several functions and
others perform a single function.
Cost per m3 of Annual Pass Through
The total cost incurred by a facility when undertaking all its supply chain functions
in terms of the total volume of commodities that pass through it in one year. Care
must be taken in its interpretation, since some facilities undertake several functions
and others perform a single function.
Cost per kg of Annual Pass Through
The total cost incurred by a facility when undertaking all its supply chain functions
in terms of the total weight of commodities that pass through it in one year. Care
must be taken in its interpretation, since some facilities undertake several functions
and others perform a single function
Procurement Costs per $1,000 of
Commodities
The cost incurred by a facility when undertaking procurement in terms of the total
value of commodities that pass through it in one year multiplied through by 1,000
Storage Costs per $1,000 of Commodities
The cost incurred by a facility when undertaking storage in terms of the total value
of commodities that pass through it in one year multiplied through by 1,000
Transport Costs per $1,000 of
Commodities
The cost incurred by a facility when undertaking transportation in terms of the
total value of commodities that pass through it in one year multiplied through by
1,000
Management Costs per $1,000 of
Commodities
The cost incurred by a facility when undertaking management activities in terms of
the total value of commodities that pass through it in one year multiplied through
by 1,000
SEPTEMBER 2013
|
S U P P LY C H A I N C O S T I N G T O O L : U S E R ’ S M A N U A L
|
87
Indicator
Description
Procurement Costs
Procurement Costs: Labor
The total labor costs under the procurement function
Procurement Costs: Misc
The total miscellaneous costs under the procurement function
Cost per $1000 of procured commodities
The cost incurred by a facility when undertaking procurement in terms of the total
value of commodities that pass through it in one year multiplied through by 1,000
Storage Costs
Storage Costs: Labor
The total labor costs under the storage function
Storage Costs: Space
The total space costs under the storage function
Storage Costs: Equipment
The total equipment costs under the storage function
Cost per m3 of stored
The total volume divided by the total storage costs
Cost per kg of stored
The total weight divided by the total storage costs
Transport Costs
88
|
Transport Costs: Labor
Total labor costs under the transport function
Transport Costs: Per Diems
Total per diem costs under the transport function
Transport Costs: Fuel
Total fuel costs under the transport function
Transport Costs: Equipment
Total equipment costs under the transport function
Transport Costs:Vehicle
Total vehicle costs under the transport function
Transport Costs: Misc
Total miscellaneous costs under the transport function
Cost per m3 transported
The total volume divided by total transport costs
Cost per kg transported
The total weight divided by total transport costs
Total Km
Total distance covered
S U P P LY C H A I N C O S T I N G T O O L : U S E R ’ S M A N U A L
|
SEPTEMBER 2013
Indicator
Description
Management Costs
Management Labor Costs for Quantification
Total quantification labor costs under the management function
Management Labor Costs for Logistics
Training
Total training labor costs under the management function
Management Labor Costs for Quality
Assurance
Total quality assurance labor costs under the management function
Management Labor Costs for Logistics
Information Systems
Total logistics information systems labor costs under the management function
Management Labor Costs Other
Total other management labor costs under the management function
Management Operating Costs
Total operating costs under the management function
Management Costs: Misc
Total miscellaneous labor costs under the management function
6.4 Repor t 4:Total Delivered Cost Calculator
The TDC Calculator uses the supply chain costing metrics (figure 70, table 33) for each facility in each tier
to estimate the total delivered cost (the total cost of getting a product from its point of entry into the country
to the SDP) for the actual quantity of commodity delivered to any sampled facility. The TDC only takes into
consideration the direct costs of delivering commodities. This includes procurement, storage, transport, and
operating costs. It does not include management labor (quantification, QA, LMIS, and other).
The tool can determine TDC for up to five different facilities (SDPs) and up to four levels (or tiers) at a time. To
carry out more calculations, the user must choose additional facilities and click on Refresh. The TDC also
produces analyses of cost per $1,000, per kg, and per m3. The user should select the tier 1 facilities that, added
together, fund the supply chain.
An indicator commonly used to cost and to
compare supply chain efficiency is the cost
of delivering a commodity compared to the
value of the commodity. In mathematical
terms, this is expressed as the percentage
value of the good that supply chain costs
represent. For example, in the retail market
where profits depend upon the efficiency of
the supply chain, the goal is to keep supply
chain costs at no more than 17 percent of
the value of the goods delivered. In other
words, if a good costs $100, the total cost of
delivery (or total delivered cost) to its point
of sale or consumption should not be more
than $17. In public health, this value has
Figure 70. Report 4, TDC Calculator
SEPTEMBER 2013
|
S U P P LY C H A I N C O S T I N G T O O L : U S E R ’ S M A N U A L
|
89
particular importance because there is a dearth of knowledge about the cost of supply chains.
An understanding of the TDCs is critical if supply chains are to be sustainable. The TDC can be a better
reference to allocate delivery costs regardless of the type, value, or price of commodities being distributed. For
example, consider an instance where 10 percent of the commodity purchase price is applied as distribution costs
to two products with similar unit package sizes (600 mL bottle)—an ARV costing U.S.$40.00 per bottle and an
antibiotic purchased for U.S.$2.00 per bottle. The distribution costs charged would be U$4.00 per bottle for the
ARV and U$0.20 per bottle of antibiotics, respectively. On the other hand, if the total delivered cost was known,
the charge could be a flat rate per package (600 mL bottle, in this example): U.S.$0.34 per bottle. Ultimately the
cost to deliver one bottle of either an ARV or an antibiotic is actually the same; therefore, the cost is even and
fairly allocated.
Procurement Aggregate Costs
The costing tool is set up to collect only the procurement costs directly related to the acquisition and distribution
of health commodities (e.g., handling fees, demurrage, customs clearance, labor for procurement). In the TDC,
these costs are weighted by the volume of commodities being procured—sometimes by different organizations
or agencies —and converted to the standard costing metrics of U.S.$1,000 worth of commodities, and then
included in the total delivered cost calculation.
Therefore, to use the TDC, the user must know beforehand which facilities actually procure the commodities for
each facility (or SDP) to be analyzed. For example, if all the commodities being delivered to Rural Clinic 1 are
known to come from the National Procurement Agency, the user will choose only the one facility, the National
Procurement Agency, from the drop-down menu as highlighted in figure 71.
However, if it is known that the Rural
Clinic 1 receives commodities that are
procured by the National Procurement
Agency and another facility such as a
development partner, the user must select
both facilities from the drop-down menus
in the cell next to Total per $1,000, to
the right of the cell shown in figure 71, to
calculate the total delivered cost. The tool
allows up to five facilities to be selected and
considered in the TDC calculation.
Figure 71. Report 4, TDC Calculator Report for a Single
Procurement Agency
Because commodities can only be stored
and transported by one facility at a time,
no further weighted average conversions are
required for the rest of the TDC calculation.
An exception to this rule is when several
organizations fund one function such as transportation costs (one partner funds vehicles and another funds driver
salaries and per diem), in which case the user should refer to section 4.3 for the discussion on creating a dummy
facility to aggregate all supply chain costs regardless of which partner is funding which function of the supply
chain.
90
|
S U P P LY C H A I N C O S T I N G T O O L : U S E R ’ S M A N U A L
|
SEPTEMBER 2013
TDC by Facility
The TDC Calculator estimates the TDC of getting a unit of commodity from procurement to readiness for use/
dispensing for each facility. The SCCT uses all the costing data directly related to acquisition and distribution of
commodities to estimate the costs incurred at each tier of the commodities’ journey throughout the supply chain
and then presents the total costs by function and as a percentage of the value (table 33).
Figure 72. Intermediate Calculations for TDC Report
SEPTEMBER 2013
|
S U P P LY C H A I N C O S T I N G T O O L : U S E R ’ S M A N U A L
|
91
Table 33.TDC: Breakdown of Costs by Function Incurred to Deliver $1,000 Worth of Commodities
Procurement Costs =
$100.00
The cost of procuring $1,000 of commodities where the cost has been averaged across
all the facilities that participate in the in-country procurement process of commodities
distributed in the supply chain being costed.
From figure 72 we can say:
C=A/1,000*B
Storage Costs =
$30.00
The sum of
$25.00, storage costs per $1,000 at United Nations Population Fund (UNFPA) + Central
Contraceptive Warehouse (CCW)
$5.00, storage costs per $1,000 at NYSC Clinic
From figure 72 we can say:
S=(S1+S2+S3+S4)*B
Transport Costs =
$40.00
The sum of
$40.00, transport costs per $1,000 at UNFPA + CCW
$0.00, transport costs at NYSC Clinic since it does not do any transportation.
From Figure 72 we can say:
T=(T1+T2+T3+T4)*B
Management Costs =
$12.00
The sum of
$10.00, management operating costs per $1,000 at UNFPA + CCW
$2.00, management operating costs per $1,000 at NYSC Clinic
From Figure 72 we can say:
M=(M1+M2+M3+M4)*B
Total delivered costs
$182.00
Total delivered costs of getting goods to service delivery which is the sum of all of the above
The total delivered cost metric given in $ per $1,000 of commodity delivered is then multiplied by the total value of commodities
delivered to NYSC Clinic to obtain the “actual” costs of delivering the commodities that were delivered in one year as follows:
Total value of
commodities
delivered
$1,000
Total value of goods that were delivered to NYSC Clinic
From Figure 72 we can say:
TDC=C+S+T+M
The total delivered cost calculation above implies the following:
Total delivered costs
as a % of the value of
goods delivered
18.2%
Total delivered costs as a percentage of the total value of commodities that were delivered
to NYSC Clinic
From Figure 72 we can say:
P=TDC/1000*B
The default view for this table shows the procurement calculations so that the user can include procurement
facilities and SDP calculations; the user can also select the facilities for which the total delivered costs are to
be determined. However, the user can also see the intermediate calculations by clicking on the Show/Hide
calculations buttons (figure 71).
Important Note: If a dummy facility (see section 3.5) has been created to represent a partnership of supply chain
facilities, any health facility that receives commodities from the dummy facility should select the dummy facility.
92
|
S U P P LY C H A I N C O S T I N G T O O L : U S E R ’ S M A N U A L
|
SEPTEMBER 2013
The dummy facility’s costing data will be used by the tool in calculating the cost to deliver to that particular
health facility.
6.5 Making Cost Comparisons
Cost comparisons are frequently a key reason for conducting an analysis of costs, particularly where several supply
chains are being run simultaneously. This section lays out how the user can cut and paste the data produced by
the SCCT into a table to provide a cost comparison analysis like the one suggested in table 34.
Table 34. Cost Comparison Matrix Utilizing the Costing Tool Outputs
Tier 1
(e.g., Central)
Tier 2
(e.g., Regional)
Tier 3
(e.g., District)
Procurement Costs
Central procurement
costs in cost per $1,000
procured
Regional procurement
costs in cost per $1,000
procured
District procurement
costs in cost per $1,000
procured
Storage Costs
Central storage costs in cost
per $1,000 stored or cost
per m3
Regional storage costs in
cost per $1,000 stored or
cost per m3
District storage costs in cost
per $1,000 stored or cost
per m3
Transport Costs
Central transportation
costs in cost per $1,000
transported or cost per m3
Regional transportation
costs in cost per $1,000
transported or cost per m3
District transportation
costs in cost per $1,000
transported or cost per m3
Management Costs
Central management costs
per $1,000 of throughput
Regional management
costs per $1,000 of
throughput
District management costs
per $1,000 of throughput
SEPTEMBER 2013
|
S U P P LY C H A I N C O S T I N G T O O L : U S E R ’ S M A N U A L
|
93
Total Costs vs. Unit Costs vs. Average Costs
The SCCT reports both unit costs and average costs. Although many cost analyses use these terms
interchangeably, the SCCT defines them differently (see Annex 1. Glossary of Terms for definitions). The
unit cost is the cost of carrying out a function at a particular facility, for example the cost of storing $1,000 of
commodities for one year at Rural Clinic 1 as determined for each facility in the Detailed Supply Chain Function
Costs table. By contrast, average cost would be the cost of storing $1,000 of commodities for all rural clinics.
In this example, average cost equals total cost summed across all the rural clinics divided by the total value of
commodities stored at all the rural health clinics.
Average costs for a category of facilities can be obtained by selecting the appropriate category of facilities in the
drop-down menus of the Detailed Supply Chain Function Costs report and reading the automatically generated
Average column (figure 73).
Figure 73. Using the Detailed Supply Chain Function Costs
Report to Obtain Average Costs
94
|
S U P P LY C H A I N C O S T I N G T O O L : U S E R ’ S M A N U A L
|
Comparisons across supply chain systems
can also be made using the SCCT if the
facilities have been categorized as belonging
to a given parallel supply chain system
during the calibration of the SCCT. For
example, if there is a national system and
an NGO run system, each SDP could be
categorized as being in one or the other
system. Using that categorization, the
SCCT can produce average costs.
SEPTEMBER 2013
References
Abdallah, Hany. 2004. Guidelines for Assessing Costs in a Logistics System: An Example of Transport Cost Analysis.
Arlington, Va.: John Snow, Inc./DELIVER, for the U.S. Agency for International Development.
Baruwa, Elaine, Marie Tien, and David Sarley. 2009. Zambia ARV Supply Chain Costs: A Pilot of the Supply Chain
Costing Tool. Arlington, Va.: USAID | DELIVER PROJECT, Task Order 1.
Christopher, Martin. 1992. Logistics and Supply Chain Management, Strategies for Reducing Cost and Improving Services.
London: Pearson.
Huff-Rousselle, Maggie and Sangeeta Raja. 2002. Ghana: Estimating the Cost of Logistics in the Ministry of Health
Supply System. Arlington, Va.: Family Planning Logistics Management (FPLM)/John Snow, Inc., for the U.S. Agency
for International Development.
Pohlen, Terrance, Thomas Klammer, and Gary Cokins. 2009. The Handbook of Supply Chain Costing. Lombard,
Illinois: Council of Supply Chain Management Professionals (CSCMP).
Sarley, David., Elaine Baruwa, and Marie Tien. 2010. Zimbabwe: Supply Chain Costing of Health Commodities.
Arlington, Va.: USAID | DELIVER PROJECT, Task Order 1.
Sommerlatte, Adriano and Cary Spisak. 2010. Nigeria: Costing of the Contraceptives Logistics Management System.
Arlington, Va.: USAID | DELIVER PROJECT, Task Order 1.
USAID | DELIVER PROJECT, Task Order 1. 2011. The Logistics Handbook: A Practical Guide for the Supply Chain
Management of Health Commodities. Arlington, Va.: USAID | DELIVER PROJECT, Task Order 1.
USAID | DELIVER PROJECT. 2012. Rwanda: Costing of the Public Health Supply Chain. Arlington, Va.: USAID |
DELIVER PROJECT, Task Order 4.
Vitasek, Kate. February 2010. “Supply Chain Management Terms and Glossary.” Council of Supply Chain
Management Professionals. Available at: http://cscmp.org/sites/default/files/user_uploads/resources/downloads/
glossary.pdf (accessed February 2013).
SEPTEMBER 2013
|
S U P P LY C H A I N C O S T I N G T O O L : U S E R ’ S M A N U A L
|
95
96
|
S U P P LY C H A I N C O S T I N G T O O L : U S E R ’ S M A N U A L
|
SEPTEMBER 2013
Annex 1
Glossar y of Terms
This chapter of the manual provides additional information for the user. The sections have each been referred to
in the previous chapters of the manual.
Some of the definitions have been adapted from the DELIVER project document Guidelines for Assessing Costs
in a Logistics System: An Example of Transport Cost Analysis (Abdallah 2004).
Term
Definition
Average cost
Total cost divided by total throughput (the total number of units received plus units shipped,
divided by two).
For example, the average cost per unit of tier 1 is $0.05 per $1.00 worth of commodity if
the total cost of tier 1 is $1,000,000 and the total value of the throughput is $20,000,000
(compare with Unit cost.).
Capital costs
Resource that are used over several years and are therefore only accounted for in any one
year by a depreciation charge (see Depreciation charge)
Cost driver
Factor that affects the cost of a function. Influenced by the frequency and intensity of the
demands placed on the resource and the state (conditional) of available resources (e.g.,
frequency of orders in a logistics systems; level of knowledge of logistics staff).
Depreciation
The practice of valuing a good with a useful life of more than one year, at some fraction of
its purchase price to account for the fact that with each year of life, it can only be sold at a
lower value than the previous year.The Supply Chain Costing Tool (SCCT) uses straight line
depreciation, meaning that the value by which the good decreases over the course of a year
of its useful life is equal to the purchase price of the good divided by its useful life.
For example, a car bought for $10,000 with a useful life of five years decreases in value by
$2,000 each year; after five years it is considered to have a value of zero (even if in reality it
could still be sold for some positive sum, in accounting terms it is valued at zero).
Depreciation charge
The accounting value (as reported in a financial annual report or accounting audit) that
represents the annual cost of a good whose total useful life is more than one year.The value
is equal to one year’s worth of depreciation (see Depreciation).
Direct costs
Costs that can be explicitly identifiable with a particular service or area.
Examples of direct supply chain costs are hospital supplies, labor costs for logistics personnel,
and fuel.
Facilities
The term facility in the SCCT and manual refers to a single institution that carries out at least
one function (see Function) in the supply chain.This is not to be confused with the term health
facility, which would apply to only a service delivery point (SDP). Each SCCT facility must have
its own survey completed for importation into the tool.
Function
A function consumes human and financial resources of a facility and represents the inputs
of that facility. In the SCCT, the four functions are procurement, storage, transportation, and
management.
SEPTEMBER 2013
|
S U P P LY C H A I N C O S T I N G T O O L : U S E R ’ S M A N U A L
|
97
Term
Definition
Indirect costs
Costs that are not directly paid for by a program (e.g., volunteer labor). Sometimes referred
to as overhead costs, this is incorrect because overhead costs (e.g., electricity) are paid for
and therefore included in costs directly.
Integrated supply chain
A product-integrated supply chain distributes more than one type of commodity.
For example, a supply chain that delivers family planning (FP) commodities, essential
medicines, and human immunodeficiency virus (HIV) commodities would be productintegrated (compare with Vertical supply chain).
Logistics management information
system (LMIS)
A system of records and reports that are used to collect, organize, and present logistics data
gathered across all levels of the system (USAID | DELIVER PROJECT,Task Order 1 2011).
Non-labor operating costs
Any supply chain function operating costs that are not salaries (see Operating costs).
Non-labor operating costs refer to resources used for a supply chain function only (e.g., fuel
used for transportation) and not to resources used for the whole facility (e.g., electricity),
which the SCCT refers to as overhead.
Operating costs
Resource used and replaced in one year’s time (e.g., personnel salaries, medicines, supplies,
gasoline, medicines.) In the SCCT, operating costs are split into labor costs and non-labor
operating costs.
Overhead
Refers to institutional operating costs that are resources used and replaced, in one year’s
time (e.g., electricity, hospital director salaries.) In the SCCT, overhead refers to the operating
costs incurred at the institutional level specifically.
Pull system
In a requisition (pull) system, the lower-level facility orders commodities as it needs them,
pulling supplies through the chain.
In a requisition system, the person who receives the supplies calculates the quantities of
supplies required (USAID | DELIVER PROJECT,Task Order 1 2011).
Push system
In an allocation (push) system, the higher-level facility decides what commodities to push
down the chain and when to move them.
In an allocation system, the person who issues the supplies calculates the quantities of
supplies required (USAID | DELIVER PROJECT,Task Order 1 2011).
Throughput
The total number of units received plus the units shipped or consumed, divided by two
(Vitasek 2010). Also, a measure of warehousing output volume (weight, number of units).
Unit cost
Cost of one unit of output (e.g., the cost of storing $1.00 worth of commodity at a facility in
tier 2 could be $0.02.)
Unit cost should not be confused with average cost (i.e., if the cost of storage varies between
facilities in tier 2 then the average cost would be the total cost of storage in tier 2, summed
across all the tier 2 facilities, divided by the total value of commodities stored by the facilities
in tier 2, also summed across the tier 2 facilities; compare with Average costs).
Vertical supply chain
98
|
A vertical supply chain is one that distributes only one type of commodity (e.g., FP
commodities). A vertical supply chain typically exists as a parallel system to other supply
chains within a country (compare with Integrated supply chain).
S U P P LY C H A I N C O S T I N G T O O L : U S E R ’ S M A N U A L
|
SEPTEMBER 2013
Annex 2
Sample Timeline Activity
Duration (Level of Effort)
Background document review
5–10 days each for a two-person team
Logistics preparation
5 days level of effort (LOE)
This process may take several weeks, given that it includes scheduling appointments and
meetings.
Data collection preparation
3 days
Training
1 day
Data collection
10–15 days for three pairs of data collectors
Analysis and reporting
10–15 days each for a two-person team
SEPTEMBER 2013
|
S U P P LY C H A I N C O S T I N G T O O L : U S E R ’ S M A N U A L
|
99
100
|
S U P P LY C H A I N C O S T I N G T O O L : U S E R ’ S M A N U A L
|
SEPTEMBER 2013
Annex 3
Sample: Scopes of Work
Co-team Lead: Logistics Specialist (6 weeks LOE)
• Skill set: Experience working on supply chains in developing countries and knowledge of all supply chain
functions including procurement, transport, storage, information systems, training, and quality assurance.
Familiarity with Excel and PowerPoint. Experience conducting logistics system assessment tool (LSAT) or
logistics indicators assessment tool (LIAT) exercises are desirable.
• Responsibilities:
i. Review all background supply chain documents relevant to the proposed study
ii. Write up the scope of work for the study, including the specific questions being addressed and which
tiers and functions are being included
iii. Write up the supply chain structure, roles, and responsibilities of the facilities within the supply chain
to be costed
iv. Calibrate the SCCT model to represent the supply chain
v. Determine the sample criteria and sample facilities to be included, ensuring that these are appropriate
for the questions that the study must answer
vi. Quality assurance of the data collected
vii. Data analysis and interpretation
viii. Report writing and presenting
Co-team Lead: Costing Specialist (6 weeks LOE)
• Skill set: Experience with costing studies, accounting or economics. Advanced Excel skills are required to
troubleshoot and locate data entry errors, though programming skills are not necessary. Some basic knowledge
of supply chain activities is useful. Experience conducting LSATs or LIATs is desirable.
• Responsibilities:
ix. Review all background supply chain documents relevant to the proposed study
x. Write up the supply chain structure, roles, and responsibilities of the facilities within the supply chain
to be costed
xi. Determine the sample criteria and sample facilities to be included, ensuring that these are appropriate
for the questions that the study must answer
xii. Quality assurance of the data collected and identification of any incorrect data.
xiii. Data analysis and interpretation
xiv. Report writing and presenting
SEPTEMBER 2013
|
S U P P LY C H A I N C O S T I N G T O O L : U S E R ’ S M A N U A L
|
101
Data Collectors (2–3 weeks LOE)
• Skill set: Logistics experience. Familiarity with the specific supply chain being costed. Ideally, this person
should have worked with the supply chain with either a development partner or at a government level that
requires oversight of the supply chain system. This person should also be familiar with the commodities being
delivered by the supply chain. Experience conducting LIATs or LSATs is desirable. Ability to open, save, and
close Excel files and enter and delete data is necessary.
• Responsibilities:
xv. Attend supply chain costing tool survey training and become familiar with the questions that the
study is addressing and familiar with all the questions in the survey and able to navigate through the
survey’s Excel worksheet
xvi. Conduct costing survey at facilities; enter data directly or from paper-and-pen surveys into the
electronic surveys
xvii. Collect any necessary documentation such as budgets and expenditure reports from facilities in either
electronic or paper form
xviii. Collect any commodity management data and be able to abstract that data from electronic or paper
sources (e.g., be able to aggregate delivery invoices to obtain the total number of each commodity
received by facilities each year)
Planning – During the planning phase of the process a number of actions
should take place prior to the in-country phase of the costing
Scope of Work
•
•
•
•
Define supply chain to be costed (there may be vertical supply chains in a country)
Which commodities will be included (i.e. contraceptives, essential medicines, ARVs)
If results will be nationally representative, statistically significant, or for a particular region
Determine sources of data needed for costing exercise including:
– Sources of costing data from organizations who financially support the implementation of the supply
chain
– Determining universe of health facilities and commodity storage facilities
– Where commodity data can be obtained from each level to include value, volume and weight
– Developing list of key informants to interview
• Describing the supply chain
– Obtain or create a flow chart or a map of the supply chain showing who pays for the different functions
of the supply chain and the flow of the commodities down to the SDP level
– Determine number of tiers
– Determine number and location commodities are stored below the central level, i.e. regional or district
medical stores
Sample size
• Determine how many health facilities are served by the supply chain
• Determine the different types of health facilities
• Identify location of health facilities
102
|
S U P P LY C H A I N C O S T I N G T O O L : U S E R ’ S M A N U A L
|
SEPTEMBER 2013
Budget
•
•
•
•
Develop budget to conduct the costing study for the funders of the costing exercise
Timeline
In-country team should schedule key informants interviews
Based on sample size, schedule field visits
Logistics
•
•
•
•
In-country logistics for field visits should be in an advanced stage before the team visits the country
Hire data collectors
Vehicles and Drivers
Hotel accommodations
In-country: Data collection
Setting up and customize the tool
• Complete
–
–
–
–
“General Info” - create custom categories to sort data
“Facility Types” – list types of organizations and health facilities to be costed
“Facility List” – list the organizations and health facilities to be costed
“Commodities” sections of tool – enter commodities in the supply chain
– This step can be started before the in-country visit as the health facilities are selected for the
sample size
• Generate surveys
– Generate facility surveys for data collection
Train data collectors
• Hold 2 day training on orientation and training on methodology, data collection, practice completing survey
tool, identifying data sources, discuss administration and logistics
Collect data
• Through key informant interviews and field visits collect cost data
Complete surveys
• During data collection enter cost data into each individual facility survey
Data management and verification
•
•
•
•
When surveys are completed or updated import surveys into tool for analysis
Validate surveys are complete and imported into to tool
Check for missing data
Check for errors in surveys
SEPTEMBER 2013
|
S U P P LY C H A I N C O S T I N G T O O L : U S E R ’ S M A N U A L
|
103
Analysis
Summarize data
• Use “Facility Summary” report and other reports to look at results
Determine total costs
• Use “Summary of Total Costs” report
Determine unit costs
• Use “Detailed SC Function Costs” report
Delivered costs (includes direct supply costs: procurement, storage, transport, and operating costs. Does not
include management labor [quantification, quality assurance, LMIS, and other])
• Use “TDC Calculator” report
Comparisons
• Using results generated from reports compare costs between tiers, different types of facilities, between different
categories such as regions, accessibility, etc. (categories determined during setting up of tool)
• Look at the cost drivers of the supply chain
Extrapolation
• Extrapolate costs out to the national level (if part of SOW)
Reporting
Report
• Costing team writes report summarizing costing results
• Use graphs generated from tool and other figures (see chapter 6 for suggestions on how to present results) for
report
Present findings
• Take data from reports and graphs generated from tool for to present results
Consensus
• Disseminate report and receive feedback
104
|
S U P P LY C H A I N C O S T I N G T O O L : U S E R ’ S M A N U A L
|
SEPTEMBER 2013
Annex 4
Data Sources
The following tables list data sources that can be used to obtain costing information. These may be modified and
provided to potential respondents at facilities to allow them to prepare for the data collection process when they
are visited.
Procurement Costs, Inputs, and Data Sources
Procurement Costs
Input Metric
Data Source
Labor
•
Personnel types
•
Interviews with procurement staff
•
Personnel title or civil service grade
•
•
Personnel LOE spent on supply chainrelated procurement activities (%)
Interview with chief finance officer (CFO) or
equivalent
•
Interview with in-charge of a health facility (if any
commodities are purchased directly by health
facilities)
•
Government civil service pay scale
Fees
•
Customs fees
•
Interview with procurement staff
•
Clearing agent fees
•
Bills of laden, receipts
•
Commodities taxes/duties
•
Insurance
•
Inspection fees at port of origin
•
Handling charges
SEPTEMBER 2013
|
S U P P LY C H A I N C O S T I N G T O O L : U S E R ’ S M A N U A L
|
105
Storage Costs, Inputs, and Data Sources
Storage Costs
Input Metric
Data Source
Labor
•
•
Interviews with storage or warehouse managers and
personnel
•
Interview with CFO or equivalent
•
Interview with in-charge of a health facility
•
Interviews with health facility staff responsible for
logistics management
•
Government civil service pay scale
Storage Space
Equipment
106
|
Personnel types
•
Personnel title or civil service grade
•
Personnel LOE spent on supply chainrelated storage activities (%)
•
Square meter of storage space
•
Interview with CFO or equivalent
•
Length (meters)
•
Interview with in-charge of a health facility
•
Breadth (paces/meters/feet)
•
•
Value per square meter; if no rent
or payments currently made on the
space, then use rent of equivalent
space in equivalent location
Interviews with health facility staff responsible for
logistics management
•
Physically taking measurements of storage space
•
Interviews or records from department physical
infrastructure or equivalent
•
Interviews with storage or warehouse managers and
personnel
•
Financial records and reports
•
Physical inspection of facility
•
Forklifts, etc.
S U P P LY C H A I N C O S T I N G T O O L : U S E R ’ S M A N U A L
|
SEPTEMBER 2013
Transportation Costs, Inputs, and Data Sources
Transport Costs
Input Metric
Data Source
Labor
•
•
Interviews with transportation officer, managers
•
Interviews with regional or district management
officer or in-charge of facility
•
Facility annual financial records and reports
Personnel types
Transport Specific Costs
•
Fuel
•
Interviews with transportation officer, managers
•
Maintenance costs
•
•
Insurance
Interviews with regional or district management
officer or in-charge of facility
•
Other expenses
•
Facility annual financial records and reports
•
Vehicle types
•
Interviews with transportation officer, managers
•
Vehicle cost
•
•
Vehicle age
Interviews with regional or district management
officer or in-charge of facility
•
Depreciation rate
•
Facility annual financial records and reports
Vehicles
Management Costs, Inputs, and Data Sources
Management Costs
Input Metric
Data Source
Labor
•
Personnel types
•
Interviews with procurement staff
•
Personnel title or civil service grade
•
Interview with CFO or equivalent
•
Personnel LOE spent on supply chainrelated procurement activities (%)
•
Interview with in-charge of a health facility (if any
commodities are purchased directly by health
facilities)
•
Government civil service pay scale
Operating Costs
•
Utilities costs
•
Interview with CFO or equivalent
•
Security costs
•
Interview with in-charge of a health facility
•
Building maintenance
•
Interviews with health facility staff responsible for
logistics management
SEPTEMBER 2013
|
S U P P LY C H A I N C O S T I N G T O O L : U S E R ’ S M A N U A L
|
107
Commodity Throughput
108
Commodity Data
Input Metric
Data Source
Value,Volume,Weight
• Annual throughput
• Volume per unit
• Weight per unit
•
•
•
•
•
|
S U P P LY C H A I N C O S T I N G T O O L : U S E R ’ S M A N U A L
|
LMIS
Stock cards
Health facility records
Warehouse records
Product catalogues
SEPTEMBER 2013
Annex 5
Formulae for Supply Chain Costing Metrics
The following equations are used by the SCCT to calculate the supply chain costing metrics discussed in Chapter 6.
Supply Chain Costing Metrics Formulae
Cost per $ of Annual
Pass Through
Definition
Formula
The total cost incurred by a facility when undertaking
all its supply chain functions in terms of the total value
of commodities passing through it in one year.
Total costs incurred by the facility for
all the supply chain functions it
performs in one year ($)
______________________________ x 1,000
Total $ value of ARVs passing through the
facility in one year
Cost per m3 of Annual
Pass Through
The total cost incurred by a facility when undertaking
all its supply chain functions in terms of the total
volume of commodities that pass through it in one
year.
Total costs incurred by the facility for
all the supply chain functions it
performs in one year ($)
______________________________ x 1,000
Total $ value of ARVs passing through the
facility in one year
Procurement Costs
per $ of Annual Pass
Through
Storage Costs per m3 of
Annual Pass Through
The total cost incurred by a facility when undertaking
procurement in terms of the total value of
commodities that pass through it procured in one
year.
Total costs incurred by the facility to conduct
procurement activities in one year ($)
______________________________ x 1,000
The total cost incurred by a facility for storage in
terms of the total volume of commodities that pass
through it procured in one year.
Total costs incurred by the facility to
conduct storage activities in one year ($)
______________________________ x 1,000
Total value of ARVs procured by the facility
in one year ($)
Total volume of ARVs procured by the
facility in one year (m3)
Transportation Costs
per m3 of Annual Pass
Through
The total cost incurred by a facility for transportation
in terms of the total volume of commodities that pass
through it procured in one year.
Total costs incurred by the facility to conduct
transportation activities in one year ($)
______________________________ x 1,000
Total volume of ARVs procured by the
facility in one year (m3)
% of Delivered Goods
Value Required for
Supply Chain Logistics
The total cost incurred by the supply chain activities
as a percentage of the value of (SDP) delivered goods.
Total costs incurred by the supply chain to
deliver a year’s supply of ARVS ($)
______________________________ x 1,000
Total value of ARVs delivered to an SDP in
one year ($)
SEPTEMBER 2013
|
S U P P LY C H A I N C O S T I N G T O O L : U S E R ’ S M A N U A L
|
109
110
|
S U P P LY C H A I N C O S T I N G T O O L : U S E R ’ S M A N U A L
|
SEPTEMBER 2013
For more informstion please visit
deliver.jsi.com
USAID | DELIVER PROJECT
John Snow, Inc.
1616 Fort Myer Drive, 16th Floor
Arlington,VA 22209 USA
Phone: 703-528-7474
Fax: 703-528-7480
Email: [email protected]
Internet: deliver.jsi.com