1
SpiraTest User Manual
Version 1.5
Inflectra Corporation
Date: December 2, 2007
Contents
1. Introduction
1. Introduction
1
2. Functionality Overview
2
2.1. Requirements Management
2
2.2. Test Management
2
2.3. Incident Tracking
2
2.4. Projects and Users
2
2.5. Release Management
3
2.6. Miscellaneous
3
3. User/Project Management
5
3.1. Login Screen
5
3.2. My Page
7
3.3. Global Navigation
8
3.4. Project Home
9
3.5. My Profile
4. Requirements Management
12
13
4.1. Requirements List
13
4.2. Requirement Details
16
5. Test Case Management
20
5.1. Test Case List
20
5.2. Test Case Details
24
5.3. Execute Test Case(s)
30
5.4. Test Run Details
33
6. Incident Tracking
37
6.1. Incident List
37
6.2. Incident Details
39
7. Release Management
42
7.1. Release List
42
7.2. Release Details
45
8. Reports Center
49
8.1. Requirements Reports
50
8.2. Test Case Reports
50
8.3. Incident Reports
52
SpiraTestTM provides an integrated, holistic
Quality Assurance (QA) management solution
that manages requirements, tests and incidents
in one environment, with complete traceability
from inception to completion.
Quality Assurance is a key component of the
Software Development Life-Cycle (SDLC), which
needs to be integrated into the planning and
management of a program or project from its
inception. Too often though, QA is implemented
as Quality Control - whereby testing that the
required functionality works as expected, is
performed at the end, when it is most costly to
make corrections and changes.
To manage QA across a project from day one, it
is imperative that the original requirements are
documented together with the use-cases that
validate the desired functionality. These usecases then form the basis of the test scripts that
can be executed to validate that the functionality
has been correctly built, and that the
requirements have been satisfied. During the
execution of these test scripts, failures may
occur, which are recorded as incidents - either to
be fixed or documented depending on the
severity.
Typically, these activities require people to use
at least three different types of software:
h
Requirements Management
h
Test Script Management
h
Defect / Issue / Bug Tracking
However, this stove-piped approach has many
limitations and drawbacks, most importantly the
fact that there is no traceability between the
different artifacts. How can the project manager
know that all the requirements have been
tested? Conversely, how can the developer
know which test script was responsible for a
recorded bug – needed to accurately reproduce
the issue?
This user manual outlines the features and
functionality available in SpiraTestTM, and
demonstrates how to use the application for
managing the QA processes on a typical project.
© Copyright 2006-2007, Inflectra Corporation
Page 1 of 54
This document contains Inflectra proprietary information
2. Functionality Overview
This section outlines the functionality provided by SpiraTestTM in the areas of requirements
management, test management, incident tracking and project / user management.
2.1. Requirements Management
SpiraTestTM provides the ability to create, edit and delete project scope / requirements in a
hierarchical organization that resembles a typical scope matrix. Each requirement is associated
with a particular importance level (ranging from critical to low) and a status identifier that
designates where the requirement is in the development lifecycle (requested, planned, inprogress and completed). In addition, each requirement is mapped to one or more test cases that
can be used to validate that the functionality works as expected. This mapping is called the
“Requirement Test Coverage”, since the test cases “cover” the requirement so that if all the tests
can be executed successfully, then the requirement is validated.
2.2. Test Management
SpiraTestTM provides the ability to create, edit and delete project test cases that are stored in a
hierarchical folder structure that resembles Windows Explorer ®. Each test case consists of a set
of test steps that represent the individual actions a user must take to complete the test. These
test steps also contain a description of the expected result and any sample data elements that the
tester should use when performing the action. When a user executes a test case, the results are
stored in a test run that contains the success/failure status of each test step as well as the actual
observed result that the tester experienced. In addition each test case is mapped to one or more
requirements that the test is effectively validating, providing the test coverage for the requirement.
During the execution of the test case, each failure can be optionally used to record a new
incident, which can then be managed in the incident tracking module (see below). This provides
complete traceability from a recorded incident to the underlying requirement that was not
satisfied.
2.3. Incident Tracking
SpiraTestTM provides the ability to create, edit, assign, track, manage and close incidents that are
raised during the testing of the software system under development. These incidents can be
categorized into bugs, enhancements, issues, training items, limitations, change requests, and
risks, and each type has its own specific workflow and business rules. Typically each incident is
raised initially as a ‘New’ item of type ‘Incident’. Following the review by the project manager and
customer, they are changed to one of the other specific types, given a priority (critical, high,
medium or low), and status changed to ‘Open’. Once it is assigned to a developer for fixing, it is
changed to status ‘Assigned’.
The developer now works to correct the incident, after which time its status changes to ‘Fixed’ or
‘Not Reproducible’ depending on the actions taken (or not taken). Finally the project manager and
customer verify that it has indeed been fixed, and the status is changed to ‘Closed’. SpiraTestTM
provides robust sorting and filtering of all the incidents in the system, as well as the ability to view
the incidents associated with particular test cases and test runs, enabling drill-down from the
requirements coverage display, right through to the open incidents that are affecting the
requirement in question.
2.4. Projects and Users
SpiraTestTM supports the management of an unlimited number of users and projects, which can
be administered through the same web interface as the rest of the application. All artifacts
© Copyright 2006-2007, Inflectra Corporation
Page 2 of 54
This document contains Inflectra proprietary information
(requirements, tests and incidents) are associated with a particular project, and each user of the
system can be given a specific role for the particular project. So, a power user of one software
project, may be merely an observer of another. That way, a central set of users can be managed
across the enterprise, whilst devolving project-level administration to the manager of the project.
In addition to these administration functions, each user profile and project has its own
personalized dashboard view of all the pertinent and relevant information. This feature reduces
the information overload associated with managing such a rich source of project information, and
allows a single user or project snapshot to be viewable at all times for rapid decision-making.
2.5. Release Management
SpiraTestTM provides the ability to track different versions / releases of the application being
tested. Each project in the system can be decomposed into an unlimited number of specific
project releases, denoted by name and version number. Requirements and Test Cases
developed during the design phase can then be assigned to these different releases. When a
tester executes a series of test cases, they are able to choose the version of the project being
tested and the resulting test run information is then associated with that release. In addition, all
incidents raised during the testing process are associated with this release, allowing the
development team to easily determine which version of the project is affected. Finally as the
incidents are resolved and verified during the testing phase, the appropriate release can be
selected to indicate which release the incident was resolved and/or verified in.
2.6. Miscellaneous
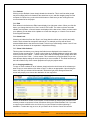
2.6.1. Artifact Relationships
The sections above have outlined the different features and functions available in the system, and
have described the various artifacts managed in the system (e.g. projects, users, requirements,
tests, etc.). To aid in understanding how the information is related, the following diagram
illustrates the relationships between the different artifacts and entities:
With these overall concepts in mind, the rest of this help manual will outline the functionality in
each of the SpiraTestTM screens, and provide specific information on how to manage each of the
© Copyright 2006-2007, Inflectra Corporation
Page 3 of 54
This document contains Inflectra proprietary information
artifacts illustrated above. Note that this manual does not explain the Administration-level
functionality of the system; for that, please refer to the SpiraTestTM Administration Guide.
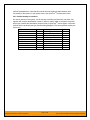
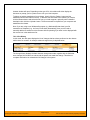
2.6.2. Artifact Naming Conventions
On various screens in the system, you will see lists of artifacts (requirements, test cases, etc.)
together with a unique identification number. In order to make it easier to recognize at a glance
which type of artifact the identification number refers to, SpiraTestTM uses a system of two-letter
prefixes which help identify the type of artifact being displayed. The current prefixes used by the
system are:
Artifact
Project
Requirement
Release
Test Case
Test Step
Test Run
Test Run Step
Incident
Incident Status
© Copyright 2006-2007, Inflectra Corporation
Prefix
PR
RQ
RL
TC
TS
TR
RS
IN
IS
Artifact
Incident Type
Incident Priority
Incident Severity
Workflow
Workflow Transition
Custom Property Values
Project Role
Page 4 of 54
Prefix
IT
IP
IV
WK
WT
PV
RX
This document contains Inflectra proprietary information
3. User/Project Management
This section outlines how you can log into SpiraTestTM, view your personalized home-page that
lists the key tasks that you need to focus on, and drill-down into each of your assigned projects in
a single dashboard view. In addition to your personal homepage, each of your projects has its
own dashboard that depicts the overall project health and status in a single comprehensive view.
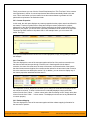
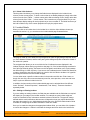
3.1. Login Screen
Upon entering the SpiraTestTM URL provided by your system administrator into your browser, you
will see the following login screen:
You need to enter your given user-name and password into the system in the appropriate boxes
then click the <Log In> button to gain access to the application. Normally you only remain logged
in to the application whilst in active use, and you will be asked to log-in again after either closing
the browser or 20 minutes of inactivity. To prevent this, and stay logged-in to SpiraTestTM
regardless of browser window closing or inactivity, select the “Remember Me” check-box before
clicking the <Log In> button. Note that this setting is specific to each individual computer you are
logging-in from, and that it will be reset when you explicitly log-out with the log-out link (described
in more detail in section 3.3).
If for any reason you are unable to login with the provided username/password combination, and
error message will be displayed. If you cannot remember the correct log-in information, click on
the “Forgot user name / password” link and your password will be emailed to the email address
currently on file.
If you don’t have a SpiraTestTM account setup, clicking on the “Don’t have an account?” link will
take you to a form that you need to fill-in, which will be forwarded to the system administrator,
who will actually create your account.
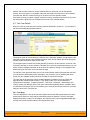
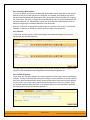
In addition, the system will prevent you logging on to the system with the same username at the
same time on multiple computers. This is to avoid the system getting confused by a user trying to
make contradictory actions at the same time. If for any reason you do try and log in to the system
when you already have an active session in progress, you will see the following screen:
© Copyright 2006-2007, Inflectra Corporation
Page 5 of 54
This document contains Inflectra proprietary information
You have two choices: you can either click the “Log Out” link and try logging in as a different user,
or if you want to log-off any other active sessions (e.g. you closed the browser and the session is
still listed as active), simply click the “Sign Off The Other Locations” link, and you will be logged in
to the application.
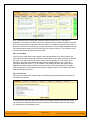
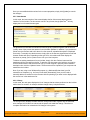
Since SpiraTestTM is licensed to organizations for a specific number of concurrent users – unless
they have purchased an unlimited Enterprise license – only a fixed number of users may be
active at the same time. So, for example if an organization has a five (5) concurrent user license
and a sixth user tries to log-in, they will be presented with the following screen:
This means that one of the other users who is already logged-in, needs to click the “Log Out”
button so that one of the concurrent licenses is freed for your use. If the user has logged out by
closing the browser, the system may not have detected the logout. In this case, the other user
needs to log back in, and then click the “Log Out” link.
© Copyright 2006-2007, Inflectra Corporation
Page 6 of 54
This document contains Inflectra proprietary information
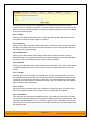
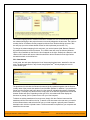
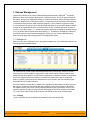
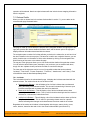
3.2. My Page
Once you have successfully logged in, you will initially be taken to your personalized home page
called “My Page”:
Note that once you have successfully logged-in and chosen a project, SpiraTestTM remembers
this selection, and on subsequent log-ins will automatically select that project, and highlight it for
you in the “My Projects” list (see 3.2.1 below).
Your homepage contains all the information relevant to you consolidated onto a single page for
you to take immediate action. The page typically consists of the following elements:
3.2.1. My Projects
This section lists all the projects you have been given access to, together with the name,
description, web-site and date of creation. To view the description of the project, simply position
the mouse pointer over the link, and a tooltip window will popup containing the description.
When you initially view the page, all of the projects will be shown as links, in normal type, with a
white background. When you click on a project to view, you will be taken to that project’s homepage, and that project will be set as the current project. That project will now appear in your
home-page in bold-type with a yellow background (see above screen-shot). To change the
currently selected project, simply click on the link of another project name.
You can always change your current project by clicking on the drop-down-list of projects
displayed on the global navigation bar to the right of the “Log Out” link.
3.2.2. My Tests
This section lists all the test cases you have been made owner of, across all the different projects
you are a member of. This typically means that the project manager has assigned you to be
responsible for executing the assigned test scripts. To aid in this process, the script name is
displayed, along with its last execution status (failed, passed or not-run) and date of last
execution. This enables you to see how recently the tests have been run, and whether they need
to be re-run.
If you click on the test-name hyperlink, you will be taken to the details page for this test-case (see
section 5.2) and the project that the test-case belongs to will be made your current project. If you
click on the “>Execute” link listed below it will actually launch the test-case in the test-case
execution module (see section 5.3) so that you can easily retest failed cases.
© Copyright 2006-2007, Inflectra Corporation
Page 7 of 54
This document contains Inflectra proprietary information
3.2.3 My Open Incidents
This section lists all the incidents you have been made owner of, across all the different projects
you are a member of. This typically means that the project manager has assigned you to be
responsible for resolving the incident. In the case of a bug, this can mean actually fixing the
problem, whereas for other incident types (e.g. training item) it may mean simply documenting a
workaround. In either event, this section highlights the open incidents you need to manage,
ranked by importance/priority and categorized by type, with the open date displayed to give you a
sense of the age of the incident.
Clicking on the incident name hyperlink takes you to the incident details page (see section 6.2)
that describes the incident in more detail, and allows you to add new information or change its
status to indicate actions taken. In addition, if you position the mouse pointer over the name of
the incident, a more detailed description is displayed as a “tooltip”.
3.3. Global Navigation
Regardless of the page you are on, SpiraTestTM will always display the global navigation bar,
consisting of seven section tabs (My Page, Project Home, Requirements, Releases, Test Cases,
Incidents and Reports) that correspond to the main parts of the system, as well as three
secondary links to “My Profile” and “Log Out” and “Help”. Each of the main sections is described
separately in this manual; however, it is worth noting that the section you’re currently accessing
will always be displayed in a darker color blue that matches the horizontal bar. The main tabs will
take you to the appropriate artifact type (requirement, test case, incident, etc.) for the currently
selected project. However if you haven’t selected a project, then clicking on any of the tabs will
simply take you back to “My Page” so that you can select a project.
3.3.1. Log Out
Clicking on the “Log Out” link will immediately log you out of your current session and return you
to the login page illustrated in section 3.1. If you had set the “Remember Me” option during your
previous login, that setting will be reset; so if you want to avoid having to keep logging-in, you’ll
need to re-check that box during your next log-in.
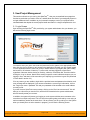
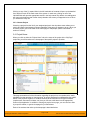
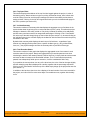
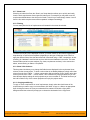
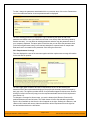
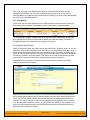
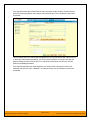
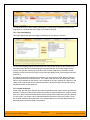
3.3.2. Help
Clicking on this link on any page will bring up the online version of this manual shown below:
© Copyright 2006-2007, Inflectra Corporation
Page 8 of 54
This document contains Inflectra proprietary information
Clicking on any of the [+] expand links in the left hand table of contents will open up the detailed
list of topics for each of the main areas of the system. In each area, clicking on one of the
individual links will open the appropriate section in the help manual. By default, the reading-pane
will open to the help item that is most closely related to the screen you happened to be on when
you clicked the “Help” link.
3.3.3. Choose Project
Choosing a project from the list of your assigned projects in the drop-down-menu allows you to
quickly and easily jump between projects regardless of the page you happen to be on. When you
choose a project, you will be taken to the home page for that project (which is described in
section 3.4 below).
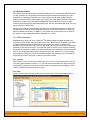
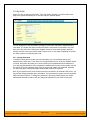
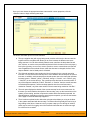
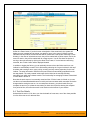
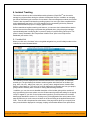
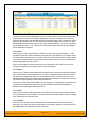
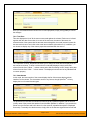
3.4. Project Home
When you click on either the “Project Home” tab or the name of the project in the “My Page”
project list, you will be taken to the homepage of the specific project in question:
This page summarizes all of the information regarding the project into a comprehensive, easily
digestible form that provides a “one-stop-shop” for people interested in understanding the overall
status of the project at a glance. It contains summary-level information for all types of artifact
(requirements, test cases, incidents, etc.) that you can use to drill-down into the appropriate
section of the application. In addition to viewing the project home page, you can choose to filter
by a specific release, to get the homepage for just that release.
Each of the sections that make up the homepage is described below:
© Copyright 2006-2007, Inflectra Corporation
Page 9 of 54
This document contains Inflectra proprietary information
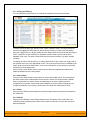
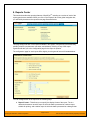
3.4.1. Project Overview
This section displays the name of the project, together with a brief description, the web-site that
points to any additional information about the project, and the names of the owners of the project.
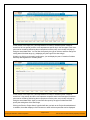
3.4.2. Requirements Summary
This section consists of a summary table that displays the aggregate count of requirements in the
system broken-down by importance (on the x-axis) and status (on the y-axis). This allow the
project manager to determine how many critical vs. low priority enhancements are waiting to be
implemented, vs. actually being implemented. In addition, it makes a distinction between those
requirements simply requested and those actually planned for implementation, so the project
manager can see what the backlog is between the customer’s demands, and the plan in place.
Clicking on the “View Details” link at the top of the table simply brings up the project requirements
list (see section 4.1), whereas clicking on the individual values in the cells will display the
requirements list with the filter set to match the importance and status of the value.
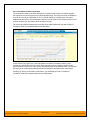
3.4.3. Requirements Coverage
This section consists of a bar graph that displays the aggregated count of requirements test
coverage for the project. The Passed, Failed, Blocked, Caution and Not-Run bars indicate the
total count of requirements that have tests covering them, allocated across the execution status
of the covering tests. For example if a requirement is covered by four tests, two that have passed,
one that has failed and one that has not yet been run, the counts would be passed = 0.5, failed =
0.25 and not-run 0.25. These fractional quantities are then summed across all the requirements
to give the execution status breakdown of the covered requirements.
In addition to the five statuses for the covered requirements, the sixth (“Not Covered”) bar depicts
the total number of requirements that have no tests covering them, putting the five other bars into
perspective. Typically a project is in good health if the “Not Covered” bar is zero, and the count of
“Passed” requirements is greater than “Failed”, “Caution” or “Not Run”. The greatest risk lies with
the “Blocked”, “Not Covered” and “Not Run” status codes, since the severity/quantity of any bugs
lurking within is not yet fully known.
If you position the mouse pointer over any of the four bars, the color of the bar changes slightly
and the underlying raw data is displayed as a tooltip, together with the percentage equivalent.
Clicking on the “View Details” link at the top of the table simply brings up the project requirements
list (see section 4.1).
3.4.4. Requirement Incident Count
This section displays a count of the total number of incidents, and the number of open incidents
mapped against requirements in the system, displayed in an indented list. This section is useful
for determining the parts of the application that have the most instability, as you can look at the
requirements that have yielded the greatest number of incidents. Clicking on any of the
requirements hyperlinks will take you to the detail page for the requirement in question (see
section 4.2).
3.4.5. Top Open Issues
This section displays a breakdown of the top five issues logged against the project, in order of
decreasing priority. Note that items not given a priority are listed at the top, since critical issues
could be lurking in that list, and the project manager will want to immediately review these to
assign priorities. Clicking on the issue item hyperlink will take you to the incident details page for
the issue in question (see section 6.2).
© Copyright 2006-2007, Inflectra Corporation
Page 10 of 54
This document contains Inflectra proprietary information
3.4.6. Top Open Risks
This section displays a breakdown of the top five risks logged against the project, in order of
decreasing priority. Note that items not given a priority are listed at the top, since critical risks
could be lurking in that list, and the project manager will want to immediately review these to
assign priorities. Clicking on the risk item hyperlink will take you to the incident details page for
the risk in question (see section 6.2).
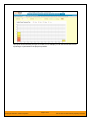
3.4.7. Incident Summary
This section consists of a summary table that displays the aggregate count of incidents in the
system broken-down by priority (on the x-axis) and status (on the y-axis). This allow the project
manager to determine how many critical vs. low priority incidents are waiting to be addressed,
and how many new items need to be categorized and assigned. Clicking on the “View Details”
link at the top of the table simply brings up the incident list (see section 6.1), whereas clicking on
the individual values in the cells will display the incident list with the filter set to match the priority
and status of the value.
By default this summary table displays the total count of all incidents – regardless of type,
however my changing the drop-down list to a specific incident type (e.g. bug, enhancement,
issue, etc.), the project manager can filter the summary table to just items of that type.
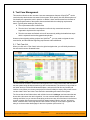
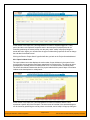
3.4.8. Test Execution Status
This section consists of a bar graph that displays the aggregated count of test cases in each
execution status for the project. Note that this graph does not consider past test-runs when
calculating the totals in each status (Passed, Failed or Not Run), it simply looks at each test-case
and uses the last-run status as the best health indicator. Thus if a test case that previously
passed, has subsequently failed upon re-execution, it will be considered a failure only.
If you position the mouse pointer over any of the three bars, the color of the bar changes slightly
and the underlying raw data is displayed as a tooltip, together with the percentage equivalent.
Clicking on the “View Details” link at the top of the table simply brings up the project test case list
(see section 5.1).
In addition to the bar-chart, there is a also a display of the total number of test runs recorded for
the project, and a list of the five most recent days of recorded test-runs, together with the daily
count.
© Copyright 2006-2007, Inflectra Corporation
Page 11 of 54
This document contains Inflectra proprietary information
3.5. My Profile
When you click on either the “My Profile” link in the global navigation, you will be taken to the
page in the system that allows you to view and edit your personal profile:
You can change your user information including your first-name, last-name, middle-initial and
user-name. The system will check to make sure that the user-name is not already in use, and
warn you if this is the case. Clicking the <Update> button will commit the changes, whereas
clicking <Cancel> returns you back to either “Project Home” or “My Page” depending on whether
you have a project currently selected or not.
3.5.1. Change Password
In addition to being able to update your user information, you can optionally change your
password at the same time. If you check the “Change Password” box, when the <Update> button
is clicked, the system will expect you to have entered your old password and two instances of
your new proposed password. If the old password matches the one stored in the system, and the
two entries of the new password match, then the system will update your password, otherwise
you will simply get a warning message indicating what needs to be corrected.
Note: If your SpiraTest user profile is linked to an account stored in an external LDAP server, you
may find the change password option is disabled. This is because the system uses the password
held in the external server. To change the password in this case, please contact your system
administrator who will be able to help you change the password in your LDAP environment.
© Copyright 2006-2007, Inflectra Corporation
Page 12 of 54
This document contains Inflectra proprietary information
4. Requirements Management
This section outlines how the requirements management features of SpiraTestTM can be used to
develop a requirements / scope matrix for a project, and how you can map any existing testcases to the requirements. Typically when starting a project, developing the requirements list is
the first activity after the Administrator has set up the project in the system.
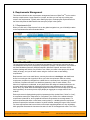
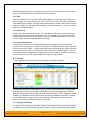
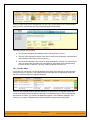
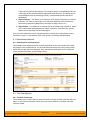
4.1. Requirements List
When you click on the “Requirements” tab on the global navigation bar, you will initially be taken
to the requirements list screen illustrated below:
The requirements list consists of a hierarchical arrangement of the various requirements and
functionalities that need to be provided by the system in question. The structure is very similar to
the Work Breakdown Structure (WBS) developed in Microsoft Project®, and users of that
software package will find this very familiar to use. When you create a new project, this list will
initially be empty, and you will have to start using the <Insert> button to start adding
requirements.
Requirements come in two main flavors: summary items shown in bold-type, and detail items
shown in normal-type with a hyperlink. When you indent a requirement under an existing
requirement, the parent is changed from a detail-item to a summary-item, and when you outdent
a child item, its parent will return to a detail-item (assuming it has no other children). This
behavior is important to understand, as only detail items are assigned a status themselves; the
summary items simply display an aggregate of the worst-case assessment of their children’s
status. Also, only detail items can be mapped against test-cases for test-coverage (thus only they
have hyperlinks), the summary items simply display an aggregate coverage status of their
children.
Each requirement is displayed along with its importance/priority (ranked from “Critical” to “Low”),
its completion status (from “Requested” to “Completed”), the version of the software that the
requirement is planned for, and a graphical indicator that represents its coverage status. For
those requirements that have no test-cases covering them (i.e. validating that the requirement
works as expected) the indicator consists of a yellow solid bar, bearing the legend “Not Covered”.
For those requirements that have at least one test-case mapped against them, they will display
block graph that illustrates the last execution status of each of the mapped test-cases. Thus if the
© Copyright 2006-2007, Inflectra Corporation
Page 13 of 54
This document contains Inflectra proprietary information
requirement is covered by two test cases, one of which passed, and one of which wasn’t run, the
graph will have three green bars (50% passed) and three gray bars (50% not run). Note: The
number of bars has no relation to the number of tests.
To determine the exact requirements coverage information, position the mouse pointer over the
bar-chart, and the number of covering tests, along with the pass/fail/not-run breakdown will be
displayed as a “tooltip”.
4.1.1. Insert
Clicking on the <Insert> button inserts a requirement above the currently selected requirement –
i.e. the one whose check-box has been selected, at the same level in the hierarchy. If you want to
insert a requirement below a summary item, you need to insert it first, then indent it with the
<Indent> button. If you insert a requirement without first selected an existing requirement from the
list, the new requirement will simply be inserted at the end of the list.
Once the new requirement has been inserted, the item is switched to “Edit” mode so that you can
rename the default name and choose a priority, status and/or author.
4.1.2. Delete
Clicking on the <Delete> button deletes all the requirements whose check-boxes have been
selected. If any of the items are summary items, then: if the item is expanded and the children are
visible, the children are simply made children of the item above it in the list, however if the item is
not expanded and the children are hidden, then the children are all deleted. This behavior is
similar to that found in project planning tools like Microsoft Project®. In addition, if all the children
are deleted from a summary item, it changes back into a detail item.
4.1.3. Indent
Clicking on the <Indent> button indents all the requirements whose check-boxes have been
selected. If any of the items are made children of a requirement that had no previous children, it
will be changed from a detail item into a summary item.
4.1.4. Outdent
Clicking on the <Outdent> button de-indents all the requirements whose check-boxes have been
selected. If any of the items were the only children of a summary requirement item, then that item
will be changed back from a summary item to a detail item.
4.1.5. Refresh
Clicking on the <Refresh> button simply reloads the requirements list. This is useful as other
people may be modifying the list of requirements at the same time as you, and after stepping
away from the computer for a short-time, you should click this button to make sure you are
viewing the most current requirements list for the project.
4.1.6. Edit
Each requirement in the list has an <Edit> button display in its right-most column. When you click
this button, you change the item from “View” mode to “Edit” mode. The various columns are made
editable, and <Update> <Cancel> buttons are displayed in the last column. When you have made
your updates, you can either click <Update> to commit the changes, or <Cancel> to revert back
to the original information.
© Copyright 2006-2007, Inflectra Corporation
Page 14 of 54
This document contains Inflectra proprietary information
4.1.7. Show Level
Choosing an indent level from the ‘Show Level’ drop down box allows you to quickly and easily
view the entire requirements list at a specific indent level. For example you may want to see all
requirements drilled-down to the third level of detail. To do this you would simply choose ‘Level 3’
from the list, and the requirements will be expanded / collapsed accordingly.
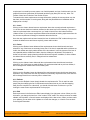
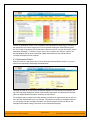
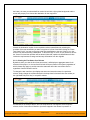
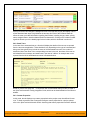
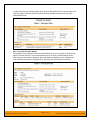
4.1.8. Filtering
You can easily filter the list of requirements as illustrated in the screen-shot below:
To filter the list by any of the displayed columns, you either choose an item from the appropriate
drop-down list or enter a free-text phrase (depending on the type of field) then click <Filter> to
apply the different filters. Note that the name field is searched using a “LIKE” comparison, so that
searching for “database” would include any item with the word database in the name. The other
freetext fields need to be exact matches (e.g. dates, requirement numbers). In the screen-shot
above, we are filtering on Status = Requested.
4.1.9. Show / Hide Columns
This drop-down list allows you to change the fields that are displayed in the requirement list as
columns for the current project. To show a column that is not already displayed, simply select that
column from the list of “Show…” column names and to hide an existing column, simply select that
column from the list of “Hide…” column names. This is stored on a per-project basis, so you can
have different display settings for each project that you are a member of. The fields can be any of
the built-in fields or any of the custom properties set up by the project owner.
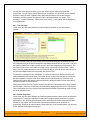
4.1.10. Copying and Moving
To copy or move a requirement or set of requirements, simply select the check-boxes of the
requirements you want to copy or move and then click either <Copy> or <Move> as appropriate.
Upon clicking the button, the rows you selected will be marked in bold with a light yellow
background and the screen will prompt you to choose the destination for the copy/move:
© Copyright 2006-2007, Inflectra Corporation
Page 15 of 54
This document contains Inflectra proprietary information
Choose the destination location for the copied/moved requirements by selecting the checkbox of
the requirement you want to copy/move in front of and then clicking the “Paste Requirements”
link. If you want to copy/move the requirements to the end of the list, you just click the link without
selecting a destination. To abort the copy or move, all you need to do is click the “Cancel” link
and the operation will be aborted. Note that copied requirements will also include the test
coverage information from the originals.
4.2. Requirement Details
When you click on a requirement item in the requirements list described in section 4.1, you are
taken to the requirement details page illustrated below:
This page is made up of three areas; the left pane displays the requirements list navigation, the
top of the right pane displays the details of the selected requirement, and the bottom of the right
pane can display different information related to the requirement.
The navigation pane consists of a link that will take you back to the requirements list, as well as a
list of the peer requirements to the one selected. This latter list is useful as a navigation shortcut;
you can quickly view the coverage information of all the peer requirements by clicking on the
navigation links without having to first return to the requirements list page.
© Copyright 2006-2007, Inflectra Corporation
Page 16 of 54
This document contains Inflectra proprietary information
The top part of the right pane allows you to view and/or edit the details of the particular
requirement. You can edit the various fields (name, description, etc.) and once you are satisfied
with them, simply click the <Update> button just below the fields to commit the changes.
In addition, the bottom part of the right pane can be switched between four views: “Test
Coverage”, “Custom Properties”, “Attachments” and “History”, each of which will be described in
more detail below.
4.2.1. Test Coverage
In this mode, the right pane contains the test coverage information for the requirement in
question:
The pane consists of two lists of test cases, the one on the left being the hierarchical list of the
test cases belonging to the project arranged in test folders (denoted by their gray color). The right
box (which will initially be empty) contains the list of test cases mapped to this requirement. The
test cases in this box are color-coded according to their most recent execution status – red for
failed, green for passed and gray for not-run. Double-clicking on items in this box will jump you to
the test case details screen for this test case (see section 5.2.9).
To change the coverage for this requirement, you use the buttons (Add, Remove, Remove All)
positioned between the two list-boxes. The <Add> button will move the selected test cases from
the list of available on the left to the list of mapped on the right. Similarly the <Remove> and
<Remove All> buttons will remove either the selected or all the test cases from the right list-box
and add them back to the left list-box.
Finally, as a shortcut you can click the “Create Test Case from This Requirement” link to create a
new test case in the list of covered test cases that will be automatically linked to this requirement.
This is useful when you have created a new requirement and want to generate an initial covering
test to be fleshed-out later.
4.2.2. Custom Properties
In this mode, the main pane displays any custom properties that the project owner has defined for
requirements. To learn more about how to setup and configure custom properties for a project,
please refer to the SpiraTest Administration Guide. Assuming that custom properties have been
defined for your project, you will see a list of optional parameters that can be set on the
requirement. These can be either freetext or drop-down-lists. In the example below, you can enter
a URL, difficulty and/or Requirement Type.
© Copyright 2006-2007, Inflectra Corporation
Page 17 of 54
This document contains Inflectra proprietary information
Once you are satisfied with the values for the custom properties, simply click [Update] to commit
the changes.
4.2.3. Attachments
In this mode, the main pane displays the list of documents that have been “attached” to the
requirement. The documents can be in any format, though SpiraTestTM will only display the icon
for certain known types.
The attachment list includes the filename that was originally uploaded together with the file-size
(in KB), name of the person who attached it and the date uploaded. In addition, if you position the
pointer over the filename and hold it there for a few seconds, a detailed description is displayed
as a tooltip. To actually view the document, simply click on the filename hyperlink and a new web
browser window will open. Depending on the type of file, this window will either display the
document or prompt you for a place to save it on your local computer.
To delete an existing attachment from a requirement, simply click the <Delete> button and the
attachment will be removed from the list. To attach a new document to the requirement, you need
to click the Browse button and select the file from your local computer, optionally enter a detailed
description then click the <Upload> button. The document will be copied from your computer and
attached to the requirement.
Note: If you are using a non-Windows® computer (e.g. Macintosh®) that doesn’t put file
extensions on filenames (e.g. .xls for an Excel sheet) automatically, then you will need to
manually add the file extension to the filename before uploading if you want it to be displayed with
the correct icon in the attachment list.
© Copyright 2006-2007, Inflectra Corporation
Page 18 of 54
This document contains Inflectra proprietary information
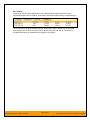
4.2.4. History
In this mode, the main pane displays the list of changes that have been performed on the
requirement artifact since its creation. An example requirement change history is depicted below:
The change history displays the date that each change was made, together with the fields that
were changed, the old and new values and the person who made the change. This allows a
complete audit trail to be maintained of all changes in the system.
© Copyright 2006-2007, Inflectra Corporation
Page 19 of 54
This document contains Inflectra proprietary information
5. Test Case Management
This section outlines how the use-case / test-case management features of SpiraTestTM can be
used to develop the business use-cases for the system, which specify how the different pieces of
functionality are expected to work in practice. In addition, these use/test-cases form the basis of
the business specification of the system when associated with the underlying requirements
matrix. Typically when starting a new project:
h
The requirements matrix is entered first
h
Then the list of use-cases is developed to outline the key scenarios that need to
supported to implement the requirement
h
Then the use-cases are fleshed out into full test-cases by adding the detailed test-steps
with the expected result and suggested sample-data
However when migrating existing projects into SpiraTestTM, you may need to migrate the testcase list first, and then add the supporting requirements matrix afterwards.
5.1. Test Case List
When you click on the “Test Cases” tab on the global navigation bar, you will initially be taken to
the test case list screen illustrated below:
The test case list consists of a hierarchical arrangement of the various test folders and test cases
that the system being developed needs to be able to demonstrate. The structure is very similar to
the folder structure in Microsoft Windows® Explorer, and users will find this very familiar and
intuitive to use. When you create a new project, this list will initially be empty, and you will have to
use the <New Folder> and <New Test> buttons to start adding test-cases to the system.
The list consists of test folders shown with a folder icon and in bold-type, and test cases that are
shown with a document icon and a hyperlink. You can nest test folders and test cases under an
existing test folder, but you cannot nest anything under a test case. All of the items in the list have
a name, together with the most recent execution status (passed, failed or not-run), and owner,
author, execution date, active flag and test case number. Clicking on a test case’s hyperlink will
take you to the test case details page for the item in question (see section 5.2).
© Copyright 2006-2007, Inflectra Corporation
Page 20 of 54
This document contains Inflectra proprietary information
It is important to understand that only test cases are assigned a status themselves; the test
folders instead display a block “LED-style” graph that illustrates the aggregate execution status of
its child test-cases. Thus if the test folder contains two test cases, one of which passed, and one
of which wasn’t run, the graph will have three green bars (50% passed) and three gray bars (50%
not run). Note: The number of bars has no relation to the number of tests.
To determine the exact aggregate test folder execution status information, position the mouse
pointer over the bar-chart, and the number of tests in each of the execution statuses (passed,
failed, not-run, blocked, caution) will be displayed as a “tooltip”. Note that if you change the owner
of a test folder, then all the child test cases will be assigned the same owner. This allows you to
more easily associate entire folders to test cases to be executed by a specific user.
5.1.1. New Test
Clicking on the <New Test> button inserts a test case above the currently selected test case – i.e.
the one whose check-box has been selected, at the same level in the hierarchy. If you want to
insert a new test case below an existing test case, you need to select the test folder below it. If
you insert a new test case without first selected an existing item from the list, the new test case
will simply be inserted at the end of the list.
Once the new test case has been inserted, the item is switched to “Edit” mode so that you can
rename the default name and choose an owner and/or author. Note that all new test cases are
initially set with an execution status of “Not Run”.
5.1.2. New Folder
Clicking on the <New Folder> button inserts a test folder above the currently selected test folder –
i.e. the one whose check-box has been selected, at the same level in the hierarchy. The new
folder is automatically populated with a single default test case. If you want to insert a new test
folder below an existing test folder, you need to select the test folder below it. If you insert a new
test folder without first selected an existing item from the list, the new test folder will simply be
inserted at the end of the list of test folders, but before any of the test cases. Note that in a test
folder, all of the child test folders are always displayed before any of the actual test cases.
Once the new test folder has been inserted, the item is switched to “Edit” mode so that you can
rename the default name and choose an owner and/or author.
5.1.3. Delete
Clicking on the <Delete> button deletes all the test cases and/or test folders whose check-boxes
have been selected. If any of the items are test folders, then all the children are all deleted
(whether test cases or folders). This behavior is similar to that in Microsoft Windows® Explorer.
Note that you cannot delete all the test cases in a test folder; at least one test case needs to be
left in the folder, the system will warn you if you try to do this.
5.1.3. Execute
Clicking on the <Execute> button executes all the test cases selected, together with all the test
cases contained with any selected test folders. The test execution functionality of SpiraTestTM is
explained in more detail in section 5.3.
5.1.4. Refresh
Clicking on the <Refresh> button simply reloads the test case list. This is useful as other people
may be modifying the list of test cases at the same time as you, or executing specific test cases,
© Copyright 2006-2007, Inflectra Corporation
Page 21 of 54
This document contains Inflectra proprietary information
and after stepping away from the computer for a short-time, you should click this button to make
sure you are viewing the most current test case list for the project.
5.1.5. Edit
Each test case/folder in the list has an <Edit> button display in its right-most column. When you
click this button, you change the item from “View” mode to “Edit” mode. The various columns are
made editable, and <Update> <Cancel> buttons are displayed in the last column. When you have
made your updates, you can either click <Update> to commit the changes, or <Cancel> to revert
back to the original information.
5.1.6. Show Level
Choosing an indent level from the ‘Show Level’ drop down box allows you to quickly and easily
view the entire test case list at a specific indent level. For example you may want to see all test
cases drilled-down to the third level of detail. To do this you would simply choose ‘Level 3’ from
the list, and the test cases will be expanded accordingly
5.1.7. Show / Hide Columns
This drop-down list allows you to change the fields that are displayed in the test case list as
columns for the current project. To show a column that is not already displayed, simply select that
column from the list of “Show…” column names and to hide an existing column, simply select that
column from the list of “Hide…” column names. This is stored on a per-project basis, so you can
have different display settings for each project that you are a member of. The fields can be any of
the built-in fields or any of the custom properties set up by the project owner.
5.1.8. Filtering
You can easily filter the list of test cases as illustrated in the screen-shot below:
To filter the list by any of the displayed columns, you either choose an item from the appropriate
drop-down list or enter a free-text phrase (depending on the type of field) then click <Filter> to
apply the different filters. Note that the name field is searched using a “LIKE” comparison, so that
searching for “database” would include any item with the word database in the name. The other
freetext fields need to be exact matches (e.g. dates, test case numbers). In the screen-shot
above, we are filtering on Execution Date = 01-Dec-2003.
5.1.9. Copying and Moving
To copy or move a test case or test folder, simply select the check-boxes of the test cases/folders
you want to copy or move and then click either <Copy> or <Move> as appropriate. Upon clicking
© Copyright 2006-2007, Inflectra Corporation
Page 22 of 54
This document contains Inflectra proprietary information
the button, the rows you selected will be marked in bold with a light yellow background and the
screen will prompt you to choose the destination for the copy/move:
Choose the destination location for the copied/moved test cases/folders by selecting the
checkbox of the test case/folder you want to copy/move in front of and then clicking the “Paste
Test Cases” link. If you want to copy/move the test cases/folders to the end of the list, you just
click the link without selecting a destination. To abort the copy or move, all you need to do is click
the “Cancel” link and the operation will be aborted. Note that copied test cases/folders will also
include the requirements coverage and test step information from the originals.
5.1.10. Viewing the Test Status for a Release
By default, when you view the list of test case cases, it will display an aggregate status for all
releases of the project. I.e. the test list will include all the test cases in the system (regardless of
which release they apply to) and the execution status will reflect the most recent test run –
regardless of which release it was for.
To change the test case list to just display test cases and execution status for a particular
release, simply change the release selected in the drop-down list located below the toolbar (on
the right-hand side) from “Any” to a specific release:
As illustrated in the example above, when the drop-down list is changed to select a specific
release, the list of test cases is filtered to just those mapped to the release in question. In
© Copyright 2006-2007, Inflectra Corporation
Page 23 of 54
This document contains Inflectra proprietary information
addition, the execution status for the test releases will only reflect test runs for that specific
release. As can be seen in our example, many test cases that have been run for other releases
now show the “Not Run” status since they’ve not been run for this specific release.
As a shortcut, when you select a specific release for viewing, subsequent execution of any of the
test cases via the [Execute] icon will default the test run to the selected release.
5.2. Test Case Details
When you click on a test case item in the test case list described in section 5.1, you are taken to
the test case details page illustrated below:
This page is made up of three areas; the left pane is the navigation window, the upper part of the
right pane contains the test case detailed information itself, and the bottom part of the right pane
contains related information about the test case.
The navigation pane consists of a link that will take you back to the test case list, as well as a list
of the peer test case to the one selected. This latter list is useful as a navigation shortcut; you can
quickly view the detailed information of all the peer test cases by clicking on the navigation links
without having to first return to the test cases list page.
The top part of the right pane allows you to view and/or edit the details of the particular test case.
You can edit the various fields (name, description, etc.) and once you are satisfied with them,
simply click the <Update> button just below the fields to commit the changes.
The lower part of the right pane can be switched between six different views by clicking the
appropriate tab. Initially the pane will be in “Test Steps” mode, but it can be switched to
“Requirements Coverage”, “Custom Properties”, “Test Runs”, “Releases”, “Attachments” and
“History” modes if so desired. Each of the views is described separately below. In addition there
is a shortcut link “Execute This Test” that allows you to execute this test (see section 5.3) without
having to return to the Test Case list.
5.2.1. Test Steps
This view displays the name of the test case together with all the defined test steps that a tester
would need to perform to verify that the functionality works as expected. The list of test steps
displays the position number, the description, the expected result, some suggested sample data
and the most recent execution status of the individual test step.
© Copyright 2006-2007, Inflectra Corporation
Page 24 of 54
This document contains Inflectra proprietary information
Note: Test steps that are marked with a hyperlink and test case icon (e.g. “Call Login to
Application” in the screen shot above) are in fact linked test cases. Linked test cases are a useful
way of reusing existing test steps from other test cases. For example if you want to have a set of
steps be in more than one test case (e.g. a login step) then you would create a separate test case
just containing these steps, then have all the other test cases just link to it. This avoids the need
to have duplicate test steps throughout the project.
5.2.1.1. Insert Step
Clicking on the <Insert Step> button inserts a new test step before the currently selected (by
means of the check-box) test step. Clicking the <Insert Step> button without selecting a test step
will insert a new step at the end of the list. All test steps are displayed in “Edit” mode, so the
description, expected result and sample data fields are editable, allowing you to enter the
appropriate data (see section 5.2.7). In addition to the existing test steps, the system always
displays five blank test steps so that it is easy and quick to enter large numbers of test steps.
Upon entering up to five test steps and clicking the <Update> button, five new blank rows will be
added at the bottom of the list.
5.2.1.2. Insert Link
Clicking on the <Insert Link> button brings up the following panel that allows you to choose the
test case to be inserted:
You need to then select the name of the test case you want to insert as a link and click <Next>. If
the test case has declared parameters (see the section on Parameters below for more details)
you will be taken to the following screen:
© Copyright 2006-2007, Inflectra Corporation
Page 25 of 54
This document contains Inflectra proprietary information
You need to fill out the values of the parameters for the linked test case and then click the
<Insert> button to complete the operation. The system will then insert the test case as a link just
before the currently selected test step. If no existing test step was selected, the link will be added
at the end of the test step list.
5.2.1.3. Delete
Clicking on the <Delete> button deletes the currently selected test steps, and reorders the test
step position numbers to close any gaps in numbering.
5.2.1.4. Move Up
Clicking on the <Move Up> button simply reorders the test step list so that the currently selected
test step is one position higher up the list. Note: Attempting to move a test step above the top of
the list will give a warning message.
5.2.1.5. Move Down
Clicking on the <Move Down> button simply reorders the test step list so that the currently
selected test step is one position lower down the list. Note: Attempting to move a test step below
the bottom of the list of existing test steps will give a warning message.
5.2.1.6. Refresh
Clicking on the <Refresh> button simply reloads the list of test steps. This is useful if other people
are making changes to the test list and you want to make sure that you have the most current
version.
5.2.1.7. Update
Each test step in the list is always in an editable mode. When you click this button, you commit
any changes made to the test step list. These changes consist of modifying an existing test step
or entering a new test step in one of the five blank rows. The delete/insert/move-up/move-down
operations on the other hand are committed immediately, and do not need to have the <Update>
button clicked for them to take effect.
5.2.1.8. Cancel
If during the entry of new test steps or the modification of existing test steps, you want to revert
back to the original information, click <Cancel> and your changes will be discarded.
5.2.1.9. Parameters
Test cases can have parameters associated with them. This enables one test case to be called
several times by another test case (as a link) and have different parameters passed in each case,
making the operation different. E.g. you could have a generic “login to application” test case that
others call as an initial step, which could be provided with different login information depending on
the calling test case.
© Copyright 2006-2007, Inflectra Corporation
Page 26 of 54
This document contains Inflectra proprietary information
To view / change the parameters associated with the current test case, click on the <Parameters>
icon in the toolbar and the list of current parameters will be displayed:
The list of existing parameters is displayed in a grid, followed by the option to add a new
parameter and default value (used when the test case is run directly rather than being called by
another test case). You can delete an existing parameter and also copy the parameter token to
your computer’s clipboard. The latter option is useful so that you can insert the parameter token
(in the format ${parameter name}) in the test step description, expected result or sample data
fields and have it converted into the parameter value during test execution.
5.2.2. Requirements Coverage
This view displays the name of the test case together with the requirements coverage information
for the test case in question:
The main (right) pane consists of two lists of requirements, the one on the left being the
hierarchical list of the requirements belonging to the project (the summary items are denoted by
their gray color). The right box contains the list of requirements mapped to this test case. Doubleclicking on items in this box will jump you to the requirements details screen for this requirement
(see section 4.2).
To change the coverage for this test case, you use the buttons (Add, Remove, Remove All)
positioned between the two list-boxes. The <Add> button will move the selected requirements
from the list of available on the left to the list of mapped on the right. Similarly the <Remove> and
<Remove All> buttons will remove either the selected or all the requirements from the right listbox and add them back to the left list-box.
© Copyright 2006-2007, Inflectra Corporation
Page 27 of 54
This document contains Inflectra proprietary information
Finally, as a shortcut you can click the “Create Requirement from This Test Case” link to create a
new requirement in the list of covered requirements that will be automatically linked to this test
case. This is useful when you have created a new test case and want to generate an initial
placeholder requirement to be fleshed-out later.
5.2.3. Custom Properties
In this mode, the main pane displays any custom properties that the project owner has defined for
test cases. To learn more about how to setup and configure custom properties for a project,
please refer to the SpiraTest Administration Guide. Assuming that custom properties have been
defined for your project, you will see a list of optional parameters that can be set on the test case.
These can be either freetext or drop-down-lists. In the example below, you can enter a URL
and/or Test Type.
Once you are satisfied with the values for the custom properties, simply click [Update] to commit
the changes.
5.2.4. Test Runs
This view displays the name of the test case together with a list of the previous execution runs
that the test case has been put through. Each test run is listed together with the date of
execution, the name of the test case, the name of the tester, the release/version of the system
that the test was executed against, the overall execution status for the test case in that run and a
link to the actual test run details (see section 5.4). In addition, you can choose to display any of
the custom properties associated with the test run.
The “customize columns” drop-down list allows you to change the fields that are displayed in the
test run list as columns. To show a column that is not already displayed, simply select that
column from the list of “Show…” column names and to hide an existing column, simply select that
column from the list of “Hide…” column names. The displayed columns can be any standard field
or custom property.
5.2.5. Release Mapping
This view displays the name of the test case together with the release mapping information for
the test case in question:
© Copyright 2006-2007, Inflectra Corporation
Page 28 of 54
This document contains Inflectra proprietary information
The release mapping section consists of two lists of releases, the one on the left being the list of
the releases belonging to the project that are not currently mapped to the test case. The right box
contains the list of releases currently mapped to this test case. Double-clicking on items in this
box will jump you to the release details screen for this requirement (see section 7.2).
To change the release mapping for this test case, you use the buttons (Add, Remove, Remove
All) positioned between the two list-boxes. The <Add> button will move the selected releases
from the list of available on the left to the list of mapped on the right. Similarly the <Remove> and
<Remove All> buttons will remove either the selected or all the releases from the right list-box
and add them back to the left list-box.
5.2.6. Attachments
In this mode, the main pane displays the list of documents that have been “attached” to the test
case. The documents can be in any format, though SpiraTestTM will only display the icon for
certain known types.
The attachment list includes the filename that was originally uploaded together with the file-size
(in KB), name of the person who attached it and the date uploaded. In addition, if you position the
pointer over the filename and hold it there for a few seconds, a detailed description is displayed
as a tooltip. To actually view the document, simply click on the filename hyperlink and a new web
browser window will open. Depending on the type of file, this window will either display the
document or prompt you for a place to save it on your local computer.
To delete an existing attachment from a test case, simply click the <Delete> button and the
attachment will be removed from the list. To attach a new document to the test case, you need to
click the Browse button and select the file from your local computer, optionally enter a detailed
description then click the <Upload> button. The document will be copied from your computer and
attached to the test case.
© Copyright 2006-2007, Inflectra Corporation
Page 29 of 54
This document contains Inflectra proprietary information
Note: If you are using a non-Windows® computer (e.g. Macintosh®) that doesn’t put file
extensions on filenames (e.g. .xls for an Excel sheet) automatically, then you will need to
manually add the file extension to the filename before uploading if you want it to be displayed with
the correct icon in the attachment list.
5.2.7. View History
In this mode, the main pane displays the list of changes that have been performed on the test
case artifact since its creation. An example test case change history is depicted below:
The change history displays the date that each change was made, together with the fields that
were changed, the old and new values and the person who made the change. This allows a
complete audit trail to be maintained of all changes in the system.
5.3. Execute Test Case(s)
When you select test cases on the test case list page and click the <Execute> button, or click the
“Execute” link on the test cases listed under My Tests on your personalized home page, you are
launching the test execution module with the selected test cases. This section describes how a
tester can follow the steps defined for a series of test cases and record what actually happened in
the process. In addition, recorded failures of test cases can be used to automatically generate
new incidents that will be added to the incident tracking module (see section 6).
Regardless of the route taken to launch the test execution module, the screen that will be
displayed will look like the following:
Before actually executing the test scripts, you need to select the release of the system that you
will be testing against and any test run custom properties that have been defined by the project
owner. This ensures that the resulting test runs and incidents are associated with the correct
release of the system, and that the test runs are mapped to the appropriate custom properties
(e.g. operating system, platform, browser, etc.). If you have not configured any releases for the
project, then the release drop-down list will be disabled and the test runs/incidents will not be
associated with any particular release.
© Copyright 2006-2007, Inflectra Corporation
Page 30 of 54
This document contains Inflectra proprietary information
Once you have chosen the appropriate release name and/or custom properties, click the
<Submit> button to begin executing test steps:
The screen is divided up into four main elements:
h
The top navigation bar (with a gray background) contains a link back to the test case list
together with the navigation that allows you to move between the different test cases
being executed. You can either directly select the test case from the drop-down list and
click <Select> or use the movement buttons (that look like the buttons on a music player);
from left to right they: move to first, move to previous, move to next and move to last test
case. Regardless of the method chosen, when the test case is changed, the list of teststeps available in the left hand pane is refreshed.
h
The left-hand navigation pane contains the list of test steps for the currently executing
test case. You can click on the test step link to move between the test steps in the current
test case. In addition, each test step has a colored square next to the name that indicates
its status (green = “Passed”, yellow = “Blocked”, orange = “Caution”, red = “Failed”, gray
= “Not Run”) in the current test run. The overall test case also has an execution status. If
any of the steps are marked as “Failed”, ”Blocked”, or “Caution” then the overall test case
is marked with that status; if all the test steps passed, then the overall test case is
marked as “Passed”; any other case results in the test case being marked as “Not Run”.
h
The main pane displays the details of the current test step for the current test case. As
the tester you would read the description of the test step, carry out the instructions on the
system you are testing, and then compare the results with those listed as expected. As
described below, depending on how the actual system responds, you will use the buttons
on the page to record what actually happened.
h
There is also an optional section below the main pane that allows you to log an incident
in the system associated with the test step. For failures this will typically be used to log a
bug relating to the failure. However even if you pass a step you can still log an incident,
which may be useful for logging non-critical cosmetic items that are not serious enough
for a failure to be recorded.
© Copyright 2006-2007, Inflectra Corporation
Page 31 of 54
This document contains Inflectra proprietary information
If the expected results are indeed observed, then you simply need to click the <Pass> button to
mark the test step as passed, and advance to the next test step. This is illustrated in the screen
shot below:
This will change the icon in the left-hand navigation bar into a green square with a check mark in
it. Once all the test steps have passed, you will now have the option of moving to the next test
step by clicking the <Next Test> button; if it is the last test case being executed, the <Finish>
button will be displayed instead.
If the actual results differ from those expected, you need to enter a description of the result
observed and click the <Fail>, <Blocked> or <Caution> button; this is illustrated in the screenshot below:
© Copyright 2006-2007, Inflectra Corporation
Page 32 of 54
This document contains Inflectra proprietary information
Unlike the <Pass> button, if you don’t enter a description of the actual result, the system will
display an error message and re-prompt you again for input. In the case of a failure, both the
individual test step and the overall test case will be marked with a red square containing a cross.
Similarly, in the case of a blocked test case, they will be marked with a yellow square, and in the
case of a caution, they will be marked with an orange square. You will now have the option of
moving to the next test step by clicking the <Next Test> button; if it is the last test case being
executed, the <Finish> button will be displayed instead.
In addition to logging the failure, you can optionally choose to have the failure result in a new
incident be automatically created. This is achieved by selecting the “Log an Incident for this step”
checkbox and entering a name, type, priority, severity (and any custom properties) for the new
incident. The other information needed for the new incident is automatically populated from the
test step details. The newly created incident will also be linked to the test step, allowing
traceability from within the incidents module. The functionality for managing incidents is described
in more detail in section 6.
Note that the entire test run is not actually saved until the <Finish> button is clicked, so you can
use the move forward/backward buttons to revisit previous test cases and/or test steps and make
changes before saving the test run. As a consequence however, you should make sure you
complete the test run (or at least the test-cases you have time for) before leaving the computer
for a period of time; this will ensure work is not lost due to the timeout of your session.
5.4. Test Run Details
As described in section 5.2.8, when you view the details of a test case, one of the views possible
is to list all the test runs for that test case:
© Copyright 2006-2007, Inflectra Corporation
Page 33 of 54
This document contains Inflectra proprietary information
When you click on any of the individual test runs in the list, you are taken to the Test Run details
page (not to be confused with the Test Case details page!) shown below:
This page consists of three panes:
h
The left hand navigation pane displays a list of the last fifteen (15) runs
h
The main pane displays the details of the test run itself (name, description, estimated and
actual duration, tester name, test run type, etc.)
h
The tab-control displays the list of test run steps (populated if a manual run executed by a
user), the stack trace (populated if an automated run executed by an automated testing
tool such as NUnit, JUnit, etc.), and any custom properties set for the run.
5.4.1. Test Run Steps
In the case of a manual test run, this tab displays all the steps of the test case as they appeared
during the test run in question. This means that if the test steps were changed after running the
test, the list here will reflect the original information.
Each test step is displayed along with the description, expected result, suggested sample data,
actual result and the execution status for this step in this particular test run. Where the test-step
was listed as a “Failure” you will have an additional hyperlink “View Incidents” displayed. This
allows you to view any incidents that are associated with this particular test step failure:
© Copyright 2006-2007, Inflectra Corporation
Page 34 of 54
This document contains Inflectra proprietary information
Clicking on the link will change the background color of the test case to gray and display a list of
all the associated test steps in a grid below the test step list. Each of the incidents listed will
reflect the most up-to-date information regarding that incident, including its type, status, priority,
name, assigned owner, detection date and who first detected it. Clicking on the incident number
hyperlink will take you to the details page for that incident, which is described in section 6.2.
5.4.2. Stack Trace
In the case of an automated test run, this tab will display the details of the test run as reported
from the test runner application. These details will vary depending on the type of automated tool
being used, but typically they include the name of the automated test runner, the number of
assertions raised, the name of the corresponding test case in the tool, the status of the test run
and a detailed error message, and stack-trace in the case of a failure. An example test run as
reported from the NUnit automated test runner is illustrated below:
Details on how to use SpiraTestTM in conjunction with an automated testing tool are provided in
the SpiraTest Automated Testing Integration Guide, which can be downloaded from the Inflectra
website.
5.4.3. Custom Properties
In this mode, the tab displays any custom properties that the project owner has defined for test
runs. To learn more about how to setup and configure custom properties for a project, please
refer to the SpiraTest Administration Guide. Assuming that custom properties have been defined
© Copyright 2006-2007, Inflectra Corporation
Page 35 of 54
This document contains Inflectra proprietary information
for your project, you will see a list of optional parameters that have been set during the test run:
For test runs, custom properties are most commonly used to capture and record the system
configuration that the test was performed on – for example the operating system, hardware
platform, web-browser.
© Copyright 2006-2007, Inflectra Corporation
Page 36 of 54
This document contains Inflectra proprietary information
6. Incident Tracking
This section outlines how the incident/defect tracking features of SpiraTestTM can be used to
manage key project artifacts during the software development lifecycle. In addition to managing
the defects raised during the execution of test cases in the test management module, the Incident
Tracker is also a powerful risk/issue/bug tracking system in its own right. When coupled with the
project dashboard (see section 3.4) it is a powerful tool for representing all the key risks and
issues associated with a project in a single, graphical format.
Unlike a standalone bug/issue tracking tool however, you can trace the incidents/defects back to
the test case and the underlying requirement that generated them, giving the project manager
unprecedented power in analyzing the “in-process” quality of a system during its lifecycle. This
power is clearly illustrated in the “Requirement Incident Count” pane in the Project Home
dashboard (see section 3.4.4).
6.1. Incident List
When you click on the “Incidents” tab on the global navigation bar, you will initially be taken to the
incidents list screen illustrated below:
The incident list screen displays all the incidents entered for the current project, in a filterable,
sortable grid. The grid displays the incident number together with fields such as incident type
(bug, issue, risk, etc.), status (new, open, etc.), priority, name, assigned owner, detection date,
detector, closed date, etc. The choice of columns displayed is configurable per-user, per-project,
giving extensive flexibility when it comes to viewing and searching incidents.
In addition, you can view a more detailed description of the incident (along with a resolution if
any) by positioning the mouse pointer over the incident name hyperlink and waiting for the popup
“tooltip” to appear. If you click on the incident name hyperlink, you will be taken to the incident
details page described in section 6.2. Clicking on any of the pagination links at the bottom of the
page will advance you to the next ten incidents in the list according to the applied filter and sortorder. There is also a drop-down-list at the bottom of the page which allows you to specify how
many rows should be displayed in each page, helping accommodate different user preferences.
© Copyright 2006-2007, Inflectra Corporation
Page 37 of 54
This document contains Inflectra proprietary information
6.1.1. Sorting and Filtering
You can easily filter and sort the list of incidents as illustrated in the screen-shot below:
To filter the list by incident type, status, priority, owner or detector name, you simply choose an
item from the appropriate drop-down list, and for the other fields, you enter a free-text phrase
then click <Apply Filters> to apply the different filters. Note that the name field is searched using a
“LIKE” comparison, so that searching for “database” would include any item with the word
database in the name. The other freetext fields need to be exact matches (e.g. dates, incident
numbers).
To change the column that is sorted, or to change the direction of the current sort, simply click on
the up/down arrow icon in the appropriate column. The currently sorted column is indicated by the
larger, white arrow with the back-border. In the screen-shot above, we are filtering on type=bug
and sorting by decreasing priority.
Clicking on the <Clear Filters> button removes any set filters and expands the incident list to
display all incidents for the current project.
6.1.2. New Incident
Clicking on the <New Incident> button takes you to the new incident screen. This is essentially
the same screen as the incident details screen shown in section 6.2 except that the <Update>
button is replaced by an <Insert> button, and depending on how the workflow has been
configured for your project, certain fields may be disabled. For more details on setting and up
configuring workflow for your project, please refer to the SpiraTest Administration Guide.
6.1.3. Delete
Clicking on the <Delete> button deletes the incidents whose check-boxes have been selected in
the incident list.
6.1.4. Refresh
Clicking on the <Refresh> button simply reloads the list of incidents; this is useful when new
incidents are being added by other users, and you want to make sure you have the most up-todate list displayed.
© Copyright 2006-2007, Inflectra Corporation
Page 38 of 54
This document contains Inflectra proprietary information
6.1.5. Show / Hide Columns
This drop-down list allows you to change the fields that are displayed in the incident list as
columns for the current project. To show a column that is not already displayed, simply select that
column from the list of “Show…” column names and to hide an existing column, simply select that
column from the list of “Hide…” column names. This is stored on a per-project basis, so you can
have different display settings for each project that you are a member of. The fields can be any of
the built-in fields or any of the custom properties set up by the project owner.
6.2. Incident Details
When you click on an incident item in the incident list, or click the <New Incident> button (as
described in section 6.1), you are taken to the incident details page illustrated below:
This page is made up of two areas; the top navigation bar (with the gray background) that allows
you move between incidents, and the main pane (yellow background) that contains the details of
the incident in question.
The navigation bar allows you to move within the list of incidents that were displayed in the
incident list page, without having to go back to that page. So, if the incident list page contained a
list of all bugs sorted by priority, the buttons on this navigation would allow you to cycle between
the different bugs, in order of priority. If you want to view incidents that are outside this filtered list,
or want to change the way they are sorted, you need to click the “Back to Incident List” hyperlink
and change the filter/sort on the incident list page.
You can either enter a specific incident number in the text-box and click the <Find> button, or
simply click one of the four movement buttons (move first, move previous, move next and move
last) to cycle to a different incident in the list.
In addition, the lower section of the incident details page can be switched been four different
views: “General”, “Custom Properties”, “Attachments”, and “History”. These are described
separately below.
6.2.1. Editing an Existing Incident
If you are editing an existing incident, the fields that are available and the fields that are required
will depend on your stage in the incident workflow. For example an open incident might not
require a “Resolved Version” whereas a resolved incident could well do. The types of change
allowed and the email notifications that are sent will depend on how your project administrator
has setup the system for you. Administrators should refer to the SpiraTest Administration Guide
for details on configuring the incident workflows to meet their needs.
Once you’ve made the changes to the appropriate incident fields, you can either click <Update>
to commit the changes or <Cancel> to discard the changes and return back to the incident list.
© Copyright 2006-2007, Inflectra Corporation
Page 39 of 54
This document contains Inflectra proprietary information
6.2.2. Inserting a New Incident
If you are creating a new incident, the fields that are available and the fields that are required will
depend on how your project has been for configured. For example, some projects may require
that all incidents be started with Status=New and Type=Incident, others may allow you to specify
the incident type. The types of change allowed will depend on how your project administrator has
setup the system for you. Administrators should refer to the SpiraTest Administration Guide for
details on configuring the incident workflows to meet their needs.
Once you’ve filled out the appropriate incident fields, you can either click <Insert> to commit the
new item or <Cancel> to discard the insertion and return back to the incident list.
6.2.3. General
In this mode, the lower section of the screen displays the detailed description of the incident
together with any recorded resolution:
The latter text-box is optional for certain stages of the incident workflow and can be used to enter
guidance to the development team, suggestions for resolving the bug/issue, etc.
6.2.4. Custom Properties
In this mode, the main pane displays any custom properties that the project owner has defined for
incidents. To learn more about how to setup and configure custom properties for a project, please
refer to the SpiraTest Administration Guide. Assuming that custom properties have been defined
for your project, you will see a list of optional parameters that can be set on the incident. These
can be either freetext or drop-down-lists. In the example below, you can enter Notes, and/or the
Operating System that the incident was observed on.
© Copyright 2006-2007, Inflectra Corporation
Page 40 of 54
This document contains Inflectra proprietary information
Once you are satisfied with the values for the custom properties, simply click [Update] to commit
the changes.
6.2.5. Attachments
In this mode, the lower section of the screen displays the list of documents that have been
“attached” to the incident. The documents can be in any format, though SpiraTestTM will only
display the icon for certain known types.
The attachment list includes the filename that was originally uploaded together with the file-size
(in KB), name of the person who attached it and the date uploaded. In addition, if you position the
pointer over the filename and hold it there for a few seconds, a detailed description is displayed
as a tooltip. To actually view the document, simply click on the filename hyperlink and a new web
browser window will open. Depending on the type of file, this window will either display the
document or prompt you for a place to save it on your local computer.
To delete an existing attachment from an incident, simply click the <Delete> button and the
attachment will be removed from the list. To attach a new document to the incident, you need to
click the Browse button and select the file from your local computer, optionally enter a detailed
description then click the <Update> button. The document will be copied from your computer and
attached to the incident.
Note: If you are using a non-Windows® computer (e.g. Macintosh®) that doesn’t put file
extensions on filenames (e.g. .xls for an Excel sheet) automatically, then you will need to
manually add the file extension to the filename before uploading if you want it to be displayed with
the correct icon in the attachment list.
6.2.6. History
In this mode, the main pane displays the list of changes that have been performed on the incident
artifact since its creation. An example incident change history is depicted below:
The change history displays the date that each change was made, together with the fields that
were changed, the old and new values and the person who made the change. This allows a
complete audit trail to be maintained of all changes in the system.
© Copyright 2006-2007, Inflectra Corporation
Page 41 of 54
This document contains Inflectra proprietary information
7. Release Management
This section outlines how to use the Release Management features of SpiraTestTM to manage
different versions of the system being tested in a particular project. This is an optional feature of
the system, and you can manage the testing for a project successfully without tracking individual
releases. Typically when you develop a system, it is important to ensure that features introduced
in successive versions do not impair existing functionality - this is known as regression testing.
In such situations, you will want to be able to execute the same set of test scripts against multiple
versions of the system and be able to track failures by version. A feature that works correctly in
version 1.0 may fail in version 1.1, and the maintenance team may be testing the existing lifecycle
of v1.0 in parallel with the development team testing v1.1. Therefore by developing a master set
of releases/versions in the Release Management module, you can have the different testing
teams correctly assign their testing actions to the appropriate version.
7.1. Release List
When you click on the “Releases” tab on the global navigation bar, you will initially be taken to the
release list screen illustrated below:
The release list will contain all the releases associated with current project. When you create a
new project, this list will initially be empty, and you will have to use the <Insert> button to start
adding releases to the project. The hierarchical organization of releases in the list is configurable,
so you can organize the various releases in the way that makes most sense for a particular
project. Typically you have the major releases as the top-level items, with sub-releases, builds
and iterations as the lower-level items.
All of the releases in the list have a release-name, together with the assigned version number for
that release, the date that the release was first created, the name of the creator of the release,
the release number, and a set of custom properties defined by the project owner. Clicking on a
release’s hyperlink will take you to the release details page for the item in question (see section
7.2). Note: Unlike requirements, both the parent and child items are linked to details pages.
7.1.1. Filtering
You can easily filter the list of releases as illustrated in the screen-shot below:
© Copyright 2006-2007, Inflectra Corporation
Page 42 of 54
This document contains Inflectra proprietary information
To filter the list by any of the displayed columns, you either choose an item from the appropriate
drop-down list or enter a free-text phrase (depending on the type of field) then click <Filter> to
apply the different filters. Note that the name field is searched using a “LIKE” comparison, so that
searching for “database” would include any item with the word database in the name. The other
freetext fields need to be exact matches (e.g. dates, release numbers). In the screen-shot above,
we are filtering on Active = Yes. Clicking on <Clear Filters> clears all the set filters and displays
all the releases for the project.
7.1.2. Insert
Clicking on the <Insert> button inserts a release above the currently selected release – i.e. the
one whose check-box has been selected, at the same level in the hierarchy. If you want to insert
a release below a summary item, you need to insert it first, then indent it with the <Indent> button.
If you insert a release without first selected an existing release from the list, the new release will
simply be inserted at the end of the list.
Once the new release has been inserted, the item is switched to “Edit” mode so that you can
change the default name, active flag, version number and creator.
7.1.3. Delete
Clicking on the <Delete> button deletes all the releases whose check-boxes have been selected.
If any of the items are summary items, then: if the item is expanded and the children are visible,
the children are simply made children of the item above it in the list, however if the item is not
expanded and the children are hidden, then the children are all deleted. This behavior is similar to
that found in project planning tools like Microsoft Project®.
In addition, if all the children are deleted from a summary item, it changes back into a detail item.
Any test runs or incidents that were associated with a deleted release are not themselves
deleted, but the relationship between them is lost.
7.1.4. Indent
Clicking on the <Indent> button indents all the releases whose check-boxes have been selected.
If any of the items are made children of a release that had no previous children, it will be changed
from a detail item into a summary item.
7.1.5. Outdent
Clicking on the <Outdent> button de-indents all the releases whose check-boxes have been
selected. If any of the items were the only children of a summary release item, then that item will
be changed back from a summary item to a detail item.
© Copyright 2006-2007, Inflectra Corporation
Page 43 of 54
This document contains Inflectra proprietary information
7.1.4. Refresh
Clicking on the <Refresh> button simply reloads the release list. This is useful as other people
may be modifying the list of releases at the same time as you, and after stepping away from the
computer for a short-time, you should click this button to make sure you are viewing the most
current release list for the project.
7.1.5. Edit
Each release in the list has an <Edit> button display in its right-most column. When you click this
button, you change the item from “View” mode to “Edit” mode. The various columns are made
editable, and <Update> <Cancel> buttons are displayed in the last column. When you have made
your updates, you can either click <Update> to commit the changes, or <Cancel> to revert back
to the original information.
7.1.6. Show Level
Choosing an indent level from the ‘Show Level’ drop down box allows you to quickly and easily
view the entire release list at a specific indent level. For example you may want to see all
releases drilled-down to the third level of detail. To do this you would simply choose ‘Level 3’ from
the list, and the releases will be expanded / collapsed accordingly.
7.1.7. Show / Hide Columns
This drop-down list allows you to change the fields that are displayed in the release list as
columns for the current project. To show a column that is not already displayed, simply select that
column from the list of “Show…” column names and to hide an existing column, simply select that
column from the list of “Hide…” column names. This is stored on a per-project basis, so you can
have different display settings for each project that you are a member of. The fields can be any of
the built-in fields or any of the custom properties set up by the project owner.
4.1.10. Copying and Moving
To copy or move a release or set of releases, simply select the check-boxes of the releases you
want to copy or move and then click either <Copy> or <Move> as appropriate. Upon clicking the
button, the rows you selected will be marked in bold with a light yellow background and the
screen will prompt you to choose the destination for the copy/move:
Choose the destination location for the copied / moved releases by selecting the checkbox of the
release you want to copy/move in front of and then clicking the “Paste Releases” link. If you want
to copy/move the releases to the end of the list, you just click the link without selecting a
destination. To abort the copy or move, all you need to do is click the “Cancel” link and the
© Copyright 2006-2007, Inflectra Corporation
Page 44 of 54
This document contains Inflectra proprietary information
operation will be aborted. Note that copied releases will also include the test mapping information
from the originals.
7.2. Release Details
When you click on release item in the release list described in section 7.1, you are taken to the
release details page illustrated below:
This page is made up of three areas; the left pane is the navigation window, the upper part of the
right pane contains the release detailed information itself, and the bottom part of the right pane
displays different information associated with the release.
The navigation pane consists of a link that will take you back to the release list, as well as a list of
the other releases in the current project. This latter list is useful as a navigation shortcut; you can
quickly view the test run information of all the other releases by clicking on the navigation links
without having to first return to the release list page.
The top part of the right pane allows you to view and/or edit the details of the particular release.
You can edit the various fields (name, description, etc.) and once you are satisfied with them,
simply click the <Update> button just below the fields to commit the changes.
The lower part of the right pane can be in one of six possible modes that can be selected:
“Incidents”, “Test Cases”, “Custom Properties”, “Test Runs”, “Attachments”, and “History”. Each
of the different views is described separately below.
7.2.1. Incidents
This is the default view for the release details page. It displays the incidents associated with the
selected release. The incident list can be one of three modes:
h
Detected in this Release – this will display a list of all the incidents that were detected
during the testing of the selected release. This is useful in determining if there are open
incidents associated with a release that need to be dealt with.
h
Resolved in this Release – This will display a list of all the incidents that have been
reportedly resolved in this release. This is useful for double-checking that all the resolved
incidents for a release have indeed been fixed.
h
Verified in this Release – This will display a list of the incidents that have been verified as
being fixed in this release. This is useful for generating release notes for a specific
release indicating what changes and enhancements have been made in the release.
Regardless of the mode, each incident is listed together with the type, status, priority, name,
owner, detector, detection date and a link to the actual incident details (see section 6.2):
© Copyright 2006-2007, Inflectra Corporation
Page 45 of 54
This document contains Inflectra proprietary information
To change between the three modes outlined above, simply select the desired mode from the
drop-down list contained within the header of the incident list table.
7.2.2. Test Case Mapping
This mode displays the test case mapping information for the release in question:
The test case mapping section consists of two lists of test cases, the one on the left being the
hierarchical list of the test cases belonging to the project that are not currently mapped to this
release. The right box contains the list of test cases currently mapped to this release. Doubleclicking on items in this box will jump you to the test case details screen for this requirement (see
section 5.2).
To change the test case mapping for this release, you use the buttons (Add, Remove, Remove
All) positioned between the two list-boxes. The <Add> button will move the selected test cases
from the list of available on the left to the list of mapped on the right. Similarly the <Remove> and
<Remove All> buttons will remove either the selected or all the test cases from the right list-box
and add them back to the left list-box.
7.2.3. Custom Properties
In this mode, the main pane displays any custom properties that the project owner has defined for
releases. To learn more about how to setup and configure custom properties for a project, please
refer to the SpiraTest Administration Guide. Assuming that custom properties have been defined
for your project, you will see a list of optional parameters that can be set on the release. These
can be either freetext or drop-down-lists. In the example below, you can enter Notes and/or the
Operating System that the release is intended for.
© Copyright 2006-2007, Inflectra Corporation
Page 46 of 54
This document contains Inflectra proprietary information
Once you are satisfied with the values for the custom properties, simply click [Update] to commit
the changes.
7.2.4. Test Runs
This view displays the list of all the test runs executed against the release. Each test run is listed
together with the date of execution, the name of the test case, the name of the tester, the
release/version of the system that the test was executed against, the overall execution status for
the test case in that run and a link to the actual test run details (see section 5.4). In addition, you
can choose to display any of the custom properties associated with the test run.
The “customize columns” drop-down list allows you to change the fields that are displayed in the
test run list as columns. To show a column that is not already displayed, simply select that
column from the list of “Show…” column names and to hide an existing column, simply select that
column from the list of “Hide…” column names. The displayed columns can be any standard field
or custom property.
7.2.5. Attachments
In this mode, the lower section of the screen displays the list of documents that have been
“attached” to the release. The documents can be in any format, though SpiraTestTM will only
display the icon for certain known types.
The attachment list includes the filename that was originally uploaded together with the file-size
(in KB), name of the person who attached it and the date uploaded. In addition, if you position the
pointer over the filename and hold it there for a few seconds, a detailed description is displayed
as a tooltip. To actually view the document, simply click on the filename hyperlink and a new web
© Copyright 2006-2007, Inflectra Corporation
Page 47 of 54
This document contains Inflectra proprietary information
browser window will open. Depending on the type of file, this window will either display the
document or prompt you for a place to save it on your local computer.
To delete an existing attachment from a release, simply click the <Delete> button and the
attachment will be removed from the list. To attach a new document to the release, you need to
click the Browse button and select the file from your local computer, optionally enter a detailed
description then click the <Upload> button. The document will be copied from your computer and
attached to the release.
Note: If you are using a non-Windows® computer (e.g. Macintosh®) that doesn’t put file
extensions on filenames (e.g. .xls for an Excel sheet) automatically, then you will need to
manually add the file extension to the filename before uploading if you want it to be displayed with
the correct icon in the attachment list.
7.2.6. View History
In this mode, the main pane displays the list of changes that have been performed on the release
artifact since its creation. An example release change history is depicted below:
The change history displays the date that each change was made, together with the fields that
were changed, the old and new values and the person who made the change. This allows a
complete audit trail to be maintained of all changes in the system.
© Copyright 2006-2007, Inflectra Corporation
Page 48 of 54
This document contains Inflectra proprietary information
8. Reports Center
This section describes the reporting features of SpiraTestTM, including an overview of each of the
report types that are available. When you click on the “Reports” tab on the global navigation bar,
you will initially be taken to the reports home page illustrated below:
This page simply lists each of the reports available in the system, categorized by the artifact they
primarily relate to (requirements, test cases, and incidents). Clicking on any of the report
hyperlinks will take you to the configuration page for the report in question.
The configuration page for each report differs slightly, but the general format is illustrated below:
You can configure each of the reports in the following ways:
h
Report Format – This allows you to specify the display format of the report. The is a
distinction between a narrative report in which the data is presented as a written report
suitable for printing, and a tabular report in which the data is presented as a data grid that
© Copyright 2006-2007, Inflectra Corporation
Page 49 of 54
This document contains Inflectra proprietary information
is best used for charting and analyzing. The narrative reports can be displayed either as
a web-page (HTML) or downloaded as a Microsoft Word document. The tabular reports
can be displayed either as a web-page (HTML) or downloaded as a Microsoft Excel
spreadsheet.
h
Report Elements – This allows you to determine which types of information to include in
the report. This varies by report type, but includes the dependent items related to the
artifact being reported on (attachments, test steps, coverage, history, etc.)
h
Report Filters – This allows you to constrain the range of data being reported on, based
on the various fields associated with the artifact in question. These filters are typically
selections from drop-down lists and date-ranges.
Once you have selected the format, elements and filters, clicking the <Create Report> button
launches the report in a new window. Each of the reports is now briefly described below:
8.1. Requirements Reports
8.1.1. Requirements Coverage Report
This printable report displays all of the requirements defined for the current project in the order
they appear in the requirements list. For each individual requirement, the name, priority, author,
status and coverage status are displayed, along with tables containing the list of covering test
cases, attached documents, and the change history:
8.2. Test Case Reports
8.2.1. Printable Test Scripts
This printable report is useful when you want to be able to conduct the testing activities offline on
paper, or when testers need paper copies of the test script in addition to using the online test
execution wizard.
© Copyright 2006-2007, Inflectra Corporation
Page 50 of 54
This document contains Inflectra proprietary information
In either case, this report simply displays all of the test cases defined for the current project in the
order they appear in the test case list together with their detailed test steps and a list of any
attached documents.
8.2.2. Test Case Execution Report
This printable report displays all of the test cases defined for the current project in the order they
appear in the test case list. For each individual test case, the name, execution status, author,
owner and execution date are displayed, along with tables containing the list of individual test
runs, attached documents, the change history, and finally any associated open incidents:
© Copyright 2006-2007, Inflectra Corporation
Page 51 of 54
This document contains Inflectra proprietary information
8.3. Incident Reports
8.3.1. Incident Status Report
This printable report displays all of the incidents tracked for the current project sorted by incident
number. For each individual incident, the name, type, priority, status, opener, owner and close
date are displayed, along with tables containing the detailed description and resolutions as well
as a tabular list of attached documents and the change history:
8.3.2. Incident Discovery Rate Chart
The incident discovery rate chart displays the total number of incidents created and closed over a
particular date-range. The report can either be displayed for 60 days of data daily or for 12
months of data weekly, ending on a specified date.
The screen-shot below illustrates the discovery report loaded with the past 60 days of incident
discovery/closure data depicted on a daily basis:
© Copyright 2006-2007, Inflectra Corporation
Page 52 of 54
This document contains Inflectra proprietary information
In this version of the report, the y-axis represents the number of incidents (either created or
closed in a 24 hour period), and the x-axis represents a specific day in the time-span. Each datapoint can be viewed by positioning the mouse pointer over the point, and a “tooltip” will pop-up
listing the actual data value. You can filter the report by the type of incident, and also change the
ending date of the date range (e.g. displaying only the bugs for the date range).
Similarly, by clicking on the weekly radio button, you can display the past 12 months of incident
discovery data organized on a weekly basis:
In this version of the report, the y-axis represents the number of incidents (either created or
closed in a 7-day period), and the x-axis represents a specific week in the time-span. Each datapoint can be viewed by positioning the mouse pointer over the point, and a “tooltip” will pop-up
listing the actual data value. Again you can filter this report by the type of incident and also
specify the ending date of the date-range.
Clicking the “Back to Project Home” hyperlink will take you back to the Project Home dashboard.
In addition, the toolbar displays a list of shortcuts to other incident reports that can be displayed.
© Copyright 2006-2007, Inflectra Corporation
Page 53 of 54
This document contains Inflectra proprietary information
8.3.3. Cumulative Incident Count Chart
The cumulative incident count chart displays the cumulative total number of incidents logged in
the system for the current project over a particular date-range. The report can either be displayed
for a 60 day interval on a daily basis or for a 12 month interval of a weekly basis. The report
displays two data series, one illustrating the total count of all incidents, the other the total count of
all open incidents (i.e. with status not set to fixed or closed).
The screen-shot below illustrates the cumulative count report loaded with the past 60 days of
cumulative incident count data depicted on a daily basis:
In this version of the report, the y-axis represents the number of incidents, and the x-axis
represents a specific day in the time-span. Each data-point can be viewed by positioning the
mouse pointer over the point, and a “tooltip” will pop-up listing the actual data value. You can also
filter the type of incident being reported, as well as change the end date for the date interval.
Similarly, by clicking on the weekly radio button, you can display the past 12 months of
cumulative incident count data organized on a weekly basis:
© Copyright 2006-2007, Inflectra Corporation
Page 54 of 54
This document contains Inflectra proprietary information
In this version of the report, the y-axis represents the number of incidents logged in a 7-day
period, and the x-axis represents a specific week in the time-span. Each data-point can be
viewed by positioning the mouse pointer over the point, and a “tooltip” will pop-up listing the
actual data value. Again, you can also filter the type of incident being reported, as well as change
the end date for the date interval.
Clicking the “Back to Project Home” hyperlink will take you back to the Project Home dashboard.
8.3.4. Open Incident Count
The open incident count chart displays the total number of open incidents in the system for the
current project over a particular date-range categorized by incident priority. The report can either
be displayed for a 60 day interval on a daily basis or for a 12 month interval of a weekly basis.
The screen-shot below illustrates the discovery report loaded with the past 60 days of cumulative
incident count data depicted on a daily basis:
In this version of the report, the y-axis represents the number of incidents, and the x-axis
represents a specific day in the time-span. The exact count of each bar in the stacked histogram
can be viewed by positioning the mouse pointer over the bar, and a “tooltip” will pop-up listing the
© Copyright 2006-2007, Inflectra Corporation
Page 55 of 54
This document contains Inflectra proprietary information
actual data value. You can also filter the type of incident being reported, as well as change the
end date for the date interval.
Similarly, by clicking on the weekly radio button, you can display the past 12 months of open
incident counts organized on a weekly basis (categorized by priority).
8.3.5. Incident Aging
The incident aging chart displays the number of days incidents have been left open in the system.
The chart is organized as a stacked histogram, with the count of incidents on the y-axis and
different age intervals on the x-axis. Each bar-chart color represents a different incident priority,
giving a project manager a snapshot view of the age of open project incidents by priority.
This report can be filtered by the type of incident, so for example you can see the aging of just
bugs, or just issues for the project in question.
8.3.6. Incident Turnaround Time
The incident turnaround time chart displays the number of days incidents have taken to be closed
(from the time they were first raised) in the system. The chart is organized as a stacked
histogram, with the count of incidents on the y-axis and different turnaround time intervals on the
x-axis. Each bar-chart color represents a different incident priority, giving a project manager a
snapshot view of the turnaround time of project incidents by priority.
© Copyright 2006-2007, Inflectra Corporation
Page 56 of 54
This document contains Inflectra proprietary information
This report can be filtered by the type of incident, so for example you can see the turnaround time
of just bugs, or just issues for the project in question.
© Copyright 2006-2007, Inflectra Corporation
Page 57 of 54
This document contains Inflectra proprietary information
Legal Notices
This publication is provided as is without warranty of any kind, either express or implied,
including, but not limited to, the implied warranties of merchantability, fitness for a particular
purpose, or non-infringement.
This publication could include technical inaccuracies or typographical errors. Changes are
periodically added to the information contained herein; these changes will be incorporated in new
editions of the publication. Inflectra Corporation may make improvements and/or changes in the
product(s) and/or program(s) and/or service(s) described in this publication at any time.
SpiraTestTM and InflectraTM are trademarks of Inflectra Corporation in the United States of
America and other countries. Microsoft®, Windows®, Explorer® and Microsoft Project® are
registered trademarks of Microsoft Corporation. All other trademarks and product names are
property of their respective holders.
Please send comments and questions to:
Technical Publications
Inflectra Corporation
10301 Julep Avenue
Silver Spring, MD 20902
U.S.A.
[email protected]
© Copyright 2006-2007, Inflectra Corporation
Page 58 of 54
This document contains Inflectra proprietary information