1
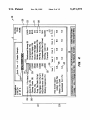
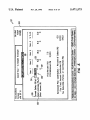
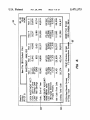
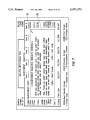
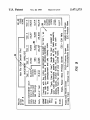
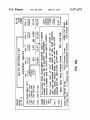
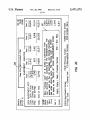
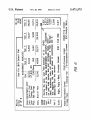
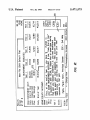
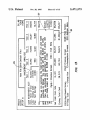
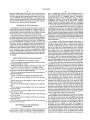
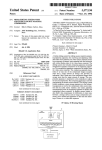
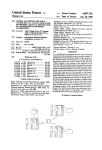
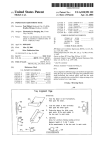
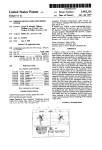
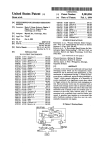
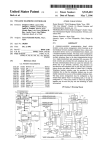
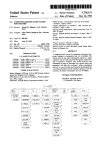
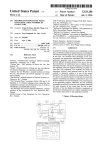
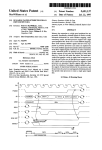
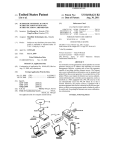
||||||11mlmumlllllgllglilplpgllnll|||||l|11||||1||||
Umted States Patent [19]
[11] Patent Number:
Giansante
[45]
[54] INTERACTIVE PARAMETER DRIVEN
5,471,575
Date of Patent:
Nov. 28, 1995
Albrecht, Teach Yourself GW Basic, 1990 pp. 18, 64.
slfgigigurr
Symantec, Timeline User Manual, 1990 pp. 16-14 & 16-15.
SENSITIVE HELP SCREEN
Mobley Matrix Intl, The Mobley Matrix Operations Manual,
1989 pp. P-1 1.0 P-6, R-20, R-21.
[75] Inventor! Joseph E- Giallsallte, Mountain Vi?W,
Acerson, WordPerfect Series 5 The Complete Reference,
Cahf-
1988 pp. 231, 42s.
[73] Assignee. Home Equity software Inc Mountain
'
View Calif_
’
WealthStarter with Charles J. Givens User’s Guide. Reality
"
Technologies, Limited.
[21] APPL No; 816,892
Primary Examiner—Heather R. Hemdon
_
[22] Fll?dl
Assistant Examiner—Anton W. Petting
Jan- 3, 1992
Attorney, Agent, or Firm—Townsend and Townsend Khou~
[51]
Int. c1.6 .................................................... .. G06]? 17/21
[52]
395/144; 395/161
[58]
Field Of Search ................................... .. 395/161, 144,
“6 and Crew
[57]
395/145, 155,
146, 157’
147, 158;
148, 364/408’
152, 153,4191
154,
ABSTRACT
A ?nancial analysis system for mathematically modeling an
investment on a computer provides an improved computer
[56]
References Cited
user lnterface and a help method for teaching a user how to
use the analysis system and for explaining the meaning of
U_S_ PATENT DOCUMENTS
4,891,770
items on the screen. An investment term is broken up into
two or more incremental periods and unique parameters may
be associated with each incremental period so as to allow for
1/1990 Hollett .............................. .. 395/144X
gigs
U
the modeling of discrete events and permit varying of input
5,058,009 10/1991 Yosh-mo et a1_
364/408
assumptions of one or more incremental periods. In accor
5,122’972
6/1992 Richards et aL
395/157
dance with this scheme, results are displayed with each
5,143,365
9/1992 Dembo ______________ __
364/493 X
incremental period having its associated result or results. A
5,155,806 10/1992 Hoeber et =11. ..
395/157
method for displaying help text to explain the purpose,
5,157,768 10/1992 Hoeber et a1. .... ..
395/157
function and ordering of items displayed in a computer
5,179,654
1/1993 Richards etal
395/157
?nancial analysis system is disclosed. The help text is
511399608
2/1993 Lyons at al- ------ -
364/403
visually associated with an item that is displayed in context
5’195’172
3/1993
Elan at al-
''' '''
$281111‘;
5,339,392
' ' ' ' " 395/50
on the screen. Help text is automatically displayed in a
393/9151;
predetermined sequence to explain items on the screen and
8/1994 Risberg et a1. ................... "1.. 395/161
F°l11“s“?teth°1°gi°a1 ?ow of calculations Performed on the
OTHER PUBLICATIONS
items. Different help text may be displayed when the value
of an item changes.
Campbell, Quattro Pro Handbook, 1990 pp. 6-7, 28-31,
66-67, 116-117, 144-145, 292-293, 334-337, 354-355,
376-381, 388-389, 543-547.
8 Claims, 15 Drawing Sheets
361
Results
Screen
#1 OF 8
New File (BY
B11 :42
YOUR
HOME
Default File)
lNVESTM NT ANALYSlS
Y ear 2
Y eat 3
Y ear 4
Year 5
13,942
14,895
20,317
29,505
9,188
10,714
Cash, End of Year
13,942
14,895
20,31/7
29,505
HOME
Starting with the CASH INVESTMENT Accoug‘r for Year 1, we
40,219
/359
CASH INVESTMENT ACCT:
Cash, Start of Year
Less: Closing Cash
Plus: Net Savings
Home
Less:
Mort
Prep
Nel C
_
Endln
953
363
5,42y
see that you initially have 5 32,000
1e
to make the downpayment and pay closing costs.
u
u
_
These Cash, Start of Year funds for Year I consist of
your total marketable assets (such as CDs, bank accounts,
stocks, bonds, mutual funds, etc), as well as any cash
received from the sale of your current home.
PgDn, PgUp= Next, Previous Screen
17,957
11,277)
8,992)
1,090)
5
9,598
6,817
550 = Exit Help
PGDN=Next Results Screen
PGUP=Previous Screen
Fl=Help Tutor
- =Chonge Year
F3=Assumptions Screens
HOME=First Screen
ESC= Analyze Menu
US. Patent
Nov. 28, 1995
Sheet 1 of 15
r
‘ 203
5,471,575
US. Patent
Nov. 28, 1995
5,471,575
Sheet 2 of 15
IOI
‘ DETERMINE TIIE TERM OF TIIE INVEST
MENT TO BE ANALYZED
I
DIVIDE TERM INTO TWO OR MORE
INCREMENTAL PERIODS
r IO?
SELECT INITIAL PARAMETERS
SELECT AN INCRENENTAL
PERIOD
I
ASSIGN PARAMETERS TO
TIIE PERIOD
r'III
MORE
PARAMETERS TD
ASSICN?
CALCULATE RESULT FOR FIRST PERIOD '
USINC INITIAL DATA AND ASSIGNED
PARAMETERS
CALCULATE RESULT FOR SUCCESSIVE
PERIODS BY USING (I) RESULT FROM
PRECEDINC PERIOD (2) ASSIGNED PARA
METERS FOR THIS PERIOD AND (3)
INITIAL DATA
ANY
PERIODS LEFT TO
CALCULATE?
DISPLAY RESULTS
FIG. 2.
I23
EXIT
US. Patent
Nov. 28, 1995
Sheet 3 0f 15
5,471,575
309
E
r‘ 3"
SET CURRENT PAGE TO FIRST PAGE
r313
GET TEXT AREA DIMENSIONS OF
CURRENT PAGE
*
315
i
3n
I
ma
SET TExT FOR CURRENT PAGE
GET NUMBER OF ARIIoIIs FOR
CURRENT PAGE.
DISPLAY ITEII VALUE (IF ANY) III TExT
DISPLAY. sELEcT DIFFERENT HELP TExT
oEPEIIIIIIIc on VALUE or ITEM.
l
»s2I
DISPLAY TExT IN TExT AREA
ANY IIIIIIoIIIs
To DISPLAY?
Iss4
GET ARROiW PATHS
'
DISPLAY ARROVIS.
FLASH (OIPTIONL)
I
329
DRAW TExT BOUNDARY
Fl€ 3A.
Kass
U.S. Patent
Nov. 28, 1995
Sheet 4 of 15
5,471,575
Q?
PAGE DOWN
KEY PRESSED?
ANY
“Rows
T0 DISPLAY?
(339
SET CURRENT PAGE
TO FIRST PAGE
347
AT FIRST PAGE
OF TEXT?
"0
[349
SET CURRENT PAGE TO
PREVIOUS PAGE
REVIRITE SCREEN DISPLAY
FIG: 3B.
5,471,575
1
2
information between items is not established. This is
because it is the user who is selecting the items to be
explained and the user may randomly or haphazardly choose
to have items explained in a sequence which is not repre
sentative of the role of the items in a computation. For
example, in the calculation of A+B=C, the user may ?rst
BACKGROUND OF THE INVENTION
select an explanation of A and then an explanation of C,
Field of the Invention
which probably does not provide as good an understanding
This invention relates generally to the ?eld of computer
of the computation as if A and B were explained before C
?nancial analysis systems and more speci?cally to a user 10 was explained.
interface for such a system.
Other help methods are even less adequate in explaining
the function of items in a ?nancial analysis system display
Current computer ?nancial analysis systems allow a user
screen. These methods often provide information about
to input personal ?nancial data such as salary, expenses,
items in a manual-like format where the function of items is
assets, and investments which represent the user’s initial
discussed as if the user were reading a textbook and turning
?nancial state. The system will then output predictions of the
user’s future ?nancial status based on mathematical models.
pages by pressing keyboard or mouse buttons. The text in
these methods often occupies the whole of the screen so that
Financial analysis systems typically analyze mortgage re?
the user is provided with no visual reference of the items
nancing, loan amortization, renting or leasing versus buying
whatsoever.
a home, retirement planning, investment analysis and
achieving ?nancial goals. The input of the ?nancial analysis
As mentioned above, ?nancial analysis systems use math
system is typically a set of numbers. The output of the
ematical models to predict the effect that various factors will
INTERACTIVE PARANIETER DRIVEN
ITERATIVE FINANCIAL SPREADSHEET
ANALYSIS WITH CONTEXT AND LAYOUT
SENSITIVE HELP SCREEN
system may be a single number or it may be a table of
have on the user’s ?nancial status over the term of an
numbers or a chart or graph.
investment. Every attempt is made to simplify the use of the
system by keeping the number of inputs from the user low
and by presenting the output as a single number or a graph.
The di?iculty in designing a ?nancial analysis system for
a personal or home user is that in order to provide an 25
accurate analysis, many ?gures have to be both entered by
the user and interpreted by the user as output by the
computer. Often the user is confronted with an entire display
screen ?lled with numbers and short, often abbreviated,
However, this simpli?cation is at a sacri?ce in the ?exibility
of the ?nancial analysis system as the user is only allowed
to specify their ?nancial status at the beginning of the term
and the system calculates their ?nancial status at the end of
descriptive headings in both the input and output screens. If 30 the term. This is in contrast with the real world where an
the user is unfamiliar with the names and functions of each
individual’s ?nancial situation is affected on a day-to-day
basis throughout the term of the investment.
of the numbers in the display, it will prevent the user from
correctly and e?iciently using the ?nancial analysis system,
and more seriously, will lead to incorrect conclusions about
the user’s ?nancial state of affairs.
Traditional ?nancial analysis systems use various meth
For example, assuming a user trying to simulate a one
35
year investment, a traditional ?nancial analysis system
would have the user specify starting parameters such as the
amount of investment and rate of return and then use these
parameters to calculate the accrued value at the end of one
year. This does not take into account the possibility that the
interest rate may ?uctuate within the year. As another
ods to explain to the user the purpose of items on the screen.
One method is called “hypertext” which allows a user to
“point” to an item on the screen, for example, by using a
example, in a cash ?ow analysis other one-time events, such
as an increase in salary, may occur during the investment
term being modeled. The math models used in current
cursor controlled by a mouse or by highlighting the items
through keyboard selection. After an item is pointed to, the
user presses a help button and a paragraph or two explaining
the item, the item’s purpose and function pops up onto the
?nancial analysis systems make it difficult to handle discrete
display screen. This help text remains on the screen until the
events, that is, parameters whose values change during the
user presses a keyboard or mouse button whereupon the help 45 course of the investment term.
text disappears and the user is returned to the initial display.
The user can proceed to highlight another item to obtain
use a “present value” or “intemal rate of return” analysis
more help text for any of the items on the screen.
methodology. These methods operate, respectively, by cal
Financial analysis systems on the market today generally
A problem with prior art systems is that the help text,
culating the present value of the stream of cash ?ows or by
calculating the internal rate of return associated with the
when displayed, overlays some initial screen information
which would be helpful to the user in understanding the
function of the item. Sometimes, even the item itself is
cash ?ow stream. Such methods are well-known in the art.
In each method a discount rate may be speci?ed by the
overlayed so that the user loses visual reference to the item.
user; however, this discount rate is maintained constant
Other systems remove the initial display completely and 55 throughout the calculation. This is not an accurate re?ection
present the user with a completely new screen containing the
of actual discount rates which can ?uctuate with time.
help text. When the user decides to go back to the initial
Moreover, these math models based on present value or
display, the help text is removed and the initial display is
internal rate of return provide no means of modeling discrete
restored.
events such as “windfall” capital realizations, one-time or
With this latter technique, the user loses all visual refer 60 intermittent expenses, or other discrete events which would
ence to the item which is being explained by the help text.
Such visual reference is important when the item is one of
affect a user’s income in a non-continuous manner.
many numbers shown on the screen and the number’s
analysis methodologies is confusing to the average user of a
placement, relative to other displayed information, is helpful
in understanding its function.
The second problem with the hypertext method of pro
viding help information is that a sequence or “?ow” of help
Further, the use of present value or internal rate of return
65
?nancial analysis system since these methodologies do not
represent any actual quantity of cash held by the user at any
time during the investments. The internal rate of return
approach su?ers from an additional shortcoming in that it
5,471,575
3
4
gives no weight to the relative “size” of the investment. For
example, an investment of $1,000 which returns $1,500 in
uses a mathematical model to make predictions about a
future ?nancial state. The invention uses a computer system
?ve years has the same internal rate of return as an invest
ment of $100,000 returning $150,100, even though in the
1 as shown in FIG. 1. Computer system 1 comprises a
display 3 having a screen 5. Computer system 1 further
second case the amount earned is 100 times larger than the
comprises a cabinet 7 within which are standard computer
?rst case. This is because the internal rate of return expresses
its result as the ratio of return to investment.
central processor, peripheral adapter cards, etc. Computer
SUMMARY OF THE INVENTION
or a mouse 11. Mouse 11 may have one or more buttons 13.
components (not shown) such as disk drives, memory,
system 1 may have user input devices such as a keyboard 9
Accordingly, the present invention provides a means by
10
FIG. 2 shows the logical ?ow of the steps in a method for
calculating results based on an initial set of ?nancial data.
The method assumes that the ?nancial analysis can be
which help text may be displayed on a display screen in a
?nancial analysis system executing on a computer. The help
characterized as an investment over a term or ?xed period of
text describes an item on the screen and a pointer or arrow
time. The method further assumes that the user has enough
information to accurately de?ne an initial set of data describ
connects the help text with the item being described.
The present invention implements a help tutor which can
15
to explain items on the screen and illustrate the logical ?ow
price appreciation.
of the calculations performed on the items. Dilferent help
text may be displayed for different values of an item. For
example, if the item is a number and its value is positive then
a ?rst help text can be displayed, if the value of the item is
negative a second help text can be displayed. The invention
ing the user’s present ?nancial situation with respect to the
investment. Also, the user must have enough information to
characterize the “market forces” such as the rate of home
automatically display help text in a predetennined sequence
20
For example, such a ?nancial analysis would apply to
buying a home, where the buyer’s current savings and salary
are known along with the price of the house and expected
expenses in purchasing the house. These values would be
part of the initial set of data de?ning the user’s ?nancial
in the investment rate or income and expenditures which 25 state. Other values such as the rate of home price apprecia
tion, interest rate on the mortgage, salary increases, and
occur at selected points during the investment term being
taxes would be some of the parameters input by the user and
modeled, as contrasted with continuous events which may
used in the math model to calculate the future ?nancial state.
be modeled by an equation with parameters whose values do
The methods described below in reference to FIG. 2 allows
not change.
also allows a user to model discrete events such as changes
30 the user to take into account one-time factors or factors
BRIEF DESCRIPTION OF THE DRAWINGS
FIG. 1 is an illustration of a computer system.
FIG. 2 is a diagram illustrating the logic ?ow for a method
of calculating ?nancial results.
FIGS. 3A and 3B are a diagram illustrating the logic ?ow
35
purchase of a home as an example, the user may decide to
analyze the home purchase over a ten year term. Thus, the
term of the investment is set at ten years. Step 105 divides
the term into two or more incremental periods. In the
for a method to display help text on a computer screen.
FIG. 4 is a ?rst screen display of the present invention
which allows the user to input parameters.
FIG. 5 is a second screen display for allowing the input of
which change over the term of the analysis because the user
may input parameters which are only effective for a short
period of time within the overall term of the investment.
In FIG. 2 the method or procedure has an entry point 101.
Step 103 detennines the term of the investment. Using the
40
additional parameters.
example, the ten year term can be conveniently divided into
ten one-year incremental periods. In step 107, initial param
eters are selected. This can be achieved by having the user
FIG. 6 is a third screen display for outputing results.
FIG. 7 shows the screen display of FIG. 6 with ?rst help
input parameters which de?ne the user’s initial ?nancial
state. Alternatively, the computer system may select pre
text.
45 stored initial parameters for some or all of the required
parameters to de?ne the initial state. This would be useful
FIG. 8 shows the screen display of FIG. 6 with second
when the user is ?rst becoming acquainted with the system
help text and arrows.
and desires only to do a “test” run to become familiar with
FIG. 9A shows different help text displayed for a different
the system. Having the computer select the initial default
value.
parameters would also be useful when the user omits input
FIG. 9 shows the screen display of FIG. 6 with third help 50 ing one or more necessary parameters as where the user does
text and an arrow.
not have enough information to enter an accurate parameter
FIG. 10 shows the screen display of FIG. 6 with fourth
help text and an arrow.
FIG. 11 shows the screen display of FIG. 6 with ?fth help
55
text and an arrow.
FIG. 12 shows the screen display of FIG. 6 with sixth help
and desires only that the parameter be a reasonable approxi
mation of the typical value of that parameter.
At step 109 an incremental period is selected. In the home
buying scenario, since the investment term is ten years and
the incremental period is one year, step 109 would require
the selection of one of the ten one-year periods. This step
may be performed by the user as where the user desires to
FIG. 13 shows the screen display of FIG. 6 with seventh
60 enter parameters for a speci?c year. Step 109 may also be
help text and two arrows.
text and an arrow.
performed by the computer as where the computer is
prompting the user to enter parameters for a speci?ed year.
DESCRIPTION OF THE PREFERRED
EMBODIMENT
The present invention is a ?nancial analysis system which
65
In step 111 parameters are assigned to the period selected in
step 109. This is typically done by the user who hopefully
has enough information to enter accurate parameters. How
allows a user to input an initial set of data representing a
ever, if the user chooses not to, or cannot, enter accurate
?nancial state or status. The ?nancial analysis system then
parameters, the computer may use default values as above in
5,471,575
5
6
the case of using default values to set the initial parameters
at step 107.
present invention’s method for displaying help text is appli
Where the steps 109 and 111 of respectively selecting
incremental periods and assigning parameters to the selected
word, alphanumeric string, symbol, collection of symbols,
periods are performed by the user, one of the user input
devices, such as keyboard 9 or mouse 11 of FIG. 1, may be
used. In a preferred embodiment of this invention to be
described below, display screen 5 of FIG. I would show
Highlight 215 is a reverse video area which causes value 213
to appear in the illustration as white on black instead of
black on white as would be the case where highlight box 215
was not surrounding value 213.
cable to other systems in which an item may be a character,
or a graphic. The text 219 is a descriptor for value 213.
incremental periods as columns on the screen and would
show parameters associated with each column as rows
within that column. The user could then, by means of
keyboard 9 or mouse 11, move a cursor (not shown) on the
screen from parameter to parameter. Moving the cursor
horizontally from column to column would achieve step 109
of selecting an incremental period. Moving the cursor ver~
tically from parameter to parameter within the column and
modifying the parameter would constitute step 111, that of
assigning a parameter to the incremental period. The user
would be free to modify each of the parameters indicated by
the cursor position by pressing additional buttons on either
the keyboard 9 or mouse 11, as, for example, by entering a
numerical value using the numbered keys on a typical
Highlight box 215 may be moved to select different
values to be modi?ed. Typically this movement can be
achieved with a keyboard such as keyboard 9 of FIG. 1,
where dedicated keys such as the arrow keys on the key
board indicating up, down, right and left may be used. A
device such as mouse 11 could also be used to move
15
highlight box 215 in accordance with the mouse movement.
Highlight box 215 may be moved from its current position
to highlight value 223 by moving the box to the right or it
may highlight value 225 by moving the box downwards.
Additionally, other methods may be employed to allow
“wraparound” of the box to value 227 by moving the box
upwards or the box may be allowed to “jump” from value to
value. These methods of cursor movement are well known
keyboard. Many workable procedures for achieving steps
in the art.
109 and 111 are possible and all are considered within the
Once positioned over a value such as 213, that value may
25 be modi?ed by pressing a key such as the standard “return”
scope of this invention.
Step 113 looks at whether there are more parameters to
or “enter” keys (not shown) on keyboard 9 and then entering
assign to incremental periods. This decision can be made by
a new value by means of numeric keys (not shown) on
requesting the user to indicate whether or not the user desires
keyboard 9 of FIG. 1. In this way, step 107 of FIG. 2, that
is selecting the initial parameters, may be achieved. Note
that in the preferred embodiment screen display 201 only
to enter more parameters. Alternatively, the computer sys
tem may prompt the user for parameters until all parameters
have been entered. In either case, where there are more
allows the user to select a subset of the initial parameters.
parameters to assign, step 109 is again repeated along with
The remainder of the initial parameters are on additional
screens which may be accessed by using additional keys on
subsequent step 111. Note that it is not necessary to ?rst
select an incremental period before assigning parameters. In
other words, parameters can be entered and then assigned to
an incremental period, that is, steps 109 and 111 may be
reversed.
At step 115, the result for the ?rst period is calculated
using the initial data and parameters assigned to the ?rst
period. At step 117, results are calculated for successive
35
The lower section 229 of screen display 201 presents
parameters for incremental periods. The incremental period
parameters are shown as columns 231. Each incremental
period colurrm has a heading such as 233 and has values
such as 235 and 227 arranged in rows under the column
40
heading.
incremental periods using the result from a preceding period
and any assigned parameters for the successive periods
being calculated. Also, at step 117, some of the parameters
from the initial data may be used. Step 119 looks to whether
there are any periods left with uncalculated results. If so,
keyboard 9 such as “page up” and “page down”.
In this analysis the term of investment is ten years and the
incremental period is one year. However, only ?ve columns
are shown on screen 201. This is because the column with
45
execution continues at step 117. If there are no periods left
to be calculated, execution falls to step 121 where the results
are displayed for the user. The method ends at step 123.
The math models used in the analysis require that the
heading 237 pertains to incremental periods for years 5
through 10. Thus, the parameters under heading 237 will be
used in calculating the six incremental periods, periods 5
through 10. To select an incremental period, the user posi
tions highlight box 215 within one of the ?ve columns.
Parameters are assigned by modifying one of the two values
incremental period results be calculated sequentially. That
within the column in a manner to analogous to the discussion
is, the calculation for year two in the above sample could not
begin until the results were obtained for year one.
The screen display 201 of FIG. 4 shows a preferred
embodiment for accomplishing some of the steps of the
method described above in reference to FIG. 2. Screen
display 201 is comprised of information on the computer
screen 5 of FIG. 1 which is also indicated in FIGJ4. The
above for entering parameters for the initial data set. Again,
as with the initial parameters, the incremental period param~
eters may be spread out over more than one screen. In the
55
parameters are spread over six screens which are accessed
by using the “page up” and “page down” keys.
FIG. 5 shows another screen 237 which shows a second
information on the display screen may be text such as
set of column headings 239 coinciding with the column
heading 231 of FIG. 4. Highlight box 241 is now over value
243 corresponding to the parameter for current salary as
headings 207, numbers or values such as 209 and graphics
such as the boundary 211. Display screen boundary 203
shows the limits of the screen 5 upon which information may
indicated by descriptor 249. Note that there are no values for
be displayed.
Items at the top half 221 of display 201 are parameters in
the initial set of data for the ?nancial analysis system. The
items discussed in connection with a ?nancial analysis
system will most likely be numerical values. However, the
preferred embodiment, both the initial and incremental
descriptor 249 under columns other than the column for the
incremental period for year one. However, the periods other
65
than the year one period do have a parameter absent from
year one, namely “salary increase” indicated by descriptor
253. Looking at the column for year one, it is shown that the
5,471,575
7
8
blank space 245 exists where the corresponding parameter
for “salary increase” would be. Thus, it is shown that a given
other investments, not including the home investment, and
gives the user a clear indication of their ability to maintain
the home investment throughout the investment term. As an
example, if the values for the end of year cash 305 were
incremental period may or may not use the same parameters
as other incremental periods. In the preferred embodiment,
moving the highlight box downward would cause the high
progressively decreasing or became negative, it would
light box to move from the value 243 to value 247. Moving
the highlight box to the right from its position as shown in
FIG. 5 would cause the highlight box to cover value 251.
The above discussion shows how steps 109 and 111 of
FIG. 2 may be accomplished. The user may continue to
mean, respectively, that the user was heading towards insol
vency or became insolvent. Other prior art ?nancial analysis
systems show results plotted on a graph, requiring the user
to interpret the gap between two curves which causes an
ambiguous result. Also, results in graph form are not as
intuitively obvious as simply providing account balances for
select columns and assign parameters by repeating the
each incremental period.
above-described steps. The user may indicate that no more
parameters are to be assigned by pressing a key on the
keyboard such as the “ESCAPE” or “F4” keys. In this way
step 113 of FIG. 2 is implemented.
After all parameters have been assigned, computation of
the results proceed in accordance with steps 115, 117 and
119 of FIG. 2.
FIG. 6 shows a screen display 301 of the results from the
analysis. The results display is presented in columnar form
with each column corresponding to the incremental period
of one year. In the result screen 301 of FIG. 6, each of the
results for the incremental one-year periods may be viewed,
although only ?ve periods are shown at any one time. The
FIGS. 3A and 3B show a logic flow diagram for a method
to present help text on a display screen. The display screen
15
initially displays items of information which could comprise
text numbers and graphics (initial text). A problem arises
when it is necessary to explain, by means of additional text,
the meaning of various items on the screen. Often there is
not enough area to display the help text and initial text at the
same time. Also, when it is desired to explain the “?ow” or
sequence of actions occurring on the screen, the standard
single help text box is inadequate.
FIG. 3A shows entry point 309. It is assumed that at step
309 the display screen is presently displaying infonnation
system accepts a user input such as a right arrow key press 25 such as shown on screen 301 of FIG. 6. The user could
initiate entry into the routine of FIGS. 3A and 3B, for
from the keyboard to display the results for an additional
year. For instance, if the user were to press the right arrow
example by pressing the F1 key.
In step 311 of FIG. 3B, the program executing on the
computer system will set a variable representing the current
6, respectively. Using the right and left arrow keys, the user 30 page of help text to indicate that the current page of help text
is the ?rst page of help text. Step 313 retrieves data from a
can display the results for years one through ten as a display
data structure to obtain the area dimensions of the current
of any ?ve consecutive years at one time.
page. Step 315 retrieves the text for the current page and step
The ability to input and display parameters and calculate
and display results for incremental periods is an advantage 35 317 retrieves the number of arrows, if any, for the current
page.
of the present invention over prior art systems. This method
The information retrieved in steps 313, 315 and 317 can
allows the user to take into account discrete or one-time
be contained in a single data structure or multiple data
instances of events which a?ect their ?nancial status. For
at the screen display as shown in FIG. 6, years 1, 2, 3, 4 and
5 would be replaced with the results for years 2, 3, 4, 5 and
example, referring to FIG. 4, values 235 and 227, corre
sponding, respectively with the real estate appreciation rate
structures. The use of one or more data structures can be
implemented in any number of ways known in the art. For
and a return on cash investment, can be modi?ed for each of
years 1, 2, 3, 4 and 5-10. In this way, the user can take into
example, the text area dimensions can be stored as two sets
self explanatory in that the average lay person understands
instantly from looking at the display 201 of FIG. 4 the
purpose of the parameters and the eifects of inputing yearly
variations in the parameters.
value. At step 319 the item which the help text is explaining
is displayed in the help text box. This can be merely using
Further, the result screen 301 of FIG. 6 is an e?icient and
concise means of presenting the results of a complicated
helps to identify the number being discussed.
At step 319, diiferent help text may be selected according
of XY coordinates, indicating the upper left comer coordi
nate and the lower right comer coordinate. A parameter
account a trend such as a projection from a quali?ed real
which is a pointer to a location in computer memory where
estate market analyst that the home price appreciation rate
the current text resides may be retrieved at step 315 and the
will be increasing over the next ten years. The manner of
45
number of arrows for the current page could be an integer
presentation of parameters utilizing incremental periods is
the item in a sentence which describes the item. Where the
item is a number, the use of the number within the help text
to the value of the number (assuming the item is a number).
In the preferred embodiment, one set of help text will be
eifect of terminating their investment (i.e., selling the home) 55 displayed if the number is negative and another set of help
text will be displayed if the numberjs positive. This helps to
in each of any of the 10 years. If the user sells the home in
alert the user to important situations, such as insolvency,
year 3, value 307 which shows $58,674 is the amount which
which arise due to a change in parameter values for a
the user would realize according to the ?nancial analysis. In
particular analysis.
prior art systems, in order to obtain information such as that
shown in screen 301, a user would typically have to run the 60
Finally, at step 321, the text for the current help page is
investment analysis ten times, once for each of the incre
displayed in the help text area on the screen.
mental periods, changing the initial data set each time the
FIG. 7 shows the same initial display as in FIG. 6;
analysis is run.
however, help text 323 is overlayed onto the initial display
The preferred embodiment of the present invention pro
as would appear after execution of step 321 of FIG. 3A. At
vides many result parameters in an easily understandable 65 step 327 of FIG. 3A, software executing on the computer
fashion, such as “end of year cash” 305, shown in FIG. 6.
would check whether there are any arrows to be displayed.
This shows the user’s assets such as savings accounts and
Assuming for the moment that there are no arrows to be
?nancial analysis to the user. For example, by looking at the
ending total cash results 303, the user can determine the