1
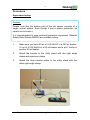
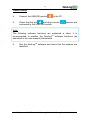
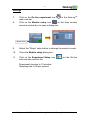
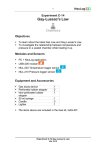
1 Experiment C-10 Titration of a Strong Acid and a Strong Base Objectives To study the titration process. To follow changes in the pH during the titration process while adding a strong base to a strong acid. To use a drop counter in order to get a pH versus volume (in drops) graph. Modules and Sensors PC + NeuLogTM software USB-200 module NUL-206 pH logger sensor NUL- 223 Drop Counter logger sensor Equipment and Accessories Utility stand Right angle clamp Extension clamp Burette 50 ml beaker 250 ml beaker Pasteur pipette Wash bottle Plastic container 1 2 1 1 2 1 1 1 1 The items above are included in the NeuLog Utility accessories, UTL-KIT (only one right angle clamp is included). Experiment C-10 Titration of a Strong Acid and a Strong Base Ver 3.0.2 2 Materials 50 ml of 0.05 M HCl 01 ml of 0.5 M NaOH Water for the wash bottle 30 ml of pH 7 buffer solution 1 1 1 1 Introduction Titration is an analytical tool to determine the concentration of an acid or basic solution. It is based on the neutralization process. Neutralization occurs when the hydronium ion from an acid interacts with a hydroxide ion from a base, on a one to one basis, forming water in the process. A salt is always a byproduct of this type of reaction. Titration is the progressive addition of an acid to a base, or vice-versa, to achieve neutralization. The point at which the acid and base are in equivalent amounts is called the equivalence or end point. One common example for acid-base titration is the use of a hydrochloric acid solution, HCl, with a basic sodium hydroxide solution, NaOH. This is an example of a titration of a strong acid with a strong base. In this experiment you will conduct a titration in which this reaction occurs. You will determine the equivalence point and plot a pH verses volume (in drops) graph. HCl NaOH H 2O NaCl Experiment C-10 Titration of a Strong Acid and a Strong Base Ver 3.0.2 3 Procedure Experiment setup Caution: Please note that the bottom part of the pH sensor consists of a fragile crystal sphere. Even though it has a plastic protection, be careful not to break it. It is recommended to wear personal protective equipment. Material Safety Data Sheets (MSDS) are available online. 1. Make sure you have 50 ml of 0.05 M HCl in a 250 ml beaker, 10 ml of 0.5 M NaOH in a 50 ml beaker and a pH 7 buffer in another 50 ml beaker. 2. Attach the burette to the utility stand with the right angle clamp and extension clamp. 3. Attach the drop counter probe to the utility stand with the other right angle clamp. Experiment C-10 Titration of a Strong Acid and a Strong Base Ver 3.0.2 4 Sensor setup 4. Connect the USB-200 module to the PC. 5. Check that the pH and drop counter connected to the USB-200 module. sensors are Note: The following software functions are explained in short. It is recommended to practice the NeuLogTM software functions (as described in the user manual) beforehand. 6. Run the NeuLogTM software and check that the sensors are identified. Experiment C-10 Titration of a Strong Acid and a Strong Base Ver 3.0.2 5 Settings in the NeuLogTM 7. Click on the On-line experiment icon main icon bar. 8. Click on the Module setup icon on the drop counter sensor's module box to open a dialog box. Module Setup 9. Select the "Drops" radio button to change the sensor's mode. 10. Close the Module setup dialog box. 11. Click on the Experiment Setup icon sub-icon bar) and set the: (on the On-line Experiment duration to 10 minutes Sampling rate to 20 per second Experiment C-10 Titration of a Strong Acid and a Strong Base Ver 3.0.2 6 Testing and measurements 12. Unscrew the cap from the pH sensor probe, wash it with water (above the plastic container) and put it into the pH 7 buffer; make sure that the beaker does not tip over. 13. In order to offset the pH sensor, make sure that the probe is in the pH buffer (If the pH buffer is not available distilled water can be used instead). Allow the reading to stabilize; press on the sensor’s Offset button continuously (3 seconds), or use the Offset icon in the Module setup dialogue box. This will offset the sensor to a value of 7 (the value appears in the module window). 14. Wash the pH probe with the wash bottle (above the plastic container) and place the pH probe in the 0.05 M HCl solution. 15. Fill the burette with the NaOH solution using the Pasteur pipette up to about 1 cm above the 0 mark. 16. Put the plastic container under the drop counter, open the tap and adjust the drop rate to about 1-2 drops per second. 17. Make sure that the software recognizes each drop (the drops value is increasing). Experiment C-10 Titration of a Strong Acid and a Strong Base Ver 3.0.2 7 18. When the solution reaches the 0 mark close the tap. 19. Click on the drop counter Module setup icon , then click on the Zeroing button . Notice that the drops in the drop counter window are reset to 0. 20. Click on the Run experiment icon measurement. to start the 21. Open the tap and adjust the drop rate to about 1-2 drops per second. 22. Gently stir the HCl solution during the measurement by moving the beaker with your hand. 23. Keep track of the volume of NaOH added to the HCl solution on your burette and also of the the pH change on the screen. When you see a sharp increase in the pH, write down the volume of the added NaOH solution in this stage. 24. When the pH graph becomes constant, stop the experiment. 25. Your graph should be similar to the following. 26. Save your graph. Experiment C-10 Titration of a Strong Acid and a Strong Base Ver 3.0.2 8 Click on the Experiment setup icon , click on the XY graph tab and choose sensor; then choose drop counter. You will get a graph of the pH of the solution against the added NaOH solution drops. Experiment C-10 Titration of a Strong Acid and a Strong Base Ver 3.0.2 9 Summary questions 1. Describe the change in the pH during the measurement. 2. In this experiment, you have added NaOH to HCl and received a titration graph. Draw a graph of what you would expect to see when an HCl solution is added to a NaOH solution (pH against drops or volume). 3. What was supposed to be the volume in which the rise in pH is very sharp (the equivalence point)? Compare it to your result. If there is a difference, write down possible reasons for it. 4. What is the average volume of each drop? Experiment C-10 Titration of a Strong Acid and a Strong Base Ver 3.0.2