1
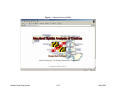
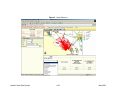
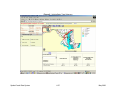
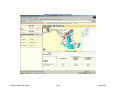
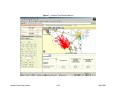
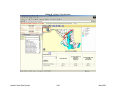
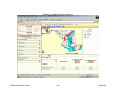
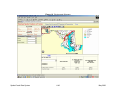
SPATIALLY REFERENCED CRASH DATA SYSTEM
FOR APPLICATION TO COMMERCIAL
MOTOR VEHICLE CRASHES
Sanjay Bapna
Associate Professor
Department of Information Science and Systems
Earl Graves School of Business and Management
Morgan State University
Fidele Grebele
Marcus McCall
Student Assistants
Morgan State University
National Transportation Center
Morgan State University
Baltimore, Maryland
May 2003
DISCLAIMER
The contents of this report reflect the views of the authors, who are responsible
for the facts and the accuracy of the information presented herein. This
document is disseminated under the sponsorship of the Maryland Department of
Transportation and the U.S. Department of Transportation, University
Transportation Centers Program, in the interest of the information exchange.
The State of Maryland and the U.S. Government assume no liability for the
contents or use thereof.
TABLE OF CONTENTS
1.0
2.0
Introduction........................................................................................................................1
System Capabilities...........................................................................................................4
2.1
Mapping Capabilities .............................................................................................5
2.2
Drilling Capabilities ................................................................................................5
2.3
Report Capabilities……………………………………………………….....................5
2.3.1 Summary Report........................................................................................6
2.3.2 Factor Analysis Report ..............................................................................7
2.3.3 Crash Information Report ..........................................................................7
2.3.4 The Identified Crash Report.......................................................................7
3.0
System Description ...........................................................................................................8
4.0
Software Overview ............................................................................................................9
4.1
ArcSDE..................................................................................................................9
4.2
ArcView ...............................................................................................................10
4.3
ArcIMS.................................................................................................................10
4.4
ServletExec .........................................................................................................11
5.0
Conclusion.......................................................................................................................11
Bibliography ................................................................................................................................14
Appendix A: User Manual ........................................................................................................ A 1
A.1.0 Home Page .......................................................................................................... A 1
A.1.1 Logging Onto The System ....................................................................... A 1
A.1.2 Adjusting the Resolution .......................................................................... A 1
A.2.0 The User Interface ............................................................................................... A 2
A.3.0 Menus and Submenus ......................................................................................... A 3
A.3.1 Areas (Regions) ....................................................................................... A 4
A.3.2 Route Type............................................................................................... A 4
A.3.3 Vehicle Type ............................................................................................ A 5
A.3.4 Severity .................................................................................................... A 6
A.3.5 Time Period.............................................................................................. A 7
A.3.6 Collision Type........................................................................................... A 8
A.3.7 Contributing Factors................................................................................. A 8
A.3.8 Environment ............................................................................................. A 9
A.3.9 Junction.................................................................................................... A 9
A.3.10 Renderers .............................................................................................. A 9
A.3.11 Update Map.......................................................................................... A 10
A.3.12 Reset.................................................................................................... A 11
A.3.13 Help...................................................................................................... A 11
A.4.0 Map Frame......................................................................................................... A 12
A.4.1 Map ........................................................................................................ A 12
A.4.2 Tool Bar.................................................................................................. A 12
A.4.3 Legends ................................................................................................. A 16
A.5.0 Report Frame..................................................................................................... A 16
A.5.1 Summary Report .................................................................................... A 17
A.5.2 Factor Analysis Report........................................................................... A 18
A.5.3 Identified Crash Report .......................................................................... A 19
A.5.4 Crash Information Report ................................................................ A 20
Appendix A: Definition Help Screen ........................................................................................ A 22
Spatial Crash Data System
i
May 2003
LIST OF FIGURES
Figure 1:
Opening Screen of MSAC .......................................................................... A 33
Figure 2:
User Interface for MSAC.................................................................................... A 34
Figure 3:
Area Submenu ................................................................................................... A 35
Figure 4:
Route Submenu ................................................................................................. A 36
Figure 5:
Vehicle Body Type Submenu............................................................................. A 37
Figure 6:
Accident Severity Submenu............................................................................... A 38
Figure 7:
Accident Time Period Submenu ........................................................................ A 39
Figure 8:
Collision Type Submenu .................................................................................... A 40
Figure 9:
Contributive Factors Submenu .......................................................................... A 41
Figure 10:
Environment Submenu ...................................................................................... A 42
Figure 11:
Renderer Selection ............................................................................................ A 43
Figure 12:
Identified Crash Report ...................................................................................... A 44
Figure 13:
Crash Information Report................................................................................... A 45
Figure 14:
Factor Analysis Report....................................................................................... A 46
Spatial Crash Data System
ii
May 2003
Abstract
The Maryland Spatial Analysis of Crashes (MSAC) project involves the design of a
prototype of a geographic information system (GIS) for the State of Maryland that has
the capability of providing online crash information and statistical information for
commercial vehicle crashes. MSAC is deployed over the Internet. The system is capable
of displaying crash data such as specific geographic locations, period and time of crash,
crash severity including the number of fatalities, contributing factors, and the cost per
crash, among others. The prototype features a unique horizontal drill capability whereby
the users can either drill down to narrow the scope of search or drill up to expand the
scope of search. The mapping, querying and reporting capabilities are integrated in
MSAC.
Spatial Crash Data System
iii
May 2003
ACKNOWLEDGMENTS
The authors thank the parties who contributed to the content and development of this
document. This document was created based on the participation of many groups and
individuals who were able to provide continuous support to the authors. We list
individuals, whose efforts were vital for the production of this document. However, the
following list is by no means exhaustive.
Lt. Chris Carroll
Maryland Transportation Authority Police
Ms. Jeannie Fazio
Maryland Department of Transportation
Mr. Joe Foster
Maryland Department of Transportation
Captain Guy E. Guyton, Jr.
Maryland State Police, C.V.E.D.
Ms. Mary Jensen
Iowa Department of Transportation
Lieutenant Landon
Maryland State Police, C.V.E.D.
Mr. Jack Martin
State Highway Administration
Ms. Terry Runge-Erle
MD Div. Federal Highway Administration
Mr. Manu Shah
State Highway Administration
Mr. Chuck Shue
State Highway Administration
Mr. John Sittler
State Highway Administration
Spatial Crash Data System
iv
May 2003
1.0 INTRODUCTION
In the year 2000, commercial vehicles in Maryland were involved in 7506
crashes, causing 3,458 injuries and 72 deaths. According to the U.S.
Department of Transportation, in 1998 and 1999, 10 percent of fatal crashes
involved a large truck. In Maryland, the figure was around fifteen percent. These
figures motivated the design of a spatially referenced data system for commercial
vehicle crashes known as the Maryland Spatial Analysis of Crashes (MSAC).
The MSAC project involves the design of a prototype of a geographic information
system (GIS) for the State of Maryland that has the capability of providing online
crash information and statistical information for commercial vehicle crashes. The
system is capable of displaying crash data such as specific geographic locations,
period and time of crash, crash severity including the number of fatalities,
contributing factors, and the cost per crash, just to name a few.
The MSAC design may achieve measurable improvements for commercial motor
carrier enforcement personnel. Crash data will significantly aid the Maryland
State Police (MSP) and Maryland Transportation Authority Police (MdTAP) in
their efforts to efficiently and effectively deploy resources and the State Highway
Administration (SHA) to manage highway development and repair.
The MSAC project responds to the Federal Motor Carrier Safety Administration’s
(FMCSA) goal to reduce the number of deaths and injuries in truck and bus
crashes. Specifically, the proposal addresses FMCSA's objective to design
Spatial Crash Data System
1
May 2003
roadway systems that are “Optimized for Commercial Motor Vehicle Safety”. The
FMCSA 2010 Strategy draft document states the following safety initiative:
"To improve highway infrastructure at high-crash locations,
FMCSA will work with the FHWA and States to ensure that
commercial vehicles are fully considered in the Highway
Safety Improvement Program. These efforts will seek to
assure that high-crash locations for commercial motor
vehicles are identified and specific countermeasures for
heavy vehicles are proposed, and that the planning and
selection of potential projects will include a factor that
recognizes the value of addressing locations where the
crashes are prevalent."
MSAC, therefore, is primarily designed as a system that will allow state agencies,
such as Maryland State Police, the Maryland Transportation Authority Police and
the Maryland Department of Transportation, to quickly and easily access,
manipulate, and display commercial vehicle crash data in a comprehensive
manner to develop a prevention and maintenance plan.
MSAC is a map-based computer information system capable of displaying data
on a screen, based on users’ queries. It allows users to manipulate and narrow
the focus of such queries to arrive at the desired information. For example, users
will be able to see the distribution of commercial vehicle crashes across state
highways. Furthermore, users will understand how the number of commercial
vehicles on the highway, the types of roads they frequent, and the time of day,
can, individually or conjunctly, contribute to a crash. These data are also
available in a form that can be accessed and manipulated by other applications.
The GIS is a powerful system that can access and display large amounts of data
through the use of tables or overlays upon the mapping interface in a meaningful
Spatial Crash Data System
2
May 2003
and intuitive manner determined by the user. The ability to tailor these displays
and alter them at will makes MSAC easy to use and very adaptable.
Because the actual interface of the GIS is spatial, information can also be
displayed in terms of densities. While a table or chart can display statistics from
several different regions, a GIS will allow users to view different regions with a
pictorial representation of data involving crashes according to the density of such
events in relation to other regions. Such visual and statistical comparisons can
also be made in relation to changes in data over time, within the same
geographic area.
Iowa State University’s implementation of a similar system replaces a PC-based
paradigm that required users to maintain paper lists of reference (node)
numbers. With the GIS, users abandon such lists in favor of a map interface,
using a mouse. Initially, benefits from speed and ease of use were the
developers’ sole objectives. Development and implementation, however,
revealed that data can be displayed in themes to differentiate types of crashes in
various areas. These themes can be laid over other themes to reveal a unique
type of data display and analysis. In addition, physical features of highways,
such as sharp grades or curves are displayed alongside these overlays. This
adds an additional layer of information for interpretation.
This new-found power of the Iowa system led the developers to examine
applications specifically in terms of rural areas. Data considering the age of
involved drivers, types of vehicles involved and the type of road (i.e. gravel,
Spatial Crash Data System
3
May 2003
paved, etc.) upon which the crash occurred were all included in the GIS database
and allowed for a far more complete view of data trends across geographic
areas. This particular project is primarily concerned with crashes involving
commercial vehicles but, obviously, GIS are powerful enough to accommodate a
wide variety of data.
Another system in North Carolina is more related to this project’s goal. Tracking
data for commercial vehicle crashes, the North Carolina system includes data
related to crashes as well as supplementary information such as the relative
proximity of trauma centers to different crash concentrations. Population data
also allows their system to track changes in crash density across regions as
populations change over time. The ability to pinpoint such trends allows
enforcement to anticipate future problem areas and upgrade enforcement or
development accordingly.
2.0 SYSTEM CAPABILITIES
The MSAC prototype can be viewed at http://mdaccident.morgan.edu/cvo.
Because the prototype uses real-world data, MSAC is password protected. The
system interface is built with three major capabilities: mapping, drilling and
reporting. Each adds to the system functionality and flexibility with unlimited
manipulation options. Figure 2 provides the user-interfaces corresponding to
these three capabilities. The prototype features a unique horizontal drill
capability whereby the users can either drill down to narrow the scope of search
Spatial Crash Data System
4
May 2003
or drill up to expand the scope of search. The mapping, querying and reporting
capabilities are integrated in MSAC.
2.1 MAPPING CAPABILITIES
The mapping capability allows the user to see the crash locations on a map
interface. Several mapping functions allow the user to go to different map
locations. These include, zoom in, zoom out, panning, etc. The user is able to
visualize crashes on the maps based on crash parameters. Using the identify
tool, the user is able to obtain data on crashes occuring at a specific location.
2.2 DRILLING CAPABILITIES
The drilling capability is built on a multi-layer schema, executed through dropdown lists or check box window menus for each item category. Users can
expand their queries up to nine independent layers of depth. The layers
represent sub-categories of categories that are attributes of a given crash. The
drilling capability allows either the single or multiple selections of menu items,
thereby facilitating comparison possibilities.
2.3 REPORTING CAPABILITIES
The system is capable of generating four types of reports. Reports are tabular
representation of information in the form of text and figures; they offer a synoptic
view of query results. The four types of reports generated by the system are:
Spatial Crash Data System
5
May 2003
Summary Report, Factor Analysis Report, Crash Information Report, and
Identified Crash Report.
2.3.1 THE SUMMARY REPORT
A summary report is a basic report that summarizes query results in terms of
numbers and percentages; the system will generate this report each time a
selection is made and executed (Figure 5). This report will not only summarize
the crashes based on selected criteria, it also includes a comparison for
example, when a user clicks a route on a map and queries the types of crashes
that occurred on that specific route at dusk in the month of November, 1999, the
report will not only present the result for the specific item and its attributes, but it
will also compare these crashes to similar crashes in Maryland on routes of the
same type and to similar crashes in Maryland for all route types. This becomes a
basis for a proper comparison.
This report express cost per crash in terms of comprehensive costs for the whole
year. These costs not only include the economic costs (medical costs,
emergency services, vocational rehabilitation, market productivity, household
productivity, insurance administration, workplace cost, legal/court cost,
premature funeral cost, travel delay, and property damage) of a motor vehicle
crash, but also the intangible consequences of these events to individual families
such as pain, suffering and loss of life. These are calculated in terms of
‘willingness-to-pay’ and are an order of magnitude higher than the economic
costs of injuries. The costs reported are weighted based on costs for each
Spatial Crash Data System
6
May 2003
severity level. These economic costs were obtained from the National Public
Services Institute Research Institute for year 2000 and are as follows based on
severity levels: ‘Not Injured’ was $2,854; ‘Possible Injury’ was $28,408; ‘Injured’
was $57,785; ‘Disabled’ was $212,143; and ’Fatality’ was $3,870,641.
2.3.2 FACTOR ANALYSIS REPORT
The Factor Analysis Report, goes one step further. It is a powerful decisionmaking tool that focuses primarily on the comparison of costs for all values of a
contributing factor (Figure 14). The system will evaluate the cost for all items in
the selected category, and compare and derive the cost differential. The 10
factors addressed in this report are: day of the week, driver/pedestrian condition,
lighting, fixed objects, intersection, junction, month, weather, and year of the
crash.
2.3.3 CRASH INFORMATION REPORT
A Crash Information Report is a detailed report that contains comprehensive data
on a specific crash (Figure 13). Crash information on the time, date, location
(route and area), first and second harmful events (if applicable), vehicle body
type, and conditions such as weather, lighting and road surface, the number of
pedestrians and drivers/occupants killed or injured, are reported.
2.3.4 THE IDENTIFIED CRASH REPORT
Spatial Crash Data System
7
May 2003
The Identified Crash Report is a tabular view of critical attributes of crashes
taking place at a specific location (Figure 12). This allows for the formation of
concepts related to crashes occurring at a certain location (e.g., are the crashes
occurring when one vehicle is making a left turn?) This report is generated by
the user first clicking on the identifier tool (
) located on the map tool bar, and
then clicking on a location on the map. This report lists all crashes at a specific
location. Details on a specific crash can be obtained through the Crash
Information Report described in Section 2.3.3.
3. 0 SYSTEM DESCRIPTION
MSAC has been conceived as a user-friendly environment. The interface has
been designed to provide easy-to-use tools that permit single or multiple
selections of menus and menu items at the click of a mouse. The concept is
based on selection principle; the users need not enter any data since the queries
are based upon predefined values of the selection criteria.
Once users enter the site, they will be directed to a main user interface. The user
interface consists of a single window partitioned into three main sections: the
Menu Frame, the Map Frame, and the Report Frame. This single window
approach allows the users to conveniently access query tools and view query
results in a single window. An additional window will open up automatically only
if the users require detailed information. A user manual on the usage of MSAC is
provided in Appendix A.
Spatial Crash Data System
8
May 2003
4.0 SOFTWARE OVERVIEW
At the heart of the MSAC is the integration of several software packages. The
integration is carried out by means of development tools and programming and
scripting languages. The system operates on a Windows 2000 server, the web
pages are served through Internet Information Server (IIS) communicating with
ServletExec, a Servlet Engine for java-based pages, and with Oracle 8i as a
back-end relational database management system. The core of the geographical
information system is designed and supported through ArcGIS, a proprietary
software suite which consists of ArcView, ArcSDE and ArcIMS. A quick overview
of these different GIS tools is given below to highlight the key features, and
functionality of these tools.
4.1 ArcSDE
ArcSDE functions as the GIS gateway; it serves as an interface between the
relational database and the rest of the GIS. ArcSDE permits spatial data
representation capabilities and provides a mechanism for managing feature
geometry. It is compatible with several database management systems as
Oracle, Informix, DB2 and Microsoft SQLServer. ArcSDE is a scalable
application that can be customized to fit the size of the user data. This software is
a server for spatial geographical information systems. ArcSDE offers two
configurations: direct connection and server-based. The direct connection
platform enables the connection of each client-user to a local DBMS. This
architecture offers ease of installation and administration. The server-based
configuration, on the other hand, is faster and provides higher performance.
Spatial Crash Data System
9
May 2003
ArcSDE also allows the transfer of spatial data between database management
systems without loss. For example, the system will preserve the integrity of
geographical data and will delineate ill-formed features. The data portability
feature allows application developed with ArcSDE Application Program Interface
to invariably run on different physical schemas.
4.2 ArcView
ArcView is the desktop model of the ArcGIS suite. It is the point of entry to the
ArcGIS platform. It provides visualization, analysis and integration of basic
geographical information systems. ArcView includes other tools such as
ArcCatalog that serves a function similar to Windows Explorer for spatial data.
ArcView adds the capabilities of creating and editing shape files and simple
features in geodatabases.
4.3 ArcIMS
ArcIMS is a web-based mapping system that permits the development and
deployment of GIS data and services within an intranet or on the World Wide
Web. This tool enables the integration of data from various sources and also
provides scalability for a collaborative multi-user environment. ArcIMS is
compatible with clients that can communicate in ArcXML, the ArcIMS language.
Some of these clients, such as HTML and Java are shipped with the software;
others are part of the ArcGIS suite while others are wireless or customized
clients. Other ArcIMS features are map services, enhanced GIS capabilities and
Geographical Network access. The map service facilitates the design of
customizable maps; the enhanced GIS capabilities favor enhanced image
Spatial Crash Data System
10
May 2003
rendering, data query, extraction, and sharing; and the geographical network
facilitates the access to unlimited number of maps, such as roadmaps.
4.4 ServletExec
Servlets function as dynamic interfaces between the web server and the browser.
When a user requests a page from a web site, for example, a command is sent
to the server to locate the designated page. Servlets will play the role of
translators between the user’s computer and the computer on which the web
page is located. They provide better performance and scalability than other
programs such as scripting languages. They are more reliable and easy to
implement. Servlets operate on servers known as containers or ServletEngines.
Several versions of ServletEngines exist. ServletExec is a proprietary software
that can run on all major web servers, such as Microsoft IIS, Netscape, and
Apache; it is supported by such platforms as Windows NT/2000, SPARC, Solaris,
Linux, and many other systems. ServletExec provides web application security,
resource monitoring, general performance enhancement and a straightforward
installation and configuration process. The application server runs as a standalone process, separate form the web server, which adds to its flexibility and
performance.
5. 0 CONCLUSION
Maryland Spatial Analysis of Crashes was concieved as a user-friendly prototype
for systems that will aid in the analysis of crashes. Several outcomes have
Spatial Crash Data System
11
May 2003
resulted from the design of the system. First, the system has been well received
by the major stakeholders for crashes (Maryland Department of Transportation,
State Highway Adminstration, and vehicle enforcement personnel). Second, the
prototype system has advanced knowledge on drilling mechanisms in the design
of user-friendly systems. This study proposes a horizontal drilling schema,
whereby, users can either drill down by narrowing the search, or drill up by
expanding the scope of the search. This searching mechanism, as proposed in
the design, leads to flexibility in order to form concepts on crashes.
While this prototype represents the best of the breed for spatial crash analysis,
the technology is yet to be deployed. There are numerous hurdles for the
deployment of such technologies: the privacy of data and information, access to
information technology services, coordination among agencies not directly
involved with commercial vehicles, etc.
Using the prototype as a benchmark, it
may be possible to overcome the hurdles to deploy a production version of the
system. This would entail the transfer of crash technologies amongst several
state agencies that have a stake in Commercial Motor Vehicle Operations (CVO).
The Motor Carrier’s Inter Agency Coordinating Group (IACG) has been at
forefront for effective coordination between agencies through a Memorandum of
Understanding. The success of the IACG implies that the necessary processes
exist in the state for the effective transfer of such technologies. Moreover, the
system can easily be extended to all motor vehicle crashes thereby significantly
increasing the utilility of such systems.
The technology transfer will involve analysis of privacy issues and geocoding
processes, study of data upload systems, design and analysis of data download
Spatial Crash Data System
12
May 2003
systems, analysis and design of user interfaces, and coding of enhancements to
MSAC. These efforts are continuing and the prototype is in a continual state of
enhancements based on available resources.
Spatial Crash Data System
13
May 2003
BIBLIOGRAPHY
”2010 Strategy: Saving Lives Through Safety, Innovation, and Performance,” U.S.
Department of Transportation, Federal Motor Carrier Safety Administration, Washington,
D.C., Draft, January 29, 2001
“Arc View ALAS Suggested Improvement List”, http://www.ctre.iastate.edu/Research
/gis-alas /papers/improve.htm, Center for Transportation Research, Iowa State
University.
Azar, K. and Ferreira, J.,“Integrating Geographic Information Systems into Transit
Ridership Forecast Models,” Journal of Advanced Transportation, Vol. 29, No. 3,
Winter/Fall 1995.
Bapna, S., Zaveri, J., and Farkas Z. A., “Benefit-Cost Assessment of the Commercial
Vehicle Information Systems and Networks (CVISN) in Maryland,” National
Transportation Center, Morgan State University, Baltimore, October 1998.
Bayapureddy, D., “Geographical Information System for Identification of High Crash
Locations”, 1996.
Betti, N., “Crash Rate on Highways in Austin, Texas”, http://www.ce.utexas.edu/
Stud/bettinp/final.html, University of Texas, Austin.
Blincoe, J. L., “The Economic Cost of Motor Vehicle Crashes”, Plans and Policy,
National Highway Traffic Safety Administration, Washington, DC, 1994.
Faghri, A. and Raman, N., “A GIS-based Traffic Crash Information System,” Journal of
Advanced Transportation, Vol. 29, No. 3, pp. 321-334, Winter/Fall 1995.
“GIS-based Crash Location and Analysis System (GIS-ALAS) Phase 2 Proposal,”
http://www. ctre.iastate.edu/Research/gis-alas/prop_ph2.htm, Center for Transportation
Research, Iowa State University.
Hans, N. Z. and Souleyrette, R. R., “ GIS and Network Models: Issues for Three
Potential Applications,” Journal of Advanced Transportation, Vol. 29, No. 3, pp. 355-373,
Winter/Fall 1995.
Hans, N. Z. and Souleyrette, R. R., “ GIS-based Highway Design Review System to
Improve Constructabilty of Design,” Journal of Advanced Transportation, Vol. 29, No. 3,
Winter/Fall 1995.
Lang, L., “Transportation GIS,” Redlands, CA: ESRI Press, c1999.
List, F. G. and Turnquist, A. M., “A GIS-based Approach for Estimating Truck Flow
Patterns in Urban Settings,” Journal of Advanced Transportation, Vol. 29, No. 3, pp. 281298, Winter/Fall 1995.
Spatial Crash Data System
14
May 2003
“The Maryland Automated Crash Reporting System ( MAARS), Instruction and
Reference Manual”, Central Records Division, Pikesville, Maryland, January 1993.
“Traffic Safety Facts 1999: A Compilation of Motor Vehicle Crash Data from the Fatality
Analysis Reporting System and the General Estimates System,” National Highway
Traffic Safety Administration, National Center for Statistics and Analysis, U.S.
Department of Transportation, Washington, DC, December 2000.
Nielsen, A. O., “Using GIS in Denmark for Traffic Planning and Decision Support,”
Journal of Advanced Transportation, Vol. 29, No. 3, pp. 335-354, Winter/Fall 1995.
Pawlovich, D. M., Estochen, B., and Strauss, T., “The Application of Geographic
Information Systems to Improve Rural Highway Safety,” Center for Transportation
Research, Iowa State University.
Souleyrette, R. R. and Gieseman J. D.,“ Development of an Automated Crash-Location
System for Iowa AASHTO’s GIS-T,” Center for National Research and Education, San
Diego, 1999.
Souleyrette, R. R., Strauss, T., Pawlovich, M., and Estochen, B., “GIS-ALAS: The
Integration and Analysis of Highway Crash Data in a GIS Environment,” Center for
Transportation Research and Education, Iowa State University.
Razavi, H. A., “ArcView GIS/Avenue Developer’s Guide,” 3rd ed., Santa Fe: OnWord
Press, c1999.
“What Does GIS Offer,” http//: www.bts.gov/gis/reference/GIS_T2000/presentations/
441/4/sld006.htm, Bureau of Transportation Statistics.
Spatial Crash Data System
15
May 2003
APPENDIX A: USER MANUAL
This user manual will guide you through navigating the MSAC system. Examples
in each section will show you a systematic process based on your searches.
These examples do not constitute mandatory selections for arriving at specific
results. Sequences in each search are either beginning or continuation
processes and may vary accordingly.
A.1.0 THE HOME PAGE
The home page consists of the flag and the map of the state of Maryland (Figure
1).
A.1.1 LOGGING ONTO THE SYSTEM
To log on the system, make sure that your monitor display screen is adjusted to
1024x768. If your screen is already adjusted to the advised size, click on the flag
in the center of the home page.
A.1.2 ADJUSTING THE RESOLUTION
In order to view the MSAC web site, you must set the display size of the monitor
to 1024x768. Click on the message box ‘Recommended for Display Size:
1024X768’ which will open an instruction window to guide you as described in
the steps below for Windows 95/98.
•
Click Start on the bottom left hand corner of the computer screen.
•
Go to Settings > Control Panel.
Spatial Crash Data System
A1
May 2003
•
Double click the icon labeled Display.
•
Click the Settings tab.
•
Under Desk Area, drag the slider until the resolution is set to 1024x768.
•
Log on to the system by clicking on the flag.
A.2.0 THE USER INTERFACE
When you click on the flag, you are directed to a screen as shown in Figure 2.
The window is divided into three main categories: Menu Frame, Map Frame, and
the Report Frame. The Menu Frame allows you to build selection criteria
(SELECTIONS) and apply the selection criteria to the map (FUNCTIONS). The
SELECTION menus include the following menus: Area, Route Types, Vehicle
Body Type, Severity, Time Period, Collision Type, Contributing Factors,
Environment and Junction. The FUNCTION menus allows you to update the
maps and reports based on selection criteria and to apply renderings to the map
by selecting an appropriate rendering criteria.
The Map Frame is the area of the window where all maps and corresponding
legends are displayed. This frame also consists of mapping tools that enable a
user to zoom in, or zoom out, pan to another location in the map, print maps,
change the map extent, and identify events on the map by clicking on it. The
Map Frame is the spatial component of MSAC.
The Report Frame is the area of the window where all a tabular representation of
information is generated. The type of a report generated will be based on the
state of the system. Initially, this frame will contain the basic navigation help
Spatial Crash Data System
A2
May 2003
(Figure 4). Once the user selects a search criteria and updates the map, this
frame will be populated by summary cost information on the selected criteria. If
the user clicks on a location in the map that has a crash, this frame will be
populated by basic information on crashes occurring at that location. The data
contained in each report will vary to match the search criteria.
A.3.0 MENUS AND SUBMENUS
Menu selection is performed by clicking on a selection item on the Menu Frame.
Submenu selection is performed primarily through the use of a mouse, either by
selecting an item in a drop-down list or by clicking on a checkbox item. You may
select only one item at a time in a drill-down list. The menu frame is the entry
point to the analysis of crashes. User-interfaces, drop-down lists and checkboxes are discussed next.
Drop-down lists are selection menus that only allow a single selection from that
specific list. For example, you can select only one district from the District dropdown list in the Area sub-menu. In many instances, the user will be allowed to
select only one criterion from multiple drop-down lists. As an example, if the user
selects a District, the prior selection of State Map, County and Municipality
will be erased. This feature is present for all drop-down lists of the Area submenu, five drop-down lists of Route Type sub-menu, and five drop-down lists for
Contributing Factors sub-menu.
Check-boxes allow you to make multiple selections in each category. You may
check any number of items in the boxes listed.
Spatial Crash Data System
A3
May 2003
Selection of Ellipses (…) in drop-down lists and ‘All’ in check boxes implies not
selecting a specific value for that choice. These are the default settings for
MSAC. Not Applicable, Other, and Unknown values are placed in appropriate
drop-down lists whenever they appear in the database. You may need to select
one of these based on your desired analysis.
A.3.1 AREAS (REGIONS)
Areas includes all regions in the state of Maryland. These regions are
administrative territories that are based on the SHA delineation. The Area
selection features the entire state of Maryland, seven Districts numbered from
one to seven; and Municipalities and Counties ordered alphabetically. Area is
the default window of the user interface (Figure 3). To select Baltimore County as
the area of interest:
•
Click the drop-down list County in the Selection frame, below the main
menu.
•
Select ‘Baltimore’ from the drop-down list. A map of Baltimore County will
automatically be generated. (Clicking Update is not required for items in
the Area category).
A.3.2 ROUTE TYPE
The Route Type submenu includes seven alternative ways to specify route
selections (Figure 4). Selecting a choice from ‘All Routes’ will allow you to select
all routes in Maryland that are of the selected choice type of routes. For
example, selecting ‘Interstate’ from this drop-down list and then clicking on
‘Update Map’, all the Routes in Maryland that are of type ‘Interstate’ will be
Spatial Crash Data System
A4
May 2003
displayed and analyzed. The next set of selections allows you to perform
analysis on a specific route e.g., Interstate Route 95. You may select specific
routes of types: Maryland Routes, U.S. Routes, Interstate Routes, County
Routes, or you may even pick your own route from nine pre-selected route types.
For example, to select US Route 1,
•
Click Route from the main menu.
•
Choose ‘1’ in the drill-down menu US Routes.
•
Click Update Map to apply your selection.
To select a route not listed, select the route type from the drop-down list in the ‘or
Pick Your Own Route’ area, and then manually enter the route number e.g., ‘204’
in the box provided next to the route type selections. Click Update Map to apply
your selection. The user may optionally select an appropriate direction from the
‘Lane of Accident’ drop down list. These directions correspond to South, North,
East and West.
A.3.3 VEHICLE TYPE
This selection allows you to chose from six commercial body types: Single Truck
2 Axles, Single Truck 3 Axles, Truck, Truck Tractor, Transit Bus, Cross Country
Bus, and School Bus. (Figure 5). To select body type Transit Bus, for example,
•
Click Vehicle Type on the main menu.
•
Check ‘Transit Bus’ in the Vehicle Body Type sub-menu and then click on
Update Map.
On the Map Frame, the current map extent will show transit bus crash locations.
Transit Bus crash analysis will be displayed in the Report Frame. To perform
Spatial Crash Data System
A5
May 2003
analysis on all the vehicle types, do not uncheck the ‘All’ box that has been
checked by default.
A.3.4 SEVERITY
The check boxes in the Severity category display six crash severity levels
(Figure 6). You may select one or more of the checkboxes labeled ‘Fatalities’,
‘Disabilities’, ‘Injuries’, ‘Possible Injuries’, ‘Not Injured’, or ‘Unknown’.
Extending the example described in the previous section (Vehicle Type), you
may be interested in transit bus crashes that resulted in either a fatality or a
disability. In this case, click the Update Map menu only after you have selected
all the conditions to build the search criteria. Follow the steps below.
•
Click Severity from the main menu.
•
Click on the ‘Fatalities’ and the ‘Disabilities’ check boxes making sure that
they are checked.
•
Click Vehicle Type on the main menu.
•
Check ‘Transit Bus’ in the Vehicle Body Type sub-menu.
•
Finally, click the Update Map menu from the FUNCTIONS menu items.
The new map generated will display transit bus crashes that resulted in a fatality
and/or a disability. The Report Frame will show the number and the cost per
crash for transit bus crashes that resulted in a fatality and/or a disability. To
perform analysis on all the vehicle types, do not uncheck the ‘All’ box that has
been checked by default.
Spatial Crash Data System
A6
May 2003
A.3.5 TIME PERIOD
Time Period (Figure 7) allows you to select any combination of eight years (1994
through 2001), 12 months (January through December), seven days of a week
(Monday through Sunday), and six four-hourly time intervals of a day (12 AM – 4
AM through 8 PM – 12 AM). For example, if you want to view the number of fatal
transit bus crashes that occurred between 4PM and 12AM, on Fridays in 1995,
do the following:
•
Click Time Period from the main menu.
•
Check ‘1995’ from the Year check-box menu.
•
Select ‘Friday’ in the drop-down list.
•
Check ‘4 PM – 8 PM’ and ‘8PM – 12 AM’ from the Time Interval check
boxes making sure that they are checked.
•
Click Severity from the main menu.
•
Click on the ‘Fatalities’ check box making sure that it is checked.
•
Click Vehicle Type on the main menu.
•
Check ‘Transit Bus’ in the Vehicle Body Type sub-menu.
•
Click the Update Map menu from the FUNCTIONS menu items.
The new map generated will display transit bus crashes that resulted in a fatality
on Fridays between 4PM – 12 AM in 1995. The Report Frame will show the
number and the cost per crash for the above criteria. To perform analysis on all
the vehicle types, do not uncheck the ‘All’ box that has been checked by default.
You may add Months for analysis if you wish.
•
Click Month in the check box then select the desired month.
•
Click the Update Map menu from the FUNCTIONS menu items
Spatial Crash Data System
A7
May 2003
A.3.6 COLLISION TYPE
This drill-down menu offers you the selection of vehicle movement and direction
(Figure 8). You may select movements, such as ‘Acceleration’, ‘Moving Constant
Speed’, and directions such as, ‘Head On’, ‘Head On Same Direction’, etc. To
select all head on crashes that occurred when a vehicle was moving at constant
speed, do the following.
•
Click Collision Type from the main menu.
•
Select Movement and choose ‘Constant Speed’
•
Select Direction choose ‘Head On’
•
Click the Update Map menu from the FUNCTIONS menu items.
A.3.7 CONTRIBUTING FACTORS
The drop-down lists in this menu category permit you to select one from five
types of contributive factors: ‘Driver/Pedestrian/Cyclist’, ‘Pedestrian/Cyclist’,
‘Environment Effect’, ‘Vehicle Defect’, and ‘Road Condition’. Optionally, you may
select a value from the First Harmful Event drop-down list. To select or add a
Contributing Factor to a selection,
•
Click Contributing Factors on the main menu.
•
Select one factor from the first five drop-down lists and choose only one
element in that list.
•
Click the Update Map menu from the FUNCTIONS menu items.
Spatial Crash Data System
A8
May 2003
A.3.8 ENVIRONMENT
The Environment drop-down menu allows you to select one of three types of
environmental conditions: Lightning, Weather, and Road Surface Condition
(Figure 10). For example, if you are interested in the analysis of foggy weather,
•
Click Environment on the Main Menu.
•
Select ‘Foggy’ from the Weather sub-menu drop-down list.
•
Click the Update Map menu from the FUNCTIONS menu items.
A.3.9 JUNCTION
The Junction Menu permits the selection of Junction or Intersection related
crashes. The Junction list allows the selection of six junction types while the
Intersection list permits the selection of a ‘Yes’ or ‘No’ value. You may select
from both the Junction and the Intersection drop-down lists. You may choose a
junction type and state whether or not the crash occurred at an intersection. For
example:
•
Click Junction from the main menu.
•
Select ‘Driveway Access’ from the Junction drop-down list in the submenu.
•
Select ‘Yes’ from the Intersection drop-down list.
•
Click the Update Map menu from the FUNCTIONS menu items.
A.3.10 RENDERERS
Renderers allow you to specify the display of crash locations based on the values
of an attribute. Renderers are conceptually similar to legends since they add
visibility and clarity to the identification and differentiation of crash locations. You
Spatial Crash Data System
A9
May 2003
can view the crash locations for nine rendering attributes: Body Type, Time of
Crash, Surface Condition, Driver Condition, Day of the Week, Lightning, First
Harmful Event, Road Division, and Weather. For example, if you wish to display
the crashes in terms of crash severity, do the following.
•
Click Renderers from the main menu.
•
Select ‘Crash Severity’ from the Sub-menu.
•
Click the Update Map menu from the FUNCTIONS menu items
The map will be rendered in terms of crash severity; different types of crash
severities will be displayed in different colors.
A.3.11 UPDATE MAP
The Update Map menu item enables the selection of any selected criteria to take
effect. This button is similar to the ‘go’, or ‘submit’ button with a submit function.
Except for Area category, the Update Map menu item must be activated each
time you complete a selection criteria. For example, to select all crashes on U.S.
Route number 1,
•
Click Route from the main menu.
•
Choose ‘1’ in the drill-down menu US Routes.
•
Click Update Map to apply your selection.
A new map will be generated. The ’Retrieving Map’ message precedes each map
generation to let the user know that the system is responding to the request. The
Report Frame will display the statistics associated with the selected criteria.
Spatial Crash Data System
A 10
May 2003
A.3.12 RESET
This button simply resets to the default interface. The Reset link will erase all the
prior selections made by you. This feature is useful to start a new analysis. To
start a new analysis,
•
Click Reset from the main menu. The system will interrupt any other
tasks to set you back to the default interface.
A.3.13 HELP
The system features three types of help aids: navigation help, user manual (this
manual), and sub-menu/report frame help.. The navigation help appears on the
Report Frame when MSAC loads for the first time and provides a first time user
with necessary guidelines to use the system. The sub-menu/report frame help
links are similar to the user guide; these aid you in understanding the navigation
issues with the specific sub-menu/report. These are hyperlinked to the
appropriate definitions when available. When clicked, these hyperlinks will take
you to the Definition Lists (Appendix A). Definition Lists are alphabetic
arrangement of terminology used in the MSAC documentation. As an example,
to obtain help on using Route Type, do the following.
•
Select Route from the main menu and click on Help located on the right
on the Route Selection sub-menu frame. You will be directed to a new
window that explains how you can use this sub-menu.
•
If you click the hyperlink ‘Lane of Accident’, you will be directed to the
Definition List that will define the ‘Lane of Accident’ as used in MSAC.
Spatial Crash Data System
A 11
May 2003
A.4.0 MAP FRAME
The map frame is a dynamic environment consisting of a map, a tool bar and a
legend that are functionally related.
A.4.1 MAP
The map in the MSAC represents regions, routes, and crashes in the state of
Maryland. By default, only the major U.S. Highways, Interstates routes,
Municipalities, County borders, and Water are shown on the map. By default,
identifying names do not appear on the map. Crashes are shown in red only
when the user selects and updates a search criterion. Route names appear only
when the user zooms in close enough in the map.
A.4.2 TOOL BAR
The tool bar offers you directional manipulation, zooming manipulation,
identifying map locations, printing capabilities, and overview map display. The
following tools appear in the tool bar from left to right (see below): Toggle
Overview Map, Zoom In, Zoom Out, Zoom to Full Extent, Back to Last Extent,
Pan, North Pan, South Pan, West Pan, East Pan, Identifier, Clear Selection and
Printer.
To manipulate a map object using the tool bar,
Spatial Crash Data System
A 12
May 2003
•
Click on the appropriate Tool on the tool bar menu. A red colored border
surrounds the tool signifying that the tool is active.
•
For Zoom In, Zoom Out, Pan, and Identify tool, position the cursor on to
the map. The cursor will change into a cross. Click on the Map for the
effect to take place. For all other tools, clicking on the tool will achieve
the effect.
The toggle map overview
located on the top left of the map frame, toggles
the overview map on and off at each click of that tool. The overview map
appears in the small rectangle located in the top left corner of the map area.
Use Zoom In tool
to zoom in to view more details on the map. When the
Zoom in tool is active, each click on the map will zoom in to a greater depth.
You may zoom in to any depth level by repeatedly clicking on the map. This tool
also allows you to zoom to any specific zoom level by using the mouse, as
described below.
•
Click on the Zoom In tool. A red colored border surrounds the tool
signifying that the tool is active.
•
Position the cursor on any area of the map that you would like to zoom in.
•
Press the left mouse button.
•
Drag the mouse over to a new location while the left mouse button is
pressed. A red colored rectangle defines the zoom in area.
•
Release the left mouse button.
Spatial Crash Data System
A 13
May 2003
Use the Zoom Out tool
to zoom out to get a birds-eye view of the map area.
When the Zoom Out tool is active, each click on the map will zoom out to a
lesser depth. You may zoom out to any depth level by repeatedly clicking on the
map. This tool also allows you to zoom out to any specific zoom depth level by
using the mouse, as described below.
•
Click on the Zoom Out tool. A red colored border surrounds the tool
signifying that the tool is active.
•
Position the cursor on any area of the map that you would like to zoom
out.
•
Press the left mouse button.
•
Drag the mouse over to a new location while the left mouse button is
pressed; red colored rectangle defines the zoom out area.
•
Release the left mouse button.
Click
(Zoom to full extent) tool to zoom to the full extent of the map i.e., the
entire state of Maryland will be visible by using this tool.
Click
(Revert to the last extent) tool to zoom to the extent that appeared on
the previous map.
Use the
(identify) tool to view details on crashes that have taken place in a
specific map location. The use of this tool is described below.
•
Click on the Identify tool. A red colored border surrounds the tool
signifying that the tool is active.
•
Click on a location on the map where the crashes are visible.
Spatial Crash Data System
A 14
May 2003
The Report Frame will now contain the Identified Crashes report and a large
red circle will appear on the clicked area on the map. If you clicked on a map
location where no crashes took place, the message “No features from Accidents
were selected” will appear in the Report Frame.
The
(pan) tool is used to move the map around in the map frame. In addition
to moving North, South, East, and West, this tool allows you to move in any
direction without changing the zoom level.
•
Click on the
(pan) tool on the tool bar menu. A red colored border
surrounds the tool signifying that the tool is active.
•
Position the cursor on any area of the map that you would like to move
around. The cursor will change into a cross.
•
Press the left mouse button
•
While the left mouse button is pressed, drag the mouse over to a new
location.
•
Release the left mouse button.
Click the Pan
tools to move the map North, South, East, or West on
the map frame. This tool does not change the zoom level.
The
(Clear selection) tool clears the selection made to the map when the
user has either used the identify tool or the rendering features. The Identify or
the rendering features changes the manner in which the crashes are displayed.
For instance, the clear selection tool clears the large red circle by applying the
(identify) tool.
Spatial Crash Data System
A 15
May 2003
Use the
•
(printer) tool to print only the map.
Click on the
(printer) tool. A red colored border surrounds the tool
signifying that the tool is active.
•
A Print Map window pops up. Type an appropriate title to be displayed
on the map in the Print Form window.
•
Click on Create Print Page button to open a new map window that
contains the map, overview map, and the legend. You can print this by
using the Print menu of your browser.
A.4.3 LEGENDS
A legend is a symbolic representation of an object to add clarity to a map. The
legend identifies the patterns and colors assigned to a category on the map.
Legends identify crashes, highway types, water, municipalities, etc. Used in
conjunction with Renderers, the legend will identify crashes by each value of that
renderer. For instance, when you select a renderer such as Weather, the
crashes are shown on the map in a pre-selected color scheme based on the
value of weather.
A.5.0 REPORT FRAME
This section of the screen will generate the following four different types of report
based on your search: Summary Report, Factor Analysis Report, Identified Crash
Report and Crash Information Report.
Spatial Crash Data System
A 16
May 2003
A.5.1 SUMMARY REPORT
A summary report is a basic report that presents crash data in a summarized
tabular format. This report compares the occurrences and dollar costs of a crash
for a specified criteria with data of similar crashes for all Maryland routes of
similar type as specified in the criteria and with all Maryland routes regardless of
route types for the same criteria (Figure 5). The table consists of four columns
and two rows of data. The column labeled ‘Factors’ consists of a drop-down list
that permits the selection of contributing factors. Pressing the ‘Analyze’ button
below the drop-down menu will activate a selection from the factor drop-down list
and produce a Factor Analysis Report. Data for a specific crash criteria,
comparative data for similar route types in Maryland, and the data for similar
criteria for all Maryland routes are featured respectively in columns labeled ‘Your
Criteria…’, ‘All Maryland.. Route Type’, and ‘All Maryland…Criteria…’. The
number of crashes and the cost per crash for the selected criteria are
respectively displayed in the ‘Total…’ and the ‘Cost Per Crash’ columns. To view
a summary report, as an example, for I-695 in Baltimore County,
•
Click Area from the main menu and select ‘Baltimore’ in the County dropdown list.
•
Click Route Types from the main menu and select ‘695’ from the
Interstate Route drop-down list.
•
Click Update Map
Spatial Crash Data System
A 17
May 2003
A summary report that will be generated will display crash data on I-695. The
column ‘Your Criteria’ will display the figures for I-695 in Baltimore County. The
column, ‘All Maryland with Criteria (Routes of Type IS Routes)’ column will
display the corresponding figures for all Interstate routes in Maryland. The last
column ‘All Maryland With Criteria (All Routes)’ will display all crashes in
Maryland, regardless of route type.
A.5.2 FACTOR ANALYSIS REPORT
A Factor Analysis Report is a detailed report that displays crash cost data
(Figure 14). Accessed from the Summary Report (Figure 3) by clicking on the
Analyze button, this report appears in a separate window. The report is a
tabular format consisting of four main columns that parallel specific crash data
with data of similar crashes in Maryland.
The column labeled ‘Factors’ features one of 10 selectable contributing factors:
Day of the Week, Driver/Pedestrians Condition, Fixed Object Involvement,
Intersection, Junction, Lighting, Month of Crash, Time of Crash, Weather, and
Year of Crash. The column labeled ‘Selection Criteria’, from left to right, features
the percentage and dollar cost for each sub-category of the selected criteria. For
the criterion ‘Day of The Week’, for example, the report will feature data for each
day of the week from Monday through Sunday. The column ‘Maryland Route of
Type: …’ compares data for the all routes for the selected route type with data
from the previous ‘Selection Criteria’ column. Finally, in the ‘Cost Differential’
column, the cost differential between the average cost for the selected criteria
Spatial Crash Data System
A 18
May 2003
and the selected criteria for same route types is displayed. The table will feature
as many rows as possible to accommodate the sub-categories of each selected
factor. An example of generating a Factor Analysis report is given below.
•
Click Areas, and select ‘Baltimore’ in the County drop-down list.
•
Click Route Types from the main menu and select 695 from the
Interstate Route drop-down list.
•
Add as many criteria as you desired and click Update Map on the main
menu. Go to the summary report in the Report Frame.
•
In the Factor Analysis column of the Summary Report, click the Analyze
button.
A report with the heading ‘Factor Analysis (Cost Per Crash)’ will be generated
along with a day stamp located below the title. Pressing the Print button located
in the upper right corner allows the user to print the report.
A.5.3 IDENTIFIED CRASH REPORT
The Identified Crash report is a detailed report that displays crash data in seven
dimensions (Figure 12). Below the title ‘Identified Crash’ in the report, the name
of the selected Area (one of either County, Municipality, or District) is displayed.
From left to right, the columns displayed are the route, date, time, lighting
condition, collision type, vehicle body type, and events contributing to the crash.
The number of displayed rows of data varies based on the number of crashes for
the selected criteria. Moreover, for crashes that involve more than one vehicle,
multiple lines will be displayed. Each line for a specific crash lists the vehicle
type and the event contributing to the crash for that vehicle. Crashes that
Spatial Crash Data System
A 19
May 2003
resulted in at least an injury are displayed in red color fonts. Before viewing an
Identified Crash Report, make sure the map elements are visible for you to pointand-click at a specific location on the map. You may adjust the visibility by using
the navigation functions on the tool bar, such as the magnifier. To generate an
Identified Crash Report for a location in Baltimore County do the following:
•
Click Area from the main menu.
•
Select ‘Baltimore’ from the County drop-down menu.
•
Now click the Identifier (
) button on the tool bar in the Map Frame, and
then click on a point on the map where you see crashes.
The crash data for the selected location will be displayed in the Identified Crash
Report. If you desire to obtain more information, click the blue ‘More’ hyperlink
on the far right of the report.
A.5.4 CRASH INFORMATION REPORT
The Crash Information report is a detailed report that contains comprehensive
crash data (Figure 13). Presented in a text and tabular format, this report
features many attributes of a crash. Located in the upper side of the report, the
text portion displays crash information, such as the time, date, location (route and
area), the first and second harmful events (if applicable), vehicle body type, and
conditions such as weather, lighting and road surface.
The second portion of the report is a table that lists the number of pedestrians
and drivers/occupants killed or injured. Apart from the title line, this table consists
of two main parts. From left to right, the first two columns contain data on the
number of pedestrians killed or injured while the last two columns lists the
Spatial Crash Data System
A 20
May 2003
number of drivers/occupants killed or injured. To view a Crash Information
Report for Baltimore County, do the following:
•
First, click the Area button on the main menu.
•
Select ‘Baltimore’ from the County drop-down list. A map of Baltimore
County will be generated.
•
Click the identifier (
) button located on the tool bar in the map frame
and then point to a crash location on the map. Click on the crash location.
The Identified Crash Report will be generated in the Report Frame.
•
Click the ‘More’ hyperlink to view the Crash Information Report.
Spatial Crash Data System
A 21
May 2003
DEFINITION HELP
SCREEN
-ACCIDENT
Accident refers to a Motor Vehicle Accident. A motor vehicle accident is one in which a motorized device
used for transit is involved in an unintentional loss or property damage. This technical definition insists on
the following four elements: a motor vehicle, traffic, trafficway and an accident.
Motor Vehicle is a motorized device used for transport. To qualify, the vehicle must be in motion, ready for
motion or improperly parked where traffic is intended to move. Traffic is associated with the road location
where motor vehicles are intended to travel. Trafficway is any land way open to the public for moving
persons or property from one place to another. Accident is an unintentional event that results in loss or
property damage.
-ACCIDENT DATE
The Accident Date identifies the date, year, month and day of the week in which the accident occurred. If
the day is unknown, the accident is attributed to the first of the month.
-ACCIDENT TIME
Accident Time specifies the time of the accident. Accident time is difficult to determine and is often
estimated incorrectly. However, six time groups can be selected: the default selection for time is All. Below
are the possible time categories.
ACCIDENT TIMES
12:00 AM - 4:00AM
12:00 AM - 4:00 PM
4:00 AM - 8:00 AM
4:00 PM – 8:00 PM
8:00 AM - 12:00 PM
8:00 PM - 12:00 PM
-ACCIDENT AREA (LOCATION)
Accident Location specifies the geographic location where the accident occurred. These locations are
classified on an administrative basis according to their importance, such as in the following example.
County: Frederick County
District: Salisbury
Municipality: Ocean City
Spatial Crash Data System
A 22
May 2003
-BODY TYPE
The Body Type includes the type of vehicle involved in the accident, such as a school bus, a two-axle truck,
or a motorcycle. The table presents the possible vehicle body types.
BODYTYPES
Not Applicable
School Bus
Motorcycle
Ambulance/Emergency
Automobile
Ambulance/Non-Emergency
Station Wagon
Fire Vehicle/Emergency
Limousine
Fire Vehicle/Non-Emergency
Single Truck 2 Axles
Police Vehicle/Emergency
Single Truck 3 Axles
Police Vehicle/Non-Emergency
Truck Tractor
Moped
Recreational Vehicle
Pick-up Truck
Farm Vehicle
Van
Transit Bus
Other
Cross Country Bus
Unknown
-COLLISION TYPE
Collision Type (Direction) describes vehicle movement directions. The movement direction of a vehicle is
usually, but necessarily, the same as its orientation direction. For instance, a Head On collision type (><)
would be the correct definition for one vehicle going forward and striking another vehicle backing.
Following are the possible collision types.
COLLISION TYPES
Not Applicable
Straight Movement Angle
Same Dir Both Left Turn
Angle Meets Right Turn
Head On
Angle Meets Left Turn
Head On Left Turn
Angle Meets Left Head On
Same Dir Rear End
Opposite Dir Both Left
Same Dir R-End Right Turn
Single Vehicles
Same Dir R-End Left Turn
Other
Opposite Dir Sideswipe
Same Dir Sideswipe
Same Dir Right Turn
Spatial Crash Data System
A 23
May 2003
-COMMERCIAL VEHICLES
Commercial Vehicles are classified on the basis of their number of "Total Axles" and total weight rating.
Total Axles include axles from the power unit plus any trailer axles.
Gross Weight: is the total of all units of the vehicle including any trailers or semi-trailers as mentioned on
the manufacturer's specification plate mounted on the vehicle.
-CONTRIBUTING CIRCUMSTANCES
These are circumstances that contribute to the accident. The code options for Contributing Circumstances
divided into four categories:
Driver, Pedestian, or Cyclist Condition or Actions are human conditions such blurred vision due to
substance abuse or action such as crossing a road that favor the occurrence of the accident.
Environment Effects refer to any non-human conditions that make the use of the trafficway less practical
and increase the likelihood of an accident.
Vehicle Defects include all vehicle conditions that may cause the operation of the vehicle hazardous.
Road Condition (see definition under road condition)
The following table displays the codes for each category of contributing circumstances
Spatial Crash Data System
A 24
May 2003
CONTRIBUTING CIRCUMSTANCES
DRIVER PEDESTR. CYCLIS. COND/ACT.
DRIVER PEDESTR. CYCLIS.
COND/ACT.
Under influence of drugs
Failed to stop for school bus
Under the influence of alcohol
Wrong way on one way road
Under the influence of medication
Exceeded speed limit
Under combined influence
Too fast for conditions
Physical/Mental Difficulty
Followed too closely
Fell asleep
Improper turn
Failed to drive full time with total attention
Improper lane change
Did not comply with license restrictions
Improper backing
Failed to yield right of way
Improper passing
Failed to obey stop sign
Improper signal
Failed to obey traffic signal
Improper parking
Failed to obey other traffic control devices
Interference/Obstruction by passenger
Failed to keep right of center
PEDESTRIAN, CYCLIST ACTION ONLY
VEHICLE DEFECT
Illegally in roadway
Brakes
Bicycle violation
Tires
Clothing not visible
Steering
Lights
Windows/Windshield
Wheel(s)
Trailer coupling
Cargo
ENVIRONMENT EFFECT
ROAD CONDITION
Smog, smoke
Wet
Sleet, hail, freezing rain
Icy or snow-covered
Blowing sand, soil, dirt
Debris or Obstruction
Severe crosswinds
Ruts, holes, bumps
Rain, snow
Road under constr./mainten.
Animal
Traffic control device inoperative
Vision obstru.(incl. Blinded by sun lights)
Shoulders low, soft, high
Spatial Crash Data System
A 25
May 2003
-CONSTRUCTION or MAINTENANCE ZONE
'Yes' or 'No' marks the presence or absence of Construction or Maintenance Zone. These are zones that are at
the site of the accident.
-FIRST HARMFUL EVENT
First Harmful Event is generally known as the most significant, the most harmful event on which the
classification of the accident is based. These harmful events are summarized in the table below.
FIRST HARMFUL EVENT
COLLISION WITH DESCRIPTION
Other Motor Vehicle in transport
Another motor vehicle in transport
Parked Motor Vehicle
Another motor vehicle not in transport
Pedestrian
Person on foot or on a not-motorized
conveyance that is not a pedal cycle.
Bicycle
A two-wheel pedal cycle driven by
human power.
Other Pedal Cycle
Pedal cars, unicycles, and tricycles
Other Conveyance
Person on a non-motorized conveyance
that is not a pedal cycle
Railway Train
Self-explanatory
Animal
Domestic or wild animal
Fixed Object
An object such as an electrical pole
struck by the first harmful event.
Other Object
All objects that are not under the
collision classification
NON COLLISION
Overturn
Vehicle overturn
Spilled Cargo
Injury or damage resulting from a
cargo spill
Other non-collision
All other Harmful Event including gas
inhalation, explosion, and fire
Spatial Crash Data System
A 26
May 2003
-FIXED OBJECT
A Fixed Object is classified as as a non-moving object that is struck when a harmful event occurs. The table
presents a list of possible fixed object categories.
FIXED OBJECTS
Not applicable
Light Support
Bridge-Overpass
Sign support Pole
Building
Other Pole
Culvert-Ditch
Tree-Shrubbery
Curb
Construction Barrier
Guardrail-Barrier
Crash Attenuator
Embankment
Other
Fence
Unknown
-INJURY SEVERITY
Injury Severity(Accident Type) represents the physical impact on the individuals involved in the accident.
Five categories of severity are known that depict the extent of the accident based on observations made at the
scene of the accident or reported by EMS providers. The following are the possible categories:
Not Injured/ implies that no injury was evident, or the person in question departed from the crash site (but
was not transported by EMS as an injured person).
Possible Injury is any reported or claimed injury that is not a fatal injury, incapacitating injury, or nonincapacitating evident injury.
Injury, Not Incapacitating is any injury, other than a fatal injury or an incapacitating injury, which is
evident to observers at the scene of the accident in which the injury occurred.
Disabled (incapacitating) is any injury, other than a fatal injury, which prevents the injured person from
walking, driving, or normally continuing the activities he was capable of performing before the injury
occurred.
Fatality is any injury that results in death. Fatality is applicable only if the person is officially declared dead
at the location of the accident.
Spatial Crash Data System
A 27
May 2003
-JUNCTION
A Junction identifies the location where the First Harmful Event occured with respect to the roadway.
"Intersection Related" is not actually a location type but a judgment about the effect of intersection and their
traffic control upon traffic and accident causation. If the accident is deemed to have occurred as a result of
backed up traffic from an intersection, the junction relationship is "Intersection Related". The table displays
the possible categories of junction related elements.
JUNCTIONS
Not Applicable
Non-Intersection
Intersection
Intersection Related
Driveway Access
Other
Unknown
-LANE
A Lane is identified as a section of the road on which the accident occurred. Each road is either NorthboundSouthbound with North and South lanes or Eastbound-Westbound with East and West lanes. Using the
centerline line as the point of orientation, lanes are identified as (N,E,S,W) 1, (N,E,S,W) 2, referring to the
lane direction and number. Special lanes are identified in terms of Right, Left, Turn, Acceleration, and
Deceleration. Accident locations outside any lane boundary are noted Shoulder, Off Road, Median,
Crossover, and Gore.
The table summarizes the vehicle location coding at the time of the accident:
LANES
DIRECTION
LANE
North
Lane Number
East
Right Turn
West
Left Turn
South
Acceleration
Parking
Deceleration
Shoulder
Crossover
Off Road
Gore
Median
Parking Lot
Spatial Crash Data System
A 28
May 2003
-LIGHT
Light describes the lighting condition at the time of the accident. This can be natural light, such as sunlight
or man-made, such as head lights from a vehicle.
Daylight: refers to the natural sunlight; this describes accidents that occur during the day.
Dawn/Dusk: describes accidents that occur at dawn − the early hours of the day − or at dusk- the late hours
of the day. These denote reduced visibility.
Dark - Light On: represents accidents that occurred at night under man-made lighting condition, such as
streetlights or headlights
Dark - No Lights: identifies accidents that occur at night in the total absence of light.
The possible codes for Lighting conditions are:
LIGHTING
Not Applicable
Daylight
Dawn/Dusk
Dark-Lights On
Dark-No Lights
Other
Unknown
Spatial Crash Data System
A 29
May 2003
-MOVEMENT
Movement describes the maneuver of the vehicle or the action of the pedestrian immediately prior to the
accident; the table outlines Vehicle Movement and Pedestrian Movement.
MOVEMENTS
VEHICLE MOVEMENT
PEDESTRIAN MOVEMENT
Not Applicable
Cross/Enter at Intersection
Moving Constant Speed
Cross/Enter Not at Intersection
Acceleration
Walking/Riding w/Traffic
Slowing or Stopping
Walk/Ride Against Traffic
Starting from Lane
Playing
Starting from Parked
Standing
Stopped in Traffic Lane
Getting On/Off Vehicle
Changing Lanes
Push/Work On Vehicle
Passing
Other Working
Parking
Hitchhiking
Parked
Approach/Leave School Bus
Backing
Other
Making Left Turn
Unknown
Making Right Turn
Right Turn on Red
Making U-Turn
Skidding
Driverless Moving Vehicle
-NUMBER OF PEDESTRIAN/DRIVER KILLED/INJURED
Driver Killed/Injured is the reported number of vehicle driver or passenger(s) killed or injured in the
accident.
Pedestrians Killed/Injured includes the number persons, afoot, not passengers of the vehicle, killed or
injured in the accident.
Spatial Crash Data System
A 30
May 2003
-ROAD CONDITION
Road Condition describes the character of the road that may have contributed to the accident. The table
displays the possible road condition categories.
ROAD CONDITIONS
Not Applicable
Obstruction Not Lighted
No Defects
Obstruction Not Signaled
Shoulder defect
View Obstructed
Holes/Ruts
Other
Foreign Materials
Unknown
Loose Surface Material
-ROAD SURFACE CONDITIONS
The Road Condition refers to the effect of climatic elements on the surface of the road the accident occurred
on at the time of the accident. The following codes represent the possible characters of the road surface.
ROAD SURFACE CONDITIONS
Not Applicable
Ice
Wet
Mud
Dry
Other
Snow
Unknown
-ROUTE NUMBER
Route Number refers to the route on which the accident occurred. Route Number consists of two leading
alphabetical characters that indicate the route type, followed by numerals for vehicles traveling on roads of
different classes, the highest class road is selected to determine which road will be listed. The lowest route
number is used where multiple routes of the same class are marked.
Examples: 1) At the intersection of US 40(called "Main Street" locally) with MD 17(Maryland State Route
17), US 40 used. 2) Where multiple routes of the same class are marked (US 40 and US 211), US 40 is used.
Spatial Crash Data System
A 31
May 2003
-ROUTE TYPE
Route Type identifies to the road type on which the accident occurred. These roads are classified according
to their importance into several categories
ROUTE TYPES
ROUTE TYPE
IS
Interstate
US United States
ROUTE NUMBER
COMMON ROAD
SUFF.
NNNNN
AL Alternate
Use 1 to 5 Numerals
BU Business
MD Maryland State
SC Scenic
CO County
TL Toll
MU Municipal
UL Ultimate
GV Government
*Other suffixes may
apply and may not
consist of only one
character
SR Service Road
OP Other Public Road
UU Unknown
-WEATHER
Weather represents the condition that may have contributed to the accident. Following are the possible
categories.
WEATHER
Not applicable
Snow/Sleet
Clear/Cloudy
Severe Winds
Foggy
Other
Raining
Unknown
Spatial Crash Data System
A 32
May 2003
Figure 1. Opening Screen of MSAC
Spatial Crash Data System
A 33
May 2003
Figure 2. User Interface for MSAC
Tool Bar
Legends
Overview
map
Menu
Map
Menu
F
Sub
Menu
Spatial Crash Data System
Report
Frame
A 34
May 2003
Figure 3. Area Submenu
Spatial Crash Data System
A 35
May 2003
Figure 4. Route Submenu
Spatial Crash Data System
A 36
May 2003
Figure 5. Vehicle Body Type Submenu
Spatial Crash Data System
A 37
May 2003
Figure 6. Accident Severity Submenu
Spatial Crash Data System
A 38
May 2003
Figure 7. Accident Time Period Submenu
Spatial Crash Data System
A 39
May 2003
Figure 8. Collision Type Submenu
Spatial Crash Data System
A 40
May 2003
Figure 9. Contributive Factors Submenu
Spatial Crash Data System
A 41
May 2003
Figure 10. Environment Submenu
Spatial Crash Data System
A 42
May 2003
Figure 11. Renderer Selection
Spatial Crash Data System
A 43
May 2003
Figure 12. Identified Crash Report
Spatial Crash Data System
A 44
May 2003
Figure 13. Crash Information Report
Spatial Crash Data System
A 45
May 2003
Figure 14. Factor Analysis Report
Spatial Crash Data System
A 46
May 2003


![MapInfo [v9.5 - v10.0] User manual PDF](http://vs1.manualzilla.com/store/data/005662542_1-c58f11f989f54f88b5c049879cd1b1b4-150x150.png)