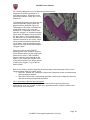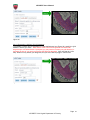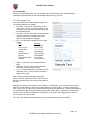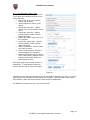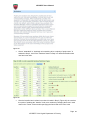
1
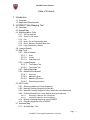
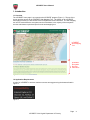
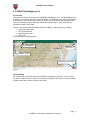
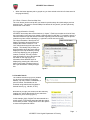
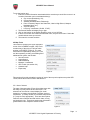
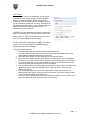
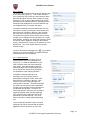
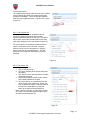
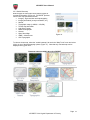
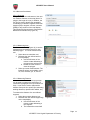
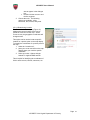
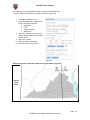
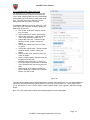
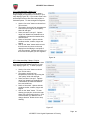
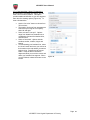
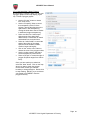
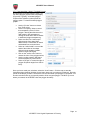
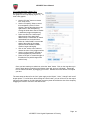
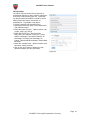
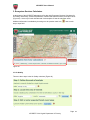
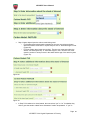
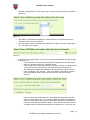
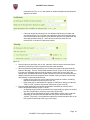
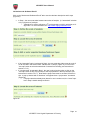
InFOREST User’s Manual INFOREST USER MANUAL HTTP://INFOREST.FREC.VT.EDU/ InFOREST 2014 Virginia Department of Forestry InFOREST User’s Manual Table of Contents 1. Introduction 1.1. Overview 1.2. Application Requirements 2. InFOREST Web Mapping Tool 2.1. Overview 2.2. Expand Map 2.3. Map Navigation Tools 2.3.1. 2.3.2. 2.3.3. 2.3.4. 2.3.5. 2.3.6. Zoom In and Out Zoom To Full Extent Pan Undo - Go to Previous Map View Redo - Return to Previous Map View Layer Information / Identify 2.4. Location Search 2.5. Map Tools 2.5.1. Area of interest 2.5.1.1. Draw 2.5.1.2. County 2.5.1.3. Hydrologic unit 2.5.2. Legend/Layers 2.5.2.1. The Legend Tab 2.5.2.2. The Layers Tab 2.5.3. Switch Basemap 2.5.4. Measure/Coordinates 2.5.4.1. Overview 2.5.4.2. Measuring Area 2.5.4.3. Measuring Distance 2.5.4.4. Determining Location 2.6. GPS Toolkit 2.6.1. Selecting a Method to Create Waypoints 2.6.2. Manually Creating Waypoints (points tab) 2.6.3. Manually Creating Waypoints Using Coordinates (coordinates tab) 2.6.4. Creating Waypoints for a User-Defined Area (auto-plot tab) 2.6.4.1. 2.6.4.2. Generating a Random Set of Waypoints Generating a Uniform Grid of Waypoints 2.6.5. Moving or Deleting Waypoints from InFOREST 2.6.6. Exporting Waypoints from InFOREST 2.7. Annotate Map 2.7.1. Annotate Map / Text Page InFOREST 2014 Virginia Department of Forestry 1 InFOREST User’s Manual 2.7.2. Annotate Map / Shapes 2.7.2.1. 2.7.2.2. 2.7.2.3. 2.7.2.4. 2.7.2.5. 2.7.2.6. 2.7.2.7. 2.7.2.8. Annotate Map / Shape: Point Annotate Map / Shape: Multi-point Annotate Map / Shape: Line Annotate Map / Shape: Polyline Annotate Map / Shape: Freehand line Annotate Map / Shape: Polygon Annotate Map / Shape: Freehand Polygon Annotate Map / Shape: Box 2.8. Export Map 3. Ecosystem Services Calculators 3.1. Air Quality 3.2. Biodiversity 3.3. Carbon Sequestration 3.4. Nutrient and Sediment Runoff 3.5. Open Lands 4. Frequently Asked Questions Page InFOREST 2014 Virginia Department of Forestry 2 InFOREST User’s Manual VERSION CONTROL Date 2014/04/29 2014/07/08 Version 1 1.1 2014/07/08 1.2 2014/07/30 2014/07/30 1.3 1.4 2014/08/05 1.5 Changes InFOREST Mapping Section InFOREST Mapping Section (added Figure #’s) Ecosystem Services Calculators Added GPS Tool section Updated Figure #’s in Ecosystem Services Calc. Section Minor edits-CEB Page InFOREST 2014 Virginia Department of Forestry 3 InFOREST User’s Manual 1. Introduction 1.1 Overview The InFOREST home page is your portal to the InFOREST program (Figure 1). The top of the screen provides access to the InFOREST Web Mapping Tool. The bottom of the InFOREST home page provides you with access to the Ecosystem Services Calculators. The web mapping tool can be used without the ecosystem services calculators, but a majority of the ecosystem services calculators require data input from the web mapping tool. InFOREST Web Mapping Tool InFOREST Ecosystem Services Calculators Figure 1. 1.2 Application Requirements In order for InFOREST to achieve maximum success we suggest using the browsers listed in Figure 2. Figure 2. Page InFOREST 2014 Virginia Department of Forestry 4 InFOREST User’s Manual 2. InFOREST Web Mapping Tool 2.1 Overview This section provides an overview of the InFOREST Web Mapping Tool. The Web Mapping Tool is loaded in your browser when you access InFOREST. This mapping screen can be expanded to fill the space on your monitor, and provides an easy to use set of tools for navigating the maps, tools for controlling the way a map looks, and tools for printing maps. Each set of tools are described in detail in the manual. There are four main features associated with the InFOREST mapper (Figure 3), including: The Expand Map option The Location Search Map Navigation Tools Map Tools These features are identified below. Location Search Map Tools Map Navigation Tools Expand the map window Figure 3. 2.2 Expand Map The “expand map” button will cause the InFOREST map display to get larger. This is useful if you have a smaller monitor or need to more easily view details on the map. To return the display to partial screen size, press the “shrink map” button. Page InFOREST 2014 Virginia Department of Forestry 5 InFOREST User’s Manual 2.3 Map Navigation Tools The map navigation tools (Figure 4) support easy navigation of the InFOREST online mapper. Each of these tools are discussed below. Zoom in Zoom to full extent Zoom out Undo - Go to previous map view Redo - Return to former map view Layer information / Identify Figure 4. 2.3.1 Zoom In and Out To zoom in closer to the map, or zoom out farther from the map, use these tools. 1. Click the + (zoom in) or – (zoom out) buttons to zoom in or out a fixed amount. 2. Placing your cursor on the map and ‘double clicking’ (left button) also causes the map to zoom in. 3. If you have a wheel mouse, you can zoom in and out by using the wheel. 4. You can use your fingers to zoom in and zoom out if you have a touchscreen by either pinching an area of interest (zoom out) or expanding a box over an area of interest (zoom in). 2.3.2 Zoom To Full Extent To zoom to the entire state of Virginia, click on the zoom to full extent button. 2.3.3 Pan To “pan” a map is to move it around on the screen so different geographic areas will be displayed. Essentially, you grab the map (using the cursor or your finger if a touchscreen) and drag it (the cursor or your finger) to the geographic area that you want to view. This is the default tool and thus no button must be clicked to use it. 2.3.4 Undo - Go to Previous Map View A map “view” is the area of the map being displayed. Moving to another area, or changing how zoomed in you are, creates a new map view. If you move the map around, zoom in, zoom out, and then want to go back to a previous geographic area or previous zoom level, then click this button. This button is similar to ‘undo’. Each click will move you back one previous view. Page InFOREST 2014 Virginia Department of Forestry 6 InFOREST User’s Manual When the button appears pale or grayed out, you have arrived at the limit of views stored in the program history. 2.3.5 Redo - Return to Previous Map View The ‘redo’ button can be used to take you forward a previous step, thus eliminating a previous selected ‘undo’. The return to Previous Map View button will only work if you have previously selected the ‘undo’ button. 2.3.6 Layer Information / Identify InFOREST stores map data such as land use in “layers.” Each layer contains one kind of data, but each location in the layer may contain a different value for that data. For example, there is a Landuse-Landcover layer that stores information regarding how land is being used, but specific locations may have values indicating e.g., agriculture, urban area and so forth. The Layer information / Identify tool will Next screen button display information about that layer as it exists at the location clicked on. The “tool” drills down through all layers at that location. This Identify tool provides you with information about the layers that are displayed in the map window by clicking on the map display at your geographic location of interest. The tool provides layer information for any of the layers that are drawn on the map (Figure 5). Information about different layers is displayed by pressing the ‘next screen’ button in the upper right hand corner of the Layer Information / Identify dialogue box. Figure 5. 2.4 Location Search The location search tool (Figure 6) enables you to zoom to a location by typing an address, zip code, location, coordinates, or point of interest. Coordinates can be searched using Latitude and Longitude in decimal format (e.g., -80.422, 37.227). Figure 6. Note that as you type your location into the search by location tool, options that closely fit your search are available for you to select (Figure 7). In this example (right), Virginia Tech was entered as a search criteria. Five options associated with the search criteria were provided. Simply select one of the options to zoom to that particular feature. Figure 7. Page InFOREST 2014 Virginia Department of Forestry 7 InFOREST User’s Manual To use the location tool: 1. Enter the location information associated with the area that you would like to zoom in to. Location information can be associated with a(n): a. City or town (Blacksburg; VA); b. County (Accomack) c. Address (500 Main Street, Richmond); d. Point of interest (Claytor Lake State Park, Henrico High School, Newport Hardware Store, etc.); e. Zip code (24061) f. Lat./Long. coordinates (-80.422, 37.227). 2. The Search Results will display as you type 3. Click on the location in the Search Results to zoom to it or hit Enter. 4. If there is more than one location that has that name, they will all be listed. Select the result that best meets your criteria. 5. The search is not case sensitive. 2.5 Map Tools This toolbar is located in the upper right hand corner of the InFOREST mapper. Map Tools contain many of the tools you will use when working in InFOREST (Figure 8). The map tools button is expanded by clicking on it. The tool then expands, providing a cascading list of additional tool options, that include: Area of interest Legend/layers Switch basemap Measure / coordinates GPS Toolkit (see section 2.6) Annotate map Export map Figure 8. This section will provide a detailed overview of each of the map tools options except the GPS Toolkit, which has an entire section dedicated to it. 2.5.1 Area of interest The area of interest toolset (Figure 9) provides users with the ability to quickly select an area of interest. This selection can be used as a visual display (for visual analysis) or to support user-defined ecosystem services calculations. (For map creation, the annotate map section (2.7) may be more appropriate.) There are three options under the area of interest tool that include: draw, county, and hydrologic unit. These three options are discussed in greater detail in their respective sections below. Figure 9. Page InFOREST 2014 Virginia Department of Forestry 8 InFOREST User’s Manual 2.5.1.1 Draw The draw option (Figure 10) enables the user to draw a user-defined point, straight polyline, freehand polyline, polygon, or freehand polygon. Buffer distances are required for point or polyline options. The buffer distance can be expressed in either feet or meters. The area of the delineated region is provided in acres. Note that only one feature can be drawn on the map with this tool. To annotate a map, see section 2.7. InFOREST provides additional edit options to support the area of interest draw tool. This help can be found via the drawing edit tool ( icon). By hovering over the pencil icon, you can gain valuable time saving tips. Figure 10. The Go to Ecosystem Calculators tool ( icon) enables users to return to the InFOREST Ecosystem Services Calculators portion of the webpage. To begin using the draw tool: 1. Select the shape that you want to draw from the pull-down list. 2. If you have selected to draw a point or line, then select the buffer option, and enter a buffer distance and buffer distance unit of measure. 3. Select the “draw” button, and start drawing your user-defined feature. 4. When you have completed drawing your feature, it should appear on the map display. The area of your feature should now be displayed in the draw dialogue box after “acres:” 5. The majority hydrologic unit and county within your feature will be selected in the map and sent as inputs to the Ecosystem Services Calculators. 6. You can clear the feature and start again by selecting the “clear” button or clicking on the “draw” button again. Note that drawing features cannot be saved. Once they are cleared, they are lost. 7. You can use the drop-down “show” list to select what is visible: the “project area” (feature) and/or the majority hydrologic unit (“huc selection”) and/or the majority county (“county selection”) within your project area. 8. Once your custom defined area has been drawn and is displayed, you can export it as a jpeg (see export map option discussion later in this section). Page InFOREST 2014 Virginia Department of Forestry 9 InFOREST User’s Manual 2.5.1.2 County The County option enables users to interact with the map on a county level (Figure 11). To show the counties in your current map view, check the ‘show counties’ option. Note that this option does not select counties; it simply allows you to turn on and off the visibility of the county boundaries in the mapping interface. Depending on the basemap being displayed, the county boundaries may not disappear when you uncheck this option. In addition to drawing county boundaries, the user can also select a county by clicking the “select” button and then clicking on a location in the map. After “location:” the name of the county/city selected will be returned. The select county option can be used to select a county as input to an ecosystem services calculator for a county level analysis. As before, the ‘show map selection’ check box can be used to toggle the visibility of the selected county. Note that only 1 county can be selected at a time with this tool. The “clear” button clears the currently selected county. Figure 11. The Go to Ecosystem Calculators tool ( icon) enables users to return to the InFOREST Ecosystem Services Calculators portion of the webpage. 2.5.1.3 Hydrologic unit The hydrologic unit option enables users to interact with the map on a watershed level (Figure 12). To show the watersheds in your area of interest, check the ‘show hydrologic units’ option. Note that this option does not select hydrologic units; it simply allows you to turn on and off the visibility of the hydrologic unit boundaries in the mapping interface. In addition to drawing hydrologic unit boundaries, the user can also select a watershed by clicking the “select” button and then clicking on a location in the map. After “VAHU6:” the code for the hydrologic unit selected will be returned. The select hydrologic unit option can be used to select a watershed as input to an ecosystem services calculator for a watershed-level analysis. As before, the ‘show map selection’ check box can be used to toggle the visibility of the selected hydrologic unit. Note that only 1 hydrologic unit can be selected at a time with this tool. The “clear” button clears the currently selected hydrologic unit. Figure 12. In the ‘biodiversity calculator’ option, a second hydrologic unit can be selected and its visibility toggled on and off, as before, for use in the Page 10 InFOREST 2014 Virginia Department of Forestry InFOREST User’s Manual calculation of beta diversity with the biodiversity calculator. The Go to Ecosystem Calculators tool ( icon) enables users to return to the InFOREST Ecosystem Services Calculators portion of the webpage. Page 11 InFOREST 2014 Virginia Department of Forestry InFOREST User’s Manual 2.5.2 Legend/Layers The Legend/Layers option under the tools menu enables users to display any of the many data layers that are provided in InFOREST. There are two tabs available under the layers/legends toolset: “Legend” and “Layers” (Figure 13). Figure 13. 2.5.2.1 The Legend Tab Many layers associated with InFOREST have a variety of symbols and colors that are used to represent individual features on the map. The legend tab provides users with information about each map layer that is displayed in the map window (Figure 14). The “layer opacity” or transparency slide bar allows layers to be viewed over a base map. Drag the button to the left for more transparency. Drag the button to the right for less transparency. This will impact all of the visible InForest layers, but not the basemap. Figure 14. 2.5.2.2 The Layers Tab To use this tool (Figure 15): 1. Click on the Layers tab. 2. The layers available at the current map scale will display. 3. Click the box next to the layer name to enable and display that layer. 4. Layers only display at certain scales, based on the detail available in the data. 5. The “layer opacity” or transparency slide bar allows a layer to be viewed over a base map such as the aerial imagery. Drag the button to the left for more transparency. Drag the button to the right for less transparency. Note: It is best not to turn on many layers, as this will create a very crowded map and upper layers will obscure layers below them. Figure 15. Page 12 InFOREST 2014 Virginia Department of Forestry InFOREST User’s Manual 2.5.3 Switch Basemap Different types of base maps convey different types of contextual information (Figure 16). InFOREST provides eleven base map options that include: Imagery - high resolution aerial photography, Imagery with labels (county boundaries, etc.), Streets, Topographic maps (1:24000, 1:100,000), Terrain map with labels Light Gray Canvas, National Geographic Oceans Open Street Map VBMP – Most Recent USA Topographic Figure 16. To choose a base map, select the “switch basemap” tab under the “Map Tools” menu and select (click) on one of the basemapping options (Figure 17). Note that only one basemap can be displayed at any given time. Basemap options available through InFOREST Figure 17. Page 13 InFOREST 2014 Virginia Department of Forestry InFOREST User’s Manual 2.5.4 Measure/Coordinates 2.5.4.1 Overview Using the measure/coordinates tool, the user can measure features on the map (area of a polygon, the length of a line). In addition, the tool can be used to identify the geographic coordinates (in Latitude Longitude in decimal degrees (DD) or degrees, minutes, seconds (DMS)) of any location on the map display. This section will discuss how to work with the Measure/Coordinates tool (Figure 18). Figure 18. 2.5.4.2 Measuring Area The Measure Area tool (Figure 19) is used to calculate an area measurement for a userdefined polygon. To use the measure area tool: 1. Select the area calculation tool; 2. Delineate the user defined area on the map display a. Use the left button of the mouse to start delineating a polygon and to add vertices; b. Double click the mouse to close the polygon. 3. Select your area measurements. The following options are available: acres, 2 2 2 2 2 mi , km , hectares, yd , ft , and m . Figure 19. . 2.5.4.3 Measuring Distance The distance measurement tool (Figure 20) can be used to measure the perimeter of a user defined geographic area (a forest tract or field). It can also be used to estimate the distance from point A to point B (for estimating walking distances, riparian buffer widths, etc.). To measure the distance of a user defined segment: 1. Select the measure distance icon; 2. Delineate the user defined segment(s) on the map display a. Use the left button of the mouse to start delineating a line segment; b. The measurement result will Figure 20. Page 14 InFOREST 2014 Virginia Department of Forestry InFOREST User’s Manual start to appear in the dialogue box; c. Double-click the mouse to end the line segment. 3. Choose the units. The following options are available: miles, kilometers, feet, meters, and yards. 2.5.4.4 Determining Location The Determine Location option (Figure 21) displays the current location of the mouse pointer as it moves over the map. As the cursor moves, the geographic coordinates will change as well. This option can be used to locate a specific location for a precise point on the map display. To identify the coordinates of a precise point on the map: 1. select the ‘Location tool’, 2. place your cursor and click on the map display where you need the specific coordinate. 3. Select your units. Options include Latitude / Longitude DMS and DD. Figure 21. This is helpful for identifying the coordinates of field or track corners, culverts, structures, etc. Page 15 InFOREST 2014 Virginia Department of Forestry InFOREST User’s Manual 2.6 GPS Toolkit The GPS Toolkit (Figure 22) provides users with the ability to generate and export GPS waypoints using the InFOREST mapping viewer. The InFOREST mapping viewer is used as a backdrop, or reference for generating the waypoint selection set. Users can create waypoints through manual entry or by automatically generating waypoints for a user-defined area. Delineated waypoint sets can then be edited (new waypoints added / deleted or existing waypoints can be moved). Once a waypoint set has been generated, it can be exported to a local desktop and transferred to a GPS receiver, or it can be exported directly to a mobile device via email. The GPS Toolkit provides a streamlined workflow to create, edit, and export waypoints, and is accessed through the Map Tools toolbar. Figure 22. 2.6.1 Selecting a Method to Create Waypoints Waypoints can be generated manually (points tab), auto-generated for a user-defined area/tract (auto-plot tab), or generated by entering coordinate information (coordinates tab). See Figure 23. Figure 23. Page 16 InFOREST 2014 Virginia Department of Forestry InFOREST User’s Manual 2.6.2 Manually Creating Waypoints (points tab) If the points entry method is selected, then the user will be prompted to generate waypoints by placing them on the InFOREST mapping screen (using the cursor). To create waypoints manually using the cursor: 1. Select the “Points” tab (Figure 24); 2. Select either the <Point> or <Multi-point> option from the “shape” pick list; a. The <Point> option will enable the user to enter one waypoint on the mapper b. The <Multi-point> option will enable the user to enter multiple waypoints using the mapper 3. Click on the “draw” button and use the left button on the mouse to manually place waypoints on the InFOREST mapping screen. 4. If you are using the <Multi-point> option, you need to double click on the map to complete the session. Waypoints cannot be deleted (using the “clear map” button) until the session has been completed. Figure 24. Once your waypoints have been manually generated, you can export them to kml, kmz, shapefile, or gpx format. Exported waypoints can either be saved locally, or emailed directly to a remote or wireless device (additional instructions associated with this process are available in section 2.6.6 below). Page 17 InFOREST 2014 Virginia Department of Forestry InFOREST User’s Manual 2.6.3 Manually Creating Waypoints Using Coordinates (coordinates tab) To create waypoints manually by entering coordinates (Figure 25): 1. Select the “Coordinates” tab; 2. Select the appropriate “system” from the pick-list. Options include: Geographic UTM Virginia Lambert State Plane 3. Select the “datum” from the pick-list. Options will vary based on the system chosen above. 4. Select your “format”. 5. Enter coordinate information. 6. Select the “add to map” button. Figure 25. Reference the map coordinate systems for Virginia below (Figure 26). Virginia UTM Zones Page 18 InFOREST 2014 Virginia Department of Forestry InFOREST User’s Manual Virginia State Plane Zones Figure 26. Select “Add to Map” to create your Waypoint. Additional waypoints can be generated using the Waypoint Coordinates tool, by repeating the steps above. The <clear map> button can be used to clear all waypoints from the InFOREST mapping screen. Once your waypoints have been manually generated, you can export them to kml, kmz, shapefile, or gpx format. Exported waypoints can either be saved locally, or emailed directly to a remote or wireless device (additional instructions associated with this process are available in section 2.6.6 below). Page 19 InFOREST 2014 Virginia Department of Forestry InFOREST User’s Manual 2.6.4 Creating Waypoints for a User-Defined Area (auto-plot tab) Waypoints can be auto-generated for a user-defined polygon. Waypoints can be generated for either a uniform grid, or as a random set. To generate Waypoints for an area, the user must first delineate a polygon where the waypoints will be generated (Figure 27). This polygon could include a forested tract, a large field, a lake, or any other userdefined area. To delineate an area, select either the <polygon> or <freehand polygon> option under the “shape” pick-list, and click the “draw” button. The freehand polygon tool allows the user to create polylines that follow the movement of your cursor. When tracing complex polygons (especially with curved sides), using the freehand polygon option may be more efficient than using the <polygon> option. Figure 27. Place your cursor on the InFOREST mapping screen. With <polygon> selected, click to add the vertices of your polygon and double-click to close it. With “freehand polygon” selected, press and hold the left button on your mouse and drag the cursor around the boundary of your area of interest to define your polygon. Let go of the left button to finish. Now you are ready to generate waypoints for the tract that you have delineated. There are two options available under the “pattern” option. Option #1: Random set– Generates a random set of waypoints for the user-defined area given specified parameters. Option #2: Uniform Grid – Automatically generates a uniform grid of waypoints within the user-defined area given specified parameters 2.6.4.1 Generating a Random Set of Waypoints To generate a random set of waypoints for a user-defined tract (Figure 28), specify the measurement “units,” the “number of points” to be generated, and the “minimum distance” that each point can be to each other. Page 20 InFOREST 2014 Virginia Department of Forestry InFOREST User’s Manual Result Figure 28. 2.6.4.2 Generating a Uniform Grid of Waypoints To generate a uniform grid of waypoints for a user-defined tract (see Figure 29), specify the “grid distance” and the grid “units.” Note that the GPS Toolkit cannot generate more than 500 waypoints per user-defined tract. If prompted, you may need to increase your grid distance (or decrease the size of your tract) to get below the 500 point threshold. Also note that the “clear map” button not only erases your waypoints, but your user-defined polygon / tract as well. Result Figure 29. Page 21 InFOREST 2014 Virginia Department of Forestry InFOREST User’s Manual 2.6.5 Moving or Deleting Waypoints from InFOREST Individual waypoints that have been generated can later be moved or deleted (Figure 30). To move or delete a waypoint: 1. Right click on the waypoint that you would like to either move or delete. Moving a Waypoint Select the <move> option if you want to move the waypoint, and drag the waypoint to a new position. Deleting a Waypoint Select the <delete> option if you want to delete the waypoint. Once a waypoint has been deleted, it cannot be undeleted. Figure 30. 2.6.6 Exporting Waypoints from InFOREST Once waypoints have been generated in InFOREST, they can easily be exported to the local hard drive, or exported to any device via email. This will enable you to efficiently share your waypoints with an array of devices and stakeholders. Note that only waypoints can be exported. Delineated tract boundaries cannot be saved or exported at this time. Waypoints can be exported in four different formats: .kml (keyhole markup language file) This format is recognized as an open geospatial consortium [OGC] standard. .kmz (compressed keyhole markup language file). .shp (shapefile format) This format was developed by ESRI and is used by other software vendors as well. .gpx (GPS exchange format) This format is used to transfer coordinate data between GPS devices including Trimble, Garmin, Magellan, etc. This format is XML based. To export waypoints, continue to “Step 2: Export waypoints to a file” (Figure 31). Figure 31. Page 22 InFOREST 2014 Virginia Department of Forestry InFOREST User’s Manual To save a local copy of the waypoint data: 1. Select the output format type (.kml, .kmz, .shp, or .gpx); 2. Click the “download” button; 3. A pop-up window will most likely appear with file options (specific steps are browser and settings specific.) You may have to turn off pop-up blockers and/or allow pop-ups from this site. Your file has been saved. To send a copy to a remote device via email: 1. Select the output format type (.kml, .kmz, .shp, or .gpx); 2. Input the appropriate “e-mail address”; 3. Click the “send” button After a few seconds / minutes (contingent on order volume and system maintenance) you will receive an email from [email protected] (see example in Figure 32). The email will contain a zip file with your Waypoint data. Figure 32. Page 23 InFOREST 2014 Virginia Department of Forestry InFOREST User’s Manual 2.7 Annotate Map Using the Annotate Map option, you can annotate your map with either text or shapes simply by selecting the appropriate tab on the Annotate Map dialogue box (Figure 33). 2.7.1 Annotate Map / Text Text can be added to the map display using this tool. The following options are available: Text color - Text color is controlled by the “text color” button. Seventy colors are available. You will want to choose a color that shows up against the map background. Text size - The size of the text is controlled by the “text size” slider bar. Note that as the bar is moved, the size of the “Sample Text” at the bottom of the dialogue box changes. Font - Text font can be changed to one of eight options Font Example Arial Text Example Book Antiqua Text Example Courier New Text Example Georgia Text Example Lucida Console Tahoma Times New Roman Verdana Text Example Text Example Text Example Text Example “Style” - of the text can be changed to bold or italics Alignment - The text can be aligned using the start of the word, the middle, or end. Text - The text dialogue box can support up to 40 characters of text. Type in the text you want to appear on the map. Figure 33. After entering text and selecting the appropriate options, click the “add to map” button. Then click the mouse on the spot where you want the text placed on the map. Note that more than one text element can be added to a map display. Once a text element has been added to the map display, it cannot be modified (although it can be moved). In order to modify (size, color, etc.) the text, you will need to delete the text element and re-add the text. Individual text elements can be deleted by right clicking the text and selecting the ‘delete’ option. Individual text elements can also be moved, by right clicking the text, selecting the ‘move’ option, and dragging the text from its current location to a new location. The “clear map” button will delete and clear all of the text elements from the map display. Page 24 InFOREST 2014 Virginia Department of Forestry InFOREST User’s Manual 2.7.2 Annotate Map / Shapes This is a collection of tools which can be used to create graphics on the map. Each feature type has a set of tools which control its characteristics, such as shape, width, color and so on; each button gives access to these. The annotate map: shapes toolbox allows you to further customize your map by adding graphic elements (points, lines, polygons, boxes, etc.) to the map display. These shapes can be used to add further context or emphasis to your map. The following features can be added to your map display using this option from the “shape” drop-down list: Point Multi-point Line Polyline Freehand line Polygon Freehand Polygon Box Ellipse Circle Triangle Arrow Each feature type has a unique set of options which control its characteristics, such as shape, width, color and so on; see details for each feature type below. After using a tool to create a feature, it deactivates. To make another feature you need to click the “draw” button again. The only exception to this is the multipoint tool. There are several editing options associated with the annotate map / shapes tab. You can obtain additional information associated with these editing options, by hovering over the pencil icon. These options allow you to: add, delete, or move a vertex; scale or rotate a graphic shape; move a graphic; and delete a single graphic. The “clear map” button deletes all annotated graphics from the map display. The following summarizes each of the Annotate Map: Shapes feature options. Page 25 InFOREST 2014 Virginia Department of Forestry InFOREST User’s Manual 2.7.2.1 Annotate Map / Shape: Point To add point features to your map, select the ‘Point’ option and customize the style of your point (Figure 34). Click on the “point color” button to choose from 70 colors; Use the slider bar to set the “point opacity” Choose the “point style”. Options include: circle, cross, diamond, square, and ‘x’. Choose the “point size”. Options include smallest, smaller, medium, larger and largest. Choose the “outline style” from one of the 12 options. Choose the “outline width”. Options include smallest, smaller, medium, larger and largest. Use the “outline color” button to select one of the 70 options. Use the “outline opacity” slide bar to set the transparency of the point. Draw the point on the map, by clicking on the “draw” button, and then click on the map on the location where you want to place the point. Note: After using a tool to create a feature, it deactivates. To make another feature you need to click the ‘draw on map’ button again. Figure 34. Individual points on the map can either be moved or deleted by right clicking on them. To move a point, select “move” and then drag the point to a new location. To delete a point, select ‘delete’. Once deleted, a point cannot be restored, but will need to be added again. For additional tool tips, hover your cursor over the pencil. Page 26 InFOREST 2014 Virginia Department of Forestry InFOREST User’s Manual 2.7.2.2 Annotate Map / Shape: Multi-point The Multipoint tool is similar to the point tool, with the exception that the multipoint tool enables the user to enter multiple points onto to the map display, without having to hit the ‘draw on map’ button each time. Thus, this tool is more efficient if you are adding more than one point to your map. To add point features to your map, select the “multipoint” option and customize the style of points you want to use (Figure 35). Click on the “point color” button to choose from 70 colors; Use the slider bar to set the “point opacity” Choose the “point style”. Options include: circle, cross, diamond, square, and ‘x’. Choose the “point size”. Options include smallest, smaller, medium, larger and largest. Choose the “outline style” from one of the 12 options. Choose the “outline width”. Options include smallest, smaller, medium, larger and largest. Use the “outline color” button to select one of the 70 options. Use the “outline opacity” slide bar to set the transparency of the point. Draw the point on the map, by clicking on the “draw” button, and then click on the map on the location where you want to place the point. Keep clicking on the map in locations you wish to add points. Double-click on the last location you wish to add. Figure 35. There are several editing options associated with the annotate map / shapes tab. You can obtain additional information associated with these editing options, by hovering over the pencil icon. These options allow you to: add, delete, or move a vertex; scale or rotate a graphic shape; move a graphic; and delete a single shape. Note: The “clear map” button deletes all annotated graphics from the map display. Page 27 InFOREST 2014 Virginia Department of Forestry InFOREST User’s Manual 2.7.2.3 Annotate Map / Shape: Line By selecting the “line” option, you can draw a single straight line segment (no vertices) on your map display (Figure 36). If you need to draw a line with multiple vertices, then select the polyline or freehand options. To draw a single line segment: Use the “line color” button to choose from 70 line colors; The opacity can be set from transparent to solid color by moving the “line opacity” slider left and right. Select a custom “line style”. Options range from dotted lines, dashed lines, a combination of dotted and dashed lines, and solid lines. Select a “line width”. Options include smallest, smaller, medium, larger and largest. Click on the “draw” button and then hold the left mouse key down on the map display from the starting to end point of your line segment. Release the left key on the mouse to complete your line segment. Figure 36. 2.7.2.4 Annotate Map / Shape: Polyline By selecting the “polyline” option, you can draw a line segment (with defined vertices) on your map display (Figure 37). To draw a polyline: Use the “line color” button to choose from 70 line colors; The opacity can be set from transparent to solid color by moving the “line opacity” slider left and right. Select a custom “line style”. Options range from dotted lines, dashed lines, a combination of dotted and dashed lines, and solid lines. Select a “line width”. Options include smallest, smaller, medium, larger and largest. Click on the “draw” button. To start drawing your polyline, click on the map where you want to begin the line. Click at each location you want the line to change direction. Double click to stop drawing. Figure 37. Page 28 InFOREST 2014 Virginia Department of Forestry InFOREST User’s Manual 2.7.2.5 Annotate Map / Shape: Freehand line By selecting the “freehand line” option, you can draw a line in freeform fashion. This option provides additional definition to your line segment than other line drawing options (Figure 38). To draw a freehand line: Use the “line color” button to choose from 70 line colors; The opacity can be set from transparent to solid color by moving the “line opacity” slider left and right. Select a custom “line style”. Options range from dotted lines, dashed lines, a combination of dotted and dashed lines, and solid lines. Select a “line width”. Options include smallest, smaller, medium, larger and largest. To start drawing your freehand line, select the “draw” button and move your mouse to the location on the map where you want to begin the line. Depress the left mouse button. Keep the left mouse button depressed while you move the mouse and define you freehand line segment. When you are finished, release the button on the mouse. Figure 38. Page 29 InFOREST 2014 Virginia Department of Forestry InFOREST User’s Manual 2.7.2.6 Annotate Map / Shape: Polygon By selecting the “polygon” option, you can add a polygon graphic to the map display (Figure 39). To draw a polygon graphic: Use the “fill color” button to choose from 70 fill colors; Use the “fill opacity” slider to control the transparency of the fill of the polygon. Moving the slider bar to the right results in less transparency, moving the slider bar to the left results in additional polygon transparency; Select a custom line “outline style”. Options range from dotted lines, dashed lines, a combination of dotted and dashed lines, and solid lines. Select an “outline width” to control the width of the outline of the shape. Options include smallest, smaller, medium, larger and largest; Click on the “outline color” button to choose the color of the polygon outline; Use the “outline opacity” slide bar to set the transparency of the outline; Select a “fill style” to control the type of polygon fill (which ranges from solid to lines). Once you have made your selections, select the “draw” button. Click on the map where you want to begin the polygon. Click at each location you want the boundary to change direction. Double click to stop drawing. DO NOT try to end where you started, let InFOREST close the polygon boundary. Figure 39. Page 30 InFOREST 2014 Virginia Department of Forestry InFOREST User’s Manual 2.7.2.7 Annotate Map / Shape: Freehand Polygon By selecting the freehand polygon option, you can add a polygon graphic to the map display (Figure 40). Typically, a freehand polygon requires more definition (vertices) than the polygon option. To draw a freehand polygon graphic: Use the “fill color” button to choose from 70 fill colors; Use the “fill opacity” slider to control the transparency of the fill of the polygon. Moving the slider bar to the right results in less transparency, moving the slider bar to the left results in additional polygon transparency; Select a custom line “outline style”. Options range from dotted lines, dashed lines, a combination of dotted and dashed lines, and solid lines. Select an “outline width” to control the width of the outline of the shape. Options include smallest, smaller, medium, larger and largest; Click on the “outline color” button to choose the color of the polygon outline; Use the “outline opacity” slide bar to set the transparency of the outline; Select a “fill style” to control the type of polygon fill (which ranges from solid to lines). Figure 40. Once you have made your selections, select the “draw” button. Click the map to start the freehand polygon drawing (hold the mouse button down until your polygon is finished). Drag the pointer in the shape you want. Release the mouse button when your polygon is completed. You should not double-click as you normally would to finish a regular polygon. DO NOT try to end where you started, let InFOREST close the polygon boundary. Page 31 InFOREST 2014 Virginia Department of Forestry InFOREST User’s Manual 2.7.2.8 Annotate Map / Shape: Box By selecting the “box” option, you can add a box graphic to the map display (Figure 41). To draw a box graphic: Use the “fill color” button to choose from 70 fill colors; Use the “fill opacity” slider to control the transparency of the fill of the polygon. Moving the slider bar to the right results in less transparency, moving the slider bar to the left results in additional polygon transparency; Select a custom line “outline style”. Options range from dotted lines, dashed lines, a combination of dotted and dashed lines, and solid lines. Select an “outline width” to control the width of the outline of the shape. Options include smallest, smaller, medium, larger and largest; Click on the “outline color” button to choose the color of the polygon outline; Use the “outline opacity” slide bar to set the transparency of the outline; Select a “fill style” to control the type of fill within the box (which ranges from solid to lines). Figure 41. Once you have made your selections, select the “draw” button. Click on the map where you want to begin the box (hold the mouse button down until your box is finished). Extend the box out from this location, by dragging your mouse. Release the mouse button to complete your box. The same steps as above for the “box” option apply to the “ellipse”, “circle”, “triangle” and “arrow” shape options. For all of these, after clicking the “draw” button, you can click once on the map to add a pre-sized shape or click and hold the mouse key down and define the size of the shape by dragging the mouse in and out to the desired size. Page 32 InFOREST 2014 Virginia Department of Forestry InFOREST User’s Manual 2.8 Export Map The export map tool allows users to generate a professional map layout, and to save the map layout to an array of file formats (Figure 42). These files can then be shared with others via email or can be easily inserted into reports, documents, or presentations. To generate a map layout: Provide a map title (50 characters max.) Optionally provide any notes / source information (125 characters max.) Select the export “file type”. Options include: .pdf, .png32, .png8, .jpg, and .gif Select the “layout” type. Options include: MAP_ONLY (no scale bar, no title, etc.), Letter ANSI A Landscape, Letter ANSI A Portrait, A3 Landscape, A3 Portrait, A4 Landscape, A4 Portrait, Tabloid ANSI B Landscape, Tabloid ANSI B Portrait. Select the “scalebar units”. Options include: miles, kilometers, meters, and feet. Click on the “print” button to obtain your map (download options will vary by browser). Figure 42. Page 33 InFOREST 2014 Virginia Department of Forestry InFOREST User’s Manual 3. Ecosystem Services Calculators At the bottom of the InFOREST webpage are five tabs with Ecosystem Services Calculators for Air Quality, Biodiversity, Carbon Sequestration, Nutrient and Sediment Runoff, and Open Lands (Figure 43). At the top of each calculator tab is a description of how the calculator works. Additional information is available by hovering over the question mark icon, step or input field. , next to each Figure 43. 3.1 Air Quality There are three steps in the Air Quality calculator (Figure 44). Figure 44. Page 34 InFOREST 2014 Virginia Department of Forestry InFOREST User’s Manual In Step 1, the user must select between two scales of analysis (Figure 45), 1) a “county or city” selection or 2) a “project area” analysis. Figure 45. If the “county or city” option is selected in Step1, the user must then either select the name of a county or city from the drop-down list in Step 2 (Figure 46) or click on the “use map” button to select the county or city of interest from the map (see instructions in section 2.5.1.2). Figure 46. If a “project area” is selected in Step 1, the user is only given the option to click on the “use map” button in Step 2 (Figure 47) to draw a project area in the map interface (see instructions in section 2.5.1.1). Note that the project area must be at least 0.25 acres in size. o If a project area has already been drawn for use in another tool, the “acres” input box in Step 2 should already be filled in. Figure 47. Once a county/city selection is made or a project area has been drawn on the map, click on the “load data” button in Step 3 to retrieve the baseline forest cover data in the area selected in Step 2 (Figure 48). Page 35 InFOREST 2014 Virginia Department of Forestry InFOREST User’s Manual Figure 48. Once the baseline forest cover data is loaded in Step 3 (Figure 48), the user has the option of updating the “baseline” forest cover numbers by changing the acres in each class in the “current” column and/or specifying the future forest cover acres in the “expected” column. o “current” and “expected” forest cover acres can be updated by typing new values in the input boxes or by using the up and down arrows adjacent to each input box to increment the current values by a tenth of an acre at a time (make sure changes to “current” values are made before changes to “expected” values) o As the “current” or “expected” values are changed, the “(+/-)” column to the right of each input box shows how much the initial values have been changed by. o The “net change” in the “total acreage” for both the “current” and “expected” columns should have a value of zero. If 100 acres is removed from the “deciduous forest” acres, it should be added to either the “evergreen forest” or “other non-forest” acres. Otherwise the total size of the study area will be changed. o Changes are not required to the “current” or “expected” columns to run the calculator. If no changes are made, the air pollutant removals from the baseline forest cover will be returned. Once any desired changes are made to the “current” and/or “expected” forest cover columns, click on the “calculate” button to run the air quality calculator. When the calculator finishes processing, two charts and a report will be returned at the bottom of the page. The two “Air Pollution Benefits Charts” (Figure 49) show the current, expected and change in forest cover acres and the current, expected and change in 2 3 removals of five air pollutants: carbon monoxide (CO), sulfur dioxide (SO ), ozone (O ), 2 nitrogen dioxide (NO ), and particulate matter (PM10). o Holding your mouse over a bar in either chart will result in a balloon containing that bars description and value (Figure 49). o Either chart can be downloaded as a graphic or PDF file by clicking on either the “PNG” or “PDF” symbols, respectively, below them (Figure 49). The values depicted in the above charts are also listed in the report (Figure 50) in addition to information on the area analyzed and a description of the results. An optional project name can be added to the report output by typing it in the text box after “Project Name” at the top of the report (Figure 51). The report can be downloaded by itself or with charts or with a map or with both depending on the boxes checked after the PDF symbol and text that says “include:” (Figure 51). Check whichever options are desired and then click on the PDF symbol to download a PDF copy of the report. Page 36 InFOREST 2014 Virginia Department of Forestry InFOREST User’s Manual Figure 49. Page 37 InFOREST 2014 Virginia Department of Forestry InFOREST User’s Manual Figure 50. Figure 51. Page 38 InFOREST 2014 Virginia Department of Forestry InFOREST User’s Manual 3.2 Biodiversity Click on the “Biodiversity” tab to see the calculator description and 4 steps (Figure 52). Figure 52. In Step 1, the user must select between two scales of analysis (Figure 53), 1) a “watershed” selection or 2) a “project area” analysis. th o “Watershed” is used to reference a 6 level hydrologic unit (HU), which has a 12digit code. For more information see: http://water.usgs.gov/GIS/huc.html. Figure 53. If the “watershed” option is selected in Step1, the user must then either enter the code of a 6-th level HU in the text box after “VAHU6 code” in Step 2 (Figure 54) or click on the “use map” button to select the watershed of interest from the map (see instructions in section 2.5.1.3). After a watershed is selected from the map, the “VAHU6 code” and “hydrologic unit name” are returned to the Biodiversity calculator inputs in Step 2 (Figure 60). The “hydrologic unit name” is also returned for any “VAHU6 code” typed into the input box. Page 39 InFOREST 2014 Virginia Department of Forestry InFOREST User’s Manual Figure 54. If a “project area” is selected in Step 1, the user is only given the option to click on the “use map” button in Step 2 (Figure 55) to draw a project area in the map interface (see instructions in section 2.5.1.1). Note that the project area must be at least 0.25 acres in size. o If a project area has already been drawn for use in another tool, the “acres” input box in Step 2 should already be filled in. After a project area is drawn on the map, the “VAHU6 code” and “hydrologic unit name” containing the majority of the project area are returned to the Biodiversity calculator inputs in Step 2 (Figure 59). Figure 55. In Step 3, the user is given the choice of two databases on which to base the biodiversity calculations (Figure 56). If the user runs a project area analysis and wishes to calculate the impact of vegetation change on biodiversity, the Geographic Points database must be selected in this step. o The “Geographic Points” database consists of 332,844 wildlife sightings of 1,163 unique species at documented locations from June 7, 2007 through June 1, 2010. This dataset contains observations of all official fish and wildlife sightings in Virginia from research, management, permitting, or regulatory review processes. o The “Biota of Virginia” (BOVA) database encompasses wildlife from the geographic point dataset, but also includes information on the other non-spatially referenced sightings. This latter dataset includes wildlife information recorded in peer-reviewed literature and gathered from taxonomic experts. A total of 3,319 unique species are recorded throughout the state from the BOVA database. Figure 56. Step 4 is different depending on whether a watershed or project area scale was selected in Step 1. Page 40 InFOREST 2014 Virginia Department of Forestry InFOREST User’s Manual o Step 4 with a watershed scale analysis is optional. If the user wants the calculator to return beta diversity, a second “watershed” must be selected. This again can be accomplished by clicking on the “use map” button or by entering a “VAHU6 code” in the text box (Figure 57). o Step 4 with a project area scale analysis gives the user the option of changing the vegetation type within the project area (Figure 58 shows the vegetation types available). Any impacts on alpha biodiversity at the hydrologic unit level from the vegetation change will be returned. Click on the “calculate” button to run the biodiversity calculator (Figures 59-60 show examples of the biodiversity interface prior to clicking calculate). Figure 57. Figure 58. Page 41 InFOREST 2014 Virginia Department of Forestry InFOREST User’s Manual Figure 59. Figure 60. Page 42 InFOREST 2014 Virginia Department of Forestry InFOREST User’s Manual When the calculator finishes processing, two charts and a report will be returned at the bottom of the page. The two “Biodiversity Charts” (Figures 61 & 63) show the baseline alpha diversity and the percent of each bird guild represented in the hydrologic unit selected or hydrologic unit containing the majority of the project area. o Holding your mouse over a bar or pie slice in either chart will result in a balloon containing that bar’s description and value (Figure 61 & 63). o Either chart can be downloaded as a graphic or PDF file by clicking on either the “PNG” or “PDF” symbols, respectively, below them (Figure 61 & 63). The report (Figures 62 & 64) contains the following: information on the watershed(s) selected or containing the project area; the database selected; warnings if species of concern are present in the watershed(s); a table with alpha diversity numbers for each taxonomic group; if a vegetation change was implemented, the expected impact on alpha diversity from that change; a table with guild diversity numbers for each functional bird guild; and if requested, a table with two measures of beta diversity, Whittaker and Sorensen. An optional project name can be added to the report output by typing it in the text box after “Project Name” at the top of the report (Figure 65). The report can be downloaded by itself or with charts or with a map or with both depending on the boxes checked after the PDF symbol and text that says “include:” (Figure 65). Check whichever options are desired and then click on the PDF symbol to download a PDF copy of the report. Page 43 InFOREST 2014 Virginia Department of Forestry InFOREST User’s Manual Figure 61. Page 44 InFOREST 2014 Virginia Department of Forestry InFOREST User’s Manual Figure 62. Page 45 InFOREST 2014 Virginia Department of Forestry InFOREST User’s Manual Figure 63. Page 46 InFOREST 2014 Virginia Department of Forestry InFOREST User’s Manual Figure 64. Page 47 InFOREST 2014 Virginia Department of Forestry InFOREST User’s Manual Figure 65. Page 48 InFOREST 2014 Virginia Department of Forestry InFOREST User’s Manual 3.3 Carbon Sequestration Click on the “Carbon Sequestration” tab to see the calculator description and 5 (default) or 6 (if pine stand composition selected in Step 3) steps (Figure 66). Figure 66. The carbon tool only works at the “project area” scale, so no changes are needed in Step 1 (Figure 66). In Step 2, the user can either enter the number of acres in the project area or draw the project area on the map by clicking on the “use map” button (see instructions in tsection starting 2.5.1.1). If a project area has already been drawn for use in another tool, the “acres” input box in Step 2 should already be filled in. Keep in mind that this calculator works at the stand level, so the user may need to re-draw their project area. Select the stand composition, the dominant tree cover, in Step 3. Three options are available, “hardwood,” “pine” and “mixed (pine-hardwood)” (Figure 67). If the “hardwood” or “mixed (pine-hardwood)” stand composition is selected in Step 3, the “Carbon Model:” will be specified as “FVS” for the Forest Vegetation Simulator. This model uses a look-up-table approach based on the FVS growth and yield models. If “pine” is selected as the stand composition, the “Carbon Model:” will be specified as “FASTLOB” for a growth and yield model created at Virginia Tech (Figure 68). In this case, real time model runs are made when the user clicks the “calculate” button. Page 49 InFOREST 2014 Virginia Department of Forestry InFOREST User’s Manual Figure 67. Figure 68. Step 4 inputs depend upon the carbon model being used. o For hardwood and mixed stand compositions, the user must select and enter either the stand’s “basal area” in square feet per acre or “dominant height” in feet (Figure 69). o For pine stands, three inputs are required. First the user must enter either the stand’s “site index (base 25)” or “dominant height” in feet. Next the user must enter the number of trees per acre in the stand and the age of the stand in years (Figure 70). Figure 69. Figure 70. In Step 5 for hardwood or mixed stands, the user selects “yes” or “no” for whether they wish to grow the stand to obtain future estimates of carbon sequestered. If “yes” is Page 50 InFOREST 2014 Virginia Department of Forestry InFOREST User’s Manual selected, a drop-down list of “how many years” to grow the stand for becomes available (Figure 71). Figure 71. After Step 5 is completed for hardwood or mixed stands, the user should click on the “calculate” button to run the calculator. The user has the option of entering stand “basal area” in Step 5 for a pine stand (Figure 72). This input is not required. Figure 72. In Step 6 for pine stands (Figure 73), the user must first select whether they wish to grow the stand or not. o If future estimates of carbon sequestered are not desired, then the user should select “no” and then click on the “calculate” button. o If future estimates of carbon sequestered are desired, then the user should select “yes” and then specify the number of years the stand should be grown for. o Two management options are available for pine stands that are grown into the future, “fertilization” and “thinning.” If the user wishes to apply either or both of these management options, they must check the box next to the desired option(s). Figure 73. o If the user checks the “fertilization” box, three additional inputs become visible and are required (Figure 74). First, the age at which the stand will be fertilized needs to be entered into the input box (note that this age has to be greater than or equal to the stand age specified in Step 4). Next, the user must enter the rate of nitrogen that is to be applied to the stand in pounds per acre. Lastly, the user Page 51 InFOREST 2014 Virginia Department of Forestry InFOREST User’s Manual must select the “yes” or “no” radio button for whether phosphorus should also be applied to the stand. Figure 74. o If the user checks the “thinning” box, two additional inputs become visible and are required (Figure 75). First, the age at which the stand will be thinned needs to be entered into the first input box (note that this age has to be greater than the stand age specified in Step 4). Next, the user must enter either the “row removal rate” or the thin to “basal area” desired. Figure 75. Once all inputs are specified, click on the “calculate” button to obtain current and future estimates (if selected) of carbon sequestered by the stand described. When the calculator finishes processing, two charts and a report will be returned at the bottom of the page. The two “Carbon Sequestration Charts” (Figure 76 & 78) show in the first chart, the estimated carbon dioxide equivalent in metric tons per acre and in the second chart, estimated total carbon dioxide equivalent in metric tons sequestered by the stand for both the current and projected future condition if the grow option was selected and removals if a pine stand was thinned. o Holding your mouse over a bar in either chart will result in a balloon containing that bars description and value (Figure 76 & 78). o Either chart can be downloaded as a graphic or PDF file by clicking on either the “PNG” or “PDF” symbols, respectively, below them (Figure 76 & 78). The input stand parameters and carbon sequestration estimates are returned in the Carbon Sequestration Report (Figure 77 & 79). o An optional project name can be added to the report output by typing it in the text box after “Project Name” at the top of the report (Figure 80). o The report can be downloaded by itself or with charts or with a map or with both depending on the boxes checked after the PDF symbol and text that says “include:” (Figure 80). Check whichever options are desired and then click on the PDF symbol to download a PDF copy of the report. Page 52 InFOREST 2014 Virginia Department of Forestry InFOREST User’s Manual Figure 76. Page 53 InFOREST 2014 Virginia Department of Forestry InFOREST User’s Manual Figure 77. Page 54 InFOREST 2014 Virginia Department of Forestry InFOREST User’s Manual Figure 78. Page 55 InFOREST 2014 Virginia Department of Forestry InFOREST User’s Manual Figure 79. Figure 80. Page 56 InFOREST 2014 Virginia Department of Forestry InFOREST User’s Manual 3.4 Nutrient and Sediment Runoff Click on the “Nutrient and Sediment Runoff” tab to see the calculator description and 3 steps (Figure 81). In Step 1, the user must select between two scales of analysis, 1) a “watershed” selection or 2) a “project area” analysis. th o “Watershed” is used to reference a 6 level hydrologic unit (HU), which has a 12digit code. For more information see: http://water.usgs.gov/GIS/huc.html. Figure 81. If the “watershed” option is selected in Step1, the user must then either enter the code of a 6-th level HU in the text box after “VAHU6 code” in Step 2 (Figure 81) or click on the “use map” button to select the watershed of interest from the map (see instructions in section 2.5.1.3). If a “project area” is selected in Step 1, the user is only given the option to click on the “use map” button in Step 2 (Figure 82) to draw a project area in the map interface (see instructions in section 2.5.1.1). Note that the project area must be at least 0.25 acres in size. A pop-up window with a “disclaimer” will appear when a “project area” is selected (Figure 83). o If a project area has already been drawn for use in another tool, the “acres” input box in Step 2 should already be filled in. Figure 82. Page 57 InFOREST 2014 Virginia Department of Forestry InFOREST User’s Manual Figure 83. Once a “watershed” or “hydrologic unit containing all or a majority of project area:” is selected in Step 2, click on the “load data” button in Step 3 to obtain the baseline land use/ land cover data. Figure 84. Once the baseline land use/land cover data is loaded in Step 3 (Figure 84), the user has the option of updating the “baseline” land cover numbers by changing the acres in each class in the “current” column and/or specifying the future land cover acres in the Page 58 InFOREST 2014 Virginia Department of Forestry InFOREST User’s Manual “expected” column. (Hold your mouse over the symbol next to each land cover class for a description.) o “current” and “expected” land cover acres can be updated by typing new values in the input boxes or by using the up and down arrows adjacent to each input box to increment the current values by a tenth of an acre at a time (make sure changes to “current” values are made before changes to “expected” values) o As the “current” or “expected” values are changed, the “(+/-)” column to the right of each input box shows how much the initial values have been changed by. o The “net change” in the “total acreage” for both the “current” and “expected” columns should have a value of zero. If 100 acres is removed from the “forest” acres, it should be added to one of the other land cover acres. Otherwise the total size of the study area will be changed. o Changes are not required to the “current” or “expected” columns to run the calculator. If no changes are made, the nutrient and sediment loads from the baseline land cover will be returned. Once any desired changes are made to the “current” and/or “expected” land cover columns, click on the “calculate” button to run the nutrient and sediment runoff calculator. When the calculator finishes processing, two charts and a report will be returned at the bottom of the page. The two “Nutrient and Sediment Runoff Charts” (Figure 85 & 87) show the Current and Expected values for the chart data selected from the drop-down list in Figure 86. The default is the area by land use/ land cover with the other options being the amount of nitrogen, phosphorus or sediment loads by land use/ land cover class. o Holding your mouse over a pie slice in either chart will result in a balloon containing that slice’s description and value (Figure 85). o Either chart can be downloaded as a graphic or PDF file by clicking on either the “PNG” or “PDF” symbols, respectively, below them (Figure 85). The report contains two tables with the current watershed loads by land use/ land cover class and the expected changes to the watershed loads and land use/ land cover classes (Figure 88). o An optional project name can be added to the report output by typing it in the text box after “Project Name” at the top of the report (Figure 89). o The report can be downloaded by itself or with charts or with a map or with both depending on the boxes checked after the PDF symbol and text that says “include:” (Figure 89). Check whichever options are desired and then click on the PDF symbol to download a PDF copy of the report. Page 59 InFOREST 2014 Virginia Department of Forestry InFOREST User’s Manual Figure 85. Page 60 InFOREST 2014 Virginia Department of Forestry InFOREST User’s Manual Figure 86. Figure 87. Page 61 InFOREST 2014 Virginia Department of Forestry InFOREST User’s Manual Figure 88. Figure 89. Page 62 InFOREST 2014 Virginia Department of Forestry InFOREST User’s Manual 3.5 Open Lands Click on the “Open Lands” tab to see the calculator description and 5 steps (Figure 90). Figure 90. In Step 1, the user is only given a “project area” analysis scale option. In Step 2, click on the “use map” button (Figure 90) to draw a project area in the map interface (see instructions in section 2.5.1.1). Note that the project area must be at least 0.25 acres in size. o If a project area has already been drawn for use in another tool, the “acres” input box in Step 2 should already be filled in. The user has the option of using one of two classification systems, farmland or land capability, for selecting soil types (Figure 91). In Step 3, select the desired system (hold your mouse over the symbol next to the system selection and in Step 4 next to the classes for more information): o “Farmland classification identifies the location and extent of the most suitable land for producing food, feed, fiber, forage, and oilseed crops (NSSH Part 622, n.d.).” This classification system has six classes the user can choose from (Figure 90). For more details see: http://www.nrcs.usda.gov/wps/portal/nrcs/detail/national/soils/?cid=nrcs142p2_05 4226. o “Land capability classification is a system of grouping soils primarily on the basis of their capability to produce common cultivated crops and pasture plants without deteriorating over a long period (NSSH Part 622, n.d.).” This classification system has eight classes the user can choose from (Figure 92). Page 63 InFOREST 2014 Virginia Department of Forestry InFOREST User’s Manual Figure 91. In Step 4, check the box next to each class that you wish to use to select soils within your project area. In Step 5, either type in or use the up and down arrows to set the slope cutoff value that will be used to select soil map units with a slope that is equal to or greater than the value specified (Figure 93). Figure 92. Figure 93. Click the calculate button to run the Open Lands tool. When the calculator finishes processing, two charts and a report will be returned at the bottom of the page. The two “Open Lands Charts” (Figure 94) show the number of acres in the entire AOI (area of interest) and in each riparian buffer for four classes: total, open, selected, and selected and open. o Holding your mouse over a bar in either chart will result in a balloon containing that bar’s description and value (Figure 94). o Either chart can be downloaded as a graphic or PDF file by clicking on either the “PNG” or “PDF” symbols, respectively, below them (Figure 94). The report includes the following information (Figures 95-96): o Total area of the project area/AOI o Area of AOI classified as Open o Area of AOI that meets the user selected criteria (classification choices and/or slope cutoff) o Area of AOI that meets the user selected criteria and is classified as Open o Area of AOI in each riparian buffer for widths of 35, 50, 100 and 200 feet Page 64 InFOREST 2014 Virginia Department of Forestry InFOREST User’s Manual o Area within each riparian buffer that is open, selected, not selected, open and selected, or other and selected o List of all SSURGO map units within the AOI including their area and whether they met the user selected criteria (highlighted in red) o If the 200 foot riparian buffer contained any open area that also met the user’s selection criteria, the location of these areas are returned to the map interface and shown in purple (Figure 97). An optional project name can be added to the report output by typing it in the text box after “Project Name” at the top of the report (Figure 98). The report can be downloaded by itself or with charts or with a map or with both depending on the boxes checked after the PDF symbol and text that says “include:” (Figure 98). Check whichever options are desired and then click on the PDF symbol to download a PDF copy of the report. This tool may take longer than the others to run. “The job is being executed.” will be displayed under the “calculate” button (Figure 99) while it is processing and then change to “The job has completed successfully.” when it is finished (Figure 100). Note: The layer used to determine how much area is classified as Open is a recode of the 2011 Cropland Data Layer (CDL) created by the USDA, National Agricultural Statistics Service (http://www.nass.usda.gov/research/Cropland/Release/index.htm). Page 65 InFOREST 2014 Virginia Department of Forestry InFOREST User’s Manual Figure 94. Page 66 InFOREST 2014 Virginia Department of Forestry InFOREST User’s Manual Figure 95. Page 67 InFOREST 2014 Virginia Department of Forestry InFOREST User’s Manual Figure 96. Figure 97. Figure 98. Page 68 InFOREST 2014 Virginia Department of Forestry InFOREST User’s Manual Figure 99. Figure 100. Page 69 InFOREST 2014 Virginia Department of Forestry InFOREST User’s Manual 4. Frequently Asked Questions Page 70 InFOREST 2014 Virginia Department of Forestry