1
USER’S MANUAL
AMP
NONINVASIVE SCREENING
HEMOGRAM ANALYSER
Manufacturer: BIOPROMIN Ltd.,
Residence: UKRAINE
ALTA.941320.001
30 May, 2009
22
TABLE OF CONTENTS
Description of the AMP non-invasive screening hemogram analyzer and its function
Technical data of the AMP non-invasive screening hemogram
analyzer and characteristics of the system
Build-up and structure of the non-invasive screening analyzer
Control of the system
Software packet
Examination of non-invasive screening blood test and metabolite
test and indication of calculation results
Normal use of analyzer
General description of the USPIH software
Non-invasive screening hemogram analyzer function test
Execution of non-invasive screening blood test and metabolite
examination
Cleaning and disinfection of analyzer and its accessories
Maintenance of the non-invasive screening hemogram analyzer
Search of fault and elimination of faults
Periodic inspection of non-invasive screening analyzer
Documentation of manufacturers’ and periodic inspection
Transportation and storage
Warranty by manufacturer
Execution of destroying
Install the software
Connect up the device AMP to a computer and install the drivers
Setup the program USPIH
Work with the software
How to update the software
Update GUARDANT key
Possible problems and troubles
Description of metabolic and biochemical indices
Certificate
3
7
12
14
15
16
20
22
29
32
32
34
35
36
41
42
42
43
43
51
61
64
80
86
94
101
132
33
Attention! Before use of the system you have to
read carefully the USER’S MANUAL to understand
function of the system!
1. Description of the AMP non-invasive screening
hemogram analyzer and its function
1.1 Purpose of the AMP non-invasive screening
analyzer
The AMP non-invasive screening hemogram analyzer is medical device which actually is able to define
HGB, HCT, RBC, WBC, Lymphocytes (LYM), PLT,
Na+, K+, Ca, total protein (TP), cholesterol (CHOL)
upon measuring the temperature at certain biologically
active points of human body surface using the noninvasive method. The system has continuously
been developed. Measuring techniques and the
software development will allow further parameters measurement with accuracy more than the required existing ones.
Results of the non-invasive examination are preliminary, giving highlights to more accurate and
detailed in vitro examinations results.
1.2 Basic principle of AMP device function
Function of the AMP analyzer is based on interrelation of work of the blood circulation system of insides
with heat of chemical reaction of Nitrogen, Oxygen,
Hydrogen and Carbon. Changes of temperature determine the activity of chemical elements through interrelation of Nitrogen compounds and Hydrogen bound-
44
ing furthermore, through interrelation of Oxygen melting factor changes.
The goal of the examinations is determination of
changes in composition of blood shaped elements and
during the end of chemical reactions which have interconnects with Oxygen consumption and Carbon dioxide exhaust regulated by organism, having influence to
level of protein and lipids in cell membranes.
Taking into consideration, that the AMP non-invasive
screening hemogram analyzer measures the temperature through optic sensors, there is no any influence to
the patients’ organism.
1.3 Function of the AMP non-invasive screening
analyzer
Principle of function of the AMP non-invasive screening hemogram analyzer is based on measurement of
temperature of biologically active “reference” point of
the human body which data loaded, to PC from keyboard is then processed there.
Device has five sensors, which are to be placed onto
so-called biologically active points of patients’ body.
Bioactive or so-called reference-points used during
examination, are following:
• Bifurcation of the right and left neck artery (two
points)
• Right and left armpit (two points)
• Umblical area (one point)
Prior to examination, the five sensors are to be
placed onto patient, and the personal data of him, and
breath rate, pulse rate are to be loaded to PC from the
keyboard. Then the data collection and calculationsoftware starts.
55
Non-invasive screening hemogram analyzer processes signals coming from sensors placed on body of
the patient, converts these signals to digital form and
passes them to the PC.
The PC makes processing of the measured data by
means of appropriate software, and, after the necessary running time makes the measured data visible on
the display. Result of examination can be printed out in
form of medical report.
Non-invasive screening hemogram analyzer works in
time multiplex mode with repeating data collection.
Data sending speed to PC is 56700 bit/s.
Quantity of the measuring data stored in memory is
not less than 64000.
Calculation of the data of blood test parameters is
made by special examination algorithm named Malykhin-Pulavskyi method (Ukrainian Patent Nr. 3546
A61B5).
1.4 The intended field of application of the analyzer
Intended field of the application of the device: clinics,
medical research centres, sanatoriums and other
medical institutions to provide preliminary finding examination.
Schematic diagram of the device is shown on drawing 1.
66
Drawing 1. Schematic diagram of the AMP system
Non-invasive screening hemogram analyzer is sealed
by two seals placed on fixing bolts under the case of
device and near connectors.
1.5. Risks of the use of AMP non-invasive screening hemogram analyzer and limits of examination
method
Examination cannot be executed in the following
cases:
• patient has a fever;
• there are inflammations or purulent places on
the body of patient close to the biological points
(where sensors are to be placed), or lymphatitis;
• there are scartissues on any of the bioactive
surface;
• there are fresh recovering wounds after surgery
or so on any of the bioactive surfaces;
77
7
• in case the patient is in state of psychomotor
agitatio;
• the sensors were not cleaned carefully by alcohol before placing them onto the bioactive surfaces;
• temperature in the examination room does not
exceed range of 18 – 32 °c;
• in case the sensors do not work properly: no
any sensor is allowed to indicate temperature beyond range of 27 – 38 °c;
• in case the atmospheric pressure goes beyond
range of 97,3 – 105,3 kpa (730 – 790 hgmm);
• in case if the humidity raises over 80 %;
• in case if near the analyzer there is other device
generating electromagnetic field with frequency below 26 hz or over 1000 mhz.
2. Technical data of the AMP non-invasive
screening hemogram analyzer and characteristics
of the system
2.1 Technical data of the analyzer
PC mains voltage:
Analyzer mains voltage:
U = 5 ± 1 V DC
Consumption:
Dimensions (WxDxH):
Weight:
(w/cables&sensors)
IP Class:
Protection of patient:
230 V ± 10 %; 50/60 Hz
from USB port
I = 95 mA
max. 0,475 VA
160mm x 100mm x 45mm
0,35
kg
II
BF
88
EMC:
in accordance
EN60601-1-2-2002
IP Class of Analyzer:
IP 20
Readiness time counted from
switching on:
max. 3 min
Time of examination:
730 s
Quantity of sensors connected to
Analyzer:
5
Range of temperature of reference
points:
Margin of error of reference
with
24 – 42 °C
points:
max. ± 0,75 °C
Length of cables for sensors: min. 1,5 m
Connection of Analyze to PC: PS bus
Method of diagnostic:
Malykhin-Pulavskyi
(data collection from reference point)
After switching on Analyzer runs self-test program, to
inspect readiness of the software.
By implementation of the users’ software, Analyzer
can be set to different modes.
99
2.2 Functions of the Analyzers’ software:
• Loading of the patients’ demographic data and
physiological data to the memory of the Analyzer;
• Data collection from sensors and data processing;
• Data view on the screen;
• Saving the data to database;
• Printing out of the results;
2.3 Minimum requirements of the PC hardware:
Processor:
Pentium, or equivalent
RAM:
min. 32 Mb (85 ns)
HDD:
4,3 GB (17 ms)
CD-ROM
Display:
SVGA 14”…17” definition
1024x768 pixels
2.4 Ambient conditions
Working ambient temperature:
Atmospheric pressure:
Humidity
10
IP Class:
IP Class at side of patient:
EMC:
EN60601-1-2-2002
Analyzer IP Class:
Amb. temp. of transportation:
Measuring time range:
10 – 35 °C
101,3 ± 4 kPa
max. 80 % (+25 °C)
(non-condensing)
II
BF
in accordance with
IP 20
-50 °C – +50 °C
180, 360, 720 s
10
10
2.5 Data of patient loaded prior to examination
Data to be loaded by keyboard prior to examination:
Name and Surname of patient
Age of patient
Weight of patient
Pulse frequency of patient
Breath frequency of patient
2.6 Examination data:
Blood of patient:
- haemoglobin concentration (HGB)
- haematokryte (HCT)
- red blood cell (RBC)
- white blood cell (WBC)
- lymphocyte quantity (LYM)
- thrombocyte quantity (PLT)
- serum Na+ concentration
- serum K+ concentration
- serum Ca concentration
- cholesterol concentration (CHOL)
- total protein concentration (TP)
[mg/l or mmol/l]
[l/l]
[1012/l = T/l]
[109/l = G/l]
[%]
[109/l = G/l]
[mmol/l]
[mmol/l]
[mmol/l]
[mmol/l]
[g/l]
11
11
2.7 Accuracy of the data of examination:
HGB
HCT
RBC
120-180 [mg/l] ±10 %; 60-120 and 1800,37-0,52 [l/l] ±10 %;
300 [mg/l] ±15 %;
0,16-0,37 and
3,8-6,2 [T/l] ±10 %;
0,52-0,65 [l/l] ±15 %;
2,6-3,8 and 6,2-7,6
[T/l] ±15 %;
WBC
5-9 [G/l] ±10 %;
3-5 and 9-25 [G/l] ±15 %;
Lym % 20-35 [%] ±10 %;15-20 and 35-50 [%] ± 15 %;
PLT
140-450 [G/l] ±10 %;
Na+
133-147 [mmol/l] ±10 %; beyond normal range
±15 %;
3,4-4,5 [mmol/l] ±10 %; beyond normal range
±15 %;
K+
Ca
80-140 and 450-600
[G/l] ±15%;
2,25-2,65 [mmol/l] ±10 %; beyond normal range
±15 %;
Cholesterol
2,50-7,80 [mmol/l] ±10 %; beyond normal
range ±15 %;
Total protein 60-80 [g/l] ±10 %;
beyond normal
range ±15 %;
12
12
2.8 Details of the whole system
Chart Nr 1. Accessories of the whole system
Item
1 AMP
2 Cable w/ 5 sensors
3 Cable for connecting
analyzer and PC USB
bus
4 Manual
5 Installation (USPIH)
software on CD
6 Key Guardant Stealth
II
7 Cover
Mark
АLТА.941320.001
АLТА.941320.002
АLТА.941320.003
Q’ty
1
2
1
ALTA.941320.001 RE
АLТА.941320.004
1
1
АLТА.941320.005
1
АLТА.941320.006
1
3. Build-up and structure of the non-invasive
screening analyzer
APM non-invasive screening hemogram analyzer and
the PC connected via UBS port is seen at picture 2.
Non-invasive screening hemogram analyzer with rigid
plastic case has a following main parts: processor unit
at PCB, analyzer unit, interface processor connected
to USB bus of PC, socket for patients’ cable and cable
of PC interface with USB port.
On front plate of device the patients’ cable socket,
LED for indication of PC and analyzer connection, and
USB bus for PC connection.
Five sensors connected to analyzer measure temperature of patients’ reference point with accuracy not
less than ± 0,5 °C. Parameters of temperature are sent
by sensors with speed 56700 bit/s to central processor
13
13
unit of the AMP non-invasive screening analyzer.
Demographic and physiological data loaded from keyboard also are sent there. Data given are processed
by central processor unit and are sent to PC which
makes them possible to view and print.
Picture 2. AMP non-invasive screening hemogram
analyzer and PC connected to it
14
14
3.1 Color coding of cables
Chart 2. Connection points of sensors and colour
coding
Connection point of sensor
Bifurcation of left artery
Bifurcation of right artery
Left armpit (axillaries)
Right armpit (axillaries)
Abdominant area (umbilicus) (paraumbilicalis)
Colour code
Blue
Green
Yellow
Pink
Red
4. Control of the system
Function of the system is provided by program of the
central processing unit of analyzer and software
loaded to PC, in time sequences set by operator (180
s, 360 s, or 720 s). Connection of the analyzer to PC in
working condition is indicated by LED on the front
panel.
Software installed on PC provides indication of following modes:
• Calculation time sequence;
• Connection of non-invasive screening hemogram analyzer to PC via virtual serial port;
• Proceeding of calculation process (time sequence readiness);
• Indication of errors in software and analyzer on
windows on screen with information about cause
and way of elimination;
15
15
• Printing out the results of examination;
• Saving the data to database, recall and print out
when necessary.
5. Software packet
”USPIH” installation software is supplied on CD with
the equipment. Prior to use the analyze, it is necessary
to install the software to PC. During installation new
directory appears on hard drive, containing following
files (C:\Program Files\USPIH):
- biolika5.exe – real time control program;
- biopromin.doc – licence agreement for software;
- USPIH_EN.chm– help;
- pacient.db, pacient.px – database files;
- confdbe.ini – database configuration file;
- qtinf.dll – function file;
- FTDI directories – PC interface drivers files;
Other files necessary for operation of interface drive.
”USPIH” software can be used with PC II and
higher, running with Windows - Vista/XP/2000/2003
or equal, or higher level software.
16
16
6. Examination of non-invasive screening blood
test and metabolite test and indication of calculation results
Blood test and metabolite parameters definition are to
be made in following sequence:
6.1 Connect patients’ cable to socket DB9 of analyzer
and fix it by screws (analyzer gets mains power from
PC, therefore it is out of voltage).
6.2 Connect USB cable supplied with PC to analyzer
and USB port of PC.
6.3 Switch on the PC.
6.4 Clicking to icon on the screen run the USPIH software.
6.5 Place sensors onto patient.
6.6 Load demographic and physiologic data of patient
by means of keyboard of PC in sequence shown
below: (hospital class is not obligatory), Name,
Surname, Sex, Weight, Pulse rate, Breath rate as it
shown on picture 3.
17
17
Picture 3: Data entry of patient
6.7
Click to calculation time sequence (picture 4).
Picture 4: Calculation time sequence entry
6.8
Click by mouse at upper menu to Start or run
the processing program by F9 (picture 5).
18
18
Picture 5: start of the data processing program
When processing is completed, examination data appear automatically on the screen (picture 6)
Picture 6: Examination results window
Examination data calculated by PC are saved automatically.
19
19
6.9
Remove sensors from the patients’ body.
6.10 Results of examination can be printed out by
“Print” menu (pictures 7 and 8).
Picture 7: Printing the examination data after preview
of results on picture 8.
Picture 8: Preview of examination results on the
screen.
20
20
7. Normal use of analyzer
7.1 General safety rules
It is prohibited to use the analyzer if:
• ambient temperature is higher than + 35 °C or
lower than +10 °C;
• humidity is higher than 95 %;
• aggressive vapour present in the air;
• dusty spaces;
• direct sunshine;
• strong electric and magnetic fields present;
• moist environment
ATTENTION! Avoid patient and PC connecting cable
against damages and do not bend when disconnecting
cable from socket of analyzer. Only plug pulling out is
allowed. Do not pull cable itself.
ATTENTION! During normal operation of PC it is
prohibited to connect cable of analyzer to USB port or
to disconnect plug from socket of USB port.
ATTENTION! Keep cable connection sequence.
Connect patients’ cable to analyzer first, and then
connect non-invasive screening hemogram analyzer
to USB port of PC.
21
21
7.2 Safety measures
Warning! During operation and maintenance of
the system, the following safety measures shall to
be kept:
a) It is prohibited to use the analyzer in case of damaged cable isolation.
b) Before use make a visual inspection of case of
analyzer that there are no any broken or torn parts or
other kind of mechanical damage.
c) Avoid the analyzer against moisture condensation.
In case of fast ambient temperature change, allow at
least 30 minutes to evaporate the moisture.
d) It is prohibited to connect any cable to any socket,
or disconnect any cable from any socket if the PC is
switched on.
e) Power cable of PC shall have protective ground
wire, and the plug shall have ground connection, and
shall be conform with mains socket.
f) Data processing units connected to device shall be
used with safety transformer which shall meet requirements of standard MSZ:60601-1/1997 related to
medical devices (e.g. ST-200 transformer made by
Standel Ltd.).
g) Do not twist the mains cable, and place it the way,
to avoid its damage and against jamming among other
objects.
h) It is prohibited to use aerosols and liquids for
cleaning the device.
22
22
i) Always place the analyzer on stable and solid surface.
j) Always restart the PC allowing 20 minutes at least.
k) It is prohibited to use the analyzer in tinderbox,
e.g. in room where flammable sleeping-draughts are
kept.
8. General description of the USPIH software
Most of the operations connected with analyzing are
executed by USPIH software running on PC.
USPIH software runs under WINDOWS operation
system. USPIH program can be recalled by clicking by
mouse at USPIH icon at desk or Start button on bottom of Windows tools, and then, select the USPIH
program from “All programs” menu list. The initial window of USPIH program is shown at Picture 9.
23
23
Picture 9. Initial window of USPIH program after selection of the program
Upper tool menu at window there are the following
buttons of menus (picture 10):
• Setup
• Parameters (F2)
• Calculate (F4)
• Write
• Start
• Print
• About
24
24
Picture 10. USPIH program menus
- Setup menu contains the followings (factory setup):
1.
Language.
2.
Report setup.
3.
Print setup.
Parameters (F2) menu contains further additional parameters calculated by program and view of the preliminary report for diagnosis necessary for doctor.
- Calculation (F4) menu serves for preliminary calculation of blood test parameters and other biochemical
data.
- Write: clicking to that button program calculates all
the calculation parameters and save that to database.
It is important in case of use new version of the program or for search patients’ empty or wrong filled in datasheets.
- Start menu starts calculation of examinations results.
- Print menu makes possible preview of data to be
printed and printing the results.
- About make possible searching by word in Windows.
25
25
At left side of initial window of USPIH program (picture 9) there is a field for loading demographic and
physiological data of patient (picture 11).
Picture 11: field for filling in demographic and physiologic data of the patient
Function of rows on data loading field:
• Remark: notices connected with patient (e.g. ward,
or any other);
• Name: name of patient;
• Sex: sex of patient (M-1/F-0);
• Age: age of patient;
26
26
• Weight: weight of patient;
• Pulse rate: pulse arte of patient;
• Breathing rate: breathing rate of patient;
Filling in the ”Remark (Ward filling is not obligatory) is
to be made by letters, other fields are to be filled in by
numbers (Name, Sex).
At middle field of initial window of USPIH program
(picture 9) there is a blood test and metabolite results
data field (picture 12).
Picture 12. Field of view results of blood test and metabolite examination
27
27
Field at right of results indication field shows names
of previous patients in alphabetical order, and at very
right side, there is a field to indicate test time sequence (picture 13).
Picture 13. List of patients and time sequence
At left bottom side of the initial window of USPIH program (on picture 9) digital stopwatch is shown (picture
14) which is to be used during measurement of pulse
rate of patient. Stopwatch starts by clicking to field
00:00 or pushing buttons Alt+S.
Picture 14. Stopwatch
Preview is possible by clicking to button Print on top
menu of USPIH program initial window (picture 15).
Picture 16 shows an example.
Picture 15. Initial window of USPIH program.
28
28
Picture 16. Print preview and print window
There are buttons at top menu of window (picture 16).
They allow to:
• Save a report to a file;
• Print a report;
• Update of software
• Clean the window
• Fonts
• Export to MS Word
• Export to Open Office Calc
• Export to Open Office Write
• Exit from the window.
29
29
9. Non-invasive screening hemogram analyzer
function test
Usually, function test of analyzer shall be proceeded
prior to each shift, during initial switching on of the device, as follows (tests are carried out in atmosphere
pressure 750 mm of mercury column). Validity period for tests is 1 year. Tests must be done only by
manufacturer or representative company.
9.1 Connect patients’ cable to socket DB9 of analyzer
and fix it by screws.
9.2 Connect USB cable to analyzer and to PC.
9.3 Switch on the PC.
9.4 Run USPIH software by clicking to its icon.
9.5 Place sensors into vessel with glycerin at 33°C as
it shown at picture 17. Check the temperature of
the glycerin by common gauge.
Picture 17. Placement of the sensors during function
test of analyzer.
9.6 Fill in the data fields of patient (name, sex, age,
weight, pulse rate, breathing rate) as it shown at
picture 18.
30
30
Picture 18. Data sheet of patient.
9.7 Click on Start menu at upper tool menu of USPIH
program. Label of the button will change to Stop.
In field of program running progress under upper
menu growing numbers will appear (0 % …100 %),
and, in accordance with examination sequence (180
sec, 360 sec, 720 sec) red, green or blue bends will
appear, filling up from left to right. When the time sequence ends, label Stop of menu button will change to
Start label again and the program will stop calculation.
Test is successful if results are the same as it shown
on picture 19, with following conditions:
31
31
Picture 19. Analyzer function test result
In fields LSA, PSA, LPV, PPV, ABD the same data
will appear, e.g. 33. Difference between data shall not
exceed ± 0,1.
Should the device not meet that requirements, it shall
be considered faulty, and its use is prohibited until its
repair.
32
32
10. Execution of non-invasive screening blood
test and metabolite examination
10.1 Make a non-invasive screening blood test and
metabolite examination as it is described in para.
6. Pay attention to place sensors in color sequence as it is described in para. 3.1.
10.2 Diagnosis, saving, data processing and activation
are subject to local regulations and rules.
10.3 Remove sensors when examination is finished.
10.4 Switch off the PC.
11. Cleaning and disinfection of analyzer and its
accessories
Attention! Prior to cleaning and disinfection of
analyzer surface, all the cables shall be removed
from non-invasive screening hemogram analyzer
sockets.
Attention! Disinfection of the surface and patient
cable by spirit or other, aggressive chemicals or
solvents (phenol based chemicals, ester, benzyl,
prop anole, chlorophorm or acetone is PROHIBITED.
Attention! Disinfection of analyzer and its accessories by heated air is PROHIBITED.
33
33
11.1 Wipe case of analyzer by soft squeezed wet
cloth dipped to soap water.
11.2 Disinfection of analyzer surface is to be made by
disinfectant approved by Ministry of Welfare.
Avoid analyzer against getting in the liquid inside
during cleaning and disinfection of analyzer case.
11.3 Clean case of analyzer by dipped to soap water
squeezed cloth.
11.4. Disinfection of cables is to be made by disinfectant approved by Ministry of Welfare.
11.5. Disinfection of sensors is to be made by 96 %
purity spirit.
Do not wipe sensor by cloth as it may cause
scratches on its surface.
To provide life expectancy of analyzer, cables
and sensors, it is PROHIBITED:
• to bend cables of sensors and PC;
• to remove sensors from patient pulling the cables,
or to pull cables from sockets;
• to wipe surface of sensors to clean them, or to use
any solid, abrasive materials for cleaning.
34
34
12. Maintenance of the non-invasive screening
hemogram analyzer
Maintenance of the analyzer is provided by staff of
user in accordance with timetable in Chart 3.
Chart 3. Maintenance of the non-invasive screening
analyzer
Timetable
Item
function test (chapter
10 para. 1-7)
visual inspection of
analyzer, connections,
cables and sensors for
damages
cleaning of analyzer
(chapter 12 para. 1-2)
periodic inspection
by manufacturer
everyday use
after
storiage
after
transportation
daily
+
+
+
+
daily
+
+
annually
and after
repair
-
-
daily or
if required
Warranty and other repair is provided by
ONKOCET Ltd., Sreznevskeho 17, 831 03 Bratislava,
SLOVAKIA
Tel/Fax: +421-2-44640977 e-mail: [email protected]
www.onkocet.eu
Warranty repair of PC is provided by dealer.
35
35
13. Search of fault and elimination of faults
Analyzer is an accurate measuring device repair of
that is to be provided by manufacturer or its local representative. Chart 4 contains possible faults requiring
presence of manufacturer or its representative.
Chart 4. Search of faults and elimination of faults
Fault
There is a disturbing signal
on one or
more sensor
No data collection during
examination
Possible reason
Elimination of
fault
1. Sensors are
placed not
properly on
body
Check up placement of sensors as
it tight enough
2. Disruption of
one or more cables
Contact representative of manufacturer
Disruption of
analyzer usb
cable or connection fault of
socket
Check up usb cable and sockets
36
36
14. Periodic inspection of non-invasive screening
analyser
Periodic inspection of the non-invasive screening
hemogram analyzer is to be made annually after its
use or storage. Manufacturer provides inspection described below during manufacturing and annually and
after repair.
Chart 5. Devices used during periodic (annual) inspection
1
Diaphragm barometer
Measuring range: 50 – 760
Hgmm
Aspiration huMeasuring range: RH = 20 –
2 midity measuring
90 % (16 – 40 °C)
device
3
Precision digital
thermometer
Ultra thermostat
4 with digital readout
Measuring range: 0 – 100 °C
(error ≤ 0,036 °C)
Temperature range: 0 – 60 °C
Measuring accuracy of thermostat:
± 0,15 °C
During periodic inspection of the device unpack the
analyzer and keep in the room for inspection at least
for 24 hours.
Execution of inspection (provided by service):
14.1 Connect patients’ cable to socket DB9 of analyzer and fix it by screws.
37
37
14.2 Connect USB cable to analyzer and USB port of
PC.
14.3 Switch on the PC.
14.4 Run the USPIH software clicking to icon.
14.5 Place sensors into vessel filled by vaseline and
place the vessel into thermostat. Arrangement is
shown at picture 20. Set the thermostat temperature 33 °C. Wait until the temperature of the vaseline will be stabilized at level of set temperature.
Picture 20. Arrangement of periodical inspection of
analyzer
14.6 Load the patients’ data to fields name, sex, age,
weight, pulse rate, breathing rate as it is shown on
picture 21.
38
38
Picture 21. Loading the data to program
14.7 Click to Start menu at upper toolbar of USPIH
program. Label of button will change to Stop.
14.8 In field of program running progress under upper
menu growing numbers will appear (0 % …100
%), and, in accordance with examination sequence (180 s, 360 s, 720 s) red, green or blue
bends will appear, filling up from left to right.
When the time sequence ends, label Stop of
menu button will change to Start label again and
the program will stop calculation:
14.9 Test is successful if results are the same as it
shown on picture 22, with following conditions
14.10 In fields LSA, PSA, LPV, PPV, ABD the 33 ±
0,1 data will appear.
39
39
Picture 22. Result of analyzer function test
14.11 Check up of temperature range at reference
points as it is seen on picture 23 arranged as described above.
a) Set the thermostat temperature at 24 °C, check up
after 30 minutes whether the temperature of the thermostat reached the set temperature (24 ± 0,5 °C) and
then read out and record temperature of Vaseline indicated on precision thermometer, and temperature
measured by all the sensors of the AMP non-invasive
screening hemogram analyzer (1, 2, 3, 4, 5).
b) Repeat the procedure at vaseline temperatures 26
°C, 28 °C, 30 °C, 32 °C, 34 °C, 36 °C and 37 °C set by
thermostat reading temperature indicated by precision
digital thermometer and temperature measured by
each of sensors of AMP non-invasive screening hemogram analyzer (1, 2, 3, 4, 5) (see Chart 6).
40
40
Chart 6
24 ºС
26 ºС
28 ºС
ОТ
№ AMP
Δ
1 24.30 0,05
2
24,25 3
4
5
ОТ
№ AMP
Δ
1
2
25,75 3 25.7 - 0,05
4
5
ОТ № AMP
Δ
1
2
28,4 3
4 28.36 - 0,04
5
30 ºС
ОТ № AMP
Δ
1
2 30,22 + 0,02
30,2 3
4
5
32 ºС
ОТ № AMP
Δ
1
2
31,8 3
4
5 30,75 - 0,05
34 ºС
ОТ № AMP
Δ
1
2
34,4 3
4 34.46 + 0,06
5
36 ºС
ОТ № AMP
Δ
1 36.05 + 0,1
2
35,95 3
4
5
37 ºС
ОТ № AMP
Δ
1
2
37,15 3 37.10 - 0,05
4
5
41
41
Relative error of temperature measurement at different set temperatures is calculated by formula below:
σt =
T MP − T AMP
Δ
⋅ 100 =
Т MP ⋅100,
Т MP
(1)
Where:
ТMP – temperature indicated by precision digital reference thermometer [ºС];
ТAMP – result of temperature measuring of AMP noninvasive screening analyzer [ºС];
Δ = ТMP - Т АМP, [ºС] – data calculated by this formula shall be registered in Chart 6.
Criteria of conformity: Δmax ≤ 0,1 ºС in range of temperature 24 °C – 37 °C.
15. Documentation of manufacturers’ and periodic inspection
Should the inspection of analyzer has been successfully completed, manufacturer issues certificate of conformity and places label on sealing points of analyzer,
indicating date and sign.
Should during inspection device do not meet conformity requirements, it is qualified as faulty and shall not
be used.
42
42
16. Transportation and storage
16.1 Manufacturer or its authorized representative
supplies the analyzer to the customer. Transportation of the properly packed analyzer is allowed by any transportation means in accordance with applicable rules for the transportation means.
16.2 Analyzer shall be kept in manufacturers’ packing.
Warehouse shall be clean, free of dust, acid, alkali
vapour or other dangerous components. Storage lifetime of device is one year maximum.
17. Warranty by manufacturer
Warranty period is 24 month for the device and 12
month for cable with 5 sensors counted from date of
commissioning of analyzer, but not more than 30 days
counted from the date of manufacturing.
Within a warranty period manufacturer will exchange
the faulty device.
Should the seals are broken, or there are mechanical
or chemical damages on the device, user lose the
guarantee.
Over the guarantee period, all the works are to be
paid to manufacturer in frame of separate contract.
43
43
18. Execution of destroying
After its rollout, analyzer shall be transported to manufacturer’s site.
From the point of view of saving ecological environment, instead of destroying the device, it should be returned to the dealer.
19. Install the software
Be sure you have Administrator rights on your
computer before installation.
19.1 Please, make sure that a computer has a free
USB slot and any attached printer, before installation
the program USPIH.
19.2 Put into a CD-ROM drive the purchased installation disk.
19.3 There will appear the following menu on your
display. You can start installation when click by the inscription «Run Setup_USPIH.exe».
44
44
19.4 Select Setup language and press the button
«OK»:
45
45
19.5 Press the button «Next >»:
46
46
19.6 Press the button «Next >»:
47
47
19.7 Press the button «Install»:
48
48
Please wait while Setup installs USPIH 6.2 on your
computer.
49
49
19.8 Press the button «Install this driver software anyway»:
19.9 Press the button «OK»:
50
50
19.10 Press the button «Yes»:
19.11 Press the button «Finish»:
When the program is installed, there will appear the
icons for starting the program USPIH 6.5 on the Desktop and in Quick Launch.
You are ready to connect up the device AMP and install the drivers.
51
51
20. Connect up the device AMP to a computer
and install the drivers
20.1 You should prepare the device for connection to
the computer:
- link up the device AMP and cable with 5 microprocessors;
- connect the USB cable to the device;
- connect the USB cable to your computer.
You will see the following message on your display:
20.2 Press the button «Locate and install driver software (recommended)»:
52
52
20.3 Press the button «I don’t have the disc. Show
me other options»:
53
53
20.4 Press the button «Brows my computer for driver
software (advanced)»:
54
54
20.5 In default, the drivers for connection the device
AMP to your computer through USB interface are in
the folder «C:\Program Files\USPIH» (select «Include
subfolders»).
Press the button «Browse…»:
55
55
Select the folder «C:\Program Files\USPIH\FTDI»:
56
56
Press the button «Next»:
57
57
20.6 Press the button «Install this driver software anyway»:
58
58
Installing driver software...
59
59
20.7 Press the button «Close»:
The following message will appear at the desktop:
If you device was completed with special key Guardant Stealth II.
60
60
Put Guardant Stealth II into a USB slot of your computer.
The following message will appear on your display:
The process of connection up the device AMP to your
computer and installation of all drivers is finished. So
you can pass on to adjustment of the program USPIH.
61
61
21. Setup the program USPIH
21.1 Please, start the program.
21.2 The program will start in English:
62
62
21.3 Setup a report of diagnostics for printing:
To make more detailed setup of a report, open in a
menu "Setup"->"Print setup".
There will be displayed a panel «Print setup».
Tick off the results you want to print. Your Essential
Elements (the name of a company, telephones, etc)
will be printed in a heading of report. You can adjust
the Essential Elements across using space bar.
Then, press the button "Exit" and a panel "Print setup" will be closed. All changes will be saved and take
effect only after leaving a panel "Print setup".
63
63
Then you are ready for a work with the program USPIH.
64
64
22. Work with the software
22.1 A description of the program USPIH interface.
22.1.1 The menu
"Setup"- use to setup an interface language and detailed setup of a diagnostic report.
"Parameters(F2)" - use to display a panel with additional parameters.
"Calculate(F4)" - use to define a blood formula and
additional parameters by hand.
"Write(F5)" - use for checking a completeness of the
database before the program USPIH ends of working.
"Start(F9)" - use to start up the device AMP and to
begin measuring.
"Print(F11)" - use for preparing and printing a report
with defined parameters of blood formula, etc..
"About..." - it is short information about the program...
"?" - use to open a Help file.
F1 – use to open a Help file.
F6 – use to select Standard panel or CE panel.
65
65
22.1.2 Timer
It is used for calculation of patient's heartbeats by
hand.
The Timer starts working when you click the left button of a mouse on "00:00". After that, it works
3minutes and stops automaticaly.
22.1.3 Other controls
When you press this button,
all records in the database of patients will be rewrited.
In other words it'll be carried out indexation of the database. Also, all patient's cards will be checked whether they were filled in right (Are they complete or
not?).We recommend you to make a Record at the
end of the work with the program. If there are any errors in database, the program will stop on a wrong patient's card and suggest deleting it. We recommend
you to follow the program’s instructions.
When you press this button,
the program makes a calculation of parameters (it defines them). The definitions will be made automatically,
66
66
but if it is necessary to specify (correct) weight, pulse
or smth else, you should press the button above.
To save an information about patient in the database
.
When you press this button,
you will leave the program.
These are buttons for navigation through records in
the database:
pass on the first records in the database.
pass on the last records in the database.
pass to the previous records in the database.
pass to the next records in the database.
pass to the next or previous records in the database.
delete a patient's card.
67
67
edit record.
save information about patient in the database.
ATTENTION! To save information about patient in
the database, you should OBLIGATORY press this
button after testing a patient and manual definition of
blood formula
ATTENTION! Unfortunately, the database supports
only unique name of records. So, if you have already
had a patient Ivanov Ivan in your database, you will
not save another patient with the same name. There
will be displayed the following window:
In that case, you can write in the field "Name" - Ivanov Ivan 2 or Ivanov Sergey, etc. So, you can see that
the patient Ivanov Ivan come to test repeatedly and
Ivanov Sergey was another patient.
68
68
Attention: when you add a new patient and press the
button
, the program adds the unique number
after every name. Please, DON'T DELETE IT and all
records will be unique in your database.
22.2 How to fill in a patient's card
Please, fill in the following fields:
Remark - This field is for short overhead information
(optional information). For example, from which clinic
or hospital a patient is.
Name - Patient's name and surname.
Sex - male (man) or female (woman) Attention! You
should write only a letter m or M, w or W. It is recommended write a figure 1 – for male, and figure 0 – for
female. Please, don't try to put any other letter!
Age - complete number of years (from 6 till 99).
Weight – complete number of weight (kilogram).
Puls - quantity of heartbeats during 60 seconds. (You
must define it exactly!) You can use pulse sensor
"POLAR", if you have any problems with definition of
heartbeats' quantity by hand. You can order this sensor in our company or buy it yourself.
Breath. Freq. - quantity of breathes during a minute.
Diagnose – A diagnosis (or complaints) that a patient
has before examination. This field supports 250 symbols. So, write shortly, please.
69
69
IT IS IMPORTANT! Don't fill in other fields. They will
be completed automatically.
22.3 Put the microprocessors on a patient, each color
for corresponding field:
- on the bifurcation of aorta, at the left
BLUE
side, in the area of cricoid’s cartilage.
GREEN
- on the bifurcation of aorta, at the right
side, in the area of cricoid’s cartilage.
YELLOW
- in the left axillary crease (like a thermometer).
VIOLET
RED
- in the right axillary crease (like a
thermometer).
- on the umbilicus (navel). If a patient
hasn't a navel, you should put the microprocessor to the region, where the
navel was before surgery.
22.4 Press the button F9 on your keyboard or
"START" in the menu. An information processing will
be begun. It will last 360 sec, and blue line will show a
progress of the device working.
70
70
An interval of examination (in default, it is 360sec).
An interval of examination can be changed during the
process of the device working. You should pay attention to the color of temperature figures, they couldn’t
be red! If some of them s red, this microprocessor was
put in wrong way. Put it again.
From version USPIH 6.4 interface of the program
was changed. There were added the indicators of 5microprocessors’ application accuracy.
The first indicator changes its color from red to green
when:
-the difference between temperatures in fields of left
and right carotid artery bifurcation is less than 0.5°C;
-the temperature in 5 fields becomes stable;
71
71
Otherwise the indicator is red.
or
The second indicator changes its color from red to
green when: the difference between temperatures in
fields of left and right axillary creases is less than
0.5°C, the temperature in 5 fields becomes stable.
Otherwise the indicator is red.
or
When the process of examination is finishing, you
can see the following notice on the bottom of the panel.
Different numbers could be there, but they must be
nonzero.
72
72
If any number is zero, you should choose larger interval for the examination (for example, you examination was 360 sec, you should choose 720 sec interval
in such case).
When the progress of examination is 100%, all fields
of patient’s card will be completed. The progress line
will disappear. Hemogram fields will be completed too.
IT IS IMPORTANT! Please, remember a blood formula, in itself, gives not enough information about the
state of patient and prognosis for a disease.
22.5 To display the additional parameters of diagnostic press on your button F2 or "Parameters(F2)" in
menu. A panel with additional parameters will appear.
73
73
This panel has colored windows:
- red – the parameter is higher or lower than norm;
- blue – the parameter is normal;
- white – the parameter doesn’t compare with norm;
- yellow – the parameter doesn’t satisfy the norm.
IT IS IMPORTANT! Please, remember there is no
one person with used norms of all parameters in nature. These parameters were received many years
ago, in limited study population. They are average statistical.
IT IS IMPORTANT! Additional parameters help to estimate a patient' state more exactly and make a prognosis for a disease, prescribe medicine.
74
74
You can close this panel use keys ALT+F2, when
you have studied all additional parameters.
22.6 To prepare a report for printing, please, press
key F11.
When you press the key F11, there will be displayed
a window of report editor. There is a computer prompting of presumptive diagnosis for a doctor at the end of
a report. A doctor can agree or not with it, add or delete something from it or delete at all (print a report
without it for patient).
IT IS IMPORTANT! Please, remember: only a doctor
can diagnose a patient! A computer gives a prompting
from a list of diagnosis from its memory. So a computer doesn't know all nosology now!
75
75
22.7 Saving results of diagnostics in file or print copy.
To save results of diagnostics in file, please, press
the button
and save it.
To print results, please press the button
Cleaning a report editor :
Selection of a font:
.
.
.
Press the button
to export results to MS Word.
The program exports results of diagnostics to MS
Word and will start it:
76
76
Press the button
to export results to the Open
Office Writer. The program exports results of diagnostics to the Open Office Writer and will start it:
Press the button:
Office Calc
to export result to the Open
Leaving a panel "A report of diagnostics:
.
77
77
The same functions can be caused by means of the
contextual menu. Click the right button of a mouse on
corresponding record and choose necessary application:
22.8 End of working with program USPIH
When you finish working with program USPIH,
choose in a menu "Write F5" or press the following
button:
.
78
78
If any patient's card has been filled wrong, there will
be displayed the following window:
Press "OK". There will be displayed a confirmation for
deleting a wrong card:
Please, confirm deleting a wrong patient's card and
press "OK". A card will be deleted.
If there were some wrong cards in your database,
you should do actions described above till all wrong
cards are deleted.
To close program USPIH, press the button:
.
79
79
22.9 Calculation of examinations' quantity (not for all
versions of the device).
The program calculates examinations' quantity automatically. You can see a quantity of remaining examinations (till software update) at the right corner of status bar:
There are 9 more examinations in this example. As a
quantity of remaining examinations is less than 10, a
status bar is red.
ATTENTION! If status bar of the program USPIH has
changed its color to red, please, connect with your
provider of the program and device AMP for renewal
your GUARDANT key (look part 25). Let him know the
number of your device and exchange your GUARDANT key for new one (with updated software).
NOTES: If the remaining quantity of examinations is
"0", the program USPIH will not work (you couldn't examine new patients).
80
80
23. How to update the software
23.1 To update the program «USPIH» click «?» and
choose «UpDate USPIH».
Click on the button
in the appeared window.
You will be re-directed to a web http://www.analizatoramp.com.ua/en/.
81
81
Choose the tab «Support». Then click «How to update the software».
Click on icon «Update for the program USPIH».
Press the button
window immediately.
if you want to open a loading
82
82
Put the serial number (for example 38081010) of you
device AMP and press an arrow:
Press the link:
83
83
Press «Save»:
Select a folder for saving (for example, Desktop).
Press «Save»:
84
84
When the file “biolika5.zip” is downloaded, unpack it
please.
Please, press «Extract»:
85
85
A folder with program update will open:
Start updating. There is the detailed description of
this process in the part «Install the software».
23.2 To receive the user manual for the device AMP,
click on the same icon and save the manual like it is
described in part 24.1.
86
86
24. Update GUARDANT key
You can update your GUARDANT key yourself. You
should do the following:
Open
«C:\Program
Files\USPIH»,
GSREMOTE.EXE application.
start
the
87
87
Press the button «Next»:
88
88
Press the button «Next»:
Press the button «Copy» and send a numberquestion to e-mail which you can find on
http://www.analizator-amp.com.ua/en/ or send it to
ICQ: 259-030-294 (in following example the numberquestion is «5693DD68C040B89EEA88D73ECB5FCA
4F7B165FC73FFA81FDFF9064032C9E138E»)
89
89
Press the button «Next»:
90
90
Press the button «Next»:
91
91
You will receive by e-mail an updated file “remote.upd”. You should press the button «Browse...»
and specify a path to file “remote.upd”.
92
92
Press the button «Next»:
93
93
If you see the following window, your GUARDANT
key is successfully updated. Press the button «Finish»:
Dongle memory contents have been successfully updated!
You can buy a version of the device without examination accounting.
94
94
25. Possible problems and troubles
25.1 Problem: After installation the program USPIH,
program doesn't work.
Solution:
a) Please, check whether key Guardant Stealth II
connect with computer (through USB-port):
b) There should be light inside your key (there is a
LED inside). If there is no light, you didn't install the
driver for Guardant Stealth II. Please, install it.
c) You should check whether the driver for Guardant
Stealth II was installed right.
Open the «Control Panel»:
95
95
Run the «System»:
96
96
Select «Advanced system settings»:
97
97
Select «Hardware» and «Device Manager»:
98
98
Check whether controllers were installed right:
If they were installed wrong or ill-worked, please install them once more.
99
99
25.2 Problem: LED on the front panel of the device is
blinking
Reason: the cable with 5 microprocessors is damaged.
Solution: Let your provider know that and ask him to
exchange damaged cable with 5 microprocessors for
new one.
NOTES: The exchange of cable with 5 microprocessors will be realized only in a complete with your device AMP and Guardant Stealth II key.
25.3 Problem: After starting the program USPIH the
following panel appears:
Solution:
a).The device AMP hasn't connected to your computer. Connect it, please.
b). A USB-cable is damaged, please exchange it.
100
100
25.4 Problem: At attempt of updating the window
looks like:
Solution: Check up connection options to the Internet.
101
101
26. Description of metabolic and biochemical indices, covered by Malykhin-Pulavskiy USPIH Software
Electrolyte metabolism:
10. Calcium is a cation, constituting a part of blood
cells and electrolytes. Its normal concentration in the
blood plasma ranges from 2.02 to 2.2 mmol/l. It is
regulated by parathyroid gland, bone tissue and pituitary thyrotropic hormone. The regulation of calcium in
the organism is attained by triiodothyronine and
tetraiodothyronine metabolism optimization, as well as
by creatinine kinase of the muscles and heart.
11. Magnesium is a cation, constituting a part of
blood cells. Its primary functional purpose is participation in the development of conductivity and contractility
of those muscles, constituting a part of vascular wall.
Magnesium normal value ranges from 0.7 to 1.0
mmol/l. It is regulated by the activation of creatinine
phosphatase phosphorylation. In case magnesium
level is less than 0.7 mmol/l, clinical picture of the disease is characterized by neuromuscular hyperexcitability, spasmophilia, and asthenic feelings.
12. Potassium is a cation, being presented in the
blood plasma in the concentration 4.14 – 4.56 mmol/l.
Its primary functional purpose is to participate in the
neuromuscular conductivity. The gastrointestinal tract
and kidney play a significant role in the regulation of
potassium metabolism. Hypokalemia threatens with
severe consequences. It may be observed in Conn's
syndrome and can accompany occasional myoparaly-
102
102
sis, combined with migraines, epilepsy, and progressive muscular dystrophy. Hypokalemia can appear as
a result of potassium loss through the gastrointestinal
tract and kidneys, and due to the diabetic acidosis.
Hyperkalemia is associated with the cardiac and renal
malfunctions.
13. Sodium is a primary cation in the blood plasma.
Its normal value is 130.5 – 156.6 mmol/l. Changes in
the concentration relate to the changes in plasma specific conductivity, which normally makes up 0.72 +- 1
Ohm/cm. Changes to the regulation of sodium in the
organism are associated with kidney diseases, gastrointestinal disturbances, as well as with the impairment
of contractility. Rise in venous blood pressure causes
hydrostatic pressure to increase. When hydrostatic
pressure is higher than oncotic pressure, this can
cause electrolytes out of intercellular space. This phenomenon leads to hypovolemia and activates juxtaglomerular apparatus of kidneys. This results in stimulation of the adrenal cortex and increase in aldosterone
secretion. In a whole, these factor combinations give
rise to the organotrophic disorder. All these factors
bring on changes in the diurnal diuresis.
The system of blood fibrillation:
14,15,16,17 The most important factors of this system are plasma kinins. Practically, they form kinin system, which supports regulation of the local and general
blood circulation, as well as vascular permeability. The
main mechanisms are interactions between plasma
kallikreins and tissue kallekreins (of pancreas, salivary
glands, kidneys and intestinal wall). As the final result,
103
103
this interaction leads to the beginning and to the end of
blood fibrillation. It is observed that there should be an
interval, exceeding 30 seconds, between the beginning and the end of blood fibrillation. The platelets
(containing arachidonic acid) play an important role in
the formation of this time interval. Haematocrite is of
considerable importance in the formation of interval
between the beginning and the end of blood fibrillation.
The fermentative system:
18,19,20,21,22 AST and ALT are enzymes catalyzing intermolecular amino group transfer between
amino acids and keto acids. As a result of the interaction between these transferases, oxaloacetic, pyruvic
and glutamic acids. Elevations of aminotransferase
activity, especially of AST, are observed in the myocardial diseases. Elevations in ALT activity is observed
in viral hepatitis type A. Besides, elevation of ALT activity is seen with acute myocardial infarction, but this
elevation is not so sharp, as compared to AST activity.
Simultaneous determination of these two aminotransferases is a very valuable diagnostic test. In health,
AST-ALT activity ratio (de Ritis coefficient) equals to
1.33+- 0,42. This coefficient reduces in the patients
with viral hepatitis and rises in the patients with acute
myocardial infarction.
23. Amylase is an enzyme that breaks carbohydrates (starch etc.) down into glucose. It facilitates glucose uptake from the blood. It is secreted with saliva
into oral cavity, where it begins to break starch down,
or with pancreatic juice into duodenum. Acid gastric
juice inactivates amylase. The experiments have
104
104
shown that after 80 g glucose was administered, amylase administration ensured that blood sugar indices
remained normal. 86% of patients with diabetes have
a small amount of amylase in their intestinal secretion.
Being an enzyme produced by pancreas, amylase
level in the blood and urine rises sharply, in the progress of pancreatitis.
24. Bilirubin is a pigment, formed as a result of hemoglobin breakdown, and to a lesser extent as a result
of megaglobin breakdown. The determination of total
bilirubin and its fractions is very important for the differential diagnostics of jaundice of various etiology.
The elevation of unconjugated bilirubin level in the
blood and tissues is determined with hemolytic jaundice. In hepatocellular jaundice, hepatocytes are being
destructed , conjugated bilirubin excretion into the bile
capillaries is impaired and it leaks into blood, where its
level elevates significantly. Moreover, ability of the
hepatocytes to synthesize bilirubin-glucuronides reduces. Consequently, unconjugated bilirubin level elevates. In obstructive jaundice, the biliary excretion is
impaired, which leads to steep elevation of conjugated
bilirubin level.
27. The concentration of plasma protein. Plasma
proteins are divided into three groups: albumins,
globulins and fibrinogen. Being colloids, proteins bind
and hold water, preventing its outflow from the bloodstream. Some plasma proteins, fibrinogen in particular,
are basic components of blood clotting. Blood plasma
proteins are one of the most important circulatory buffers, which support level of blood cations by forming
nondialyzable compounds with them. The clinical prac-
105
105
tice has evidenced conditions, defined by the change
of total plasma proteins. Hyperproteinemia is a increase of total protein concentration in the plasma. It is
seen with diarrhea, vomiting, obstruction of the upper
small intestine and water loss. Hypoproteinemia, i.e. a
decrease in the total protein concentration, is seen in
the patients with neurotic syndrome. In addition, it occurs with hepatocytic lesions, and with the disorder of
renal filter (lipoid nephrosis). Generally, we may relate
hyperproteinemia to hyperglobulinemia and hypoproteinemia to hypoalbuminemia.
Oxygen consumption and transportation:
28. Plasma density. The plasma density is defined
by total amount of plasma cations and anions. 1048 1055 g/cm3 is a norm. Changes in the plasma density
are attributed to the disorders of water metabolism.
These processes are greatly effected by antidiuretic
hormone. It can be seen with Conn’s syndrome, which
is associated with the changes in aldosterone level.
When plasma density is lower 1056, this results in
blood pressure instability, hypodynamia, sometimes
convulsions.
29. Circulatory blood volume. The volume of circulatory blood is a genetic value and makes up 68-70
ml/kg for men and 65-69 ml/kg for women. The
changes of these values are attributed to water and
electrolyte imbalance, as well as to the diseases of intestinal tract and kidneys.
30. The minute volume of circulatory blood. This
is a value resulting from the functional state of organ-
106
106
ism, and is connected with respiratory rate and heart
rate. The average values, calculated for a person
weighing 70 kg, are 4-4.5 ml/min.
31. Oxygenation rate. It is a rate of oxidative processes, taking place in erythrocyte and in the cells. This
value is formed under the influence of lipid peroxidation, which defines permeability of cell membranes,
composed of lipoprotein complexes. Also, this value is
related to the state of liver, gastrointestinal tract, and
kidneys. The oxygenation rate is affected significantly
by the temporal relations of blood circulation in the
systemic and pulmonary circulation.
32. Surface of gaseous exchange. It is a erythrocyte respiratory surface, which averages 350000 cm2.43000 cm2. Value of the surface of gaseous exchange
varies with the corpuscular volume, age, weight and
sex.
33. Vital lung capacity. This is a value, representing
lung ability to receive blood circulation minute volume,
which defines alveolar surface area, participating in
respiration.
34. Transportation of oxygen. It is a value, depending on the functional and morphological state of systemic and pulmonary circulation, and first of all on:
lungs, heart, liver and gastrointestinal tract.
35. Quantity of consumed oxygen per 100 gram
brain tissue is associated with a complex cause, involved in the redox processes, lipid peroxidation reactions, and with a state of thyroid blood circulation regu-
107
107
lation. Thyroid blood circulation determines the transportation of oxygen and its consumption by inner organs due to the activation of thyroid hormones T3 and
T4. This index depends on the activation or inactivation of organ oxygen consumption. This value averages 2.5-3.5 ml/100 g tissue for adults and 3.5-6
ml/100 g tissue for children.
36. Arterial blood oxygenation is related to hemoglobin ability to bind oxygen and oxygenate tissues. To
a great extent, this process is affected by thyroxin.
Thyroxin splits oxidation and phosphorylation processes, reduces high energy phosphate bond formation
and increases development of heat, which dissipates
in the environment. Oxygenation curve is connected
with atmospheric pressure, blood pressure and active
site temperature.
37. Cardiac output is a part of minute volume of
blood, being pumped by heart as a result of heartbeat.
The cardiac output value is influenced by the intensity
of myocardial contractions, pressure in the pulmonary
circulation, de Ritis coefficient, aspartate transaminase
activity, and regulation state of the creatinine-kinin system.
38. Oxygen consumption per kilogram weight.
This dimension is attributed to the triiodothyronine activity. We can arrange organs, in descending order, in
respect of triiodothyronine influence on the oxygen
consumption per kilogram body weight as follows:
heart (10-11%), gastric mucosa, liver, smooth muscles: 4-5%, kidneys (1%), diaphragm (4%).
108
108
39. Pulmonary ventilation is a correlation between
entering air volume and exiting air volume per minute.
The pulmonary ventilation average depends on sex,
age and weight, and makes up 8 -10 l/min for a person
weighing 70 kg.
40. О2 consumption per minute is related with the
state of pulmonary circulation, systemic circulation,
liver, kidneys, and gastrointestinal tract. The triiodothyronine activity has primary meaning in the oxygen
consumption per minute.
41. Myocardial oxygen consumption is a value,
dependent on the functional state of organism. When
myocardial oxygen consumption increases, stomach,
liver and smooth muscles consume less oxygen, which
predetermines activation of the enzymes, creatinine
kinase in particular.
42. Deficit of circulatory blood is a depression in
the circulating blood volume per kilogram body weight
and circulatory minute volume expansion. Exposure to
the deficit of circulatory blood is attributed to the processes, regulating water-salt metabolism. It is understood that watersalt metabolism is influenced by the
thyroid hormones. Combined interactions between pituitary antidiuretic hormones, somatotropic hormone,
and kallikrein-kinin system are accompanied with
changes in the plasma density and urine specific gravity. As the difference between plasma specific gravity
and urine specific gravity is decreasing, we observe
drop in the colloid-oncotic pressure, resulting in the
rise of capillary hydrostatic pressure. The changes in
colloid-oncotic pressure and hydrostatic pressure
109
109
causes water outflow to the intercellular space and
depression in the circulatory minute volume, and so
rise of the deficit of circulatory blood.
43. Vital lung capacity in an expiration phase is a
lung volume after expiration. The more the lung volume in the expiration phase, the more the pulmonary
residual volume and the worse is the functional state
of lungs.
44. Maximum air flow is an expiratory air speed.
The reduction in air flow speed is of fundamental importance. The lower is the speed, the higher is pulmonary residual volume, i.e. there is decrease in the interrelations between alveolar volume and circulatory
blood volume. Generally, decrease of the air flow is an
evidence of the following diseases: bronchitis, pneumonias, lung neoplasms, abscesses.
45. Tiffeneau's test is a relation between time of the
pulmonary circulation and time of the systemic circulation. Tiffeneau's test defines elasticity of the cardiorespiratory system. The less is Tiffeneau's test, the higher
is a resistance of the pulmonary circulation. Decrease
in the Tiffeneau's test is accompanied with increase in
the minute pulmonary circulation and decrease in their
alveolar surface.
46. Fibrinogen. It belongs to the acute phase plasma
proteins and its level rises in all inflammatory and destructive processes. It participates in the blood-clotting
system. Its increase is supplemented with the increase
of y-globulins and hypoproteinemia.
110
110
47. Creatinine concentration. As to the nature of
formation, we distinguish between exogenous and endogenous creatine. Endogenous creatine is formed in
the process of tissue synthesis. Mainly, creatine synthesis occurs in the liver, wherefrom it is transported to
muscular tissue via bloodstream. Here, creatine adds
phosphorous group and turns into creatine phosphate,
and then the latter forms creatinine . The following
amino acids participate in the creatine synthesis: arginine, glycine and methionine. Such diseases as myasthenia, myatony and myositis are accompanied with
abnormal processes of creatine transformation to creatinine. Rise of the creatinine level in serum is seen with
kidney diseases. Constant rise of the creatinine level is
indicative of the disorders of renal filter. Doubling of
blood creatinine is parallel to the decrease in renal filtration by 50%.
48. Dopamine β-hydrolase. It is an enzyme, found
dissolved in lysosomes. Dopamine β-hydrolase activity
is attributed to pH optimum. If pH in the functioning cell
is normal, free amino groups of hydrolases in lysosomes form the ionic bonds with acid phosphate
groups of lipoprotein lysosomal matrix. These ionic
bonds determine hydrolase latency inside lysosomes.
Destructive processes in the tissue are connected with
the pH changes and activity of lysosomal hydrolases.
The idea is that their activity changes type of the cell
membrane construction. Dopamine β- hydroxylase
level decrease is accompanied with the development
of various asthenodepressive and asthenoneurotic
states.
111
111
49. Lactic acid. It is a final product of glycolysis and
glycogenolysis. The lactic acid concentration is related
with status of the blood circulation in muscles and
liver. It increases with muscular activity. Rise of the
lactic acid concentration can be seen with hypoxia
(cardiac, pulmonary insufficiency), anaemias, neoplasms, acute hepatitis, terminal hepatocirrhosis, toxicoses. Thus, increase in the lactic acid concentration
in blood is attributed to increase of its production in the
muscles, and to the decreased ability of liver to transform it to glucose and glycogen.
50. Urea. All parts of residual nitrogen represent final
products of protein metabolism. Concurrently, the main
final product of protein metabolism is a urea. Ammonia
is the primary source of urea formation. Urea level
shifts depend on the process of urea formation and its
excretion. These processes are interconnected with
metabolism of amino acids (arginine and glutamine).
The level of blood urea is decreased in hepatocirrhoses, acute yellow atrophy, phosphorous, arsenical and
other poisoning, affecting liver. In general, increase of
the urea concentration is accompanied with increase
of creatinine and filtration reduction.
51. Glucose is the most important blood component.
Its concentration reflects status of carbohydrate metabolism. Glucose is distributed, almost equally, between plasma and formed elements of blood. Blood
sugar concentration changes with age. Sugar concentration in newborns is the same as sugar concentration
in their mothers. After birth, sugar concentration is decreased rapidly and makes up 65 +-30 mg/%. By the
age of 5-6 days, glucose concentration reaches 75+-
112
112
20 mg/% (by the Hagedorn-Jensen method). The level
of glucose is regulated by central nervous system. Exogenous glucose is processed in the digestive tract
and transported to the liver. Amino acids, glycerin, and
lactic acid participate in the glucose formation. Sequence of the glucose formation processes ensures
glycogenesis, resulting in the formation of liver glycogen. Later on, liver glycogen undergoes changes in
the so called glucose blood pool: glycolysis, glycogenesis, and aerobic decomposition, resulting in the
formation of СО2 и Н2О. Lipogenesis, supporting lipid
synthesis in the tissues, biosynthesis of the substituted
acids and protein synthesis. The changes in sugar
level may be considered as a result of excitation of the
metabolic centers by pulses of the energy-starved
chemoreceptor cells. The liver ensures maintenance of
the constant blood sugar level. Its spare capacities in
this regard are ensured by the interaction of somatotropic hormone, insulin and glucogon. Synchronism in
working of this system is ensured by the regulation of
glucose consumption through lipid oxidation and enhanced intake of glucose in the intestine with the help
of thyrotrophic hormones, thyroxin, and adrenocorticotropin.
52. Triglycerides (TG) belong to the energetic substrates. TG are important constituent of food, used to
recover metabolic consumed energy. An adult organism receives 60-80 g fats (TG), 85% of which being
split in the gastrointestinal tract (pH~5). TG splitting in
the stomach leads to the formation of free fatty acids,
which are released to the intestine, where, under the
influence of steapsin, fatty acids (TG) split to
monoglycerides. This process is regulated by entero-
113
113
statin ("gastrointestinal hormone"), initiating a sensation of fullness during food intake and digestion.
Fatty acid oxidation:
53. Cholesterol. Conditionally, we can distinguish
three cholesterol pools in a human organism: pool A –
rapidly exchanging (ca. 30 g FC (free cholesterol)),
pool B - slowly exchanging (ca. 500 g FC) and very
slowly exchanging (ca. 50 g FC). Experimental data
showed that 6 mg cholesterol accounts for 1 g body
weight. Major portion of nonestherificated cholesterol
(NEFC) occurs in cell membranes and myelin
sheathes, containing phospholipids. In plasma membrane, molar correlation of NEFC with phospholipids is
equal to 1. Cholesterol synthesis occurs in almost all
cells and tissues, however it is produced considerably
in the liver – 80%, and in the small intestine walls –
5%. As a first approximation, cholesterol biosynthesis
can be divided into three stages:
1. Mevalonic acid biosynthesis.
2. Squalen formation from mevalonic acid.
3. Squalen cyclization and cholesterol formation.
The main source of mevalonic acid formation in the
liver is acetyl coenzyme A, and in the muscular tissue,
it is lycine. Cholesterol oxidation to bile acids in the
liver hepatocytes is main way of the metabolic elimination of this hydrophobic compound from organism, and
bile acids themselves can be considered as a final
product of the cholesterol catabolism. In addition, great
role is played by taurocholic and glycocholic acids,
which are involved in the pH regulation. The enzymes
114
114
of large intestine microflora affect formation of the sterols, not containing carboxylic groups.
54,55. Lipoproteins. Lipoproteins, rich in triglycerides – chylomicrons (CM), and very low-density lipoproteins (VLDLP). CM are formed in the process of edible fat absorption and serve to transport exogenous
TG to the sites of utilization (cardiac and skeletal muscles, mammary glands etc.) and depositing (adipose
tissue). Apoproteins of all major groups are found in
the CM protein part.
56. VLDLP. They represent a transport form of the
endogenous TG. The protein concentration in VLDLP
is higher than in CM. Lipid and protein compositions of
VLDLP are subject to the significant quantitative
changes more, than in any other LP class. Main proteins of VLDLP are apo В-100 and apoproteins of C
group. Usually, VLDLP lipids are isotropic liquids, and
they are adequately mobile, which is identified by the
constant lateral moving inside one particle and between particles. Practically, all TG in the nucleus of
LP-particle are liquid at 37°С . VLDLP are formed in
the liver, in endoplasmic reticulum ribosomes of hepatocytes. Latest data showed that VLDLP assembly is
greatly influenced by microsomal TG-carrying protein.
57. In bloodstream, CM and VLDLP make contact
with the lipid components of membranes of red cells,
weight cells, endotheliocytes and other cells. These
contacts are exposed to the lipolytic enzymes. This
exposure leads to the delipidization and partial deproteinization. It is illustratory, that, after being formed,
remnant particles of CM and VLDLP continue enrich-
115
115
ing itself in apo-E through its transition from VLDLP.
58. Rich in cholesterol VLDLP. Protein component is
presented by apoproteins В, С, Е. Approximately ¾ of
total protein of these LP accounts for apo-B. In a certain manner, molecular and immunochemical heterogeneity of VLDLP is connected with atherogenesis and
can serve as a additional criterion of its evaluation.
Carbon dioxide transportation and consumption:
59. СО2 release is indissolubly related to the oxygen
consumption and СО2 generation in organism. СО2 is
generated in organism as a result of biochemical
transformations of glucose, amino acids, fats in the liver and blood under the influence of enzymes. Since
glucose is one of the main oxygen source for a cell, its
level is connected with СО2 generation and release in
organism. Under the influence of glucose oxydase,
glucose is oxidized by air oxygen to gluconic acid, and
hydrogen peroxide in equimolecular quantities is
formed. In this relation, СО2 generation rate must be
lower than СО2 release rate, and total venous blood
CO2 must be higher than total arterial blood CO2.
62. СО2 generation rate is a biochemical process,
related to metabolism and oxygen consumption by organism. CO2 generation rate is greatly influenced by
pH environment and lactate indices.
63-69. Internal organ bloodstream in ratio to general bloodstream. Whole bloodstream (MCV), taken
for 100%, is distributed among organs. Average data
are taken from V.P. Osipov's monograph “Principles of
Cardiopulmonary Bypass” (1976); V.A> Berezovskiy's
116
116
“Oxygen Tension in Human and Animal Tissues”
(1975), C. Caro’s “The Mechanics of the Circulation”
(translated from English) (1981), V.P. Parins’s “The
Physiology of Circulation”. Important indices are cardiac and cerebral blood flow. When cardiac blood flow
decreases below 4%, various variants of cardiac circulatory insufficiencies are observed. When cerebral
blood flow decreases below 13%, various clinical variants of cerebral circulatory disorders can be seen.
70-76. Internal organ bloodstream in ml/min.
Bloodstream of inner organs in percentage terms was
recalculated as to the general blood flow in ml/min.
The data used were the same, as taken from V.P.
Osipov's monograph “Principles of cardiopulmonary
bypass” (1976); V.A> Berezovskiy's “Oxygen tension
in human and animal tissues” (1975), C. Caro’s “The
Mechanics of the Circulation” (translated from English)
(1981), V.P. Parins’s “The Physiology of Circulation”.
In assessing the bloodstream of inner organs, it is
necessary to analyze level of the myocardial and
cerebral oxygen consumption.
77. Acetylcholine. As to Pokrovskiy's data, there are
more than 100 methods of chemical cholinicity determination in various blood activities. Choline esterase
activity is attributed to acetylcholine with pH environment value. pH value has an impact on delivery of
acetic acid, and this reactions continues until environment pH achiebed defined level. Choline esterase activity varies widely. Distinctive decrease of choline esterase is seen with hepatic diseases, hypothyroidism,
bronchial asthma, and rheumatoid arthritis.
117
117
79-81. Cardiomechanics intervals. Cardiac beat
cycle begins in certain area, in the right atrium wall,
called “pacemaker”. Muscle cells in this area are specific: they are able to polarize and re-polarize from
time to time. Having begun in the pacemaker, depolarization travels, at a speed of 1 m/s, to neighboring
walls of right and left atriums, causing their contractions. Then, depolarization acts on muscle bundle (His
band), which passes through fibrous tissue, surrounding tricuspid valve, to interventricular septum. Depolarization wave is quickly propagated in this pathway at
a speed 5 m/s. Ventricular depolarization potential on
ECG (QRS complex) lasts less than 0.1 s. Depolarization and repolarization cycles generate weak electric
potentials. Atrial depolarization results in small deviation, called P wave, 0.2 s delayed. This wave is followed by the sharper potential oscillation, known as
QRS complex. It reflects the depolarization of both
ventricles. After that, another component, T wave, appears. Temporal relations between these total mechanic events are accompanied with the changes of
pressure in left atrium, left ventricle and aorta, as well
as blood flow in aorta during full cardiac cycle.
82. Left ventricle contractions. In ECG, beginning
of the left ventricle contraction is signalized by QRS
complex. At very short interval, after depolarization,
muscle fibers, ventricular walls begin developing active
tension, where contractile elements of myocardial
cells, known as myofibrils, participate. Myofibrils consist of bundles of filaments, which, in turn, form repeating chains, sarcomeres. Because of their contraction,
pressure in the left ventricle starts rising. At this stage,
aortic valve is still closed, since aortic pressure higher
118
118
than pressure in the left ventricles, and mitral valves
come closer as the blood flow from atrium to ventricle
decreases. This status is of short duration, since ventricular pressure promptly exceeds atrial pressure.
This periods ends with mitral valve closure. Ventricular
wall tension starts growing very fast, and continues
growing until ventricular pressure exceeds aortal pressure. Once ventricular pressure is higher than aortal
one, a system of forces occurs, which opens aortal
valve. Blood percentage, driven out of the heart during
blood expulsion, is characterized by the left ventricle
contraction capacity. Cardiac output is a part of minute
volume of blood, being pumped by heart as a result of
heartbeat. The cardiac output value is influenced by
the intensity of myocardial contractions, pressure in
the pulmonary circulation, de Ritis coefficient, aspartate transaminase activity, and triiodothyronine and
tetraiodothyronine activity.
83,84. Arterial pressure. Speaking of blood pressure, we always mean pressure, measured relative to
the atmospheric pressure. Usually, it is taken that
pressure in the body tissues directly near outer arterial
walls is equal to the atmospheric pressure, so blood
pressure is considered as transmural pressure (transmural pressure represents difference between inner
(ip) and outer (op) pressures, where ip is a pressure
inside artery, and op is an outer pressure, equal to the
atmospheric pressure). Arterial pressure generation is
controlled by rennin-angiotensin system and kinins
(bradykinin), hormones of adrenal zona glomerulosa
layer, participating in the regulation of sodium and potassium electrolyte metabolism. The main hormone,
regulating mineral sodium and potassium metabolism,
119
119
is aldosterone. In addition, arterial pressure generation
is influenced by hormones of adrenal medulla (adrenalin, noradrenalin and dopamine), which regulate cardiac tone and lumen.
85. Pressure in pulmonary circulation. Pulmonary
circulation is a low-pressure system: in a healthy man.
Average pressure (i.e. pressure over the atmospheric
one) in the right ventricle and in major pulmonary arteries makes up approx. 15 mm Hg or 130-140 mm
CE. Issue of the pressure generation is connected with
blood volume, flowing in the vessels of pulmonary circulation. In healthy man, this value makes up 0.5 l or
10% of circulating blood volume. Veins of pulmonary
circulation contain nearly half of blood volume, flowing
in the pulmonary circulation. Healthy test subjects
showed increase in the oxygen consumption during
muscle work. Pulmonary artery pressure rose, on the
average, from 13.9 mm Hg to 17.3 mm Hg. Blood volume in the pulmonary circulation capillaries is influenced by lung volume, defined as a ratio between 30
and 33 indices.
86. In norm, width of third ventricle is 4.5 – 6 mm.
The size of third ventricle is greatly influenced by a
number of factors, participating in the regulation and
distribution of water metabolism in the body. We can
distinguish 5 factors, which define the flow of body liquids between various spaces:
1. Osmotic pressure, related to the difference between concentrations of substances, dissolved in liquids, which are separated by semiimpermeable membrane.
120
120
2. Factor, influencing the flow of liquids, i.e. hydrostatic pressure, occurring in lumen being subject to the
heart force. The balance between hydrostatic, hydrodynamic and oncotic pressures defines the flow of liquids from vessels to tissues and visa versa.
3. Permeability of cell and vascular walls, and other
membranes. It is connected with certain biochemical
processes.
4. Active biological mechanism of ion migration, The
systems of active transport maintain transport of substances against their concentration gradient with the
consumption of macroergic phosphate energy.
5. Active regulatory mechanisms, which define the
level of water and sodium loss in such nodes, as the
points of contacts between internal and external environment of the organism. First of all, these are renal
regulating mechanism, pituitary antidiuretic hormone
and aldosterone.
89. Systemic circulation time is a time of a full and
complete cycle of blood flow through the systemic circle vessels, related to five factors of the regulation of
blood circulation in inner organs. These factors are indissolubly related to the regulation of water-electrolytic
metabolism.
91. Spectral wavelength of СО2 absorption in the
blood. This index characterizes hypocapnia and hypercapnia.
92. Spectral wavelength of N2O absorption. This
index characterizes nitrogen metabolism in the body.
When it is lowered, the destructive processes can be
often observed. When assessing this index, it is nec-
121
121
essary to analyze blood circulation in the inner organs
and creatinine kinase activity. Special attention need
to be paid to the medical history taking.
93. Н2 concentration in gastric juice. The number
of hydrogen protons is related to the whole complex of
biochemical transformations. First of all, they are related to the interactions between gastrointestinal hormones (GIH), glucagon, vasoactive intestinal polypeptide (VIP), and gastroinhibiting intestinal polypeptide.
The interaction of these hormones defines active sodium participation, the latter being main plasma cation,
influencing venous pressure. Rise in venous blood
pressure causes hydrostatic pressure to increase.
When hydrostatic pressure is higher than oncotic
pressure, this can cause electrolytes out of intercellular space. This phenomenon leads to hypovolemia and
activation of the juxtaglomerular apparatus of kidneys.
This results in stimulation of the adrenal cortex and
increase in aldosterone secretion. In a whole, these
factor combinations give rise to the changes in pH environment and organotrophic disorder.
94. Blood pH is a concentration of hydrogen protons,
participating in the tissue respiration, under which mitochondria supply required energy, in the form of macroergic phosphates. it is necessary to supply oxygen
and to release carbon dioxide. The oxygen is supplied
to the cell with blood flow, likewise carbon dioxide is
released from the cell. Blood is a part of body internal
environment with well-defined concentration of the
transported substances. Hydrogen ion concentration is
a very important constant, defining full value of the
metabolic transformation in cell, which determines
122
122
body need in working systems aimed at supporting
constant hydrogen ion concentration by the excretion
of redundant hydrogen ions or their retention in case of
deficit. This mechanism is supported by buffer systems. The most powerful blood buffer is proteins, hemoglobin in particular. Hydrogen ion concentration is
regulated by bicarbonate buffer, consisting of carbon
dioxide and sodium bicarbonate. Another buffer is a
phosphate one. Mono-substituted phosphate serves
as an acid, and twice-substituted phosphate serves as
a salt. Phosphate buffer is closely related to bicarbonate and protein buffer systems, with kidneys supporting decrease or increase of bicarbonate level when pH
changes. The main mechanism of supporting concentration of hydrogen ions, represented in renal tubule
cells, is a process of sodium reabsorption and hydrogen ion secretion.
97. Glutamic acid is an amino acid, which regulates
metabolic processes and affects ion concentration
(sodium, potassium etc.). Required sodium ion concentration in the body is supported by formation of
ammonia in the kidneys and its use for neutralizing acid equivalents and their renal excretion. Resulting free
ammonia easily penetrates into renal tubular lumen,
where being combined with hydrogen ion, it turns into
poorly diffusing ammonia ion. In the conditions,
accompanied with glutamic acid deficit, compensatory
mechanisms are not able to prevent shifts in the hydrogen ion concentration, which leads to the acid-base
imbalance. The reasons can be as follows: decrease
of respiratory minute volume, circulatory inefficiency,
pulmonary sarcoidosis, rheumatoid arthritis, acute
123
123
pneumonia. All these pathological states are accompanied with glutamic acid deficit.
98. Tyrosine acid is a regulatory amino acid, being
constituent of the thyroid hormones. Thyroxin and
triiodothyronine are iodated tyrosine derivatives..
Blood iodine is captured by thyroid tissue by means of
the active concentration mechanism. In the thyroidal
tissue, iodine is peroxidase oxidized to form monoiodtyrosine. As a result of tyrosine iodination in fifth residue, diiodtyrosyne is formed. Monoiodtyrosine conmination results in triiodothyronine (T3). Complexation of
two diiodtyrosyne molecules leads to the thyroxin formation (T4). Thyroid hormones are of significant importance for the processes of growth, development
and pubescence. They raise energy consumption in
tissues, protein synthesis and glycometabolism, and
affect lipid metabolism.
99. Creatinine kinase in muscles. Creatinine kinase
catalyzes reverse reaction of phosphoryl residue
transport from ATP to creatine from creatinine phosphate to ADP. Creatinine phosphokinase acts in a dual
manner in the muscular tissue: in sarcoplasm, enzyme
transports phosphoryl group from ATP to creatine; resulting creatinine phosphate is used for phosphorylirazing ADP, which is combined with myosin in
myofibrils. This system, along with sodium and potassium and stimulated ATPase, participates in energy
supply to the active ion transportation through cell
membranes.
124
124
100. Creatinine kinase in heart is divided in three
types:
1. Isoenzyme 1-ВВ (characterized by high mobility,
attributed to the temperature changes, mainly in the
abdominal region).
2. Isoenzyme 111-ММ (moves at a lower speed)
3. Isoenzyme 11-МВ (in-between position as to mobility).
Heart contains mainly MM and MB forms. It is assumed that energy of the transport from mitochondrion
to cytoplasm of myocardial cell is transferred through
the internal mitochondrial membrane. In intermembranous space (Mg2+ occurrence), a balance is being established between ATP - Mg2+ and CFK*ATP - Mg2+
complex at the outer side of internal membrane. A
considerable increase of CFK is seen with musculoskeletal disorder and in acute myocardial infarction.
Thus, CFK activity increases earlier than activity of
other enzymes. High CFK activity is observed in various central nervous system diseases: schizophrenia,
manic-depressive psychosis, syndromes, induced by
psychotropic agents.
101. Glycogen is a reserve energetic substrate.
Conditions for accumulation of some reserve carbohydrates are created due to its ability to deposit in the
liver and muscles. When energy consumption increases, glycogen usually decomposes. Thus, this
process is accompanied with the increase of function
of some endocrine glands (thyroid, adrenal medulla,
hypophysis), secreting hormones, which activate glycogen decomposition. Due to glucose formation, glucocorticoids prevent hepatic glycogen from being destroyed. Thyroid hormone, thyroxin, facilitates glucose
125
125
absorption in the intestine. Blood glycogen concentration increases in hepatolienal syndromes, diabetes,
malignant growths. Hereditary diseases with glycogen
metabolism disorders hold a special position.
102. Used power of life support. Average power,
used for life support, is 2300 kcal per 24 hours for
man, weighing 70 kg. Used power of life support is ensured by the changes of free energy with complete
combustion of 1 mole palmitic acid making up 2338
kcal. High-energy phosphate bond is characterized by
value 7.6 kcal/mole. Thus, with total oxidation of one
palmitic acid molecule, it makes up 130 ATP molecules. Being recalculated to kilogram, this value
changes from 1 to 20 kcal/kg/min and more. It is related to arterial blood oxygenation and hemoglobin
ability to bind oxygen and oxygenate tissues. To a
great extent, this process is affected by thyroxin. Thyroxin splits oxidation and phosphorylation processes,
reduces high energy phosphate bond formation and
increases development of heat, which dissipates in the
environment. Thus, oxygen consumption changes to
kg. This dimension is attributed to the triiodothyronine
activity. We can arrange organs, in descending order,
in respect of triiodothyronine influence on the oxygen
consumption as follows: heart, gastric mucosa, liver,
smooth muscles, kidneys, and diaphragm.
103. Working level of oxygen consumption. It is
related to arterial blood oxygenation and hemoglobin
ability to bind oxygen and oxygenate tissues. To a
great extent, this process is affected by thyroxin. Thyroxin splits oxidation and phosphorylation processes,
reduces high energy phosphate bond formation and
126
126
increases development of heat, which dissipates in the
environment. Thus, oxygen consumption changes to
kg. This dimension is attributed to the triiodothyronine
activity. We can arrange organs, in descending order,
in respect of triiodothyronine influence on the oxygen
consumption as follows: heart, gastric mucosa, liver,
smooth muscles, kidneys, and diaphragm, i.e. with
triiodothyronine activity increasing, activity of the oxygen consumption by heart and other inner organs increases as well. If oxygen consumption by heart increases, oxygen consumption by gastric mucosa, liver
and diaphragm changes (decreases) as well. This results in the deficit of used power for life support.
104. One-time load time. We mean physical activity,
done by man, taking into account kcal consumption
and their recovery in a certain period of time. It is connected with energy storage efficiency due to the fatty
acid oxidation, and makes up 40%, which is close to
relevant glycolysis, tricarboxylic acid cycle and oxidative phosphorylation. One of the fatty acid oxidation
products is hydrogen peroxide, with active electrons
transported directly to oxygen. This reaction is related
to hemoglobin ability to bind oxygen and oxygenate
tissues. To a great extent, this process is affected by
thyroxin. Thyroxin splits oxidation and phosphorylation
processes, reduces high energy phosphate bond formation and increases development of heat, which dissipates in the environment. Thus, oxygen consumption
changes per body weight unit. Thus, one-time load
time will depend on the splitting of fatty acids, being of
chain nature and connected with the blood circulation
in inner organs.
127
127
105. Respiratory coefficient is defined by the interaction between oxidative processes and processes,
involved in lipid peroxidation. Great importance is attached to the platelet-activating factor, which leads to
the aggregation of these cells, with serotonin being released. The latter is a vasoconstrictive agent and a
stimulator of unstriated muscle contractions. In this
connection, platelet-activating factor affects white
blood cells, thus stimulating chemotaxis, degranulation
and aggregation of polymorphonuclear leukocytes with
them producing superactive radicals. Plateletactivating factor represents a phospholipid bioregulator
and is associated with lipoproteins and high-density
lipoproteins. Thus, respiratory coefficient is determined
by a combination of biochemical processes, set forth in
clauses 102-103 above.
106. Tyrosine. Thyroid hormones, thyroxin and triiodothyronine, are iodated tyrosine derivatives. Tyrosine
is present in food and in the body in high volume. Due
to the influence of pituitary thyrotrophic hormone on
thyroid, proteolytic enzyme are activated, which release thyroxin and triiodothyronine form the bond with
thyreoglobulin molecules. The primary points of thyroxin application in tissues are cytomembranes, nuclei,
and enzymes of the biological oxidation system. Thyroxin increases generation of heat, which dissipates in
the environment. Triiodothyronine increases oxygen
consumption by the tissues, heart in particular. Concurrently, there is a change in heat generation degree,
which is defined by catecholamine deficiency.
128
128
107. Cerebral blood flow. Regulation of the cerebral
blood flow per 100 g tissue is determined by the interaction of extra- and intracranial factors. Among extracranial factors are atmospheric pressure, gas
composition of air, partial gas pressure in the atmosphere, wavelength of Хе86. These factors affect
chemoreceptors, baroreceptors, photoreceptors, pressure receptors, thus ensuring sufficient cerebral blood
flow per 100 g tissue. It is understood that one of important indices of cerebral blood flow is a width of third
ventricle. Normally, it is 4.5 – 6 mm. The size of third
ventricle is greatly influenced by a number of factors,
involved in the regulation and distribution of water metabolism in the body. Adrenal medulla hormones,
adrenalin, noradrenalin and dopamine, are of significant importance. They can be treated as successive
links of amino acid, phenylalanine and tyrosine transformations. Due to the influence of pituitary thyrotrophic hormone on thyroid, proteolytic enzyme are activated, which release thyroxin and triiodothyronine form
the bond with thyreoglobulin molecules. The primary
points of thyroxin application in tissues are cytomembranes, nuclei, and enzymes of the biological oxidation
system. Thyroxin increases generation of heat, which
dissipates in the environment. Triiodothyronine increases oxygen consumption by the tissues, heart in
particular. Concurrently, there is a change in heat
generation degree, which is defined by catecholamine
deficiency. Generally, catecholamines are considered
to be humoral regulatory agents of sympathoadrenal
system. The biological effect of the latter is the release
of energy (stimulation of glycogenolysis, lipolysis, oxidative processes). Catecholamines activate nervous
system, changing heart rate, and increase peripheral
129
129
circulation in some vascular regions. The combination
of these effects exercises a mobilizing and regulatory
influence on human organism, vegetometabolically
ensuring body adjustment to conations by changing
the blood flow in inner organs and optimizing cerebral
blood flow.
108. Testosterone belongs to sex steroids, which influence secondary sexual characters development,
pubescence, and sexual function.
109. Estrogen belongs to sex steroids, which influence secondary sexual characters development. Functional activity of these hormones is realized through
hypothalamic factors, somatotropic hormone secretion
in particular. Its structure reminds of prolactin and placental hormone chorionic somatomammotrophin,
which defines closeness of the biological activity. In
this relation, testosterone, estrogens and thyroxin stimulate somatotropic hormone secretion, and with
hypercorticonemia, they suppress it.
110,111,112. Water-salt metabolism, water distribution in the body. Water, among other components
of human body, plays the most important role, being
solvent both for organic and nonorganic substances,
and represents a base for body internal environment.
Most part of water is included as a compound to intracellular fluids. Extracellular water, in its turn, is a part
of intercellular and intravascular fluids. As to Bland’s
data, water distribution in a body, in percentage from
body weight and in absolute values, makes up: total
body water in women 44-60%, or 38.5 l, in men - 5070%, or 42 l. Intercellular water: women - 30-45%, or
130
130
28.5 l. Men - 35-50%, or 31.5 l. Extracellular water:
women - 14-22%, or 9.8 l. Men - 15-22%, or 10.5 l. Intracellular water: women - 10-15%, or 7 l. Men - 1018%, or 7.4 l. Plasma: for women – 4-5%, or 2.8 l. Men
- 3.5-4.5%, or 3.2 l.
113,114. Blood flow per 1 gr.of brain tissue and
blood flow per 1 gr.of thyroid gland ensures metabolism and energy consumption through water distribution in the body: metabolic free fraction and fraction,
bound in the colloid systems with the molecules of organic substances. Per 1 g glycogen and protein, deposited in the tissues, 1.5 and 3 ml water are held respectively. As a result of catabolism in human body,
300-400 ml water is produced daily. Quantity of water
determines the nature of decomposing substrates.
With 100 g fat being oxidized, 107 ml water is produced, with 100 g protein – 41 ml water, with 100 carbohydrates – 55 ml water. All body water is renewed in
4 weeks. Whole system of the metabolism regulation
is determined by the blood flow per 1 f brain tissue and
blood flow per 1 g thyroid gland.
115. Tissue oxygen extraction index is interrelated
to the cell membrane permeability, where cholesterol
and phospholipids are of great importance. By hypothesis for the nature of bonds, involved in the interaction of phospholipids polar sites and cholesterol,
cholesterol hydroxyl and ethereal oxygen become hydrogen bonded. At a phase transition temperature,
phospholipids pass from a solid gel to a liquidcrystal
state. Molecular nature of phase transition is attributed
to the changes of average speed of oxygen supply,
depending in the temperature. In special literature,
131
131
131
when assessing cholesterol role in the membrane
structure and function it is considered that cholesterol
facilitates decrease in mobility of fatty acid chains at
high temperatures and increase in mobility at low temperatures.
116. Oddi’s sphincter basal pressure determines
hemodynamic effect, ensuring resynthesis of the intestinal wall lipids. According to the present-day ideas,
triglyceride resynthesis occurs in the epithelial cells of
small intestine villi. Triglycerides are the most highcalorie substances. At their complete oxidation, energy
output makes up 9.5 kcal. Quantity of energy, stored in
1 g such free-of-liquid fat, as triglycerides, is six times
as large as quantity of energy, stored in 1 g glycogen.
In other words, if calories were deposited in human
body in the form of glycogens, than in order to accumulate 128000 kcal one may rather need 13.5 g
triglycerides than 80 kg glycogens. It is Oddi’s sphincter basal pressure that provides daily caloric requirement of man through switching and regulation of fat
and carbohydrate metabolism.
117. Prothrombin index is connected with plateletactivating factor. The latter belongs to the lipid bioregulators. Their action is based on the platelet activation with serotonin being released. The latter is a vasoconstrictive agent and a stimulator of unstriated
muscle contractions. Conditions for thrombosis are
provided due to the platelet aggregation and arteriostenosis. In this regard, main biological mechanisms
are chemotaxis stimulation, olymorphonuclear leukocytes aggregation with the latter producing superoxide
radicals.
132
27. Certificate


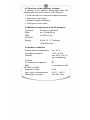
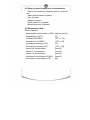
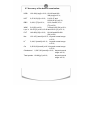
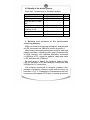


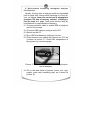


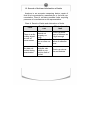
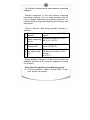
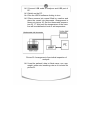


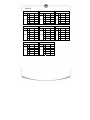


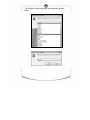


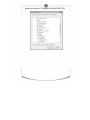


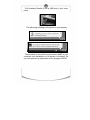
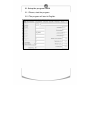


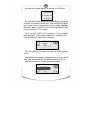


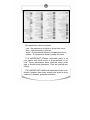

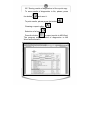

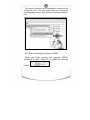


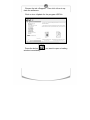
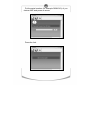
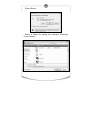


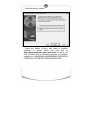
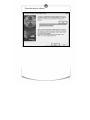
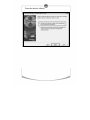
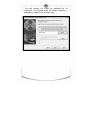
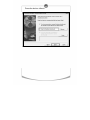
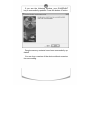
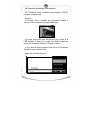


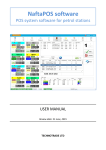


![TEMPLATE No1 [CPMP positive opinion full application]](http://vs1.manualzilla.com/store/data/005681628_1-1a3acb54fcca990dd8c826546eb4788f-150x150.png)