1
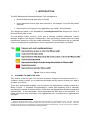
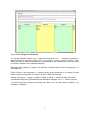
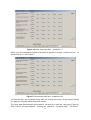
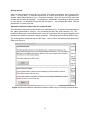
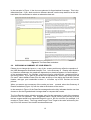
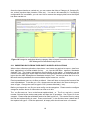
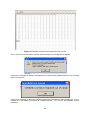
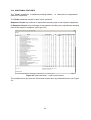
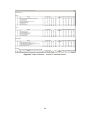
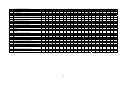
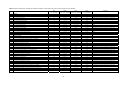
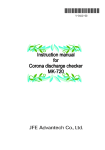
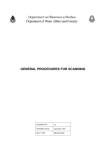
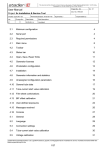
HSE
Management standards
Analysis tool.153
User manual
CONTENTS
1
2
3
4
5
6
7
Introduction
1.1 Changes to analysis tool
Using the Analysis Tool
2.1
2.2
2.3
2.4
2.5
2.6
2.7
2.8
2.9
2
2
4
Launching the spreadsheet
4
Checking for old or unwanted records
5
Catergories
6
Entering your questionnaire scores
8
Selecting data sets
12
Obtaining a summary of your results
13
Examining results for different categories of staff
15
Saving results for different groups of staff
17
Importing data from other versions of the HSE Management Standards
Analysis Tool
17
2.10 Importing data from older versions of the HSE Management Standards
Analysis Tool
18
2.11 Importing data from third party survey applications
19
2.12 Additional features
22
Interpretation of Results
Contact HSE
Appendix A – Question & Answer
Appendix B – Technical Information and Porcedures Used in the Calculation of
Current Performance and Targets
6.1 Organisational data set
6.2 2004 Survey data set
Acknowledgements
24
26
27
28
28
29
36
1 INTRODUCTION
The HSE Management Standards Analysis Tool is designed to:
•
Accommodate manual data entry of records
•
Import electronic records from other versions of the Analysis Tool (inclu ding earlier
versions)
•
Import data from 3rd party survey applications e.g. SNAP, Survey Monkey
The analysis tool utilise s one spreadsheet, msanalysistool153.xls designed for users of
Microsoft Excel 2000 or later.
The tool assigns colour codes to seven sets of working conditions (Demands, Control,
Manager Support, Peer Support, Relationship s, Role and change), with the colour d enoting
performance relative to a user sele ctable benchmark. The tool determines the ap propriate
colour by comparing the organisation’s survey responses to a benchmark, as follows:
Figure 1 Key to colour coding
1.1
CHANGES TO ANALYSIS TOOL
This version of the Ana lysis Tool contains important changes from previous versions. It
contains a facility to allow you to select the benchmark survey data wi th which you wish to
compare your scores.
There are 2 benchmarks available. One is based on the psychosocia l working conditions in
Britain in 2 004. It compares the organisatio n’s results with responses from a nationally
representative sample of workers taken in 2004 when the Management Standards approach
was launched1. A new benchmark, which supersedes the 2004 data, is also availa ble. It is
based on surveys cond ucted within 136 organisations and is constitut ed of ‘organisational
averages’.
1
Health an d Safety Executive (2004). Ps ychosocial Working C onditions in Gre at Britain in 2 004. This was a nationally
representative household survey of appro ximately 1800 current workers conducted in March and April of 2004. The survey
included the 35 question items representing the 6 Stress Management Standards areas. The full survey report is available on
the HSE website at www.hse.gov.uk/statistics/causdis/pwc2004.pdf.
2
The reasons for this change are outlined in the box below.
IMPORTANT CHANGES TO THE HSE MANAGEMENT STANDARDS ANALYSIS TOOL
When the HSE Manage ment Standards Analysis Tool was first designed in 2004, t he only
data available to HSE for deriving the benchmarks was from a national survey of individuals,
since no organisations had yet administered the full survey to their employees.
However, it is important for organisations to be able to compare their average results with
the average results fro m other organisations, r ather than with responses from a survey of
individuals.
HSE has now gathered data from 136 organisations that have completed the survey using
the HSE Indicator Tool. This has been used to generate the new organisational benchmark.
HSE recommends that the new benchmark, based on organisational data, should be used in
the majority of ca ses. However, if you have completed a previous analysis exercise using
the 2004 benchmark, and wish to make comparisons between your t wo surveys, you may
wish to use again the same benchmark, to a ssess progress. See Appendix one for more
information.
3
2 USING THE ANALYSIS TOOL
The following sections of the HSE Manage ment Standards Analysis Tool Use r Manual
describe the content of the analysis tool in more detail. When using
the Analysis Tool ,
please do not change the names of any of the worksheets, as this will affect the operation of
the Analysis Tool.
2.1
LAUNCHING THE SPREADSHEET
To make t he HSE Management Standards Analys is Tool work, save a copy to your
computer. You can save a copy of t he HSE Analysis Tool to your computer by first clicking
on the highlighted link (to highlight hover your mouse over the analysis tool text, when the
text turns gr een it is hig hlighted) with the right hand button of your mouse. From t he drop
down menu select " save target as" ; now follo w the instru ctions on screen and select a
location on your computer our network drive to save the file.
Launch the spreadsheet and sele ct Enable Macros. If the Enter Questionnaire Score
s
worksheet is empty, you should verify that your security settings will allow macros to be run.
To do this you should go to the Tools menu and select Macro. Then select Security. Ensure
that security is set to either ‘Medium’ or ‘Low’ You should check with your organ isations
security policy or IT de partment before changi ng your security setting s. You can restore
security settings when you have finished using the HSE Management Standards Analysis
Tool. We recommend that you restore the original setting as soon as you have finished
using the application.
At the bottom of the first screen you will see a series of tabs (see
Figure 2). Clicking on the tabs allows you to move to different worksheets. Please read the
‘before you start’ tab for more information about the other tabs.
4
Figure 2 HSE Management Standards Analysis Tool first screen
2.2
CHECKING FOR OLD OR UNWANTED RECORDS
Warning! Please do n ot delete an y unused columns, as this will cause errors wi thin the
spreadsheet.
Before you begin to enter your questionnaire scores for the first time, it is advisable to check
that the spreadsheet does not contain any old or unwant
ed records. You can delete a
record or a series of records in the f ollowing way. Select the Raw Data worksheet from the
tabs at the bottom of the screen and then select the records you wish t o delete by clicking
and dragging on the Row heading numbers (the numbers in the extreme left hand column) of
the records you wish to delete. This will highlight the rows you wish to delete (see Figure 3).
Then select Delete from the Edit menu to delete the rows you have selected. If the records
that you have deleted are the last re cords in the Raw Data worksheet, then the New Record
Number will be updated on the Enter Questionnaire Scores worksheet.
If the records you have deleted come from earlier in the series, you can use Excel’s Series
Fill feature to revise the record numbers found in the Record Number Column (A) of the Raw
Data worksheet. In Excel, the Se ries Fill feat ure can be accessed by selecting the Edit
menu, then selecting Fill >, Series.
5
Figure 3 Highlighting row heading numbers for deleting
2.3
CATERGORIES
The Categories tab allows you to set up the analysis tool to enter results for different groups
of staff. Yo u can use this to set up your o wn choice of group identifie rs in each of up to
twelve categories. List ing categories here will make them available to you when you move
to the next worksheet to enter your questionnaire scores. Please note that if you wish to use
the Categories facility you must do this before entering any results. Your organisati on may
have been categorise d into diffe rent groups of employees, e.g. b y ‘location’, ‘role’ or
‘Department’.
Select the Categories worksheet from the tabs at the bottom of the screen (see Figure 4).
6
Figure 4 The Categories worksheet
The special identifier <None> mus t appear as the first item in a
category list and mus t
appear exactly as it appears in Figu re 3 (i.e., as ‘<None>’, not as ‘<none>’ or ‘None’). This
allows the user to record instances when respondents to th e questionnaire may have failed
to provide a selection for a particular category.
Beginning with Category A, replace the identifier ‘Untitled’ with the tit le of the category. In
the example in
Figure 2 ab ove, the coordinator, or person sett ing up the categories, h as chosen t o enter
results using the categories of Location, Grade of Staff, Sex and Age.
Please note that a c ategory entitled Untitled, or whos e title is left blank, will not be
considered configured by the Management Standards Analysis Tool, i.e., it will be ignored.
To enter items in the c ategory list, simply t ype them in as you wish them to app ear, e.g.,
‘Swansea’, ‘Glasgow’.
7
2.4
ENTERING YOUR QUESTIONNAIRE SCORES
Select the Enter Questionnaire Scores workshe et from the tabs at the b ottom of the screen.
The first page of the HSE Management Standards Indicator Tool - Scores Entry input form is
shown in Figure 5.
Figure 5 Scores entry input form - categories drop down menus
If the quest ionnaire results you are about to e nter have been categor ised into groups, the
Enter Questionnaire Scores worksheet will display drop do wn menus c orresponding to the
Categories that you have set up on the Categories workshe et. Use the drop down menus t o
indicate the group(s) to which the results you are entering belong.
Now click on the > button to contin ue with the rest of the questionnaire . The 35 q uestions
are distributed over 5 pages. For each question, click on the option button that corresponds
to the answer in the questionnaire. See Figure 6.
8
Figure 6 Scores entry input form - questions 1-7
When you have entered the replies to the first five questions, click the > button to move
questions 8 to 14. See Figure 7.
to
Figure 7 Scores entry input form - questions 8-14
You can use the > and < buttons to step from one screen to the next. Or you can go directly
to a page by using the Select Questions buttons.
The Save New Record button will be activat ed when yo u open the last page ( Figure 8).
Click it wh en you have finished entering the replies for a question naire. You will be
9
prompted to confirm that you wish to save the record. If you select ‘Yes’, a message box will
say ‘Record Added’ showing that the record has been added successfully.
Figure 8 Scores Entry input form - last page
Now click t he New Re cord button. This takes you directly to the first page of the Scores
Entry input form, resets the questions to No
Answer and increments the New Record
Number by 1. You can then use the drop down menus to indicate the group(s) to which the
next questionnaire’s results belong, and start entering your results for the next questionnaire.
The New Record Numb er box on th e Enter Qu estionnaire Scores worksheet allows you to
specify the questionnaire number for a new record. The rec ord number is stored in the Raw
Data worksheet. The numbers n ormally start at 1 and are incremented automatically.
However, you can change the number in the box if you want to, and this number is the one
that will be saved.
You may realise that you have entered the wrong answers for a questionnaire. Th e ‘Delete
Last Record’ button will remove the last record that you have saved.
Limitation on numbers of records
The HSE Management Standards Analysis Tool is not desig ned to cope with more t han 40
thousand records. If yo u need to a nalyse more than 40 th ousand records, then you must
split the records into se parate batches and an alyse each batch using a separate version of
the HSE Management Standards Analysis Tool.
10
Saving results
After you have finished entering all your results, save them by selecting ‘Save’ from the File
menu. You may want to save the results und er a name such as Wh ole organisation or
another name that is familiar to yo u. Do this by selecting ‘ Save As’ from the File menu and
change the file name accordingly. T o prevent you accidentally overwriting or deleting some
of your resu lts, it is advisable to copy this file and save it as a working file called ‘Results
analysis file’ or some such title.
Alternative method of data entry for numerical data
This alternative data entry facility allows more rapid data entry. It requires that responses on
the paper questionnair e that you are processing be labe lled with numbers (1-5). The
method of data input is most efficient when used in conjunction with a numeric keypad and is
therefore not suited for use with a laptop computer. The facility requires Excel 2000 or later.
Go to the Options worksheet and find the Input
Data (see Figure 9).
button und er the heading Input Numerical
Figure 9 Options worksheet: Alternative method of data entry for entering numerical data
11
Click on the button and follow the detailed on-screen instructions for entering questionnaire
data (see Figure 10).
Figure 10 On screen instructions for alternative method of data entry for entering numerical
data
2.5
SELECTING DATA SETS
The HSE Management Standards Analysis Tool is conf igured with a number of data sets.
The Data Sets tab allo ws you to s elect the benchmark survey data wi th which you wish to
compare your results.
Select the Data Sets worksheet from the tabs at the bottom of the screen (see Figure 11).
Before selecting a data set please read the information in the box titled ‘Important changes
to the HSE Management Standards Analysis Tool’; this provides detaile d information on the
benchmark data sets and HSE’s recommendations on selection of a data set.
12
In the exa mple in Figure 11 the da ta set select ed is Organ isational Averages. This is the
default data set. If you wish to select a different data set, use the drop down list on the left
hand side of the worksheet to select an alternative data set
Figure 11 The Data Sets worksheet
2.6
OBTAINING A SUMMARY OF YOUR RESULTS
Please do not change the layout o n any of the screens as this may affect the operation of
the HSE Management Standards Analysis Tool. In the Summary of Results and Question
by Question worksheets, the graphs are dependent on data that appears in fixed locations
on the worksheet and if, for example, you insert a line for a title then the numbers will be in
the wrong places. If you want to give a title to the spreadsh eet, select Page Setup from the
File menu, select Header/Footer from the tabs at the top of the dialog box and then Custom
Header, and type your header/title in there. It will show up in Print Preview and on the
printout.
When you want to see a summary of the results you have entered, select the Summary of
Results worksheet (Figure 12) from the tabs at the bottom of the screen.
In the example in Figure 12 the Data Set message above the Key indicates that the user has
chosen to use the Organisational Averages data to compare their results.
The Your Results column gives the average value for the responses to each of the stressors
covered in the 35 questions. The Suggested Interim Target column gives the targ et score
that we suggest would be a reasonable target for you to aim for next time (for example, in 6
months to a year’s time). The Sugg ested Longer Term Target is the value achieved by the
top 20% of the scores in the chosen benchmark data set.
13
Figure 12 Summary of Results worksheet
Individual question results
The Question-by-Question worksheet (Figure 13) shows you the average score for each
question. The colour coding gives an indicatio n of how your performance for that question
relates to the results from the chosen data set.
For Question 21, the worksheet hig hlights in re d the numb er of staff (plus the percentage
this represents of respondents to the question) who reported that they were always , often or
sometimes bullied.
14
Figure 13 Question by Question worksheet - results for individual questions
2.7
EXAMINING RESULTS FOR DIFFERENT CATEGORIES OF STAFF
Open the Results analysis file and select the Raw Data worksheet (Figure 14). Click on the
small button to the right of the category heading to use
the auto filter function. In the
example below, the user is choosing to filter on ‘Management’.
You can now select the Summary of Results
or the Ques tion-by-Question worksheets to
examine the results for the group yo u have selected. Time taken to analyse records when
using the Category Filter facility.
If you use the Category Filter facility to analyse large numbers of records and then select the
Summary of Results or Question by Question worksheets, there will be a short delay while
the HSE Management Standards Analysis Tool processes the data and updates the figures
in the worksheets.
15
Figure 14 Raw Data worksheet
In the example in F igure 15 and F igure 16, th e Category Filter message above t he Key
indicates that the user has chosen to examine the results for Glasgow based, administrative
staff. It also indicates the number of su ch staff and the percentage they represent of the
total group responding to the survey.
Figure 15 Summary of Results for group Selected
16
Figure 16 Question by Question worksheet for group selected
If you use t he Category Filter fa cility and there are fewer t han 10 peo ple in the group you
have selected, the Category Filter facility will return the me ssage ‘The filter returned too few
results to analyse. Yo ur filter sele ction has been cancelled’. To pro tect the anonymit y of
respondents when reporting results, the filter does not allow for analysis of results f or fewer
than 10 participants. However, it is possible to access such information using the Raw Data
worksheet of the HSE Manage ment Standards Analysis Tool. It is recommen
ded that
survey coordinators within organisations exercise discretion in providing wider access to the
Raw Data worksheet.
2.8
SAVING RESULTS FOR DIFFERENT GROUPS OF STAFF
Warning! Please note that this pr ocess is irreversible, it is importan t to save th e original
spreadsheet first under a different name, otherwise you may lose data.
You may wish to keep all your res ults together in the one Results analysis file, or you may
wish to split data to create separate files for diffe rent groups of staff. An easy way to do this
is to start b y using the filter functio n as described above to filter the data for the first group
(e.g. ‘Management’). Then select Save As from the File menu and save as a new file. You
can now use the Extract button (to be found under the heading Extract Selected Category on
the Options worksheet) to delete all the other rows of data from this file.
2.9
IMPORTING DATA FROM OTHER VERSIONS OF THE HSE MANAGEMENT
STANDARDS ANALYSIS TOOL
To do this, first colle ct all the source files you wi sh to import data from into one folder. Put
the target file (the one you wish to import data into) in a separate folder. Ensure that all
other workbooks are closed before proceeding.
Go to the Options worksheet and find the Import button un der the heading Import Raw Data
from Excel (see Figure 17). Click o n the button and select the folder that contains the .xls
17
files you wish to process. When you click OK, each .xls file will be opened and any raw data
contained in it added to the Raw Data worksheet of the target file.
The success of processing depen ds on matching column headings (e.g. ‘Que
between source and target Raw Data sheets.
stion 35’)
Warning! Depending on how many .xls files are being processed and the size o f the files,
importing raw data may be a lengthy operation.
Figure 17 Options worksheet Import Raw Data from Excel
2.10 IMPORTING DATA FROM OLDER VERSIONS OF THE HSE MANAGEMENT
STANDARDS ANALYSIS TOOL
You may use the Import Raw Data from the Excel facility on the Options worksheet to import
data from versions of the analysis tool prior to version 1.4.
To find out the version of the Analysis Tool you are currently using right click on the r elevant
Excel file, a nd then select Properties and the n the Summary tab. Version infor mation is
contained under Comments.
If no version information is disp layed, this indicates that you are usin g an earlier version of
the Analysis Tool (1.3 or earlier). The early versions (version 1.0) supported a maximum of 3
categories, input as part of the Enter Questionnaire Scores worksheet. Versions 1.1 to 1.3
supported a maximum of 4 categories and a separate Categories worksheet.
To import data from versions of the analysis to ol prior to version 1.4 go to the Cat egories
worksheet and alter the title of Category A to ‘Category A’, Category B to ‘Category B’, etc .
(see Figure 18). Then follow the same procedures describe d in the section above to import
raw data.
18
Once the import has be en carried out, you can restore the titles of Category A, Category B,
etc. to their previous titles (Location, Role, etc.). You can d o this manually or, if a category
configuration file is available, you can use t his to restore the category titles on ce the import
has been carried out.
Figure 18 Categories worksheet altering category titles to import from older versions of the
HSE Management Standards Analysis tool
2.11 IMPORTING DATA FROM THIRD PARTY SURVEY APPLICATIONS
Where other software a pplications have been used users are required to export data from
their application in a format suitable for imp
ort into the HSE Man agement Standards
Analysis Tool. The import raw data from text file facility on the option s worksheet can be
used for users wishing to export data from other software applications in a format suitable for
import into the HSE Management Standards Analysis Tool. As the tool takes the fo rm of a
Microsoft excel spreadsheet, the most suitable export format is a .csv file.
Excel spreadsheets save as .xls files as default. Users will have to change the format of the
excel spreadsheet. To do this go t o file, choose save as and then in the save as box go to
save as type. Change the save as type to CSV (comma delimited) (*.csv).
Before you import the .csv file you must config ure the categories. Please see the configure
categories section above for instructions on how to do this.
The .csv file must con form to the format explained belo w. The fir st row is th e record
number, followed by the twelve cate gories and then the 35 questions. See Figure 19 for an
example. Please note that all blanks need to be filled in with a 0. This can be done by using
the find and replace facility in excel. Press control and F, in the find box leave it blank and in
the replace box type 0. Click the replace all, all empty cells should now have a 0 entered.
19
Figure 19 Example of the format required for the .csv file
If the .csv file is not formatted correctly the following error messages may appear.
If this error message is shown it indicates that a cell is blank, please check the .csv file and
add a 0 in the cell.
If this error message is shown it ind icates that t here have been a data inputting err or e.g.
instead of a cell read ing 4 it reads 44. Please recheck the .csv file and add th e correct
response.
20
2.11.1 How to select the appropriate delimiter if the default comma (44) is not used
The instructions on how to do t his are included at the bottom of the Import Raw Data from
Text File. You will need to go to th e box mark ed Delimiter, delete the 44 in this b ox, then
enter the number that corresponds to the delimiter you are using. In the example below the
user wanted to use the delimiter Space so has entered 32 in the delimiter box.
21
2.12 ADDITIONAL FEATURES
The Totals worksheet: a worksheet providing addition
patterns of responses;
al information on respondents’
The Totals worksheet records for each of the questions:
Response Counts: the numbers of respondents selecting each of the response categories;
% Response Counts: the percentage of respondents (excluding non-respondents) selecting
each of the response categories (see Figure 20).
Figure 20 Totals worksheet – results for all factors
The worksheet also provides this information broken down by individual factors ( see Figure
21).
22
Figure 21 Totals worksheet – results for individual factors
23
3 INTERPRETATION OF RESULTS
The scores provided by the HSE Analysis Tool are organisation
s responses to the
questionnaire. They indicate ho
w employees are per forming against each of the
Management Standards. The scor es range from 1 to 5.
A lower score indicat es poor
performance or a potential problem area.
Employees’ scores ar e then co mpared to benc hmark scores that are expressed in
percentiles and are colour coded to ease their reading. Results that
fall below the 20 th
percentile are coloured red and ind icate that the average of employees’ score s falls in t he
bottom 20% of those surveyed in the benchmark data. Results that are below average i.e.
below the 50th percentile but are ab ove the 20 th percentile are coloured amber. Scores that
are above average i.e. higher than the 50 th percentile but n ot above the 80th percentile are
colour-coded aqua. Results that are above the 80th percentile are coloured green indicating
that the average of employees’ scores falls
in the top 20% of those surveye d in the
benchmark data. Each percentile r ank requires a follow u p action, fro m ‘urgent action’ to
‘good performance to be maintained’. A summary is given below.
Percentile key:
Below 20th percentile (bottom 20% of benchmark scores) / Urgent action required
Below average but above or at 20th percentile / Improvement needed
Above or at average bu t below 80 th percentile /Good performance but potential
improvement
Above or at 80 th percentile (top 20% of benchmark) /Doing very well – Need to
maintain performance
It is important to focus on the percentiles and colour coding as well as the average figures
for the responses, as the percentile bound aries vary f or each Standard. Appendix B
describes the technical information and procedures use d in the calculation o f current
performance and targets for both the Organisational Data Set and the 2004 Survey
Data
Set. This is because t he benchmark data ha s indicated that there a re some areas that
organisations find easier to manage more effectively than others. By only focusing on the
average response, an organisation may be distracted by a lower average score, even
though achieving this Standard is actually harder and therefore, by co mparison to others,
may be performing relatively better on that Standard.
In addition to the Overall Results, the Individual Question Results provide a detaile d picture
of the findings. The Ind ividual Question Results gives the a verage score for each q uestion.
The colour coding gives an indicat ion of how the score f or that question relate s to the
benchmark. A single question resu lt may prove helpful as a prompt t o discussions within
focus groups but should not be inter preted as a definitive assessment of your performance
since it is too limited to represent the area of concern.
Several qu estions tapping one
particular dimension are deemed more robust in evaluating that particular are
a. For
example, 8 questions are used to assess De mands. For Question 21 'I am su bject to
bullying at work', If an y members of staff score 1, 2 or 3 on que stion 21, the worksheet
returns a message hig hlighted in red to the effect that “ * x (nu mber plus percentage of
respondents) of your st aff report th at they are always, often or someti mes bullied.” This
above feature of the HSE Management Standards Analysis Tool is included in response to
24
comments received d uring the Management Standards Pilots and in the course of
consultations with various stakeholders. Many people considered that any level o f bullying
was unacceptable and that any reported bullying should be highlighted as an issue that
might warrant further exploration, for example, during focus groups.
These data can be used in a number of ways to indicate your performance:
•
Across standards to identify those standards which need improvement and those which
you are currently performing well on
•
Across different parts of your organisation, with a view to identifying good parts that may
have practices that would be benef icial for other parts to adopt and for identifying hot
spots; and
It is worth remembering that the results only provide an indication of performance against the
Management Standards. For step 2 of the Management Standards approach, other relevant
data should also be co nsidered. For example, absence data and turnover are t wo other
important indications of the prevalence of work-related stress in your organisation.
It is important to appreciate that the results
of the survey alone c an only pro vide an
indication of performance in managing work-related stress. You will
need to sh are and
discuss the outcomes of the survey and other data collecte d with empl oyees, and explore
any issues raised in more detail, for example in focus groups. As suggested at step 3 of the
Management Standards approach (‘Evaluate t he risks: Explore problems and develop
solutions’), we recommend that you confirm all y our survey results with your employees (for
example, in focus groups) to assess whether the results highlight a potential problem area
for your organisation. This is particularly im portant when you are considering responses to
individual questions.
Caveats for the Psychosocial Data set
The survey results for the Role stress factor indicate that a very larg e proportion of the
people responding to the national survey score d 5 on the questions re lating to Role. One
consequence of this is that an org anisation may achieve what appears to be a f airly high
score on Role (e.g. 4.2 ) and yet find that they fall be low the 20th percentile for that factor
when compared with the national survey results.
Further information is available from
http://www.hse.gov.uk/stress/
Managing the causes of work-related stre
ss: A step -by-step approach using the
Management Standards. HSE Books. HSG218
25
4 CONTACT HSE
If you need assistance with any aspect of the HSE Management Standards Analysis Tool, or
if you wish to provide f eedback about your ex perience using these to ols, please contact
HSE.
For more information please visit the HSE web site at:
http://www.hse.gov.uk/contact/index.htm.
26
5 APPENDIX A – QUESTION & ANSWER
In this section, we anticipate questions users might have about the changes made.
My organisation completed its risk assessment using the old benchmark.
analysis invalid?
Is the
No, the analysis is valid. The anal ysis tool is d esigned to support empl oyers in engaging a
dialogue with their staff. Discussions with staff should be used to steer the process towards
the real issues regardless of which version of the tool has been used.
My organisation used the old benchmark in a previous survey. We are now ready to
run the survey again to assess progress – which benchmark should I use?
The analysis tool’s primary use should be to direct future activity, rather than t o evaluate
past activity. Therefore the most appropriat
e benchmark to use would be the ne w
benchmark. However, if you do wis h to identify changes in working conditions between the
two surveys, you should use the same benchmark for each phase. Furthermore, there is no
problem with using one set of benchmark to assess progre ss and anot her to direct future
activity.
Because you now have two sets of results you c an use your first set of results as your own
internal (or historical) benchmark. The second set of results, and a ny subsequent surveys,
can be compared against your first set of results if required.
27
6 APPENDIX B – TECHNICAL INFORMATION AND PORCEDURES
USED IN THE CALCULATION OF CURRENT PERFORMANCE
AND TARGETS
6.1
ORGANISATIONAL DATA SET
Summary Of Results Worksheet
Table 1 contains data from 136 organisations that have completed the survey using
HSE’s Management Standards Indicator Tool.
Table 1 shows the scores by
cumulative percentiles of the score distributions for Demands, Control, Managerial
Support, Peer Support, Relationships, Role and Change.
Table 2 shows the rules governing the colour coding cut-off s used in pr esenting the results
in the Your Results colu mn of the Summary of Results worksheet. Th ese rules are derived
from the data in Table 1.
Suggested Interim Target
The procedure for working out the Suggested Interim Target for any given stressor is a
pragmatic ‘rule of thumb’ procedure. The procedure is described below.
•
The percentiles, from 5 to 80, at intervals of 5, and their associated values are stored in
an array – these are derived from the data in Table 1.
•
The average score for the results entered to date (the figure in the Your Results column
of the Summary of Re sults worksheet) is co mpared with the percent ile values and the
nearest value is selected (the highest value is selected in the case of ties).
•
The percentile associated with that v alue is subtracted from 100, the difference divided
by 5;
•
The value obtained is added to the original percentile: that value is then rounded to the
nearest 5;
•
The value associated with the resulting percentile is the Suggested Interim Target.
Note:
The procedure ensures that score s that fall b elow the 2 0th percentile are alwa ys set a
Suggested Interim Target at least equivalent to the 25th percentile score.
If an organisation score s at or abo ve the 80 th percentile o n one of the stress fa ctors, the
procedure returns a message sug gesting that they set their own interim and longer-term
targets for continuous improvement.
Suggested Longer Term Target
The Suggested Longer Term Target scores are derived from the 80th percentile figures in
Table 1.
28
Question By Question Worksheet
Table 3 shows the scores by cumulative percentiles of the score distributions for each of the
individual questions grouped together under the factors Demands, Control, Managerial
Support, Peer Support, Relationships, Role
and Change. This d ata is ba sed on the
Organisational Data Set (average results from 136 organisations that have completed the
survey using HSE’s Management Standards Indicator Tool).
Table 4 shows the rules governing the colour coding cut-offs used in presenting the results
in the Question by Question worksheet. These rules are derived from the data in Table 3.
6.2
2004 SURVEY DATA SET
Summary Of Results Worksheet
Table 5 contains data from the HSE survey Psychosocial Working Conditions in Great
Britain 2004. Table 5 shows the scores by cumulative percentiles o f the score distributions
for Demands, Control, Managerial Support, Peer Support, Relationship s, Role and Change .
(Please note that the o rder of these factors d iffers from the order given in Table 5 of the
above survey report, in that Relationships appears before Role in Table 5).
Table 6 shows the rules governing the colour coding cut-offs used in presenting the results
in the Your Results colu mn of the Summary of Results worksheet. These rules are derived
from the data in Table 5.
Suggested Interim Target
The procedure for working out the Suggested Interim Target for any given stressor is a
pragmatic ‘rule of thumb’ procedure as described above for the Organisational Data Set.
Suggested Longer Term Target
The Suggested Longer Term Target scores are derived from the 80
Table 5.
th
percentile figures in
Question By Question Worksheet
Table 7 shows the scores by cumulative percentiles of the score distributions for each of the
individual questions grouped together under the factors Demands, Control, Managerial
Support, Peer Support, Relationship s, Role and Change. This data is taken from the HSE
survey Psychosocial Working Conditions in Great Britain 2004.
Table 8 shows the rules governing the colour coding cut-offs used in presenting the results
in the Question by Question worksheet. These rules are derived from the data in Table 7.
29
Table 1 Organisational Data Set Percentile Figures for each Standard
Percentiles
1
5
10
15
20
25
30
35
40
45
50
55
60
65
70
75
80
85
90
95
99
Demands
2.4530 2.6854 2.8489 2.8977 2.9387 2.9769 3.0017 3.0314 3.0600 3.0796 3.1024 3.1300 3.1424 3.1700 3.2073 3.2300 3.2937 3.3485 3.4214 3.5081 5
Control
2.3081 2.8074 3.0169 3.1395 3.2240 3.2857 3.3410 3.3799 3.3983 3.4253 3.4741 3.4975 3.5557 3.6000 3.6378 3.6685 3.7208 3.7600 3.8130 3.9304 5
Management
Support
2.6394 3.0407 3.1099 3.2158 3.2720 3.3135 3.3412 3.3822 3.4113 3.4338 3.4603 3.4805 3.5085 3.5305 3.5670 3.6281 3.6500 3.7008 3.7302 3.7953 5
Peer Support
3.3589 3.4745 3.5295 3.5889 3.6270 3.6600 3.6810 3.7121 3.7300 3.7482 3.7800 3.7988 3.8124 3.8300 3.8438 3.8608 3.8892 3.9158 3.9506 3.9959 5
Relationships
1.8993 2.7120 3.4733 3.5315 3.6115 3.6638 3.7179 3.7630 3.8008 3.8249 3.8499 3.8813 3.9018 3.9390 3.9698 4.0040 4.0381 4.0494 4.1037 4.2007 5
Role
3.4537 3.8485 3.9584 4.0069 4.0356 4.0701 4.0900 4.1199 4.1490 4.1700 4.1803 4.1855 4.2100 4.2449 4.2638 4.2787 4.3117 4.3300 4.4024 4.5296 5
Change
2.2925 2.5447 2.6630 2.7243 2.7910 2.8400 2.9046 2.9329 2.9874 3.0287 3.0428 3.0763 3.1200 3.1410 3.1754 3.2121 3.2400 3.2740 3.3365 3.4318 5
Table 2 Organisational Data Set – ‘Summary of Results’ Worksheet – Rules Governing Colour Coding Cut-offs for each Standard
Factor
Red
th
< 20 percentile
Yellow
th
th
>= 20 & < 50 percentile
Aqua
th
Green
th
>= 50 & < 80 percentile
th
>= 80 percentile
Demands
< 2.9387
>= 2.9387 & < 3.1024
>= 3.1024 & < 3.2937
>= 3.2937
Control
< 3.2240
>= 3.2240 & < 3.4741
>= 3.4741 & < 3.7208
>= 3.7208
Managers’ support
< 3.2720
>= 3.2720 & < 3.4603
>= 3.4603 & < 3.6500
>= 3.6500
Peer support
< 3.6270
>= 3.6270 & < 3.7800
>= 3.7800 & < 3.8892
>= 3.8892
Relationship
< 3.6115
>= 3.6115 & < 3.8499
>= 3.8499 & < 4.0381
>= 4.0381
Role
< 4.0356
>= 4.0356 & < 4.1803
>= 4.1803 & < 4.3117
>= 4.3117
Change
< 2.7910
>= 2.7910 & < 3.0428
>= 3.0428 & < 3.2400
>= 3.2400
30
Table 3 Organisational Data Set – Percentile Figures for each Question – Grouped by Standard
Percentiles
Demands
1
5
3
Different groups at work demand things from me that are hard to combine
1.77
2.58
10
2.75
15
2.83
20
2.85
25
2.88
30
2.93
35
2.96
40
2.98
45
3.02
50
3.03
55
3.04
60
3.05
65
3.07
70
3.13
75
3.18
80
3.22
85
3.25
90
3.33
95
3.52
99
5
6
I have unachievable deadlines
2.37
2.65
3.07
3.22
3.26
3.31
3.33
3.37
3.39
3.42
3.47
3.48
3.50
3.50
3.54
3.59
3.64
3.70
3.77
3.88
5
9
I have to work very intensively
1.74
1.95
2.05
2.13
2.15
2.16
2.21
2.22
2.25
2.27
2.31
2.35
2.37
2.42
2.46
2.48
2.56
2.65
2.75
3.64
5
12
I have to neglect some tasks because I have too much to do
2.00
2.50
2.75
2.80
2.84
2.87
2.89
2.92
2.94
2.97
2.99
3.01
3.04
3.07
3.11
3.16
3.20
3.23
3.31
3.54
5
16
I am unable to take sufficient breaks
2.16
2.56
2.93
3.05
3.10
3.16
3.19
3.24
3.27
3.31
3.38
3.44
3.49
3.56
3.62
3.63
3.68
3.72
3.76
3.83
5
18
I am pressured to work long hours
2.22
2.72
3.18
3.38
3.44
3.50
3.54
3.60
3.64
3.67
3.68
3.72
3.76
3.79
3.81
3.88
3.94
4.02
4.16
4.35
5
20
I have to work very fast
1.82
2.14
2.31
2.41
2.44
2.49
2.51
2.56
2.59
2.62
2.65
2.68
2.70
2.74
2.77
2.81
2.87
2.99
3.08
3.34
5
22
I have unrealistic time pressures
2.46
2.66
2.89
2.98
3.14
3.17
3.21
3.27
3.31
3.32
3.35
3.39
3.42
3.45
3.49
3.52
3.58
3.65
3.73
3.86
5
Control
2
I can decide when to take a break
1.94
2.51
3.05
3.24
3.33
3.41
3.46
3.52
3.58
3.66
3.76
3.79
3.84
3.90
3.94
4.04
4.10
4.18
4.24
4.37
5
10
I have a say in my own work speed
2.27
2.76
3.02
3.12
3.21
3.29
3.31
3.33
3.35
3.38
3.41
3.46
3.52
3.57
3.61
3.64
3.66
3.67
3.72
3.88
5
15
I have a choice in deciding how I do my work
2.52
3.05
3.27
3.36
3.41
3.48
3.50
3.55
3.56
3.59
3.63
3.67
3.71
3.74
3.78
3.83
3.86
3.88
3.93
4.00
5
19
I have a choice in deciding what I do at work
1.74
2.32
2.54
2.65
2.67
2.71
2.77
2.82
2.86
2.91
2.94
2.96
3.00
3.05
3.08
3.13
3.19
3.23
3.29
3.42
5
25
I have some say over the way I work
2.92
3.21
3.49
3.55
3.60
3.62
3.67
3.69
3.71
3.76
3.78
3.81
3.85
3.87
3.90
3.95
3.97
3.99
4.08
4.14
5
30
My working time can be flexible
2.12
2.46
2.72
2.82
2.90
3.00
3.07
3.13
3.18
3.24
3.29
3.39
3.48
3.56
3.61
3.64
3.72
3.83
3.95
4.11
5
Managers’ Support
99
8
I am given supportive feedback on the work I do
23
I can rely on my line manager to help me out with a work problem
2.64
3.15
3.30
3.43
3.48
3.51
3.60
3.63
3.68
3.70
3.73
3.76
3.80
3.83
3.87
3.90
3.94
3.98
29
I can talk to my line manager about something that has upset or annoyed me about work
2.82
3.32
3.42
3.52
3.59
3.62
3.65
3.68
3.70
3.71
3.74
3.77
3.80
3.84
3.87
3.91
3.93
3.96
33
I am supported through emotionally demanding work
2.69
2.79
2.92
2.99
3.03
3.04
3.09
3.11
3.13
3.18
3.20
3.23
3.26
3.28
3.31
3.33
3.38
35
My line manager encourages me at work
2.83
4.11
4.22
4.25
4.25
4.29
4.33
4.34
4.35
4.37
4.39
4.40
4.43
4.46
4.47
4.50
4.51
2.27
2.54
2.73
2.79
2.88
2.91
2.96
3.03
3.04
3.08
3.11
3.15
3.18
3.21
3.25
3.30
3.34
3.57
5
4.02
4.19
5
4.00
4.08
5
3.46
3.50
3.56
5
4.52
4.55
4.64
5
3.37
3.45
Peer Support
99
7
If work gets difficult, my colleagues will help me
24
I get help and support I need from colleagues
3.10
3.56
3.65
3.67
3.71
3.73
3.76
3.79
3.84
3.85
3.89
3.91
3.93
3.95
3.98
4.00
4.03
4.04
27
I receive the respect at work I deserve from my colleagues
3.18
3.36
3.43
3.49
3.51
3.53
3.57
3.61
3.61
3.63
3.66
3.67
3.69
3.70
3.73
3.77
3.79
3.82
31
My colleagues are willing to listen to my work-related problems
3.31
3.45
3.53
3.56
3.62
3.65
3.69
3.71
3.74
3.75
3.76
3.80
3.82
3.83
3.86
3.88
3.89
5
I am subject to personal harassment in the form of unkind words or behaviour
1.57
2.76
3.65
3.80
3.93
3.96
4.01
4.06
4.08
4.12
4.14
4.18
4.21
4.24
4.26
4.29
14
There is friction or anger between colleagues
2.31
2.63
2.95
3.07
3.14
3.24
3.29
3.33
3.37
3.41
3.43
3.48
3.50
3.55
3.59
21
I am subject to bullying at work
1.36
2.36
4.08
4.22
4.31
4.37
4.41
4.44
4.47
4.50
4.53
4.56
4.58
4.61
34
Relationships at work are strained
2.33
2.60
2.73
2.91
3.03
3.10
3.20
3.24
3.29
3.31
3.34
3.36
3.38
3.41
3.26
3.45
3.51
3.59
3.63
3.67
3.71
3.73
3.75
3.76
3.79
3.80
3.83
3.85
4.11
5
4.09
4.14
5
3.86
3.96
5
3.90
3.94
3.97
5
4.35
4.37
4.47
4.56
5
3.61
3.64
3.68
3.76
3.86
5
4.63
4.64
4.66
4.69
4.73
4.81
5
3.44
3.53
3.55
3.62
3.67
3.76
5
3.87
3.89
3.93
3.96
4.00
Relationships
Role
99
1
I am clear what is expected of me at work
1.91
3.92
4.04
4.08
4.10
4.14
4.16
4.20
4.22
4.25
4.26
4.28
4.29
4.31
4.34
4.37
4.40
4.45
4.48
4.54
5
4
I know how to go about getting my job done
3.50
3.91
4.01
4.07
4.11
4.14
4.15
4.19
4.21
4.23
4.25
4.28
4.31
4.34
4.37
4.40
4.42
4.44
4.48
4.55
5
11
I am clear what my duties and responsibilities are
2.82
3.47
3.59
3.66
3.74
3.80
3.83
3.85
3.89
3.92
3.95
4.00
4.01
4.02
4.05
4.08
4.14
4.21
4.26
4.41
5
13
I am clear about the goals and objectives for my department
3.63
3.72
3.77
3.82
3.87
3.90
3.93
3.97
3.99
4.01
4.03
4.05
4.08
4.10
4.11
4.13
4.18
4.24
4.31
4.46
5
17
I understand how my work fits into the overall aim of the organisation
1.91
3.92
4.04
4.08
4.10
4.14
4.16
4.20
4.22
4.25
4.26
4.28
4.29
4.31
4.34
4.37
4.40
4.45
4.48
4.54
5
Change
26
I have sufficient opportunities to question managers about change at work
2.32
2.71
2.82
2.98
3.02
3.07
3.11
3.14
3.17
3.20
3.23
3.27
3.31
3.34
3.39
3.44
3.46
3.55
3.59
3.68
5
28
Staff are always consulted about change at work
2.11
2.28
2.38
2.45
2.51
2.58
2.66
2.71
2.75
2.79
2.82
2.86
2.94
2.97
3.00
3.03
3.05
3.09
3.18
3.37
5
32
When changes are made at work, I am clear how they will work out in practice
2.38
2.58
2.64
2.77
2.82
2.86
2.89
2.93
2.97
3.02
3.06
3.11
3.13
3.15
3.17
3.19
3.21
3.27
3.31
3.44
5
31
Table 4 Organisational Data Set – Question by Question Worksheet – Rules Governing Colour Coding Cut-offs for each Question
Yellow
Red
th
th
th
Aqua
th
th
Green
th
< 20 Percentile
>= 20 & < 50 Percentile
>= 50 & < 80 Percentile
>= 80 Percentile
Demands
3
Different groups at work demand things from me that are hard to combine
< 2.85
>= 2.85 & < 3.03
>= 3.03 & < 3.22
>= 3.22
6
I have unachievable deadlines
< 3.26
>= 3.26 & < 3.47
>= 3.47 & < 3.64
>= 3.64
9
I have to work very intensively
< 2.15
>= 2.15 & < 2.31
>= 2.31 & < 2.56
>= 2.56
12
I have to neglect some tasks because I have too much to do
< 2.84
>= 2.84 & < 2.99
>= 2.99 & < 3.20
>= 3.20
16
I am unable to take sufficient breaks
< 3.10
>= 3.10 & < 3.38
>= 3.38 & < 3.68
>= 3.68
18
I am pressured to work long hours
< 3.44
>= 3.44 & < 3.68
>= 3.68 & < 3.94
>= 3.94
20
I have to work very fast
< 2.44
>= 2.44 & < 2.65
>= 2.65 & < 2.87
>= 2.87
22
I have unrealistic time pressures
< 3.14
>= 3.14 & < 3.35
>= 3.35 & < 3.58
>= 3.58
< 3.33
>= 3.33 & < 3.76
>= 3.76 & < 4.10
>= 4.10
Control
2
I can decide when to take a break
10
I have a say in my own work speed
< 3.21
>= 3.21 & < 3.41
>= 3.41 & < 3.66
>= 3.66
15
I have a choice in deciding how I do my work
< 3.41
>= 3.41 & < 3.63
>=3.63 & < 3.86
>= 3.86
19
I have a choice in deciding what I do at work
< 2.67
>= 2.67 & < 2.94
>= 2.94 & < 3.19
>= 3.19
25
I have some say over the way I work
< 3.60
>= 3.60 & < 3.78
>= 3.78 & < 3.97
>= 3.97
30
My working time can be flexible
< 2.90
>= 2.90 & < 3.29
>= 3.29 & < 3.72
>= 3.72
>= 3.34
Managers’ Support
8
I am given supportive feedback on the work I do
< 2.88
>= 2.88 & < 3.11
>= 3.11 & < 3.34
23
I can rely on my line manager to help me out with a work problem
< 3.48
>= 3.48 & < 3.73
>= 3.73 & < 3.94
>= 3.94
29
I can talk to my line manager about something that has upset or annoyed me about work
< 3.59
>= 3.59 & < 3.74
>= 3.74 & < 3.93
>= 3.93
33
I am supported through emotionally demanding work
< 3.03
>= 3.03 & < 3.20
>= 3.20 & < 3.38
>= 3.38
35
My line manager encourages me at work
< 4.25
>= 4.25 & < 4.39
>= 4.39 & < 4.51
>= 4.51
7
If work gets difficult, my colleagues will help me
< 3.63
>= 3.63 & < 3.79
>= 3.79 & < 3.93
>= 3.93
24
I get help and support I need from colleagues
< 3.71
>= 3.71 & < 3.89
>= 3.89 & < 4.03
>= 4.03
27
I receive the respect at work I deserve from my colleagues
< 3.51
>= 3.51 & < 3.66
>= 3.66 & < 3.79
>= 3.79
31
My colleagues are willing to listen to my work-related problems
< 3.62
>= 3.62 & < 3.76
>= 3.76 & < 3.89
>= 3.89
5
I am subject to personal harassment in the form of unkind words or behaviour
< 3.93
>= 3.93 & < 4.14
>= 4.14 & < 4.35
>= 4.35
14
There is friction or anger between colleagues
< 3.14
>= 3.14 & < 3.43
>= 3.43 & < 3.64
>= 3.64
21
I am subject to bullying at work
< 4.31
>= 4.31 & < 4.53
>= 4.53 & < 4.66
>= 4.66
34
Relationships at work are strained
< 3.03
>= 3.03 & < 3.34
>= 3.34 & < 3.55
>= 3.55
1
I am clear what is expected of me at work
< 4.10
>= 4.10 & < 4.26
>= 4.26 & < 4.40
>= 4.40
Peer Support
Relationships
Role
4
I know how to go about getting my job done
< 4.11
>= 4.11 & < 4.25
>= 4.25 & < 4.42
>= 4.42
11
I am clear what my duties and responsibilities are
< 3.74
>= 3.74 & < 3.95
>= 3.95 & < 4.14
>= 4.14
13
I am clear about the goals and objectives for my department
< 3.87
>= 3.87 & < 4.03
>= 4.03 & < 4.18
>= 4.18
17
I understand how my work fits into the overall aim of the organisation
< 4.10
>= 4.10 & < 4.26
>= 4.26 & < 4.40
>= 4.40
26
I have sufficient opportunities to question managers about change at work
< 3.02
>= 3.02 & < 3.23
>= 3.23 & < 3.46
>= 3.46
28
Staff are always consulted about change at work
< 2.51
>= 2.51 & < 2.82
>= 2.82 & < 3.05
>= 3.05
32
When changes are made at work, I am clear how they will work out in practice
< 2.82
>= 2.82 & < 3.06
>= 3.06 & < 3.21
>= 3.21
Change
32
Table 5 2004 Survey Data Set – Percentile Figures for each Standard
Percentiles
1
5
10
2.125
15
20
2.75
2.875
2.5
25
Demands
1.3970
95
Control
1.2549 1.8333 2.1666 2.3333 2.6666 2.8333
92
33
67
33
67
33
Management
Support
1.4
2
2.4
Peer Support
1.75
2.5
2.75
Relationships
2
3
3.25
3.5
3.2
3.8
4
4.2
Role
Change
1 1.6666
67
2.75
3
3.25 3.3333
33
3
30
35
40
45
3.125
3.25
3.375
50
3.5
3 3.1666 3.1666 3.3333
67
67
33
3 3.2361
81
3.5
55
60
65
70
3.625
3.75
3.875
4
3.5 3.6666 3.8333 3.8333
67
33
33
75
80
85
4.125
4.25
4.375
4 4.1666 4.3333
67
33
90
95
4.5
99
4.75
5
4.5 4.6666 4.8333
67
33
5
3.4
3.6
3.6
3.8
4
4
4.2
4.2
4.4
4.6
4.6
4.8
5
5
4.25
4.25
4.25
4.5
4.5
4.75
4.75
5
5
5
4.25 4.2642
14
4.5
4.5
4.5
4.75
4.75
5
5
5
5
5
3.5
3.75
3.75
4
4
4
3.75
3.75
4
4
4
4.25
4.25
4.4
4.6
4.6
4.8
4.8
5
5
2 2.3333 2.6666 2.6666
33
67
67
3
5
5
5
5
5
5
5
3 3.3333 3.3333 3.6666 3.6666 3.6666
33
33
67
67
67
5
4
4
4
4 4.3333 4.6666 4.6666
33
67
67
5
Table 6 2004 Survey Data Set – Summary of Results’ Worksheet – Rules Governing Colour Coding Cut-offs for each Standard
Factor
Red
Yellow
th
< 20 percentile
Aqua
th
th
Green
th
>= 20 & < 50 percentile
th
th
>= 50 & < 80 percentile
>= 80 percentile
Demands
< 2.875
>= 2.875 & < 3.5
>= 3.5 & < 4.25
>= 4.25
Control
< 2.666667
>= 2.666667 & < 3.5
>= 3.5 & < 4.333333
>= 4. 333333
Managers’ support
<3
>= 3 & < 3.8
>= 3.8 & < 4.6
>= 4. 6
Peer support
< 3.333333
>= 3.333333 & < 4
>= 4 & < 4.75
>= 4. 75
Relationship
< 3.75
>= 3.75 & < 4.25
>= 4.25 & < 4.75
>= 4.75
Role
< 4.4
>= 4.4 & <5
No aqua
=5
Change
< 2.666667
>= 2.666667 & < 3.666667
>= 3.666667 & < 4
>= 4
Table 7 2004 Survey Data Set – Percentile Figures for each question – Grouped by Standard
Percentiles
Demands
1
5
10
15
20
25
30
35
40
45
50
55
60
65
70
75
80
85
90
95
99
3
Different groups at work demand things from me that are hard to
combine
1
2
2
2
3
3
3
3
3
3
4
4
4
4
4
4
5
5
5
5
5
6
I have unachievable deadlines
1
2
2
3
3
3
3
3
3
4
4
4
4
4
5
5
5
5
5
5
5
9
I have to work very intensively
1
1
1
1
2
2
2
2
2
2
3
3
3
3
3
3
3
3
4
5
5
12
I have to neglect some tasks because I have too much to do
1
1
2
2
2.09
3
3
3
3
3
3
3
3
4
4
4
4
4
5
5
5
16
I am unable to take sufficient breaks
1
2
2
3
3
3
3
4
4
4
4
4
4
5
5
5
5
5
5
5
5
18
I am pressured to work long hours
1
1
2
2
2
3
3
3
3
3
4
4
4
4.7
5
5
5
5
5
5
5
20
I have to work very fast
1
1
1
2
2
2
2
3
3
3
3
3
3
3
3
3
4
4
5
5
5
22
I have unrealistic time pressures
1
2
2
2
3
3
3
3
3
3
4
4
4
4
4
4
5
5
5
5
5
Control
1
5
10
15
20
25
30
35
40
45
50
55
60
65
70
75
80
85
90
95
99
2
I can decide when to take a break
1
1
1
2
3
3
3
4
4
4
5
5
5
5
5
5
5
5
5
5
5
10
I have a say in my own work speed
1
2
2
3
3
3
3
3
3.08
4
4
4
4
4
5
5
5
5
5
5
5
15
I have a choice in deciding how I do my work
1
1
1
1
2
2
3
3
3
3
3
3
4
4
4
4
5
5
5
5
5
33
19
I have a choice in deciding what I do at work
1
2
3
3
3
3
3
4
4
4
4
4
4
4
5
5
5
5
5
5
5
25
I have some say over the way I work
1
2
3
3
4
4
4
4
4
4
4
4
4
5
5
5
5
5
5
5
5
30
My working time can be flexible
1
1
1
2
2
2
3
4
4
4
4
4
4
4
5
5
5
5
5
5
5
Managers’ Support
1
5
10
15
20
25
30
35
40
45
50
55
60
65
70
75
80
85
90
95
99
8
I am given supportive feedback on the work I do
1
1
2
2
2
3
3
3
3
3
3
4
4
4
4
4
5
5
5
5
5
23
I can rely on my line manager to help me out with a work problem
1
1
2
2
2
3
3
3
3
4
4
4
4
4
5
5
5
5
5
5
5
29
I can talk to my line manager about something that has upset or annoyed
me about work
1
2
3
3
3
4
4
4
4
4
4
4
5
5
5
5
5
5
5
5
5
33
I am supported through emotionally demanding work
1
2
2
3
3
3
3
3
4
4
4
4
4
4
4
4
5
5
5
5
5
35
My line manager encourages me at work
1
2
2
2
3
3
3
4
4
4
4
4
4
4
5
5
5
5
5
5
5
Peer Support
1
5
10
15
20
25
30
35
40
45
50
55
60
65
70
75
80
85
90
95
99
7
If work gets difficult, my colleagues will help me
1
1
2
3
3
3
3
3
4
4
4
4
4
4
5
5
5
5
5
5
5
24
I get help and support I need from colleagues
1
2
3
3
4
4
4
4
4
4
4
4
4
4
5
5
5
5
5
5
5
27
I receive the respect at work I deserve from my colleagues
1
2
3
3
4
4
4
4
4
4
4
4
4
4
5
5
5
5
5
5
5
31
My colleagues are willing to listen to my work-related problems
2
2
3
3
4
4
4
4
4
4
4
4
4
4
5
5
5
5
5
5
5
Relationships
1
5
10
15
20
25
30
35
40
45
50
55
60
65
70
75
80
85
90
95
99
2
3
3
4
4
4
4
4
5
5
5
5
5
5
5
5
5
5
5
5
5
5
I am subject to personal haras sment in the form of unkind w
behaviour
ords or
14
There is friction or anger between colleagues
1.2999
2
2
3
3
3
3
3
3
3
3
4
4
4
4
4
4
5
5
5
5
21
I am subject to bullying at work
2
4
4
5
5
5
5
5
5
5
5
5
5
5
5
5
5
5
5
5
5
34
Relationships at work are strained
1
2
2
2
2.0926
3
3
4
4
4
4
4
4
4
4
4
4.9074
5
5
5
5
Role
1
5
10
15
20
25
30
35
40
45
50
55
60
65
70
75
80
85
90
95
99
1
I am clear what is expected of me at work
3
4
4
4
4
5
5
5
5
5
5
5
5
5
5
5
5
5
5
5
5
4
I know how to go about getting my job done
3
4
4
4
4
4.25
5
5
5
5
5
5
5
5
5
5
5
5
5
5
5
11
I am clear what my duties and responsibilities are
3
4
4
4
4
5
5
5
5
5
5
5
5
5
5
5
5
5
5
5
5
13
I am clear about the goals and objectives for my department
2
3
4
4
4
4
5
5
5
5
5
5
5
5
5
5
5
5
5
5
5
17
I understand how my work fits into the overall aim of the organisation
2
3
4
4
4
4
5
5
5
5
5
5
5
5
5
5
5
5
5
5
5
Change
1
5
10
15
20
25
30
35
40
45
50
55
60
65
70
75
80
85
90
95
99
26
I have sufficient opportu nities to question mana gers about change at
work
1
1
2
2
2
3
3
4
4
4
4
4
4
4
4
4
5
5
5
5
5
28
Staff are always consulted about change at work
1
1
2
2
2
2
2
3
3
3
4
4
4
4
4
4
4
4
5
5
5
32
When changes are made at work, I am clear how they will work out in
practice
1
2
2
2
2
3
3
3
3
3
4
4
4
4
4
4
4
4
5
5
5
34
Table 8 2004 Survey Data Set – Question by Question Worksheet – Rules Governing Colour Coding Cut-offs for each Question
Red
th
< 20 Percentile
Yellow
th
th
Aqua
th
th
>= 20 & < 50 Percentile >= 50 & < 80 Percentile
Green
Comments
th
>= 80 Percentile
Demands
3
Different groups at work demand things from me that are hard to combine
<3
>= 3 & < 4
>= 4 & < 4.95
>= 4.95
6
I have unachievable deadlines
<3
>= 3 & < 4
>= 4 & < 4.95
>= 4.95
9
I have to work very intensively
<2
>= 2 & < 3
None
>= 3
Not possible to set cut-offs for the 50 -80 percentile range
12
I have to neglect some tasks because I have too much to do
< 2.09
>= 2.09 & < 3
>= 3 & < 4
>= 4
Approx.
16
I am unable to take sufficient breaks
<3
>= 3 & < 4
>= 4 & < 4.95
>= 4.95
18
I am pressured to work long hours
<2
>= 2 & < 4
>= 4 & < 4.95
>= 4.95
Approx.
20
I have to work very fast
<2
>= 2 & < 3
>= 3 & < 4
>= 4
Approx.
22
I have unrealistic time pressures
<3
>= 3 & < 4
>= 4 & < 4.95
>= 4.95
Approx.
<3
>= 3 & < 4.95
None
>= 4.95
Not possible to set cut-offs for the 50 -80 percentile range
th
th
th
th
th
th
th
th
th
th
th
th
th
th
th
th
Control
2
I can decide when to take a break
10
I have a say in my own work speed
<3
>= 3 & < 4
>= 4 & < 4.95
>= 4.95
Approx.
15
I have a choice in deciding how I do my work
<2
>= 2 & < 3
>= 3 & < 4.95
>= 4.95
Approx.
19
I have a choice in deciding what I do at work
<3
>= 3 & < 4
>= 4 & < 4.95
>= 4.95
Approx.
25
I have some say over the way I work
<4
>= 4 & < 4.95
None
>= 4.95
Not possible to set cut-offs for the 50 -80 percentile range
30
My working time can be flexible
<2
>= 2 & < 4
>= 4 & < 4.95
>= 4.95
Approx.
<2
>= 2 & < 3
>= 3 & < 4.95
>= 4.95
Managers’ Support
8
I am given supportive feedback on the work I do
23
I can rely on my line manager to help me out with a work problem
<2
>= 2 & < 4
>= 4 & < 4.95
>= 4.95
29
I can talk to my line manager about something that has upset or annoyed me about work
<3
>= 3 & < 4
>= 4 & < 4.95
>= 4.95
33
I am supported through emotionally demanding work
<3
>= 3 & < 4
>= 4 & < 4.95
>= 4.95
35
My line manager encourages me at work
<3
>= 3 & < 4
>= 4 & < 4.95
>= 4.95
Peer Support
7
If work gets difficult, my colleagues will help me
<3
>= 3 & < 4
>= 4 & < 4.95
>= 4.95
24
I get help and support I need from colleagues
<4
>= 4 & < 4.95
None
>= 4.95
Not possible to set cut-offs for the 50 -80 percentile range
27
I receive the respect at work I deserve from my colleagues
<4
>= 4 & < 4.95
None
>= 4.95
Not possible to set cut-offs for the 50 -80 percentile range
31
My colleagues are willing to listen to my work-related problems
<4
>= 4 & < 4.95
None
>= 4.95
Not possible to set cut-offs for the 50 -80 percentile range
<4
>= 4 & < 4.95
None
>= 4.95
Not possible to set cut-offs for the 50 -80 percentile range
Relationships
5
I am subject to personal harassment in the form of unkind words or behaviour
14
There is friction or anger between colleagues
<3
>= 3 & < 4
None
>= 4
21
I am subject to bullying at work
<5
None
None
5
34
Relationships at work are strained
< 2.09
>= 2.09 & < 4
>= 4 & < 4.91
>= 4.91
Not possible to set cut-offs for the 50 -80 percentile range
th
Anything < 5 falls below 20 percentile
Role
th
th
th
th
th
th
th
th
th
th
1
I am clear what is expected of me at work
<4
>= 4 & < 4.95
None
>= 4.95
Not possible to set cut-offs for the 50 -80 percentile range
4
I know how to go about getting my job done
<4
>= 4 & < 4.95
None
>= 4.95
Not possible to set cut-offs for the 50 -80 percentile range
11
I am clear what my duties and responsibilities are
<4
>= 4 & < 4.95
None
>= 4.95
Not possible to set cut-offs for the 50 -80 percentile range
13
I am clear about the goals and objectives for my department
<4
>= 4 & < 4.95
None
>= 4.95
Not possible to set cut-offs for the 50 -80 percentile range
17
I understand how my work fits into the overall aim of the organisation
<4
>= 4 & < 4.95
None
>= 4.95
Not possible to set cut-offs for the 50 -80 percentile range
Change
26
I have sufficient opportunities to question managers about change at work
<2
>= 2 & < 4
>= 4 & < 4.95
>= 4.95
28
Staff are always consulted about change at work
<2
>= 2 & < 4
>= 4 & < 4.95
>= 4.95
Approx.
32
When changes are made at work, I am clear how they will work out in practice
<2
>= 2 & < 4
>= 4 & < 4.95
>= 4.95
Approx.
35
7 ACKNOWLEDGEMENTS
HSE owes thanks to the following organisations, who have kindly provided data to enable us
to update the benchmarks.
Health e-Solutions (http://www.health-e-solutions.co.uk) have provided one third of the data
used to gen erate the n ew benchmarks. This data was collected fro m organisations using
their StressMeter™ risk assessment system.
Data has also been kindly supplied by:
The University of Portsmouth, Psychology Department
(http://www.port.ac.uk/departments/academic/psychology/)
Health and Safety Executive, Northern Ireland (http://www.hseni.gov.uk)
36