1
COPYRIGHT C 1979 by
Technical Systems Consultants, Inc.
111 Providence Road
Chapel Hill, North Carolina 27514
All Rights Reserved
COPYRIGHT INFORMATION
This entire manual is provided for the personal use and enjoyment of the purchaser. Its
contents are copyrighted by Technical Systems Consultants, Inc., and reproduction, in
whole or in part, by any means is prohibited. Use of this program, or any part thereof,
for any purpose other than single end use by the purchaser is prohibited.
DISCLAIMER
The supplied software is intended for use only as described in this manual. Use of
undocumented features or parameters may cause unpredictable results for which Technical
Systems Consultants, Inc. cannot assume responsibility. Although every effort has been
made to make the supplied software and its documentation as accurate and functional as
possible, Technical Systems Consultants, Inc. will not assume responsibility for any
damages incurred or generated by such material. Technical Systems Consultants, Inc.
reserves the right to make changes in such material at any time without notice.
Table of Contents
1. Debug Tutorial
1
I. Introduction
1
II. The Simulated Computer
1
III. Whats in Memory?
3
IV. Simulating the Program
6
V. Breakpointing the Program
7
VI. Advanced Breakpoints
9
VII. Protect Your Memory
11
VIII. Trapping Those Bugs
13
IX. And There is Still More!
14
2. Command Descriptions 15
I. Introduction 15
II. General System Control
15
III. Memory Commands
20
IV. Simulation Control
22
V. Breakpoints
25
VI. Memory Protection
29
VII. Execution Traps
30
VIII. Interrupt Control
32
3. Command Summary
35
4. Message Descriptions
5. Getting Debug Running
37
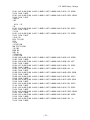
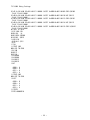
6. Example of Use
41
I. Sample Program Source
II. Sample Debug Session
7.
39
41
42
Adapting to Your System
47
I. I/0 References
47
II. I/0 Related Storage
47
III. Stack Pointer References
IV. Interrupt Vectors
48
V. Saving the Altered Program
48
48
- iii -
Preface
The TSC 6809 Debug Package is a powerful tool for assembler language
program debugging. It offers the power and flexibility of an expensive
hardware emulator at only a very small fraction of the cost! Used with
care, this package will save many hours when debugging programs.
It is recommended that the entire user’s manual be read before
attempting any serious debugging.
The ’Tutorial’ is written to provide a
fairly complete introduction to the Debug Package, while the ’Command
Descriptions’ is a complete and concise description of all Debug features
and commands.
Consult ’Getting Debug Running’ for details on how to get
the program started. Working through the example given in ’Example of
Use’ is a good place to start once the manual has been read.
- iv -
Debug Tutorial
I. Introduction
Program debugging is usually thought of as work.
It should be
thought of as an art.
There is no reason for a lot of crying while
attempting to make a new program do what was intended. This is only true,
however, if the program was designed with some forethought and planning.
Computer programs are executed in a logical, step by step, fashion.
This
is the approach both program writing AND debugging should take. So many
times a programmer will spend hundreds of hours, carefully planning the
flow of a new program but spend only a few minutes thought on a debugging
approach. The debugging is usually attempted in some haphazard, keep your
fingers crossed, method. Sometimes this works and sometimes it does not,
but in most cases, valuable time is wasted.
By using a debugging tool and by using some logical thinking, program
debugging can become very straight forward and sometimes even fun!
The
purpose of this tutorial is to introduce the reader to the capabilities of
the TSC 6809 Debug Package and offer some suggestions on how to tackle
those
program bugs.
The following sections give a more detailed
description of its capabilities.
II. The Simulated Computer
The TSC 6809 Debug Package is more than the name may imply.
It is,
in fact, a complete 6809 simulator. A computer simulator is a program
which when run, behaves exactly like the computer it is simulating. Given
6809 machine language, the simulator will perform the instructions as does
the actual 6809 CPU. There are two major differences, one being an
advantage, the second.being a disadvantage. First for the good news. The
simulator has the ability to keep close account of all internal actions.
For example, any illegal opcodes are quickly detected and reported. Such
things as stack overflow and underflow are also easily checked. Any byte
of memory may have an assigned protection type such as write protection.
General conditions may also be spotted such as the occurrence of a
transfer of address type instruction. Overall, the simulator can keep
close watch over the executing program and detect any peculiarities.
This all sounds great, but as stated before, there is a disadvantage
in the simulator, namely speed.
The simulated program runs somewhere
between 200 and 300 times slower than a real 6809 CPU. This means that
real-time dependent code may not be simulated.
This is not a serious
drawback since less than one-percent of all computer programs are real
time dependent.
- 1 -
TSC 6809 Debug Package
The 6809 simulator incorporated in the TSC 6809 Debug Package
supports all of the 6809 instructions. All of the user registers are also
provided (CC, A, B, DP, X, Y, U, S, and PC). To examine the contents of
these registers it is only necessary to type R followed by a carriage
return. This is assuming the Debug Package is ready to work indicated by
the two asterisk prompt ("**"). Typing the R command will cause the
debugger to display a line containing all register names followed by their
contents in hex. At the end of the line is the instruction to which the
program counter (P-register) currently points, and it is displayed in
disassembled form (standard Motorola mnemonics). A nonstandard register
is also displayed, the N register. This register’s value represents the
subroutine nest depth. Each time a subroutine is called, an interrupt
occurs, or the program counter is pushed on to the system stack, its value
is incremented; and each time a return from subroutine or return from
interrupt is executed, or the program counter is pulled from the system
stack, its value is decremented. The content of any of the displayed
registers may also be set by using the SET command. For example:
**SET,P=100,A=F3
will set the value of the PC to hex 100 and the value of the A register to
hex F3. There are several other registers and states of the simulated
machine. These can be viewed by typing MACH. The items displayed with
this command are primarily the states of various traps which will be
described a little later.
There are several other internal machine variables which may be
easily examined. One of these is the content of the system stack. Typing
STACK will display the top several bytes of the system stack.
If more
stack content is desired, simply type the number of items desired after
the command.
**STACK,15
This will display the top 15 bytes of the stack. Note that a comma was
used as a separator in the command line. It will be used in all examples
in this manual but a space is also acceptable and sometimes easier to
type. Another command which references the stack is the RET command. This
will print the top two bytes of the stack as an address and represents the
return address if currently in a subroutine.
The simulated machine always keeps track of where it has been and how
much time was spent there. The machine "states counter" is used to tally
the total number of machine states or cycles used so far by the executing
program.
Each 6809 instruction requires a certain number of machine
cycles to execute. If the CPU is running at 1 megahertz, each machine
state is equivalent to 1 microsecond.
The machine states counter is
capable of counting up to 99,999,999 cycles, or roughly 99.99 seconds of
actual program execution time. This counter is useful for determining the
exact execution time of a routine.
- 2 -
TSC 6809 Debug Package
The TRAIL command will print the address of the last transfer type
instruction. A transfer of address instruction is one which causes the CPU
to
change
its
normal course of instruction execution.
Normally
instructions are executed in a sequential fashion, stepping through memory
sequentially.
A JMP instruction for example will cause the next
instruction to be fetched from the address specified in the instruction,
rather than from the next sequential address.
In ffect, we have a
transfer of address. The TRAIL command will print the location of the
last transfer type instruction that was executed. This is very handy in
determining what caused a program to end up in memory where it did.
The simulated machine is capable of running in two different modes.
These are referenced as mode 1 and mode 0. In mode 1 (the default mode),
all checking and bookkeeping is performed. In mode 0, several of the
features are turned off in order to improve the speed performance of the
simulator. It is recommended that mode 1 always be used since it does the
most work for you and will catch more errors.
III.
Whats in Memory?
Now that the simulated CPU has been described we need to look at
memory. The TSC 6809 Debug Package offers several ways of examining the
contents of memory locations, as well as altering them. The simplest form
is the MEM command, or M for short. Typing M followed by an address will
display that byte of memory. For example:
**M,100
100 CE
shows that memory location hex 100 contains a hex CE. At this time
several choices are at hand. If all you wanted to do was check the
contents of location 100, simply type a carriage return and the debug
prompt will be issued. If you want to change the contents of 100, simply
type the new value followed by a "space". The "space" tells the debugger
that the new value is ready to be entered. It is only necessary to type
the significant digits of the new value to be entered. For example, if 6
was to be entered, simply type 6 followed by a space. It should be noted
that only the last two digits will be used so if "C23A" is typed, "3A"
will get entered. If zero is to be entered, simply type a space.
After
the new value is entered, the next sequential memory location will be
displayed. Any time a non-hex character is typed (with the exception of
space), one of two actions will occur. First if the character is a "line
feed", the previous location will be displayed, with the current location
left unchanged. If the character is any other hon-hex character, the next
location will be displayed leaving the current location unchanged. An
example will clarify the M command’s use.
**M,100
0100 CE
0101 3A 46
0102 4D
Location $100 was left unaltered, while location $101 was changed
- 3 -
from
a
TSC 6809 Debug Package
$3A to $46.
return.
Finally this mode was terminated on the next line by typing a
Many times while debugging it is desirable to examine a large block
of memory. The DUMP command is used for exactly that. This command will
display 16 lines of data, 16 bytes per line, for a specified memory
region. Each byte is displayed as a hex value as well as its ASCII
equivalent. All control characters (those bytes having a value less than
20 hex) are displayed as an underscore character "_".
To display 256
bytes starting at memory location $1000, the following command should be
typed:
**DUMP,1000
At the end of the dumped block, the program will stop and wait for a
character to be typed. Typing an "F" will move forward in memory,
printing the next sequential 256 bytes. In this example, typing an F
would display the block starting at $1100. It is also possible to display
the previous block of 256 bytes by typing a "B", for backward movement. A
carriage return will cause the debugger to regain control and the prompt
will be issued. Any other characters will be ignored. It should be noted
that any time the debugger is displaying data on the terminal, the display
may be stopped at the end of the line by typing an "escape" character.
Once stopped, another "escape" will resume the display, while a "return"
will give control back to the debugger.
Another useful memory interrogation command is the FIND command which
is used to find a specific string of bytes or characters in a selected
block of memory.
As an example, suppose there was a jump to subroutine
instruction somewhere in your program. It is known that the code is BD 34
00, and that it is somewhere between locations $100 and $300. The
following command line will find it.
**FIND,100,300,BD,34,00
This tells the debugger to look between memory locations hex 100 and 300
for the hex string "BD3400".
All memory locations which contain this
string will be displayed on the terminal. It is also possible to search
for an ASCII string.
Suppose it was necessary to find the character
string "ERROR 3" in memory. It should be somewhere between locations $200
and $1000. This can be done in the following way:
**FIND,200,1000,"ERROR 3
The double quote character tells the FIND command that the following
characters are to be considered ASCII characters instead of
hex.
Otherwise the command works as described above.
- 4 -
TSC 6809 Debug Package
So far the memory commands described have been oriented toward hex
and ASCII values. Many times during debugging it is necessary to decode
these hex values into assembler language instructions.
The DIS command
does exactly that! This command is a complete program disassembler which
allows the user to examine the contents of memory in a higher level form.
Each memory location in a specified block will be printed as address,
followed by the opcode mnemonic and addressing mode.
Standard Motorola
mnemonics and addressing mode designators are used. (Exceptions are the
PSHS, PSHU, PULS, and PULU instructions which are display as immediate
mode instructions to save space on the line during tracing.) To use the
disassembler, simply type the command name (DIS), followed by two address
boundaries.
For example, to disassemble the memory range between
locations 100 and 108, type the following.
**DIS,100,108
0100 LDA $32
0102 STA $0240
0105 BNE $0121
0107 DECA
0108 STA [$2,X]
Remember that at any time the display is being produced, the "escape" key
may be typed to temporarily halt the output.
Some instructions have two legitimate symbolic mnemonics, namely:
LSL/ASL, BCS/BLO, LBCS/LBLO, BCC/BHS, LBCC/LBHS. With these intructions,
the first of each of the above pairs is the mnemonic displayed by the
disassembler. Now that we can examine memory in a higher level form it
would be nice if we could alter it in the same way, that is, using
assembler language mnemonics. The ASM command does exactly that! It acts
as a line at a time assembler, allowing standard mnemonics and addressing
modes to be typed, while the corresponding hex values are automatically
inserted into memory. To start this process simply type the command name
(ASM) followed by the address where the code should be placed.
The
debugger will respond by printing the address of the location specified
followed by a space. At this time, simply type the desired instructions,
following each with a carriage return. The next available address will
then be printed and assembly can continue. Typing a carriage return in
response to the address prompt will exit this mode of operation. To show
the workings of this command, some code will be assembled at location
$200.
**ASM,200
0200 LDA #10
0202 LDB $10
0204 PSHS A,B
0206 LDA #’M
0208 STA 0,X+
020A LBRA $3000
020D
Note that numeric values are interpreted as decimal unless preceded by a
dollar sign ($) to designate hex. It is also possible to enter an ASCII
- 5 -
TSC 6809 Debug Package
constant by,preceding it with a single quote (’).
IV. Simulating the Program
Program simulation is very simple. If the test program starts at
$100, simply type START,100 to start the simulation process. The program
will run exactly as the CPU would run it, just slower. The START command
clears several of the machine conditions such as the states counter.
To
start a program where it left off, the GO command can be used. This will
cause the program to start execution at the location to which the program
counter (P-register) points. No states will be cleared.
A very valuable feature of the simulator is the "trace mode".
When
trace is enabled, a register dump (exactly like that produced by the R
command) will be displayed after each instruction is executed.
The
simulation may be temporarily halted by typing an "escape" character
anytime during the tracing operation. The simulation may also be stopped
by typing a "control C". This will cause the debug prompt to be reissued.
To enable the trace mode use the TRACE command.
**TRACE=10
This line will cause the debugger to trace all instructions which are in a
subroutine nest level of 9 or lower. The number in the command line
specifies the nest level where tracing should be disabled.
This allows
only the outermost program structure to be traced if desired, while the
deeper subroutines will be simulated without the tracing. To disable the
trace, use a count of zero (e.g. TRACE=0).
There are several other methods of starting program simulation.
One
is the SIM command. This command will allow the simulation of a specified
number of instructions. Tracing is disabled during the execution of this
command.
**SIM,100
This line will cause 100 instructions to be simulated starting at the
address to which the program counter points.
The TSIM command is
identical to the SIM command except trace is automatically set to 255
during the execution of the command.
It is often desirable to step through the execution of a program, one
instruction at a time. The STEP command will start simulation at the
instruction to which the program counter points, execute a specified
number of instructions, print a register dump, and then wait for input.
At this time, a space will repeat the process, while a return will return
control back to the debugger. The usual method of operation is "single"
step which will execute one instruction, then dump the registers. This
mode can be entered by:
- 6 -
TSC 6809 Debug Package
**STEP
Multiple instructions can be executed between register dumps by specifying
a count.
For example;
**STEP,25
will cause 25 instructions to be simulated at a time. The step mode is a
very powerful method for closely following the flow of a program.
During program execution, the simulator keeps track of the last 256
instructions executed. If a program ever goes off on its own, ending up
in memory where it should not, the PAST command can be used to examine the
instructions executed to get it there. Typing the command,
**PAST,20
will display the addresses
opcodes executed.
and
mnemonic
instructions
of
the
last
20
V. Breakpointing the Program
So far, methods have been described which allow all or a certain
number of instructions to be simulated. Most of the time, the number of
instructions to a certain point in the program is not known. It would be
helpful if a break in the program simulation could be specified to take
place
at a particular point in the program, or in other words,
breakpoints. A breakpoint is a mechanism for stopping the execution at a
specified address in the program. As an example, to set a breakpoint at
location $23A, use the following command.
**B@23A
As the program executes, any time location $23A is reached, simulation
will stop and the registers will be dumped to the terminal. After the
program has stopped, typing a "G" will restart execution, starting at
address $23A (the breakpoint will be temporarily ignored). It should be
noted that the method used to create the breakpoint does not alter the
contents of memory in any way.
This means that after setting a
breakpoint, the contents of memory at the breakpoint location will be
unchanged. This allows breakpoints to be set in ROM as well as RAM!
In the above example, the breakpoint caused two actions to take
place. One was printing the registers, the other was stopping program
simulation. These actions are the ones performed by most debugging
systems. The TSC 6809 Debug Package allows six other actions to be
performed upon the execution of a breakpoint. A list of all 8 possible
actions follow:
- 7 -
TSC 6809 Debug Package
1.
2.
3.
4.
5.
6.
7.
8.
R...Print register contents
T...Enable the trace function
U...Disable trace (untrace)
Z...Zero the states counter
H...Histogram counter
M...Print a message
J...Jump to specified address
S...Stop simulation
The first breakpoint example shown defaulted to R and S type actions since
none were specified.
The Z action zeroes the machine states counter.
This is useful for program timing. For an example, the states counter may
be zeroed upon entry to a subroutine and a stop type breakpoint set at the
exit point of the routine. By using the STATES command after the program
stops, the exact number of executed machine states for that routine will
be displayed.
The T and U actions allow the trace mode to be enabled and disabled
at selected points in a program. When enabled, trace will be set to level
255.
Many times, tracing is only desired during one routine or selected
portion of the program. These actions will permit this sort of program
tracing. A few examples will demonstrate action type breakpoints.
**B,RZ@1000
**B,T@A16
The first command will set a breakpoint at location hex 1000 which when
executed will print the registers and zero the states counter. The
program will then continue since a stop (S) action was not.specified. The
second example will cause trace to be turned on at location hex A16.
Another action is the histogram (H). A histogram counter counts the
number of times the instruction at that address has been executed. This
is useful for determining "hot spots" or sections of programs which are
executed very frequently. By setting a histogram breakpoint at the first
instruction of each subroutine in a program, it is possible to find out
exactly how many times each routine was called. As an example, suppose
there were three subroutines in a program, and they were located at $100,
$123, and $1A0.
To set histogram counters at these locations, type the
following commands:
**B,H@100
**B,H@123
**B,H@1A0
After simulating the program, typing HIST will display the totals of the
counters at each address. This command is used to examine the histogram
counters at any time. The CLH command is used to clear the histogram
counters.
**CLH,100
**CLH
The first command will clear (set to zero)
- 8 -
the
value
of
the
histogram
TSC 6809 Debug Package
counter at location 100.
The second command will zero all of the
counters. The histogram commands allow a very complete profiling of a
program, letting the user "fine tune" it for maximum speed.
The remaining two action codes are special purpose. One permits
a
selected message to be printed as the action, the second allows transfer
of control to a specified address (like a JMP instruction).
**B,M@325,SUB 1
**B,J@27C,1000
The first line will print the message "SUB 1" each time the instruction at
$325 is executed. The second command will cause the instruction at
address hex 1000 to be the next instruction executed. The instruction at
27C will not be executed!
Any combination of action codes may be listed for a breakpoint. They
are executed in the order they appear in the above list. For example,
**B,TRZ@300
will cause the registers to be displayed (R), trace to be enabled (T), and
the states counter to be zeroed (Z), in that order. This ordering may be
important, for in the actions "RSJ", the stop (S) will never get executed
since the J transfers control to another address. The M, J, and H type of
breakpoints are mutually exclusive. Only one of these may appear in any
one breakpoint statement.
VI. Advanced Breakpoints
Programs containing loops or recursion are often difficult to
breakpoint since one particular section of code may be called thousands,
or even millions of times. As an example, suppose there is a loop in the
program being debugged, and it is necessary to examine the contents of the
X register after the 600th time through the loop. One way is to set a
breakpoint at the desired instruction and start the program simulating.
Every time the program halts at the breakpoint, type G to restart it.
Repeat this process 600 times and you can examine X.
This is very
time-consuming. The TSC 6809 Debug Package allows a pass counter to be
associated with a breakpoint. This count determines how many times the
instruction at the address of the breakpoint should be executed before the
actions specified should be performed. In the above example, assuming the
instruction to be breakpointed is at address 300, the following will do
exactly what we want.
**B@300,>600
or
**B,SR@300,>600
Both commands are identical since the first defaults to SR actions.
The
">" is the pass count modifier and should be read as "after". The result
of this command is to stop and print the registers on the instruction at
location 300, after 600 times through it. Once the count reaches 600 (or
- 9 -
TSC 6809 Debug Package
whatever value was set), the breakpoint actions will always occur.
A
second similar type of pass count uses a "<" for a modifier and should be
read as "before". This is used to create a temporary breakpoint.
**B,R@300,<100
This command will set up a breakpoint at 300 which will print the
registers for the first 100 times through. After the 100th time, the
breakpoint will be cleared and no longer function. In summary, the pass
count value associated w ith a breakpoint is decremented each time the
instruction at the specified address is executed. If the modifier is a
">", no actions will be performed until "after" the count has reached
zero. With the "<" modifier, actions are only performed "before" the count
reaches zero, and once it is zero, the breakpoint is cleared.
In the above example it was decided that the program should be
stopped after 600 times through the loop. While debugging loops, it is
not always possible to determine an exact number of times to execute the
loop before it should be stopped. Often it is desirable to stop on a
certain condition, such as the contents of a register or the state of a
particular memory location.
Conditional expressions are allowed in
breakpoint definitions and provide a great deal of power. The conditional
can be determined on the contents of a selected register (CC, A, B, DP, X,
Y, U, S, N, or P) being equal (or not equal) to a specified value.
A
particular memory location may also be tested for zero or not zero.
Following are a few examples.
**B@1000,IF A=3F
**B,R@320,IF B!=10
**B,T@6A7,IF $20=0
The "IF" statement designates the conditional part of the breakpoint
definition. The first example will stop and print the registers at
location hex 1000 but only when the value in the A accumulator is hex 3F.
The second example will print the registers at 320 only if the contents of
the B register is not hex 10 ("!=" is to be read as "not equals").
The
last example will enable the trace mode at location 6A7 if the contents of
memory location hex 20 is zero. The dollar sign "$" is used to designate
a memory reference and not a hex value (the value is always interpreted as
hex). The value on the right of the equals sign must always be zero when
a memory reference has been designated.
The above breakpoint features may be combined in a variety of ways to
produce a large variety of breakpoint combinations. As an example:
**B,TZ@1000,>100,IF X=100
will cause trace to be enabled and the states counter to be zeroed, after
executing the instruction at hex 1000, 100 times, but then only if the
value of the index register is $100. It should be noted that the H, M,
and J action codes will not allow a conditional expression as part of the
breakpoint definition.
- 10 -
TSC 6809 Debug Package
Once breakpoints are set it is possible to examine the location of
them as well as remove them. To check the locations of breakpoints, use
the BP command.
**RP
**BP,100
**BP,100-500
The first line will print the location of all breakpoints, each one
followed by a list of its action codes. No pass counts or conditionals
are displayed. The second example will display the action codes of the
breakpoint at location hex 100 (if one exists). The last command line
will display all breakpoints between location 100 and 500, inclusive. The
CLB command is similar in syntax but is used to clear or remove a
breakpoint. CLB by itself will clear all breakpoints. If it is followed
by an address, the breakpoint at that address will be removed. If two
addresses are specified, then all breakpoints in their range will be
cleared,
While debugging very large programs, it may become quite time
consuming to simulate the program up to a desired address. For example, a
program which requires a minute to execute in real time may require over
an hour if simulated. To get around this problem, it is possible to set a
"real time" breakpoint. This is entirely different from the previously
described breakpoints in that it does modify the contents of memory (by
substituting a JMP instruction) and no pass counting or conditionals are
permitted. The only action performed is to stop and print the registers.
An example of use follows:
**RT,5A00
This command will cause the CPU to start executing the program (NOT the
simulator) at the current address of the program counter. When the
program reaches the specified address (5A00), the program will stop, print
the registers, and restore the contents of RAM at that location (remove
the breakpoint). Since the program is being executed in real time and not
being simulated, no other breakpoints, illegal condition checking, states
counting, or record keeping is performed. This type of execution is not
recommended for this reason and should only be used where the simulation
time gets tremendously long.
VII.
Protect Your Memory
Perhaps the most aggravating aspect of program debugging is having
your program destroy itself in memory. Too many times, programs "run
away", writing garbage in memory, usually exactly where it is not wanted.
In these instances, it would be nice to be able to "write protect" memory,
or at least certain portions of it. The TSC 6809 Debug Package will allow
exactly that!
In fact, any section of memory, right down to a single
byte, may be write, execute, memory, or simulate protected!
Write
protecting memory will prohibit any stores or writes into it. Execute
protection prohibits opcodes froin being fetched from memory. In other
words, the program counter (PC) will not be permitted to point to a
- 11 -
TSC 6809 Debug Package
location of memory which is execute protected. Memory protect is a brute
force type of protection.
By memory protecting a region, you are in
effect saying that no memory exists in this region and that nothing should
be allowed to reference it in any way. Any memory referenced in conflict
with its protection will cause the simulation to stop and an appropriate
message will be printed.
Finally, simulate protection is slightly
different from the rest. It is used to tell the simulator to execute any
code in a simulate protected region in real time, or in other words, not
simulated. A restriction requires the code in a simulate protected region
to be called as a subroutine (JSR, LBSR, or BSR) from the non-simulate
protected code. This is very convenient for I/O operations.
All I/O
routines can be simulate protected (such as terminal and disk routines)
allowing them to be executed by the CPU (real time) and not the simulator.
It is often convenient to simulate protect the entire region of memory
containing the monitor and/or operating system since this code is known
functional. Keep in mind that code in simulate protected memory may only
be accessed via a subroutine call.
The command used
demonstrate its use.
to
set
protection is PROT.
A few examples will
**PROT,100-3FF,X
**PROT,2E0,W
**PROT,500-6FF,M,1200-1FFF,W
The first example will execute (X) protect the memory between locations
$100 and $3FF.
The second line write protects (W) location $2E0. The
last example will memory protect (M) locations $500 through $6FF and write
protect $1200 through $1FFF.
There are some guidelines to follow when
protecting memory. Memory protection should be used on all sections of
memory not referenced or used by the program being debugged, especially,
the area of memory containing the Debug Package. This will keep a runaway
program from clobbering something it should not. Sections of memory which
are used for register storage
or flags should be execute protected.
Memory containing the actual program code should be write protected for
obvious reasons. Finally, as mentioned above, the memory locations where
the monitor and/or operating system reside should be simulate protected.
Once the protection has been defined it may be checked by using the
BOUNDS command. This command will allow the examination of the boundaries
of each type of protection. Either all types or selected ones may be
displayed.
**BOUNDS
**BOUNDS,W,M
The first example will display all types while the second will show only
the defined boundaries for write and memory protection. Memory protection
can be cleared in a similar fashion.
**CLP
**CLP,X,W
The
first
command
will
clear all protection while the second will only
- 12 -
TSC 6809 Debug Package
clear the defined execute and write protected regions.
VIII.
Trapping Those Bugs
The previously described breakpointing feature allows programs to be
stopped at specific locations and on specific conditions. It is often
desirable to "trap" a program on some general condition such as every time
a transfer of address instruction is encountered. The memory protection
described above is a form of trap in that the program will stop if a
protection violation is detected (e.g.
writing into write protected
memory). There is address information associated with this protection
which makes it different from the general traps available in the Debug
Package. The general traps cause programs to stop on a general condition
which is not address dependent.
One of these traps is the illegal
enabled. Any time an illegal opcode is
program simulation, the program will stop
second, always enabled trap will stop the
encountered and the current nest level is
opcode trap which is always
encountered during the course of
and report its occurrence.
A
program if an RTS instruction is
0.
There are several user controlled traps which may be enabled and
disabled at will. The transfer trap is enabled with the XFR command.
When enabled, the program will stop each time a transfer of address is
encountered. These instructions are JMP, LBRA, BRA, and all conditional
branches such as BCC. The subroutine calls and returns are not trapped
out.
**XFR=ON
**XFR=OFF
These two commands will enable and disable this trap respectively. Once a
program has stopped because of a transfer trap, typing G will restart it,
allowing the current transfer to be executed. This is very useful for
quickly following the major flow of a program. Another one of the general
traps allows halting the program if the subroutine nest counts reaches a
specified level.
**NEST=20
This will cause a trap if the nest level ever reaches 20.
nest trap, use NEST=0.
To disable
the
The last general trap to be discussed is the ITRAP.
This command
allows activation of the interrupt trap and will cause the simulating
program to stop if an interrupt type instruction is encountered (SWI,
SWI2, SWI3, RTI, SYNC, and CWAI). Since these instructions are not used
in the majority of programs it is a good idea to use this feature.
An
example will demonstrate its use.
- 13 -
TSC 6809 Debug Package
**ITRAP=ON
**ITRAP=OFF
These two commands
respectively.
will
enable
and
disable
the
interrupt
trap
IX. And There is Still More!
There are still many undescribed features of the TSC 6809 Debug
Package. One of these is the handy little CALC command which acts as a hex
calculator.
Typing CALC followed by a return will cause the debugger to
output an equals sign (=) for a prompt. At this time hex and decimal
addition and subtraction may be performed. To add two numbers simply type
them in separated by a plus sign. If the number is hex, precede it with a
dollar sign, otherwise the debugger will interpret it as decimal. Use a
minus sign for subtraction. It is also possible to do base conversions.
This can be accomplished by entering just one number after the prompt (hex
or decimal) followed by a return. All answers are displayed in both hex
and decimal. An example follows.
**CALC
=$1A+10-1
$0023 35
=256
$0100 256
=
After entering the calculator mode, the numbers hex 1A and decimal 10 were
added and then 1 subtracted to give the result hex 23 or decimal 35. The
second entry is a base conversion of the decimal number 256.
The result
shows its hex equivalent is $100. The calculator mode is terminated by
typing a return in response to the prompt.
There are still many other features in the Debug Package, such as
interrupt simulation, which have not been described.
It is not the
intention of this tutorial to teach all there is to know about the
debugger, but to teach enough to make the user feel comfortable with the
majority of its features. Once the material in this section is thoroughly
understood, the following detailed command description should be studied
in depth.
Now that the basic mechanics of the Debug Package are understood they
should be put to good use.
Keep in mind that a logical and planned
approach should be taken when debugging a program.
Use the available
tools such as memory protection and breakpoints. When first starting the
debug process on a new program, start at the beginning, working your way
through the flow of the program. Let the program be the guide. If you
pay close attention, it will definitely point out the bugs.
Above all,
have patience. Great bugs are not killed overnight!
- 14 -
TSC 6809 Debug Package
Command Descriptions
I.
Introduction
This section of the manual contains a detailed description of each
Debug command.
Each command is shown with a few examples. The syntax
definitions show optional items in square brackets ([]).
All command
parameters are shown separated by commas for clarity in the syntax
definitions and examples. Any place a comma is shown, a space may also be
used. The following definitions apply throughout this document:
ITEM
MEANING
<address>
<value>
<count>
1-4 digit hex value
decimal number (max = 255)
decimal number (max = 65,000)
The Debug Package is ready to accept a command anytime the "**"
prompt is present on the line. When typing commands, a "control H" will
cause a backspace, and delete the last character typed. A "control X"
will cause the entire line to be deleted and a new prompt of "??" will be
output to show the deletion of the line. Any time text is being output to
the terminal, display may be stopped at the end of a line by typing an
"escape" character.
Once stopped, another "escape" will restart the
output while a "return" will give control back to the debugger and the
"**" prompt will be output.
II. General System Control
The general system control commands allow a variety of general actions to
be performed. Register examination and changing is supported by use of
the REG and SET commands. The status of several machine control registers
can be obtained through the MACH command.
Commands to view the stack
contents,
set simulation speed, reset machine parameters, enter a
calculator mode, examine the " machine states counter", and exit the
debugger are all described in this section.
C[ALC]
PURPOSE:
The calculator mode will be entered and a "=" prompt will be
printed. The calculator will allow addition or subtraction of a
series of numbers. The numbers may be hex (designated by a "$"
prefix) or decimal. If more than one number is typed, they must
be separated by a "-" or "+" and the appropriate result will be
displayed. The answer is shown in both hex and decimal. It is
possible to enter only one number (hex or decimal), optionally
preceded by a unary "+" or "-", followed by a return. The answer
will be this number printed in both hex and decimal, thus allowing
base conversions.
After each calculation, a new "=" prompt will
- 15 -
TSC 6809 Debug Package
be output. To exit this mode, type a "return" as
the prompt.
EXAMPLES:
CALC
=$A+10-1
$0013 19
a
response
to
Enter calculator mode
Add hex A and 10 and subtract 1
The result is printed
DEL[AY]=<value>
PURPOSE:
This will set the simulation delay (the amount of delay after each
instruction is executed) to an amount proportional to <value>.
The higher the number (max = 255) the longer the delay.
A delay
of zero will result in the delay being turned off.
EXAMPLES:
DELAY=100
DELAY=0
Set delay to 100
Disable the delay
DEP[TH]
PURPOSE:
The depth command will print the deepest value of the stack
pointers (the lowest memory address at which the stacks were
extended during program simulation). To initialize this pointer,
it is necessary to set the stack pointers using the SET command.
The depth value will be set to the same value as the stack
pointer. This command is useful for determining the amount of
stack space required by a program.
EXAMPLES:
DEPTH
Print the deepest stack locations
E[XIT]
PURPOSE:
Exit the debug program.
Debug Package.
EXAMPLES:
EXIT
Use this command when finished
with
the
Exit the debugger
FL[AG][=<address>]
PURPOSE:
The Flag register is a 2 byte word at the specified memory
location which will be displayed on a REG command or during
tracing, as the "F" register. The memory location for the flag
will be set to the address specified. If no address is given, the
flag register will be disabled. This is useful for tracking flags
in memory during program tracing. See the REG command.
- 16 -
TSC 6809 Debug Package
EXAMPLES:
FLAG=1A85
FLAG
Set flag register to $1A85
Disable flag register printout
IND=ON or OFF
PURPOSE:
Used to enable or disable the indirection printout in a register
dump (see REG). If IND is ON, the register dump will show two
registers called "IX" and "IY" which are the.values contained in
the memory locations to which X and Y point, respectively.
If
this feature is off, the indirection registers will not be
displayed.
EXAMPLES:
IND=ON
IND=OFF
Turn indirection on
Turn it off
MA[CH]
PURPOSE:
The MACH command will print the current status of the simulated
machine. Values displayed are for mode (M), trace (T), instruction
count trap (I), nest trap (N), stop address (S), interrupt trap
(IT), transfer trap (XT), IRQ count (IRQ), FIRQ count (FIRQ), NMI
count (NMI), and flag address (F).
The description of these
appear elsewhere in this manual
EXAMPLES:
MACH
Print the machine status
MO[DE]=1 or 0
PURPOSE:
The debugger has two modes of operation, mode 0 and mode 1.
The
system comes up in mode 1.
Mode I offers all debug features
allowing the simulated program to run approximately 300 times
slower
than real time.
In mode 0, the program will run
approximately 200 times slower than real time, but the following
features are not supported; nest count checking, all traps, states
counting, memory protection, past instruction bookkeeping, and
automatic interrupts.
Mode 1 should be used most of the time to
take full advantage of the debugger.
EXAMPLES:
MODE=1
MO=0
Set mode to 1
Set mode to 0
- 17 -
TSC 6809 Debug Package
R[EG]
PURPOSE:
Print the contents of the machine registers. All values are shown
in hex. Besides the hardware registers (CC, A, B, DP, X, Y, U, S,
and PC), the nest level (N) is displayed (shows how deep in
subroutine calls) as well as three optional registers. Two are
enabled by the IND command and display the bytes to which the X
and Y registers point. These are shown as "IX" and "IY" in the
REG dump. The third register is enabled by the FLAG command and
will display the selected two bytes of memory. This is shown as
"F" in the dump. The instruction to which the program counter
points is also disassembled in the dump.
EXAMPLES:
REG
R
Display all registers
Display all registers
RES[ET]
PURPOSE:
The RESET command is used to reset all machine states. All
registers will be set to zero, the stack pointer will be set to
$C07F, all breakpoints and memory protection will be cleared, and
the mode will be set to 1. This will set up the machine exactly
the same as initializing the debugger upon first entry.
EXAMPLES:
RESET
Reset the machine
RET
PURPOSE:
Print the top two items on the stack. If the system is currently
in a subroutine, these bytes will represent the return address
from this routine. If the nest level is currently zero (N=0), the
message "NEST LEVEL IS 0" will be displayed.
EXAMPLES:
RET
Print the return address
S[ET],<register list>
PURPOSE:
The SET command is used to set or assign values to registers. The
<register list> is a list of register names (CC, A, B, DP, X, Y,
U, S, P) followed by an equals sign, followed by the hex value.
Setting a stack pointer will also set the corresponding depth
value to the same value.
- 18 -
TSC 6809 Debug Package
EXAMPLES:
SET,P=100,A=C3
S B=20 X=1FFF
Set PC to $100 and A to $C3
Set B to $20 and X to $1FFF
STACK[,<value>]
PURPOSE:
Print the contents of the system stack.
The number of bytes
specified
by <value> will be printed.
If <value> is not
specified, the top 12 bytes will be printed. The stack is printed
from high address to low address, so the top of stack will be the
last item printed.
EXAMPLES:
STACK
STACK,10
Print the top 12 stack bytes
Print the top 10 stack bytes
STAT[ES]
PURPOSE:
Display the current value of the states counter.
This value
represents the number of actual machine cycles (microseconds on a
1 megahertz computer) which have been executed since the last
START or RESET command. It is also possible to set this counter
to zero using breakpoints. Only states for simulated instructions
are counted; real-time and simulation protected routines do not
accumulates states.
EXAMPLES:
STATES
Print the current states count
TRAIL
PURPOSE:
Print the address of the last executed instruction which caused a
transfer of address (e.g. JMP instruction). This is useful when
attempting to find how a program ended up where it did.
EXAMPLES:
TRAIL
Print the last transfer address
X,<operating system command>
PURPOSE:
The X command is only operational on disk systems (see Adaptions).
It allows the execution of any DOS command from the debugger.
EXAMPLES:
X,CAT,1
Catalog drive 1
- 19 -
TSC 6809 Debug Package
III.
Memory Commands
The memory commands allow examining and altering the contents of memory in
a variety of ways. The assembler allows simple, direct insertion of
object code by using standard opcode mnemonics and addressing mode
designators. The disassembler provides an opposite type of convenience, in
that the
contents of memory may be displayed as assembler language
mnemonics and operands. A single byte memory examine and change function
is also available (the MEM command). Commands for viewing large blocks of
memory, finding specific hex or ASCII strings, and filling a section of
memory with a selected character are all available in this group.
A[SM][,<address>]
PURPOSE:
Enter the line at a time assembly mode. Assembly will start at
the address specified or at the location of the program counter if
no address is specified. No labels are permitted.
All standard
Motorola 6809 instruction mnemonics and addressing modes are
accepted; pseudo-ops are not allowed.
Memory references to
addresses lower than $100 are assembled as direct references
unless the address is preceded by a ">", which forces an extended
memory reference.
In indexed mode, the index register must be
preceded by a comma. Instructions of the form LDA X (meaning
LDA ,X) are not permitted.
The smallest possible offset is
generated for indexed mode.
Extended addressing and 16-bit
indexed offsets may be forced by placing a ">" character as the
first character of the operand. Constants, addresses, and offsets
may be either decimal or hexadecimal (indicated by a leading "$").
Eight-bit immediate mode constants may also be an ASCII character
preceded by a single quote (’). Negative numbers are not allowed.
Negative numbers should be entered as hex values; the CALC command
can be used to determine the negative of a number. For relative
branch and PC relative instructions, the actual target address is
specified; the assembler will calculate the offset. EXG, TFR,
PSHS, PSHU, PULS, and PULU accept standard register notation. The
PC is automatically advanced to the next location after the line
is assembled. To exit this mode, type a return in response to the
address prompt.
EXAMPLES:
ASM,100
100 LEAX $110,PCR
103 JSR [$F810]
107 LDA #’A
109 STA 0,Y+
10B BRA $100
10D
Start assembly at $100
(X)=Message Address
Print message
Load an ASCII "A"
Store it
Loop
Exit with return
- 20 -
TSC 6809 Debug Package
D[IS],<start address>,<stop address>
PURPOSE:
Disassemble memory between the addresses specified. The address,
mnemonic, and addressing mode will be printed out for each
instruction in the range. If an illegal opcode is found, four
stars (****) will be displayed instead of a mnemonic, followed by
the hex value found at that address.
EXAMPLES:
DIS,100,1A0
Disassemble from 100 to 1A0
DU[MP],<address>
PURPOSE:
Dump 256 byte blocks of memory starting at the address specified.
The memory is displayed 16 bytes per line, followed by the ASCII
values of the hex numbers. After each block is dumped, typing an
"F" will move Forward and,display the next 256 bytes, typing a "B"
will move Back and display the previous 256 bytes. Typing a
"return" will exit this mode.
EXAMPLES:
DUMP,A00
Dump memory at $A00
FIL[L],<start address>,<stop address>[,<byte>]
PURPOSE:
This command will fill memory with the <byte> (hex) specified
starting at the first address, filling through the second address.
If <byte> is not specified, zero will be used.
EXAMPLES:
FILL,100,300,FF
FILL,0,100
Fill with FF from 100 to 300
Clear from 0 to 100
FIN[D],<start address>,<stop address>,<string>
PURPOSE:
Find the specified string in memory. The search will start at the
<start address> and continue through the <stop address>.
The
address of each location where the string is found will be
displayed. The <string> can be entered in one of two ways.
The
first can be a string of hex digits separated by spaces or commas.
The second is an ASCII string preceded by a double quote
character.
EXAMPLES:
FIND,0,60,7E,33,A2 Find the hex value 7E33A2
FIND,0,1000,"TEST Find TEST in memory
- 21 -
TSC 6809 Debug Package
M[EM],<address>
PURPOSE:
Examine and alter memory.
The address specifies the first
location to be examined. Upon entering this command, the address
specified and its contents will be displayed on a new line. At
this time, typing any non-hex printing character will move to the
next location and display its contents. Typing a "line feed" will
move to the previous location. A carriage return will exit this
mode. To change the contents of a location, type the new hex value
immediately following the one displayed. After the value, type a
space. The new value will be entered and the next memory location
will be displayed. It should be noted that it is only necessary
to type the number of significant digits and only the last two
digits are used. For example, typing a 1 would enter 01, typing
1A2
would enter A2, etc. If only a space is typed (no number) a
zero will be entered. Any time a non-hex character is typed
(besides a space), the next location will be displayed, leaving
the current location unchanged.
EXAMPLES:
MEM,540
M,200
IV.
Examine memory at $540
Examine location $200
Simulation Control
This group of commands is used to control the program simulator. Code in
RAM or ROM may be simulated. There are several methods of initiating
simulation. Programs may be executed with "trace" on or off. While trace
is on, each instruction will be displayed prior to its execution, along
with the current state of the CPU (all register contents are displayed).
Trace provides a very powerful tool for following program flow.
Several
keyboard commands may be invoked during actual program simulation. These
commands allow the speeding up or slowing down of simulation, as well as
ways to halt the execution of the program. The PAST command is a powerful
bookkeeper which keeps track of where your program has been.
G[O]
PURPOSE:
Start the program executing at the location to which the program
counter currently points. No machine values are altered with this
command.
EXAMPLES:
GO
G
Start the simulation at the PC
Does the same thing
- 22 -
TSC 6809 Debug Package
J[UMP],<address>
PURPOSE:
This command is exactly like GO except execution will begin at the
address specified.
No machine values are altered with this
command, except the program counter which is set to <address>.
EXAMPLES:
JUMP,322
J,80
Start simulation at $322
Start simulation at $80
PA[ST][,<value>]
PURPOSE:
Display the past several instructions executed by the simulated
program. If <value> is not specified, the past 255 instructions
will be printed (oldest to most recent), otherwise <value> sets
the number of instructions to be displayed. Each instruction is
shown in a disassembled form, with its address.
EXAMPLES:
PAST
PAST,10
Display the past 255 instructions
Display the past 10 instructions
SIM[,<count>]
PURPOSE:
Simulate the number of instructions specified by <count> with the
trace disabled. If the count is not specified, one instruction
will be executed. Execution starts at the current PC. No machine
values are altered prior to simulation. Trace will be reset to
its original value following SIM"s termination.
EXAMPLES:
SIM
SIM,100
Simulate one instruction
Simulate 100 instructions
ST[ART],<address>
PURPOSE:
Start program simulation at the specified address. The PC will be
set to the address specified, the states counter will be zeroed,
and the nest count will be cleared.
EXAMPLES:
START,1000
ST,2A
Start simulation at $1000
Start simulation at $002A
- 23 -
TSC 6809 Debug Package
STEP[,<count>]
PURPOSE:
This command will cause the debugger to enter the "step" mode.
The <count> specifies how many instructions should be executed at
a time in this mode and defaults to one (single step). Upon
entering the STEP command, the system will immediately execute the
number of instructions specified by <count>, then print a register
dump. The execution will begin at the location pointed to by the
P register ( program counter). After the register dump, typing a
"space" will cause execution of the next <count> instructions and
produce another register dump. Typing a "return" will exit the
step mode. Any other character will be ignored.
It should be
noted that while in the step mode, breakpoints and tracing are
inoperable.
EXAMPLES:
STEP
STEP,10
Enter "single step" mode
Execute 10 instructions at a time
T[RACE]=<value>
PURPOSE:
Set the trace depth. If value is set to zero, trace mode will be
disabled.
Setting trace to a non-zero value will enable tracing
up to but not including the subroutine nest level indicated by
<value>. For example, if TRACE=2 is entered, tracing will occur at
nest level 0 and 1 but will be disabled at nest levels of 2 and
higher. The nest level is displayed as "N" in a register dump.
EXAMPLES:
TRACE=255
T=0
Enable trace at all levels
Disable trace mode
TS[IM][,<count>]
PURPOSE:
This command is similar to SIM except trace mode is enabled
(TRACE=255) and the registers will be
dumped
after
each
instruction simulated.
The count will default to 1 if not
specified. Trace will be reset to its original value following
TSIM’s termination.
EXAMPLES:
TSIM
TSIM,20
Trace and simulate 1 instruction
Trace 20 instructions
- 24 -
TSC 6809 Debug Package
"Control C"
PURPOSE:
Anytime a program is being simulated, a "control C" will cause the
execution to halt and the message " OP HALT AT XXXX" to be
displayed at the terminal.
This means "Operator Halt" and the
XXXX will be replaced by the actual address where the program was
halted.
"Escape Character"
PURPOSE:
During program tracing, typing an "escape" will cause the program
to pause at the end of the next displayed line. At this time,
typing another "escape" will enable the trace to restart, while
typing a "return" will return control back to the command entry
mode.
V. Breakpoints
Breakpoints allow the insertion of check points into a program.
A
breakpoint always has an address associated with it.
The address
specifies where in the program the breakpoint action should occur.
These
actions range from printing the machine registers to controlling trace
mode. Each breakpoint may also have a pass counter which determines the
amount of time until it becomes active, or the amount of time it should
remain active. The actions are also dependent on the result of a
conditional expression involving a CPU register or memory location.
Breakpoints are decoded with the following precedence. If the address of
the current PC matches the address of a breakpoint, then the pass count is
checked. If the counter is in a state to allow continuing, then the
condition is checked (if present). Finally the actions specified for the
breakpoint are performed. The other commands in this group allow clearing
breakpoints (removing them), printing histogram counter values, printing
breakpoint location and type, and clearing histogram counters.
B,<actions>@<address>[,<modifier><count>][,IF<condition>]
or
B@<address>[,<modifier><count>][,IF<condition>]
PURPOSE:
The B command is used to set breakpoints. These breakpoints are
nondestructive in that they do not alter the contents of memory at
the breakpoint location.
Two forms of the command exist. The
first is the general form of the command and allows user definable
breakpoint actions.
The <actions> may be any one or combination
of the following:
- 25 -
TSC 6809 Debug Package
R...Print register contents
T...Trace mode on
U...Trace mode off (untrace)
Z...Zero the states counter
H...Histogram counter
M...Print message
J...Jump to new address
S...Stop simulation
The above actions are executed in the order shown. A histogram
action causes a counter to be set up such that each time the
instruction at the address specified is executed, the counter will
be incremented by one. By later requesting a histogram, all of
the counters and their associated values will be displayed. The
second form of the B command is a special case of the first.
In
this form, no actions are specified, and they default to S and R
(just as if S and R were used in form one). The <count> part of
the syntax is optional and acts as a pass counter. The <modifier>
shown in the command description represents either a ">", used to
mean "after", and "<" to represent "before". A count preceded by
">" will cause the breakpoint defined on the line to remain
inactive until <count> number of times through that address. A
count preceded by "<" will cause the breakpoint defined to be
active for only the <count> number of times through that address,
at which time it will be automatically removed.
The <count> in
either case must not exceed 32,000. The next part of the syntax
is the optional <conditional>. This allows the breakpoint action
to be dependent on some condition.
The condition can be the
contents of any machine register being equal or not equal to a hex
value ("=" and "!=" respectively), or the contents of a specified
memory location being zero or not zero. If a register is used,
simply state the register name, followed by the relational,
followed by the hex value (e.g. A=23, or B!=E2,). The allowable
registers are: CC, A, B, DP, X, Y, U, 5, P, and N. To use a
memory location, a dollar sign "$" must precede the address.
For
example, $100=0 would check if the byte at location hex 100 was
zero, and $A20!=0 would check if the byte at location hex A20 was
not zero.
If a memory address is specified, the only allowed
value to the right of the relational is zero, and if any other
value is used, an error message is issued. NOTE: The conditional
part of the breakpoint definition may not be used with H, M, or J
action codes.
Two of the breakpoint actions require special
syntax. These are the M (message) and J (jump) types.
The M
action is used to print a specified message to the terminal upon
execution of the breakpoint. The J action is used to transfer
control to another address.
The M, J, and H breakpoints are
mutually exclusive. Only one of these may appear in a breakpoint
command.
A breakpoint containing M should have an ASCII string
following the <count> (or following the address if no count is
specified). This string is the message which will be printed on
the terminal each time the instruction is to be executed.
Messages should be kept short (under 5 letters if possible). For
the J type action, the hex address of the location of transfer
should be provided after the <count> field. The examples below
- 26 -
TSC 6809 Debug Package
will help clarify the syntax.
EXAMPLES:
B@100
B,SR@100
B,H@A100
B,ZR@300 >100
Stop and print registers at $100
Same as above
Set histogram at $A100
Zero states and print registers
after 100 times through $300
B@200,IF A=3C
Stop & print registers at $200
only if acc. A = $3C
B,M@210,SUB 1
Print message "SUB 1" every time
through location $210
B,J@100,1000
Transfer control to location $1000
when reach instruction at $100
B,TZ@400,<25,IF $20=0
For the first 25 times through
location $400, turn trace on and
zero the states counter, but only
if location $20 is zero.
BP[,<address>[-<address>]]
PURPOSE:
The BP command is used to print the location of breakpoints and
their associated action codes. The two address specifications are
used to define the region of memory for checking breakpoints
(beginning
and ending, respectively).
If no addresses are
specified, all breakpoints will be listed. If only one address is
given, then only the breakpoint at that address will be displayed
(if one exists). Only the action codes are listed with each
address.
EXAMPLES:
BP,10-C00
BP
List breakpoints between $10 & $C00
List all breakpoints
CLB[,<address>[-<address>]]
PURPOSE:
Clear breakpoints in specified memory region.
The addresses
define the region of memory. If only one address is listed, then
only the breakpoint at that location will be cleared. If no
addresses are specified, all breakpoints will be cleared.
EXAMPLES:
CLB
CLB,0-100
CLB,22A
Clear all breakpoints
Clear breakpoints between $0 & $100
Clear breakpoint at $22A
- 27 -
TSC 6809 Debug Package
CLH[,<address>[-<address>]]
PURPOSE:
Clear histogram counters in the specified memory region. The
addresses define the region of memory. If only one address is
listed, then only the histogram counter at that location will be
cleared. If no addresses are specified, all counters will be
declared. NOTE: This command does not remove the histogram
breakpoints, but clears its associated counter to zero
in
preparation for a new run.
EXAMPLES:
CLH
CLH,25-200
Clear all histogram counters
Clear counters between $25 & $200
CLM
PURPOSE:
Clear all messages in the breakpoint message table (used by the M
action code, see the B command). This table is a fixed size and
can be filled up. When deleting message type breakpoints using
the CLB command, the associated space in the message table does
not get freed.
It is recommended that whenever all M type
breakpoints have been cleared, also use the CLM command.
Do not
use this command if there are any active M type breakpoints.
Their message strings will be destroyed!
EXAMPLES:
CLM
Clear all messages
H[IST][,<address>[-<address>]]
PURPOSE:
Print the histogram counter totals for the section of memory
specified. The addresses define the region of memory. If only one
address is listed then only the counter at that location is
displayed. If no addresses are specified, all counter contents
will be displayed. Each counter is shown preceded by its address.
The counter value shows the number of times the instruction at
that address has been executed.
EXAMPLES:
HIST
H,0-200
Display all histogram counters
Display counters between 0 & $200
RT[,<address>]
PURPOSE:
Start real time program execution (not simulated) at the current
PC location.
Program execution will halt at the <address>
specified. This is similar to the standard breakpoint most users
are familiar with in that memory is actually altered at the
address specified (with a JMP instruction). Entering RT without
an address will clear any real time breakpoint which may have been
- 28 -
TSC 6809 Debug Package
previously entered. This type of breakpoint and program execution
is not recommended since no protection or checking is performed.
When
the program reaches the break address specified, the
breakpoint is automatically cleared and the original code restored
in memory. ROM may not be breakpointed with this command.
IMPORTANT NOTE: When the breakpoint is reached, the debugger will
push two bytes on to the system stack as it saves the program
registers. Therefore, the system stack must NOT be pointing to
data at the location of the breakpoint, and two bytes of stack
space MUST be available.
The stack is cleaned up once all
registers have been saved before return control to the user.
EXAMPLES:
RT,600
RT
Start at PC, end at $600
Clear an existing RT breakpoint
VI. Memory Protection
The-memory protection commands are a very powerful feature of the program
debugger.
The PROT command allows selected areas of memory to be write,
execute, memory, or simulate protected. Write protected memory will cause
a trap on any attempt to write to it. Execute protect will not allow
opcodes to be fetched.
Memory protect will not permit any type of
reference; read, write, or execute. Simulate protect is used to protect
sections of code which should not be simulated (executed in real time).
It is important that only code called as a subroutine from non-simulate
protected memory be contained in the area(s) of memory designated as
simulate protected.
An example would be to simulate protect the section
of memory where a DOS resides. All subroutine calls to the DOS would then
be executed in real time. Code which is simulate protected and does not
follow this convention will usually cause the CPU to take over the
execution of the program resulting in a loss of control. Other commands
in this group allow examination of protection bounds, as well as the
clearing of protection types.
BO[UNDS][,<types>]
PURPOSE:
Display the bounds of protected memory.
Each <type> specified
will list all regions of memory protected by that type. <type>
may be W, M, X, or S for write, memory, execute, and simulate,
respectively. Multiple types may be displayed by listing the types
on the command line separated by a comma or space. If no type is
specified, all types of protection will be listed.
EXAMPLES:
BOUNDS
BO,M,X
Display all memory protection
Display memory and execute
protection bounds
- 29 -
TSC 6809 Debug Package
CLP[,<type>]
PURPOSE:
Clear all protected regions for a specified type of protection.
The <type> is specified by the same letters described in BOUNDS.
Only one type may be listed per command line.
If type is not
specified, all protection will be cleared.
EXAMPLES:
CLP
CLP,X
Clear all protection
Clear execute protection
P[ROT],<address>[-<address>],<type>
PURPOSE:
The PROT command is used to assign protection to a region of
memory. The two <address> specifiers designate the beginning and
ending addresses of the selected region. If only one address is
specified, only the byte at that location will be protected.
The
<type> designator may either be M, X, W, or S for memory, execute,
write, and simulate protection respectively. Only one type may
appear with each address range.
Multiple protection may be
performed on one line by separating the range-type specifiers by a
comma or a space.
IMPORTANT NOTE: Simulate protected memory must be entered with a
subroutine call. The top two bytes of the stack MUST be a return
address. On exit from simulate protected code, the system stack
MUST have the same value as when the simulate protected code was
entered.
EXAMPLES:
PROT,0-100,M
Memory prot 0-$100
P,100,W,A100-A600,S
Write prot $100 and simulate
protect $A100-A600
VII.
Execution Traps
Execution traps allow program stopping on certain general conditions.
Several traps are always enabled. These include; trap on illegal opcode
and trap on RTS if nest count is zero. The user may enable and disable
several other traps. These traps are for interrupt type instructions,
transfer of address type instructions, trap on a selected subroutine depth
(nest count), an instruction count timeout, and a general "stop" address.
- 30 -
TSC 6809 Debug Package
INST=<count>
PURPOSE:
Set the instruction count timer to the value of count. If set to
zero, this trap will be disabled. This timer is used to count the
number of simulated instructions. Each time this counter reaches
zero, the program will halt and print "IC TIMEOUT AT XXXX", where
XXXX is the address where the program stopped, and the counter
will be reset to the value at which it started (the value
specified by <count>).
EXAMPLES:
INST=400
INST=0
Set counter to 400
Disable the intruction counter
IT[RAP]=ON or OFF
PURPOSE:
Turning the ITRAP on will cause the simulator to treat interrupt
type instructions similar to illegal opcodes.
Any time a RTI,
SWI, SWI2, SWI3, SYNC, or CWAI instruction is found, the message
"I TRAP AT XXXX" will be displayed.
The address of
the
instruction will be printed in place of the XXXX shown.
EXAMPLES:
ITRAP=ON
IT=OFF
Enable the interrupt trap
Turn off the trap
NC[ST]=<value>
PURPOSE:
Set the nest trap at the level specified by <value>. The
simulator will trap execution if a subroutine call instruction is
found which will cause the nest level to equal or exceed that set
by NEST. Setting the <value> to zero will disable this trap.
EXAMPLES:
NEST=6
N=0
Set nest trap to level 6
Disable nest trap
STOP=<address>
PURPOSE:
The STOP trap is a general "stop at address X" trap. It is useful
for trapping returns to monitor type programs or operating
systems. The trap is set at the address specified.
EXAMPLES:
STOP=100
STOP=E0D0
Set stop trap at $100
Set trap at a monitor entry
- 31 -
TSC 6809 Debug Package
XFR=ON or OFF
PURPOSE:
Enabling the XFR trap will cause a trap each time a transfer of
address type instruction is found (JMP, BRA, LBRA, LBxx, or Bxx).
This is useful for following major program flow.
Typing a "G"
command after this trap will cause the program to start executing
again.
EXAMPLES:
XFR=ON
XFR=OFF
VIII.
Enable the transfer trap
Turn the trap off
Interrupt Control
FIRQ, NMI, and IRQ type interrupts may be simulated. Two modes of
operation are possible.
The first is automatic, periodic interrupt
generation.
This
mode allows interrupts to be generated every N
instructions. The second allows random interrupt generation from the
keyboard. When these keys are typed during program simulation, the
appropriate interrupt will be issued.
Simulated interrupts advance the nesting level (N) as do subroutine calls.
The nesting level is decremented by the RTI instruction.
Simulated
interrupts, however, will not cause a nest level trap to occur if the
nesting limit is exceeded.
If a SYNC or CWAI instruction is being simulated, the simulation will stop
waiting for an interrupt to occur. If automatic interrupt generation is
enabled and the condition codes are set appropriately, simulated execution
will resume automatically.
If automatic interrupt generation is not
selected, a manual simulated interrupt must be entered from the keyboard
to continue simulation. A "control C" may be entered to return to command
mode while a SYNC or CWAI is waiting for an interrupt; however, restarting
simulation with a GO, SIM, TSIM, or JUMP will cause the debugger to
continue to wait for an interrupt regardless of where the program counter
is pointing. A START command can be used to continue simulation at some
other address and will clear the "waiting for interrupt" condition in the
debugger.
The 6809 Debug Package uses the interrupt vectors at $FFF2-$FFFD to
determine the location to which to transfer control when a simulated
interrupt is received. In most systems, these will point to routines in
the system monitor ROM which, in turn, will give control to some user
routine. These interrupt handlers in the system ROM must NOT be simulate
protected since they will be entered bn an interrupt, not a subroutine
call as is required for simulate protected code. It is possible to patch
the Debug Package so that simulated interrupts will not refer to the
standard vectors at $FFF2-$FFFD.
See the section on "Adapting to Your
System" for details.
- 32 -
TSC 6809 Debug Package
FIRQ=<count>
PURPOSE:
Cause an FIRQ type interrupt to be generated every <count>
instructions. If <count> is zero, automatic FIRQ interrupts will
be turned off.
EXAMPLES:
FIRQ=1000
FIRQ=0
Generate FIRQ every 1000 instructions
Turn off automatic FIRQs
IRQ=<count>
PURPOSE:
Cause an IRQ type interrupt to be generated every <count>
instructions. If <count> is set to zero, IRQ interrupts will be
turned off.
EXAMPLES:
IRQ=5000
IRQ=0
Generate IRQ every 5000 instructions
Turn off automatic IRQs
NMI=<count>
PURPOSE:
Cause an NMI type interrupt to be generated every <count>
instructions. If <count> is zero, automatic NMI interrupts will be
turned off.
EXAMPLES:
NMI=300
NMI=0
Generate NMI every 300 instructions
Turn off automatic NMIs
"Control F"
PURPOSE:
Typing a "control F" during program simulation will cause an FIRQ
type interrupt to be generated.
"Control I"
PURPOSE:
Typing a "control I" during program simulation will cause an IRQ
type interrupt to be generated.
"Control N"
PURPOSE:
Typing a "control N" during program simulation will cause an NMI
type interrupt to be generated.
- 33 -
TSC 6809 Debug Package
- 34 -
TSC 6809 Debug Package
Command Summary
I.
General System Control
C[ALC]
DEL[AY]=<value>
DEP[TH]
E[XIT]
F[LAG][=<address>]
IND=ON or OFF
MA[CH]
MO[DE]=O or 1
R[EG]
RES[ET]
RET
S[ET],<register list>
STACK[,<value>]
STAT[ES]
TRAIL
X,<FLEX system command>
II. Memory Commands
A[SM][,<address>]
D[IS],<start address>,<stop address>
DU[MP],<address>
FIL[L],<start address>,<stop address>[,<byte>]
FIN[D],<start address>,<stop address>,<string>
M[EM],<address>
III.
Simulation Control
G[O]
J[UMP],<address>
PA[ST][,<value>]
SIM[,<count>]
ST[ART],<address>
STEP[,<count>]
T[RACE]=<value>
TS[IM][,<count>]
- 35 -
TSC 6809 Debug Package
IV. Breakpoints
B,<action>@<address>[,<modifier><count>][,IF<condition>]
B@<address>[,<modifier><count>][,IF<condition>]
BP[,<address>[-<address>]]
CLB[,<address>[-<address>]]
CLH[,<address>[-<address>]]
CLM
H[IST][,<address>[-<address>]]
RT[,<address>]
V. Memory Protection
BO[OUNDS][,<types>]
CLP[,<type>]
P[ROT],<address>[-<address>],<type>
VI. Execution Traps
INST=<count>
IT[RAP]=ON or OFF
N[EST]=<value>
STOP=<address>
XFR=ON or OFF
VII.
Interrupt Control
FIRQ=<count>
IRQ=<count>
NMI=<count>
- 36 -
TSC 6809 Debug Package
Message Descriptions
The following is a list of all Debug generated messages and
respective meanings.
WHAT? = This is the general error message reported when an invalid
command has been entered.
their
input
"STOP" AT = The address set by the STOP trap command has been reached.
IC
TIMEOUT AT = The number of instructions specified by the INST trap
command have been executed.
ILLEGAL OPCODE
opcode.
I
AT = The instruction to which the PC points is an illegal
TRAP AT = An SWI, SWI2, SWI3, RTI, SYNC, or CWAI instruction has been
encountered and the ITRAP command has been used to enable the
interrupt trap.
LAST XFR FROM = Displayed by request using the TRAIL command. The address
gives the location of the last transfer of address type instruction
which was executed.
SYNTAX ERROR = The command just entered does not follow the syntax rules
for that command.
EP TRAP AT = An Execution Protect trap at the specified location resulting
from an attempt to execute code in execute protected memory.
WP TRAP AT = A Write Protect trap at the specified location resulting from
an attempt to write into write protected memory.
EX-MP
TRAP AT = An attempt to execute code residing in memory protected
memory has been detected at the specified address.
REF-MP TRAP AT = An attempt to reference (read or write) a byte in memory
protected memory has been detected at the specified address.
SP TRAP AT = A Stack Pointer reference (PSH, JSR, etc.) was attempted in a
section of memory which is memory protected.
TABLE
OVERFLOW = The last command entered caused an internal table to
overflow. The command did not get executed.
NC
TRAP AT = A Nest Count trap occurred as a result of the nest level
reaching the level specified in a NEST command.
- 37 -
TSC 6809 Debug Package
RTS
IN LEVEL 0 AT = An RTS instruction was encountered while the nest
level was 0 (no previous call to subroutine had been executed).
NEST
LEVEL IS 0 = There is no return address on the stack so the RET
command can not display an address.
XFR
TRAP AT = A transfer of address type instruction has been encountered
with the transfer trap enabled (from XFR=ON).
MON
XFR TO = The program being simulated tried to pass control to the
monitor address which is used by the EXIT command.
OP HALT AT = An operator halt signal (control C character) was detected by
the simulator.
- 38 -
TSC 6809 Debug Package
Getting Debug Running
I. Disk Version
The Debug Package loads from address $5500 through $7FFF and uses
memory down to $5000 for stack and variable storage.
The Debug Package
may be executed from FLEX by typing:
+++DEBUG
A "**" prompt should appear.
The program is started through its cold
start entry point (location $5500) which initializes all system tables,
clears all registers, and clears out breakpoints. If it is necessary to
re-enter the debugger after an EXIT command, the program should be entered
at location $5503, the warm start entry point. No clearing of values or
tables is performed at this entry. Once in the Debug Package, files may
be loaded from the disk by using the X command. As an example, to load
the file TEST.BIN, type the following:
**X,GET,TEST
If TEST is found, it will be loaded into memory. It is important that the
program being tested and the Debug Package do not overlap in memory. If
they do, the RUN utility (supplied on the Debug diskette) may be used to
load the Debug Package at some other address. For example, to load the
Debug Package at address $3500, type the following:
+++RUN 3500 DEBUG
The prompt should appear. Note, however, that the coldstart and warmstart
entry points will be different if the Debug Package is loaded at some
address other than its default load address. The coldstart entry point is
at the load address; the warmstart address is 3 locations higher. Be sure
to leave $500 bytes free below the Debug Package for stack and variable
storage.
II. Cassette Version
The object code supplied loads from address $5500 through $7FFF and
uses memory down to $5000 for stack and variable storage. The tape should
be loaded into memory using your monitor system’s load routine. Once
loaded, the program to be debugged should be loaded. It is important that
the two programs do not overlap in memory.
If they do, it will be
necessary to move the Debug Package to a location in memory such that the
two programs do not conflict. See the section below on "Moving the Debug
Package" for more information
After all code is resident in memory,
start the Debug Package at Location $5500, the cold start entry point. A
"**" prompt should appear. The cold start entry initializes all system
tables, clears all registers, and clears out breakpoints. If it is
necessary to re-enter the Debug Package after an EXIT command, the program
should be entered at location $5503, the warm start entry point. No
- 39 -
TSC 6809 Debug Package
clearing of values or tables is performed at this entry.
Moving the Debug Package
The Debug Package is written to be position independent; it may be
moved to any location in memory and it will run correctly without
modification. The following is an example of a program which moves the
Debug Package to another memory location.
8E
10
A6
A7
8C
25
7E
5500
8E xxxx
80
A0
8000
F7
yyyy
TAG
LDX #$5500
(X)=OLD ORIGIN
LDY #<new origin
address>
LDA
,X+
MOVE BYTE
STA
,Y+
CMPX
#$8000
CHECK ADDRESS
BLO
TAG
IF NOT DONE
JMP
<your monitor>
Insert the appropriate addresses for the "xxxx" and "yyyy". (Note that if
you are moving the Debug Package to a higher address, you should start at
the high end of the Debug Package and work downward.) After the Debug
Package has been moved, the cold start entry point is now at the <new
origin address> and the warm start entry point is 3 locations higher. For
example, if the Debug Package was moved to $1000, the cold start is at
$1000 and the warm start is at $1003. When moving the Debug Package, be
sure to leave $500 bytes free below it for stack and variables.
(The
stack may be moved independently of the Debug Package; see the section on
"Adapting to Your System" for details.)
- 40 -
TSC 6809 Debug Package
Example of Use
The following is an example debug session. It is assumed that the
Debug Package is running and the program being tested is resident in
memory. The sample program is shown first in its source listing form.
Following is the sample debug operation.
I. Sample Program Source Listing
*
* FIND THE MAX & MIN OF DATA LIST
*
0100
ORG
$0100
* STORAGE LOCATIONS
0100
0101
LARGE
SMALL
0200
RMB
RMB
1
1
ORG
$0200
LARGEST VALUE
SMALLEST VALUE
* PROGRAM STARTS HERE
0200
0203
0206
0208
020B
020D
0210
0212
0215
0218
021A
021D
0220
0222
8E
7F
86
B7
A6
Bl
24
B7
Bl
24
B7
8C
26
7E
0225
0100
FF
0101
80
0100
03
0100
0101
03
0100
022D
E9
CD03
MINMAX
LOOP
CONT2
CONT3
* DATA
0225 02 36 4C 20
0229 0C 57 37 06
022D
CD03
LDX
CLR
LDA
STA
LDA
CMPA
BCC
STAA
CMPA
BCC
STA
CPX
BNE
JMP
#DATA
LARGE
#$FF
SMALL
0,X+
LARGE
CONT2
LARGE
SMALL
CONT3
LARGE
#DATEND
LOOP
MON
POINT TO DATA STRING
PRESET MAX
ALSO
PRESET MINIMUM
GET DATA ITEM
ITEM > LARGE ?
UPDATE LARGE
ITEM < SMALL ?
UPDATE SMALL
END OF LIST?
IF NOT, REPEAT
RETURN TO MONITOR
LIST
DATA
FCB
2,54,76,32,12,87,55,6
DATEND
EQU
*
MON
EQU
$CD03
END
- 41 -
MONITOR EQUATE
TSC 6809 Debug Package
II.
Sample Debug Session
**DIS,200,222
0200 LDX #$0225
0203 CLR $0100
0206 LDA #$FF
0208 STA $0101
020B LDA ,X+
020D CMPA $0100
0210 BCC $0215
0212 STA $0100
0215 CMPA $0101
0218 BCC $021D
021A STA $0100
021D CMPX #$022D
0220 BNE $020B
0222 JMP $CD03
**PROT,200,22E,W
**BOUNDS,W
WRITE PROTECTION
0200-022E
**R
CC=00 A=00 B=00 DP=00
**START,200
MON XFR TO CD03
**M 100
0100 06 .
0101 FF
**SET P=200
**R
CC=04 A=06 B=00 DP=00
**IND=ON
**FLAG=100
**R
CC=04 A=06 B=00 DP=00
IX=48 IY=B9 F=06FF
**TSIM,10
CC=00 A=06 B=00 DP=00
IX=02 IY=B9 F=06FF
CC=04 A=06 B=00 DP=00
IX=02 IY=B9 F=00FF
CC=08 A=FF B=00 DP=00
IX=02 IY=B9 F=00FF
CC=08 A=FF B=00 DP=00
IX=02 IY=B9 F=00FF
CC=00 A=02 B=00 DP=00
IX=36 IY=B9 F=00FF
CC=00 A=02 B=00 DP=00
IX=36 IY=B9 F=00FF
CC=00 A=02 B=00 DP=00
IX=36 IY=B9 F=00FF
CC=01 A=02 B=00 DP=00
IX=36 IY=B9 F=00FF
X=0000 Y=0000 S=C07F U=0000 N=00 P=0000 ADCA $B9B9
X=022D Y=0000 S=C07F U=0000 N=00 P=0200 LDX #$0225
X=022D Y=0000 S=C07F U=0000 N=00 P=0200 LDX #$0225
X=0225 Y=0000 S=C07F U=0000 N=00 P=0203 CLR $0100
X=0225 Y=0000 S=C07F U=0000 N=00 P=0206 LDA #$FF
X=0225 Y=0000 S=C07F U=0000 N=00 P=0208 STA $0101
X=0225 Y=0000 S=C07F U=0000 N=00 P=O2OB LDA ,X+
X=0226 Y=0000 S=C07F U=0000 N=00 P=O2OD CMPA $0100
X=0226 Y=0000 S=C07F U=0000 N=00 P=0210 BCC $0215
X=0226 Y=0000 S=C07F U=0000 N=00 P=0215 CMPA $0101
X=0226 Y=0000 S=C07F U=0000 N=00 P=0218 BCC $021D
- 42 -
TSC 6809 Debug Package
CC=01 A=02 B=00 DP=00 X=0226 Y=0000 S=C07F U=0000 N=00 P=021A STA $0100
IX=36 IY=B9 F=00FF
CC=01 A=02 B=00 DP=00 X=0226 Y=0000 S=C07F U=0000 N=00 P=021D CMPX #$022D
IX=36 IY=B9 F=02FF
**B@218
**BP
0218 - SR
**G
CC=01 A=36 B=00 DP=00
IX=4C IY=B9 F=02FF
**TSIM
CC=01 A=36 B=00 DP=00
IX=4C IY=B9 F=02FF
**ASM,21A
021A STA $101
021D
**CLB
**START,200
MON XFR TO CD03
**M,100
0100 00 .
0101 02
**TRACE=40
**START,200
CC=00 A=06 B=00 DP=00
IX=02 IY=B9 F=0002
CC=04 A=06 B=00 DP=00
IX=02 IY=B9 F=0002
CC=08 A=FF B=00 DP=00
IX=02 IY=B9 F=0002
CC=08 A=FF B=00 DP=00
IX=02 IY=B9 F=00FF
CC=00 A=02 B=00 DP=00
IX=36 IY=B9 F=00FF
CC=00 A=02 B=00 DP=00
IX=36 IY=B9 F=00FF
CC=00 A=02 B=00 DP=00
IX=36 IY=B9 F=00FF
CC=01 A=02 B=00 DP=00
IX 36 IY=B9 F=00FF
CC=01 A=02 B=00 DP=00
IX=36 IY=B9 F=00FF
CC=01 A=02 B=00 DP=00
IX=36 IY=B9 F=0002
CC=09 A=02 8=00 DP=00
IX=36 IY=B9 F=0002
CC=09 A=02 B=00 DP=00
IX=36 IY=B9 F=0002
X=0227 Y=0000 S=C07F U=0000 N=00 P=0218 BCC $021D
X=0227 Y=0000 S=C07F U=0000 N=00 P=021A STA $0100
X=0225 Y=0000 S=C07F U=0000 N=00 P=0203 CLR $0100
X=0225 Y=0000 S=C07F U=0000 N=00 P=0206 LDA #$FF
X=0225 Y=0000 S=C07F U=0000 N=00 P=0208 STA $0101
X=0225 Y=0000 S=C07F U=0000 N=00 P=020B LDA ,X+
X=0226 Y=0000 S=C07F U=0000 N=00 P=020D CMPA $0100
X=0226 Y=0000 S=C07F U=0000 N=00 P=0210 BCC $0215
X=0226 Y=0000 S=C07F U=0000 N=00 P=0215 CMPA $0101
X=0226 Y=0000 S=C07F U=0000 N=00 P=0218 BCC $021D
X=0226 Y=0000 S=C07F U=0000 N=00 P=021A STA $0101
X=0226 Y=0000 S=C07F U=0000 N=00 P=O2ID CMPX #$022D
X=0226 Y=0000 S=C07F U=0000 N=00 P=0220 BNE $020B
X=0226 Y=0000 S=C07F U=0000 N=00 P=020B LDA ,X+
- 43 -
TSC 6809 Debug Package
CC=01 A=36 B=00 DP=00
IX=4C IY=B9 F=0002
CC=00 A=36 B=00 DP=00
IX=4C IY=B9 F=0002
CC=00 A=36 B=00 DP=00
IX=4C IY=B9 F=0002
CC=00 A=36 B=00 DP=00
IX=4C IY=B9 F=0002
CC=00 A=36 B=00 DP=00
IX=4C IY=B9 F=0002
OP HALT AT 021D
**DIS 20B 210
020B LDA ,X+
020D CMPA #$0100
0210 BCC $0215
**ASM 210
0210 BLS $215
0212
**T=O
**START 200
MON XFR TO CD03
**M 100
0100 57 .
0101 02
**B,H@200
**B,H@20B
**B,H@215
**B,H@21D
**BP
X=0227 Y=0000 S=C07F U=0000 N=00 P=020D CMPA $0100
X=0227 Y=0000 S=C07F U=0000 N=00 P=0210 BCC $0215
X=0227 Y=0000 S=C07F U=0000 N=00 P=0215 CMPA $0101
X=0227 Y=0000 S=C07F U=0000 N=00 P=0218 BCC $021D
X=0227 Y=0000 S=C07F U=0000 N=00 P=021D CMPX #$022D
0200 - H
020B - H
0215 - H
021D - H
**START,200
MON XFR TO CD03
**HIST
0200 - 0
020B - 8
0215 - 8
021D - 8
**STATES
STATES=00000116
- 44 -
TSC 6809 Debug Package
**DIS 200
0200 LDX
0203 CLR
0206 LDA
0208 STA
020B LDA
020D CMPA
0210 BLS
0212 STA
0215 CMPA
0218 BCC
021A STA
021D CMPX
0220 BNE
0222 JMP
**EXIT
223
#$0225
$0100
#$FF
$0101
,X+
$0100
$0215
$0100
$0101
$021D
$0101
#$022D
$020B
$CD03
- 45 -
TSC 6809 Debug Package
- 46 -
TSC 6809 Debug Package
Adapting to Your System
The following descriptions may prove helpful in adapting this program
to non-standard systems. All I/O and stack references are described
below.
I. I/O References
"Get One Character" at $5510. This jump vector references the standard
input character routine in the S-BUG monitor ROM.
It is an extended
indirect jump through the S-BUG transfer vector. Any input routine may be
used as long as it returns the ASCII character in the A accumulator with
the parity removed, and preserves the B and X registers.
"Put One Character" at $550C. This jump vector references the standard
output character routine in the S-BUG monitor ROM. It is an extended
indirect jump through the S-BUG transfer vector. Any output routine may
be used as long as it outputs the character from the A accumulator, and
preserves the B and X registers.
"System Monitor" at $5514. This jump vector references the starting entry
address of the S-BUG monitor ROM. It is an extended indirect jump through
the S-BUG transfer vector. This may be changed to the starting address of
your own monitor. This is the address used by the EXIT command.
"Check for Input Character" at $5518. This jump vector references the
routine which checks for a character having been entered from the
keyboard. It is an extended indirect jump through the S-BUG transfer
vector. Any check input character routine may be used as long as it
returns a "not equal" condition if a character has been entered, does not
input the character itself, and preserves the B and X registers.
II. I/0 Related Storage
BSP at $551C. This byte contains the character which is decoded as
backspace character (currently a Control H, $08). Change as desired.
the
DEL at $551D. This byte contains the character which is decoded as the
line cancel character (currently a Control X, $18). Change as desired.
BSE at $551E. This byte contains the character which will be echoed after
the receipt of a backspace character (currently a Control H, $08). If
this character is set to $08, a space will be output preceding the
backspace echo character.
Setting this byte to zero will inhibit the
backspace echo character.
ESC at $551F.
This byte contains the character which is decoded as the
Escape character (currently an ASCII Escape, $1B). This may be changed as
desired.
- 47 -
TSC 6809 Debug Package
III.
Stack Pointer References
The stack pointer is normally preset to the origin address of Debug
Package. To use a different area for the stack, load the system stack
pointer (S register) with the desired stack address and enter the Debug
Package at the origin address plus 6 ($5506) for cold start, and at the
origin address plus 9 ($5509) for warm start. The Debug Package requires
$500 bytes for stack space since it puts all variables and tables on the
stack.
IV. Interrupt Vectors
The Debug Package normally references the hardware interrupt vectors
located at $FFF2-$FFFD to determine those addresses to which to transfer
control when a simulated interrupt occurs. It is possible to patch the
Debug Package to reference other addresses in determining the location of
interrupt routines.
These patch points contain addresses of locations
which, in turn, contain the addresses of the interrupt handling routines.
Be sure to preserve this "double indirection" when modifying these patch
points.
NMI at $5520, default = $FFFC
SWI at $5522, default = $FFFA
IRQ at $5524, default = $FFF8
FIRQ at $5526, default = $FFF6
SWI2 at $5528, default = $FFF4
SWI3 at $552A, default = $FFF2
V. Saving the Altered Program
After modifications have been made to the program, it may be saved on mass
storage.
The program should be saved from $5500 through $7FFF. The
starting or transfer address is $5500.
- 48 -