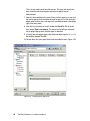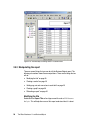
1
Front cover Tivoli Data Warehouse 1.2 and BusinessObjects jects Advanced reporting capability for Tivoli Data Warehouse Complete installation and usage examples Covers BusinessObjects Budi Darmawan Alexis Guinebertiere ibm.com/redbooks Redpaper International Technical Support Organization Tivoli Data Warehouse 1.2 and BusinessObjects June 2004 Note: Before using this information and the product it supports, read the information in “Notices” on page v. First Edition (June 2004) This edition applies to Tivoli Data Warehouse Version 1.2 and BusinessObjects. © Copyright International Business Machines Corporation 2004. All rights reserved. Note to U.S. Government Users Restricted Rights -- Use, duplication or disclosure restricted by GSA ADP Schedule Contract with IBM Corp. Contents Notices . . . . . . . . . . . . . . . . . . . . . . . . . . . . . . . . . . . . . . . . . . . . . . . . . . . . . . . v Trademarks . . . . . . . . . . . . . . . . . . . . . . . . . . . . . . . . . . . . . . . . . . . . . . . . . . . . vi Preface . . . . . . . . . . . . . . . . . . . . . . . . . . . . . . . . . . . . . . . . . . . . . . . . . . . . . . vii The team that wrote this Redpaper . . . . . . . . . . . . . . . . . . . . . . . . . . . . . . . . . vii Become a published author . . . . . . . . . . . . . . . . . . . . . . . . . . . . . . . . . . . . . . . viii Comments welcome. . . . . . . . . . . . . . . . . . . . . . . . . . . . . . . . . . . . . . . . . . . . . viii Chapter 1. Introduction to Tivoli Data Warehouse report integration . . . . 1 1.1 Business intelligence concepts . . . . . . . . . . . . . . . . . . . . . . . . . . . . . . . . . . 2 1.2 Tivoli Data Warehouse . . . . . . . . . . . . . . . . . . . . . . . . . . . . . . . . . . . . . . . . 3 1.3 Report generation . . . . . . . . . . . . . . . . . . . . . . . . . . . . . . . . . . . . . . . . . . . . 5 1.4 Reporting tools . . . . . . . . . . . . . . . . . . . . . . . . . . . . . . . . . . . . . . . . . . . . . . 7 Chapter 2. Business Objects . . . . . . . . . . . . . . . . . . . . . . . . . . . . . . . . . . . . . 9 2.1 Business Objects overview . . . . . . . . . . . . . . . . . . . . . . . . . . . . . . . . . . . . 10 2.1.1 Company overview . . . . . . . . . . . . . . . . . . . . . . . . . . . . . . . . . . . . . . 10 2.1.2 Products . . . . . . . . . . . . . . . . . . . . . . . . . . . . . . . . . . . . . . . . . . . . . . 10 2.2 Business Objects business intelligence platform . . . . . . . . . . . . . . . . . . . 12 2.2.1 Desktop components . . . . . . . . . . . . . . . . . . . . . . . . . . . . . . . . . . . . 12 2.2.2 Server components . . . . . . . . . . . . . . . . . . . . . . . . . . . . . . . . . . . . . . 12 2.3 Installing BusinessObjects desktop components . . . . . . . . . . . . . . . . . . . 13 2.3.1 Prerequisites . . . . . . . . . . . . . . . . . . . . . . . . . . . . . . . . . . . . . . . . . . . 13 2.3.2 Installation procedure . . . . . . . . . . . . . . . . . . . . . . . . . . . . . . . . . . . . 13 2.4 Configuring BusinessObjects for Tivoli . . . . . . . . . . . . . . . . . . . . . . . . . . . 14 2.4.1 Starting Designer . . . . . . . . . . . . . . . . . . . . . . . . . . . . . . . . . . . . . . . 15 2.4.2 Creating a new universe . . . . . . . . . . . . . . . . . . . . . . . . . . . . . . . . . . 15 2.4.3 Importing tables. . . . . . . . . . . . . . . . . . . . . . . . . . . . . . . . . . . . . . . . . 17 2.4.4 Creating joins between tables . . . . . . . . . . . . . . . . . . . . . . . . . . . . . . 19 2.4.5 Creating classes . . . . . . . . . . . . . . . . . . . . . . . . . . . . . . . . . . . . . . . . 19 2.4.6 Creating objects . . . . . . . . . . . . . . . . . . . . . . . . . . . . . . . . . . . . . . . . 20 2.4.7 Renaming and arranging objects . . . . . . . . . . . . . . . . . . . . . . . . . . . 21 2.4.8 Creating measure objects . . . . . . . . . . . . . . . . . . . . . . . . . . . . . . . . . 22 2.4.9 Creating a time hierarchy . . . . . . . . . . . . . . . . . . . . . . . . . . . . . . . . . 23 2.5 Using BusinessObjects . . . . . . . . . . . . . . . . . . . . . . . . . . . . . . . . . . . . . . . 23 2.5.1 Creating a simple report . . . . . . . . . . . . . . . . . . . . . . . . . . . . . . . . . . 24 2.5.2 Executing the query and answering the prompts . . . . . . . . . . . . . . . 27 2.5.3 Manipulating the report . . . . . . . . . . . . . . . . . . . . . . . . . . . . . . . . . . . 28 2.6 Advanced universes and documents . . . . . . . . . . . . . . . . . . . . . . . . . . . . 32 © Copyright IBM Corp. 2004. All rights reserved. iii 2.6.1 Advanced universe design . . . . . . . . . . . . . . . . . . . . . . . . . . . . . . . . 32 2.6.2 Advanced reporting with BusinessObjects . . . . . . . . . . . . . . . . . . . . 33 2.6.3 Security and deployment with Supervisor . . . . . . . . . . . . . . . . . . . . . 34 2.7 Deploying BusinessObjects. . . . . . . . . . . . . . . . . . . . . . . . . . . . . . . . . . . . 34 2.7.1 The repository . . . . . . . . . . . . . . . . . . . . . . . . . . . . . . . . . . . . . . . . . . 34 2.7.2 Deploying to Web users . . . . . . . . . . . . . . . . . . . . . . . . . . . . . . . . . . 36 2.7.3 Deploying documents to large number of users . . . . . . . . . . . . . . . . 36 Index . . . . . . . . . . . . . . . . . . . . . . . . . . . . . . . . . . . . . . . . . . . . . . . . . . . . . . . . 37 iv Tivoli Data Warehouse 1.2 and BusinessObjects Notices This information was developed for products and services offered in the U.S.A. IBM may not offer the products, services, or features discussed in this document in other countries. Consult your local IBM representative for information on the products and services currently available in your area. Any reference to an IBM product, program, or service is not intended to state or imply that only that IBM product, program, or service may be used. Any functionally equivalent product, program, or service that does not infringe any IBM intellectual property right may be used instead. However, it is the user's responsibility to evaluate and verify the operation of any non-IBM product, program, or service. IBM may have patents or pending patent applications covering subject matter described in this document. The furnishing of this document does not give you any license to these patents. You can send license inquiries, in writing, to: IBM Director of Licensing, IBM Corporation, North Castle Drive Armonk, NY 10504-1785 U.S.A. The following paragraph does not apply to the United Kingdom or any other country where such provisions are inconsistent with local law: INTERNATIONAL BUSINESS MACHINES CORPORATION PROVIDES THIS PUBLICATION "AS IS" WITHOUT WARRANTY OF ANY KIND, EITHER EXPRESS OR IMPLIED, INCLUDING, BUT NOT LIMITED TO, THE IMPLIED WARRANTIES OF NON-INFRINGEMENT, MERCHANTABILITY OR FITNESS FOR A PARTICULAR PURPOSE. Some states do not allow disclaimer of express or implied warranties in certain transactions, therefore, this statement may not apply to you. This information could include technical inaccuracies or typographical errors. Changes are periodically made to the information herein; these changes will be incorporated in new editions of the publication. IBM may make improvements and/or changes in the product(s) and/or the program(s) described in this publication at any time without notice. Any references in this information to non-IBM Web sites are provided for convenience only and do not in any manner serve as an endorsement of those Web sites. The materials at those Web sites are not part of the materials for this IBM product and use of those Web sites is at your own risk. IBM may use or distribute any of the information you supply in any way it believes appropriate without incurring any obligation to you. Information concerning non-IBM products was obtained from the suppliers of those products, their published announcements or other publicly available sources. IBM has not tested those products and cannot confirm the accuracy of performance, compatibility or any other claims related to non-IBM products. Questions on the capabilities of non-IBM products should be addressed to the suppliers of those products. This information contains examples of data and reports used in daily business operations. To illustrate them as completely as possible, the examples include the names of individuals, companies, brands, and products. All of these names are fictitious and any similarity to the names and addresses used by an actual business enterprise is entirely coincidental. COPYRIGHT LICENSE: This information contains sample application programs in source language, which illustrates programming techniques on various operating platforms. You may copy, modify, and distribute these sample programs in any form without payment to IBM, for the purposes of developing, using, marketing or distributing application programs conforming to the application programming interface for the operating platform for which the sample programs are written. These examples have not been thoroughly tested under all conditions. IBM, therefore, cannot guarantee or imply reliability, serviceability, or function of these programs. You may copy, modify, and distribute these sample programs in any form without payment to IBM for the purposes of developing, using, marketing, or distributing application programs conforming to IBM's application programming interfaces. © Copyright IBM Corp. 2004. All rights reserved. v Trademarks The following terms are trademarks of the International Business Machines Corporation in the United States, other countries, or both: Eserver® Redbooks (logo) ibm.com® pSeries® ™ z/OS® DB2 Universal Database™ DB2® IBM® Redbooks™ Redbooks (logo)™ Tivoli Enterprise™ Tivoli® The following terms are trademarks of other companies: Microsoft, Windows, Windows NT, and the Windows logo are trademarks of Microsoft Corporation in the United States, other countries, or both. Other company, product, and service names may be trademarks or service marks of others. vi Tivoli Data Warehouse 1.2 and BusinessObjects Preface This IBM® Redpaper will guide you on using various reporting tools that are available in the market to work with the data you collect with Tivoli Data Warehouse. The collected data resides on a DB2® database with the form or star schema. The basic Tivoli Data Warehouse product comes with an integrated reporting tool. However, the reports provided with the product may not be sufficient for all your reporting needs. You may want to expand the reporting capability of the Tivoli Data Warehouse with vendor reporting tools. This Redpaper discusses the reporting tools of the Business Objects® company that can be used with the Tivoli Data Warehouse data. Business Objects is a leading business intelligence software company. The discussion of each vendor reporting tool should not be considered to replace the respective vendor product manual. The examples provided in this Redpaper serve as a quick reference for starting to use Business Objects’ reporting tools. Note: You will see throughout this document both the terms Business Objects (two words with a space separating them), and BusinessObjects™ (one word). Business Objects (two words) is the company name. BusinessObjects (one word) is the product name. The team that wrote this Redpaper This Redpaper was produced by a team of specialists from around the world working at the International Technical Support Organization, Austin Center. Budi Darmawan is a Consulting IT Specialist at the International Technical Support Organization, Austin Center. He writes extensively and teaches IBM classes worldwide on all areas of systems management with Tivoli®. Before joining the ITSO five years ago, Budi worked in IBM Indonesia’s Global Services division as a solution architect and lead implementer. His expertise is in Tivoli availability products, business service management, business intelligence, and z/OS® management. Alexis Guinebertiere is a service specialist from the Business Objects company. © Copyright IBM Corp. 2004. All rights reserved. vii Thanks to the following people for their contributions to this project: Karen Matthews International Technical Support Organization, Raleigh Center Terri Buchanan, Warren Gill, Mike Mallo IBM Software, Tivoli Systems Become a published author Join us for a two- to six-week residency program! Help write an IBM Redbook or Redpaper dealing with specific products or solutions, while getting hands-on experience with leading-edge technologies. You'll team with IBM technical professionals, Business Partners and/or customers. Your efforts will help increase product acceptance and customer satisfaction. As a bonus, you'll develop a network of contacts in IBM development labs, and increase your productivity and marketability. Find out more about the residency program, browse the residency index, and apply online at: ibm.com/redbooks/residencies.html Comments welcome Your comments are important to us! We want our papers to be as helpful as possible. Send us your comments about this Redpaper or other Redbooks™ in one of the following ways: Use the online Contact us review redbook form found at: ibm.com/redbooks Send your comments in an Internet note to: [email protected] Mail your comments to: IBM Corporation, International Technical Support Organization Dept. 0SJB Building 003 Internal Zip 2834 11400 Burnet Road Austin, Texas 78758-3493 viii Tivoli Data Warehouse 1.2 and BusinessObjects 1 Chapter 1. Introduction to Tivoli Data Warehouse report integration This chapter introduces the concept and content of this Redpaper. The discussion is divided into: 1.1, “Business intelligence concepts” on page 2 1.2, “Tivoli Data Warehouse” on page 3 1.3, “Report generation” on page 5 1.4, “Reporting tools” on page 7 © Copyright IBM Corp. 2004. All rights reserved. 1 1.1 Business intelligence concepts Tivoli Data Warehouse (TDW) provides data warehousing capability for IBM Tivoli products to store its data, provide historical information, and generate reports. These features are based on IBM DB2 Universal Database™ business intelligence capability. In this section, we discuss the basic concept of data warehousing that is necessary to understand the Tivoli Data Warehouse. The basic ideas of business intelligence are: Data from various sources needs to be consolidated into a central location. This location is typically called a data warehouse. The centralized approach is preferable because it provides the opportunity to perform data correlation, enrichment, and standardization. Reporting of collected data is performed using a specialized database that is optimized for reporting called a data mart. This database is constructed from the information from the data warehouse. The data warehouse then becomes the master database, while each reporting function uses a specific data mart optimized for its own purpose. The following terms are helpful in understanding business intelligence: 2 Data warehouse A collection of data from various sources that acts as the master copy of information Data mart A specialized database for a specific reporting purpose ETL process Extract, transform, load - indicates how data should be processed into the data warehouse or data mart Metadata Additional information that is not directly related to the measurement values but is used in the building of the data by the ETL process and other reporting tools Star schema A typical data mart structure consisting of one table in the middle connected to various tables in a star-like formation Fact table The central table of a star schema, containing all the measurement values of the reported object Dimension table A table containing the hierarchical attributes (from general to detailed) that can be applied to values in the fact table OLAP cube Online analytical process that converts the star schema into a prepopulated, multidimensional cube for faster reports generation with huge amounts of data Drill-down The action of getting more detailed information for a specific dimension Tivoli Data Warehouse 1.2 and BusinessObjects Slice and dice The action of retrieving other dimension data or moving from one view to another in the same dimension to get more meaningful information Data mining An automated process to determine trends and correlations of various data components We discuss more on the star schema structure in 1.3, “Report generation” on page 5. 1.2 Tivoli Data Warehouse The Tivoli Data Warehouse collects data from various IBM Tivoli products and puts them in a consolidated central data warehouse. Each IBM Tivoli product provides a set of warehouse enablement packs to interface with the Tivoli Data Warehouse. The warehouse enablement pack typically contains: Schema information of the source data Additional table requirement in the data warehouse Specific data mart(s) to be built ETL processes to load data: – into the data warehouse – into the data mart(s) Canned reports to display data from the data mart(s) Required metadata that identify the product The Tivoli Data Warehouse product has several different components. The configuration is shown in Figure 1-1 on page 4. Chapter 1. Introduction to Tivoli Data Warehouse report integration 3 Tivoli Data Warehouse System Management data TWS TDW Control Center Warehouse metadata TEC ETL1 NetView ETL2 Central Data Warehouse ITM TDW Database Server Data mart Reporting user Business Intelligence tools Figure 1-1 Tivoli Data Warehouse components Figure 1-1 shows how machines can be configured using the Tivoli Data Warehouse: The TDW Database Server contains the DB2 Universal Database server engine and warehousing tools. The Tivoli Data Warehouse software is also installed here. The TDW Control Center uses the DB2 Control Center and DB2 Data Warehouse Center to provide a graphical interface to manage data collection and ETL processes. This machine runs the DB2 administration client. Note: Another component that is not shown in the figure is the Tivoli Data Warehouse reporting server that runs a canned version of Crystal Enterprise. This is a Web server that provides reports to end users for the data in the data mart. In Tivoli Data Warehouse, data sources are provided by the individual system management applications. These data sources are loaded into the central data warehouse using an ETL that is called ETL1 or source ETL. Data are then transferred into the data mart using an ETL that is called ETL2 or target ETL. All the information on ETL processes are stored in the control database that is managed by the control center. 4 Tivoli Data Warehouse 1.2 and BusinessObjects The default database names are: TWH_MD Metadata database that contains the control information TWH_CDW Central data warehouse that is the master copy of all system management data TWH_MART Star schema database that contains the data marts for reporting purposes For this Redpaper, we focus on the TWH_MART database. 1.3 Report generation Reports are typically generated from star schema. Star Schema is a preferred method for reports generation. In Figure 1-2, we use sales revenue data to illustrate the concept. Dimension 1: TIME TimeID Year Month Dimension 2: LOCATION LocationID Country State Fact Table: SALES TimeID LocationID ProductID SalesValue Dimension 3: PRODUCT ProductID ProductGroup Figure 1-2 Sample star schema The central table is the fact table. It contains the individual sales values for each time unit, location, and product. The granularity of data in the fact table depends on the granularity of the categorization hierarchy of the dimension tables. As shown in Figure 1-2, there are three dimensions of this data: The time dimension indicates the time frame in which the revenue is collected. It is configured as year, month. Chapter 1. Introduction to Tivoli Data Warehouse report integration 5 The location dimension indicates the geographical location where the revenue is collected. It is configured as country, state. The product category indicates the product line breakdown of the revenue. It is configured as group, brand. Note: There can be more than two levels of hierarchy in the dimension. The illustration here only shows two levels for simplicity. We assume that the following data are available: Time range: from October 2003 - March 2004 Locations: Australia - NSW, Australia - West, U.S. - California, U.S. - Texas, U.S. - New York Products: Printer, Computer, Scanner Then we can visualize the data as a cube as shown in Figure 1-3. Each box in the diagram represents a single sales revenue data element. 2003 Oct Nov US NY CA TX 2004 Dec Jan Feb Printer Scanner Computer Australia VIC NSW WA Figure 1-3 Sample cube A sample report can be generated to retrieve the answer to a question such as: What is the revenue by product for Australia in 2003? The answer to this question is represented by the shaded cubes shown in Figure 1-4 on page 7. 6 Tivoli Data Warehouse 1.2 and BusinessObjects 2003 Oct Nov 2004 Dec Jan Printer NY US Feb Scanner CA Computer TX Australia VIC NSW WA Figure 1-4 Sample cube - answer to business question From the subset shown in Figure 1-4, we can manipulate the report in several ways to get more meaningful information. Some of the better known techniques are: Drill-down: breaking data down into a more detailed level such as by state or month Slice and dice: changing the way data is sorted and viewed for comparison purposes such as comparing computers sold in Austrailia in 2003 with revenue from the U.S. in the same year 1.4 Reporting tools This document is divided into chapters based on the reporting tools that are explored. Chapter 2, “Business Objects” on page 9 discusses the reporting tools from Business Objects®, a leading business intelligence software company. Chapter 1. Introduction to Tivoli Data Warehouse report integration 7 8 Tivoli Data Warehouse 1.2 and BusinessObjects 2 Chapter 2. Business Objects This chapter describes the reporting tools from the software vendor, Business Objects, for use in accessing the Tivoli Data Warehouse. Rather than focusing on the technical deployment of Business Objects’ platforms and servers, this chapter focuses on the reporting capabilities of Business Objects’ software products. In particular, we take you step by step through the company’s Designer and BusinessObjects products to help you get started creating your own reports in the Tivoli Data Warehouse quickly and easily. The sections in this chapter are: 2.1, “Business Objects overview” on page 10 2.2, “Business Objects business intelligence platform” on page 12 2.3, “Installing BusinessObjects desktop components” on page 13 2.4, “Configuring BusinessObjects for Tivoli” on page 14 2.5, “Using BusinessObjects” on page 23 2.6, “Advanced universes and documents” on page 32 2.7, “Deploying BusinessObjects” on page 34 © Copyright IBM Corp. 2004. All rights reserved. 9 2.1 Business Objects overview This section introduces Business Objects as a company, as well as its product line called BusinessObjects Enterprise 6.0. 2.1.1 Company overview Business Objects was created in 1990. It has now more than 18,000 customers in over 80 countries. Business Objects’ products and services help 86 global Fortune 100 companies to track, understand, and manage their businesses. Business Intelligence is the technology that enables companies to leverage and transform data stored in corporate databases into business information. 2.1.2 Products Business Objects’ integrated business intelligence product suite is called BusinessObjects Enterprise 6.0. Figure 2-1 on page 10 shows BusinessObjects Enterprise 6.0 suite of products. Figure 2-1 BusinessObjects Enterprise 6.0 10 Tivoli Data Warehouse 1.2 and BusinessObjects BusinessObjects Enterprise 6.0 covers the following areas: Data Integration, Business Intelligence Platform, Query Reporting and Analysis, Analytic Applications, and Information Delivery. These areas are explained in Table 2-1. Table 2-1 Areas covered by BusinessObjects Enterprise 6.0 Area Description Data Integration Business Objects data integration products include all the features of extract, transform, and load (ETL) tools, plus bidirectional and real-time data movement, packaged data marts, and automatic Business Objects universe management. Business Intelligence Platform Business Objects offers all of the administration products you need to maintain optimal system performance while keeping costs down. Use the administration products to manage user activity, deploy Business Intelligence products across the enterprise, and tailor Business Intelligence solutions to fit evolving user needs. Do all of this from a centralized security and administration system supported by the integrated BusinessObjects Enterprise 6.0 platform, lightening the workload on the IT department. Query Reporting and Analysis BusinessObjects Enterprise 6.0 makes it easy for companies to quickly and efficiently track, understand, and manage the wealth of knowledge stored in multiple data sources. Using the integrated query, reporting, and analysis products, you can access the information you need, analyze it, and share standardized reports across the enterprise--and beyond. Analytic Applications Enterprise analytic applications provide tools to help an organization make more intelligent decisions. As an integrated part of the new BusinessObjects Enterprise 6.0 product suite, the analytic applications let you easily implement and customize prepackaged analytics and use a data warehouse to manage disparate data sources. Information Delivery Enterprise 6.0 provides a complete solution for information delivery to serve the needs of the extended enterprise. You can intelligently disseminate business intelligence (Business Intelligence) across the enterprise and beyond with information tailored to individual users. And with cost-effective and reliable Business Intelligence distribution, internal and external users can track, understand, and manage enterprise performance. In this Redpaper, we discuss some of the elements of the Business Intelligence platform, the Query Reporting and Analysis, and Information Delivery areas. In 2.2, “Business Objects business intelligence platform” on page 12, we describe those elements that will enable us to quickly access, analyze and share information contained in a Tivoli Data Warehouse. Chapter 2. Business Objects 11 2.2 Business Objects business intelligence platform This section provides an overview of the BusinessObjects Enterprise 6.0 suite that enables companies to easily access, analyze and share information stored in a Tivoli Data Warehouse. 2.2.1 Desktop components The desktop components are meant to be installed on a Windows® 2000 operating system. Here are the three main desktop components. BusinessObjects BusinessObjects is an integrated query, reporting and analysis solution that allows you to access data in your corporate databases directly from your desktop. It will help you present and analyze this information in a BusinessObjects document. Designer The Designer allows a user from the IT department to create the business layer that enables end-users to access databases without knowing standard query language (SQL). This is a business layer called a universe. The Designer helps IT people build a universe, maximizing the usage of database resources while ensuring that correct results will be generated. Supervisor The Supervisor administers the repository. It allows the administrator to create users, arrange them in groups, and give them access rights on data or product features. 2.2.2 Server components The server components are commonly installed on server machines, running Windows Operating System or IBM Eserver® pSeries® server machines. This Redpaper does not discuss these server components in detail. Here are two common server components. WebIntelligence WebIntelligence provides users with a Web-based Business Intelligence portal called Infoview. From infoview, users can access and refresh BusinessObjects documents. In addition to that, infoview users can create new documents using a lightweight, easy-to-use interface called the Web Query Panel. Broadcast Agent 12 Tivoli Data Warehouse 1.2 and BusinessObjects Broadcast Agent allows BusinessObjects and WebIntelligence users to publish their documents through the repository and schedule the execution of those documents, as well as their distribution to a large number of users. 2.3 Installing BusinessObjects desktop components In this section, we tell you how to install the desktop components: BusinessObjects, Designer and Supervisor. For installing the server components, refer to the installation and deployment guide on the installation CD. 2.3.1 Prerequisites Before starting the installation of BusinessObjects Enterprise 6.0 software, make sure you have the following: Windows 2000 workstation, with at least 128 MB memory A licence key file The license key is a file with a suffix of .signed.key.xml. It contains necessary information to let you install and run the products on your computer. The installation CDs or files 2.3.2 Installation procedure Once you have all the prerequisites, you are ready to install BusinessObjects desktop products. 1. On the installation CD, start the setup.exe program. The BusinessObjects Enterprise 6.0 installation Wizard is displayed. 2. Click Next. Read the license agreement. 3. Select I accept the terms, and click Next. The software and hardware requirements are displayed. 4. Click Next. The license files folder window appears. In order to install correctly, the setup wizard needs to read your license key file. Click the Change button and find the directory in which you have stored the license key file. You can check the validity of your license key file by clicking the Check License button. Figure 2-2 on page 14 shows the License files window. Chapter 2. Business Objects 13 Figure 2-2 Selecting the license key file directory during setup 5. Click Next. Choose a User name and Organization (this is for registration only). 6. Click Next. Choose Desktop installation and click Next. You are now ready to install Desktop products. 7. Click Next to start copying files. The installation process is then complete. 2.4 Configuring BusinessObjects for Tivoli In this section, we will use Designer Version 6.0 and BusinessObjects Version 6.0 to show a simple integration scenario with Tivoli Enterprise™ Data Warehouse. We also cover setting up the integration and running reports. We first installed Designer Version 6.0 and BusinessObjects Version 6.0 onto a Windows 2000 workstation as explained in 2.3, “Installing BusinessObjects desktop components” on page 13. We installed DB2 Client software on the same machine. The Tivoli Data Warehouse database with the reporting data is typically called TWH_MART. The DB2 client has been configured for connecting to the TWH_MART database. 14 Tivoli Data Warehouse 1.2 and BusinessObjects For using the Tivoli Data Warehouse database, we need to configure BusinessObjects by creating a universe. A universe is a business or semantic layer that insulates end-users from the complexity of the database. In this section, we are going to go through several steps to build the universe: 1. Starting Designer 2. Creating a new universe 3. Importing tables 4. Creating joins between tables 5. Creating classes 6. Creating objects 7. Renaming and arranging objects 8. Creating measure objects 9. Creating a time hierarchy Let’s go through each of these steps in detail. 2.4.1 Starting Designer Let’s start working with the Designer. 1. From the Windows desktop, use Start -> Programs -> BusinessObjects 6.0 -> Designer. If you have set up a repository, you will have to log on using a user name and password. 2. The quick design wizard window appears. Click Cancel, since we will create a universe manually, in order to review all the steps in detail. 2.4.2 Creating a new universe We will now create a new universe. 1. From the menu, choose File -> New. 2. The Universe Parameters window appears. Type a name for your new universe, for example TWH_MART. 3. Now, tell Designer how to access the Tivoli database. To do this, create a new connection. Under the connection textbox, click Create. 4. Select IBM DB2 Client and click OK. The IBM DB2 Client connection window appears. – Type a new name for the connection, such as Connection to TWH_MART. – Select the DB2 UDB V7 from the database engine drop-down menu. Chapter 2. Business Objects 15 – Enter a DB2 user name and password and select the DB2 name of the TWH_MART database connection from the data source name drop-down menu. Note: The data source name is using the ODBC system data source. If the TWH_MART database is not in the drop-down list, it means that it has not been configured for ODBC. You need to configure it first, using the DB2 Client Configuration Assistant. Figure 2-3 shows the DB2 connection window. Figure 2-3 Connection parameters window described in Step 4 5. Click OK. You are back to the Universe Parameters window as shown in Figure 2-4 on page 17. You can now type a description for the universe, such as This is a universe to access and analyze data stored in the Tivoli Data Warehouse. Then click OK to start working on it. 16 Tivoli Data Warehouse 1.2 and BusinessObjects Figure 2-4 The universe parameters window in Step 5 2.4.3 Importing tables We are now ready to import tables in the universe. To do so, simply double-click in the center of the displayed window. The table browser appears, as shown in Figure 2-5 on page 18. In the Tivoli Data Warehouse, each component has a different table creator. In this example, we will use the AMY component, which contains data from IBM Tivoli Monitoring for Operating Systems. Chapter 2. Business Objects 17 Figure 2-5 The table browser 1. In the AMY tablespace, find the D_HOST table, drag and drop it on the center window. 2. Do the same for the tables F_CPU_HOUR and D_CPU_METRIC. As seen on Figure 2-6, you now have three tables in your universe. You can close the table browser now. Figure 2-6 The center window after three tables are imported We have imported the D_HOST table, which is a dimension table. Each line contains a particular host’s attributes. The D_CPU_METRIC table is another 18 Tivoli Data Warehouse 1.2 and BusinessObjects dimension table. Each line describes a particular metric related to CPU operation. The F_CPU_HOUR is a fact table at the hour level. Each line gives the value of a particular metric for a particular host and time. 2.4.4 Creating joins between tables The tables in the universe need to be joined together so that BusinessObjects understand the relationship between these tables. To create simple joins, follow the steps below: 1. Click the HOST_ID field of the AMY.D_HOST table, hold the mouse button down, and drag it all the way to the HOST_ID field in the AMY.F_CPU_HOUR table. 2. Do the same from the METRIC_ID field in the AMY.F_CPU_HOUR table to the METRIC_ID field in the AMY.F_CPU_HOUR table. As seen in Figure 2-7, you now have three tables with two joins. Figure 2-7 Three tables and two joins in the center window 2.4.5 Creating classes Once the tables and joins are created, we need to organize the way end-users access them. The end user does not need to know anything about databases, tables, joins, and SQL. All the end user will see is a set of objects arranged into classes. To make things easy for the end user, we will create three classes: 1. From the menu, choose Insert -> Class. Give this first class the name Host. 2. Create two other classes named Metric, and Measures. 3. The left pane of your screen should now look similar to Figure 2-8 on page 20. Chapter 2. Business Objects 19 Figure 2-8 The universe as it is now: three empty classes 2.4.6 Creating objects In BusinessObjects, there are three different types of objects: Dimension Dimension objects are used to define the context in which we observe a particular measure. Dimension objects can be arranged in hierarchies. For example, a geographical hierarchy can be comprised of the following dimensions: country, state, city, household. Information Information objects are attached to dimension objects and give further details about them. For example, we could attach a Household object to its street address. Measure Measures are numeric objects that are aggregated using an aggregate function such as Min, Max, or Sum. We will now add a few objects to our universe. The end user will be able to select any combination of them to formulate a query. 1. From the AMY.D_HOST table, pull the NETWORK_DOMAIN field, and drop it into the Host class in the left pane. 2. From the AMY.D_HOST table, pull the HOSTNAME field, and drop it into the Host class in the left pane. 3. From the AMY.D_CPU_METRIC table, pull the MET_CATEGORY field, and drop it into the Metric class in the left pane. 4. From the AMY.D_CPU_METRIC table, pull the MET_NAME field, and drop it into the Metric class in the left pane. 5. From the AMY.D_CPU_METRIC table, pull the MET_DESC field, and drop it into the Metric class in the left pane. 6. From the AMY.F_CPU_HOUR table, pull the MIN_VALUE field, and drop it into the Measure class in the left pane. 7. From the AMY.F_CPU_HOUR table, pull the MAX_VALUE field, and drop it into the Measure class in the left pane. 8. From the AMY.F_CPU_HOUR table, pull the AVG_VALUE field, and drop it into the Measure class in the left pane. 20 Tivoli Data Warehouse 1.2 and BusinessObjects Your universe should now resemble Figure 2-9. Figure 2-9 Universe with three classes and eight objects 2.4.7 Renaming and arranging objects We can rename objects so that it is simpler for users to read and browse the universe. To do so, simply double-click an object on the left pane, this will show the object’s properties. Type a new name and a description that the user will see while browsing the universe. Rename a few objects so that your universe now resembles Figure 2-10. Figure 2-10 Universe after the metric class objects have been renamed In the Metric class, an object called Description exists. It is not a dimension per say. This means that we will not aggregate measures according to description, but rather according to detailed information concerning a specific metric from Tivoli. Let’s transform this object into a detail object: 1. Double-click the Description object. The Object Properties window appears. 2. Go to the second tab named Properties. From there, select Detail in the Qualification options. 3. In the associated dimension drop-down, choose the Name object. Chapter 2. Business Objects 21 4. Close this window by clicking OK. The universe now resembles Figure 2-11 Figure 2-11 A green pyramid represents an Information object 2.4.8 Creating measure objects Now we need to create measure objects. We already have three objects in the Measures class. Let’s transform them into measures: 1. Double-click the Min Value object. The Object Properties window appears. You will find a Select window where the Select part of the SQL statement is shown. Default values will display. In some cases, you may want to type a more complex Select statement involving several tables. 2. Go to the Properties tab. Choose Measure in the Qualification options. 3. Choose the Min Aggregate Function. 4. Repeat for the Max Value and Avg Value objects, using the corresponding aggregate function in the properties tab. Your universe now resembles Figure 2-12. Figure 2-12 Our universe with three dimensions (red bullets) 22 Tivoli Data Warehouse 1.2 and BusinessObjects 2.4.9 Creating a time hierarchy We are almost done. We will now create a time hierarchy. 1. Create an additional class (from the Menu, choose Insert -> Class), and name it Time. 2. Pull the MEAS_HOUR column from the F_CPU_HOUR table into the new class. 3. Double-click the newly created object. Give it a new name: Time. 4. Go to the Properties tab, and click the Automatic Time Hierarchy button. Check the Year and Month options. This will create two additional dimensions, computed from the MEAS_HOUR column, using DB2 SQL formulas. 5. Close both the Time Hierarchy and Object Properties window. Your universe now resembles Figure 2-13. Figure 2-13 Complete universe We are now ready to use this universe. 2.5 Using BusinessObjects We have successfully created a universe using the Designer. The universe is what the end-user will use to create queries. We will now use BusinessObjects to create a report based on Tivoli Data Warehouse data. In this section, we describe several ways of creating and using BusinessObjects reporting tools. The discussion will consists of the following topics: 2.5.1, “Creating a simple report” on page 24 Chapter 2. Business Objects 23 2.5.2, “Executing the query and answering the prompts” on page 27 2.5.3, “Manipulating the report” on page 28 2.5.1 Creating a simple report Follow these steps to create a simple query: 1. To start BusinessObjects, go to the Windows start menu, choose Start -> Programs -> Business Objects -> BusinessObjects 6.0. 2. If you are using a repository, you will be prompted for a user name and password. 3. Once started, BusinessObjects will show the New Report Wizard. Choose Generate a standard report, and click Begin. 4. Now, we will choose how to access data. The most common way to access data is to use a universe. Other ways include accessing a personal data file, such as an Excel spreadsheet, or a flat file. In the New Report Wizard, choose Universe, and click Next. A dialog window similar to the one in Figure 2-14 is displayed. Figure 2-14 Choosing a universe in the New Report Wizard 24 Tivoli Data Warehouse 1.2 and BusinessObjects 5. Choose the TWH_MART universe that we have just created in 2.4, “Configuring BusinessObjects for Tivoli” on page 14, and click Finish. The query panel then appears, as shown in Figure 2-15. Figure 2-15 The query panel showing our TWH_MART universe There are three main areas in the query panel window in Figure 2-15. The left part shows the universe that we have designed with Designer. It has objects arranged into classes. The top right part is the result pane, where we will put the objects we want to use in our query. The bottom right part shows the conditions applied to this query. 6. Let’s open the different classes of the universe and double-click the following objects: – In the Metric class, the dimension called Name – In the Time class, the dimension called Time – In the Measures class, the three measure objects called Min Value, Max Value and Avg Value. Chapter 2. Business Objects 25 That is all you need to do to formulate a query. This query will retrieve the data associated with the dimension and measure objects that you double-clicked. 7. Now let’s add a condition to this query. Every time this report is run, we want the user to specify which hostname he wants to analyze. Pull the Hostname object under the Host class, and drop it in the condition window at the bottom right of the query panel. 8. From the list of functions on the left, double-click Equal To. Still on the left side, choose Type a new prompt. This means that we will type a question that is going to pop up every time the report is refreshed. 9. In the text box that appears next to the Hostname object, type Which host? in the condition window. Click OK. 10.You are done. Your query panel should now resemble the one in Figure 1-26: Figure 2-16 The query panel, ready to run 26 Tivoli Data Warehouse 1.2 and BusinessObjects 2.5.2 Executing the query and answering the prompts We can now execute the query by clicking the Run button. Because we set up a condition with a prompt, BusinessObjects will ask you the question shown in Figure 2-17. Figure 2-17 The prompt window From here, you can either type a value for the hostname, or use the Values button on the right. Choose or type a hostname. In this example, we will use tdw010 as the hostname. Click the OK button to execute the query. Now BusinessObjects connects to the TWH_MART database from the Tivoli Data Warehouse and executes an SQL statement to retrieve the data we asked for. The result displays as a default table as shown in Figure 2-18 on page 28. Chapter 2. Business Objects 27 Figure 2-18 BusinessObjects showing results in a standard table 2.5.3 Manipulating the report There are several things that you can do with the BusinessObjects report. The following sub-sections shows these manipulations. These are the things that we will do: “Modifying the title” on page 28 “Creating a section” on page 29 “Adding avg, min and max values in each table” on page 29 “Creating a graph” on page 30 “Refreshing a report” on page 32 Modifying the title Double-click the Report Title cell and type a new title such as CPU Measures Analysis. This will help other users of this report understand what it is about. 28 Tivoli Data Warehouse 1.2 and BusinessObjects Creating a section At the present time, we have a single and long table. Let’s break it into several tables, one for each metric name. To do so, 1. Right-click any value in the Name column. The column values are then displayed in reverse video, and a contextual menu appears. 2. In the contextual menu, choose Set as master. We now have the dimension Name set as a section, and we have a table containing the time object along with three measures in each section. Adding avg, min and max values in each table Now add a bottom line to each table. 1. Right-click any of the values in the Min Value column. The column displays in reverse video and a contextual menu appears. 2. In the contextual menu, choose Calculations -> Minimum. The summary line is then added. There are several ways to add cells to a table. Let’s now add the maximum on the bottom line, using BusinessObjects formulas. 3. To display the formula bar, choose in the menu View -> Toolbars, then add the Formulas Toolbar. 4. Select the cell in the bottom line of your table in the Max Value column. The cell is highlighted and your table should resemble the one in Figure 2-19. Figure 2-19 Selecting a cell in a table. Note that sections are not shown in this figure Chapter 2. Business Objects 29 5. Now, in the formula toolbar, type the following formula: =Max( <Max Value> ) The formula is automatically evaluated in each table, depending on the context. 6. Do the same operation for the cell in the bottom line and in the Avg Value column, with the following formula: =Average( <Avg Value> ) Note: In the formulas above, we have indicated which aggregation function to use (min, average, etc.). It is not compulsory to indicate an aggregation function when one has been defined in the universe, like we did for the <Min Value>, <Max Value> and <Avg Value> measure objects. The aggregation function in the universe is used at the query time (against the database), as well as in the report if none is specified. Creating a graph We now have a complete table. Let’s duplicate it to create a graph. To do so: 1. Select the table by clicking its edge. A cross arrow mouse pointer appears when you can select a table. 2. Press the Ctrl key and drag the table to the right. 3. Drop the table. You should now have two tables in each section as shown in Figure 2-20 on page 31. 30 Tivoli Data Warehouse 1.2 and BusinessObjects Figure 2-20 View of our document after the table has been duplicated Now let’s transform this second table into a graph: 1. Bring up the Report toolbar if it is not showing. 2. Select the table on the right by clicking its edge. 3. In the report toolbar, use the Chart Type drop down, and choose 2D Line. We now have both a table and a graph showing the CPU measures. If you notice, the graph scale is probably from 0 to 100, for all sections. To adapt the scale in each section, do the following: 1. Right-click the chart. A contextual menu appears. Choose Format Chart. 2. In the Chart Format window, go to the first tab called General and check the option at the bottom right called Adjust Scale to Value Range. 3. Click OK. Your graph now shows an adaptive scale. From here, you can do additional formatting by right-clicking on each element of the graph, and choosing Format Data Series, or Format Legend, depending on where you clicked. Chapter 2. Business Objects 31 Refreshing a report Note that our report can be re-executed, this operation is called a refresh. To refresh the document, 1. Choose Data -> Refresh Data from the menu. The prompt that we have defined in the query is then displayed. 2. Choose another host from the list of values, then click the OK button. 3. The query executes and the document is updated as shown in Figure 2-21. Figure 2-21 Our document as it looks at the end of this tutorial 2.6 Advanced universes and documents This section briefly describes the main concepts involved in real-life design and uses of universes and documents. The discussion refers you to the Designer, Supervisor, and BusinessObjects. 2.6.1 Advanced universe design A production universe will typically contain between 30 and 200 objects, involving multiple dimensions and fact tables. It provides hierarchies for the user to drill down to more detailed information. 32 Tivoli Data Warehouse 1.2 and BusinessObjects The universes should be designed so that given any combination of objects chosen by the user, the SQL generated will be correct. In particular, the universe should avoid SQL traps such as loops, chasms, and fans. To help the IT people design a proper universe, the Designer proposes additional facilities that will not be discussed in details here. Read the Designer user manual. It has chapters dedicated to these topics. The additional concepts in Designer are: Alias In Designer, an alias refers to a physical table. For example, the physical table country is used both to store a customer’s home country, as well as the company’s facility’s country. In order to use the country table as a customer’s country and facility’s country, we’ll create an alias of that physical table to be used by each function. Context A context is defined by the universe author. It is a group of joins that are allowable in a single SQL statement. Contexts are typically used to resolve loops in your schema. Hierarchy A hierarchy is an ordered list of dimension objects. It allows the end user to navigate data in a top down fashion. The location dimension can have a hierarchy of country, state, city, and ZIP code. Strategy In Designer terminology, a strategy is a set of rules that enable you to automatically import or create tables, joins and objects in a universe. A typical strategy will do most of the job of importing metadata from another environment such as an ETL or other data warehousing tool. 2.6.2 Advanced reporting with BusinessObjects BusinessObjects answers the needs of both the casual user as well as the expert production report designer. You might be interested in some of the following features of BusinessObjects. Multiple data sources BusinessObjects allows you to create as many data providers as you need. A data provider may be built on a universe, on a personal data file such as an Excel spreadsheet, or an XML file. BusinessObjects allows you to synchronize multiple sources and use them jointly in a single block (table, cross-table, graph, and so on). Chapter 2. Business Objects 33 Conditional reporting Conditional reporting is the ability to show or hide an element of your report based on the result of a formula. Alerters Alerters help you call attention to some data by formatting it differently. This could be used to highlight a particular condition that has been met, for example. 2.6.3 Security and deployment with Supervisor The supervisor will let you administer the repository. See 2.7, “Deploying BusinessObjects” on page 34, for additional information on repositories. The supervisor enables you to: Manage the BOMain.key file for identifying the repository. Create users and arrange them into groups. Several levels of groups are allowed. Give users or groups access to documents and universes. Define row-level security on the data. As an example, the western region sales managers should only see the western region sales figures. Grant users or groups access to each of the different tools features. As an example, a particular user may not be able to print, or save their documents locally. Manage decentralized repositories. 2.7 Deploying BusinessObjects This section introduces the tools needed to deploy BusinessObjects to a workgroup or larger number of users. 2.7.1 The repository The repository is the cornerstone of a BusinessObjects deployment. It is flexible enough to enable workgroup deployments as well as company wide deployments. The repository is a database composed of a little more than 50 tables. It is used to store user definitions, universes, and documents. These three pieces are also called the security domain, the universe domain, and the document domain. The diagram of the repository is shown in Figure 2-22 on page 35. 34 Tivoli Data Warehouse 1.2 and BusinessObjects Figure 2-22 Simple architecture diagram The Supervisor tool creates the repository. It can be stored on a separate database engine. The definition of the connection to the Tivoli Data Warehouse can then be stored in the repository as a secured connection, so that several end users can use it. The BOMain.key file The BOMain.key file lets BusinessObjects components know where the repository is stored. This BOMain.key file is created by the supervisor at the end of the repository creation process. You can also create a new BOMain.key file on an existing repository, using Supervisor’s safe recovery admin feature. Sharing universes and documents through the repository Once a repository has been set up, users can access it using the BOMain.key file. Each user (according to the rights they have been granted in Supervisor), will then be able to publish universes and documents in the repository. By default, publishing universes and documents lets other users of their group have access to them. Instead of publishing a document to his whole group, a user can choose to send it to a particular user. Chapter 2. Business Objects 35 Decentralized repositories It is possible to attach several universe domains and several document domains to a single security domain. This is useful for both development and production environments as well as for decentralized organizations. Read the Supervisor user manual for further information on how to deploy such configurations. 2.7.2 Deploying to Web users Once you have created a repository, you can deploy universes and BusinessObjects documents to Web users. To do so, you need to install WebIntelligence on a server machine. WebIntelligence uses a BOMain.key file to retrieve documents from a repository and serves the documents to Web users through a Web-based Business Intelligence portal. The portal name is Infoview. 2.7.3 Deploying documents to large number of users To deploy documents to a large number of users, you can simply publish them to the repository. All authorized users having access to the repository will be able to retrieve documents. However, each user may want to have a personal view of a document. As an example, a regional sales manager wants to receive sales figures for his region only, every Monday morning. Without a Broadcast agent, this user will retrieve the document from the repository, and then refresh it. BusinessObjects then queries the Data Warehouse to retrieve sales data. If every regional sales manager does the same operation on Monday morning, the Data Warehouse will receive a considerable workload to handle. Broadcast Agent for optimizing document deployment Using Broadcast Agent Scheduler, the task of performing the refresh of the same document for several recipients is programmable, during weekends for example, so that each recipient receives a personalized view of a document. This is called report bursting. Broadcasting through e-mail or Web In addition to the Broadcast Agent Scheduler, you can add the Publisher Web and Publisher Mail function. Once a report has been bursted, the resulting sales document can then be published to the Web or sent by e-mail to a very large number of users (tens of thousands). 36 Tivoli Data Warehouse 1.2 and BusinessObjects Index A alerters 34 alias definition 33 Analytic Applications 11 creating 19 conditional reporting 34 configuring BusinessObjects for Tivoli 14 context 33 D B Broadcast Agent 12 business intelligence 2 concepts 2 platform 12 product suite 10 products 11 reporting tools 7 software company vii Business Intelligence Platform 11 Business Objects 10 chapter 9 company 7 BusinessObjects configuring for Tivoli 14 creating report 23 creating simple report using 24 deploying 34 deploying to Web users 36 desktop components 12 executing a query with 27 installation procedure 13 prerequisites 13 repository 34 server components 12 sharing universes 35 types of objects 20 universe 15 using 23 BusinessObjects Enterprise 10 overview 12 C categorization 5 central data warehouse 4 classes © Copyright IBM Corp. 2004. All rights reserved. data collection 3 Data Integration 11 data mart 2 data mining 3 data warehouse 2 data warehousing 2 databases TWH_CDW 5 TWH_MART 5 TWH_MD 5 DB2 control center 4 DB2 Universal Database 2 deployment 34 to a large number 36 Designer 12 dimension table 2 dimensions 5 definition 20 document organization 7 drill-down 2 sample 7 E ETL process 2 Extract, transform, load, see ETL process 2 F fact table 2 G geographical location 6 granularity 5 graph creating 30 37 H S hierarchy 5 definition 33 time 23 security 34 slice and dice 3 sample 7 star schema 2 structure 5 strategy definition 33 Supervisor 12 I information objects definition 20 M measure objects definition 20 metadata 2 multiple data sources 33 O object types dimension 20 information 20 measure 20 objects arranging 21 creating 20 measure 22 OLAP cube 2 Online analytical processing, see OLAP 2 T tables importing 17 joining 19 time frame 5 Tivoli Data Warehouse 2 components 4 control center 4 engine 4 reporting server 4 TWH_CDW 5 TWH_MART 5 TWH_MD 5 U universe 15 advanced 32 creating 15 sharing 35 Q query executing and answering prompts 27 Query Reporting and Analysis 11 R Redbooks Web site Contact us viii report creating simple 24 manipulating 28 modifying the title of 28 refreshing 32 running a query 27 repository 34 decentralized 36 38 Tivoli Data Warehouse 1.2 and BusinessObjects W warehouse enablement pack 3 data mart 3 ETL processes 3 metadata 3 report 3 schema information 3 tables requirement 3 WebIntelligence 12 Back cover Tivoli Data Warehouse 1.2 and BusinessObjects Advanced reporting capability for Tivoli Data Warehouse Complete installation and usage examples Covers BusinessObjects This IBM Redpaper will guide you on using various reporting tools that are available in the market to work with the data you collect with Tivoli Data Warehouse. The collected data resides on a DB2 database with the form or star schema. The basic Tivoli Data Warehouse product comes with an integrated reporting tool. However, the reports provided with the product may not be sufficient for all your reporting needs. You may want to use vendor reporting tools to expand the reporting capability of the Tivoli Data Warehouse. This Redpaper discusses the reporting tools of the software vendor, Business Objects, that can be used to access and mine the data stored in the Tivoli Data Warehouse. The discussion of each vendor reporting tool should not be considered a replacement for its respective vendor product manual. The examples provided in this Redpaper serve as a quick reference for you to start using the reporting tools contained in BusinessObjects™ Enterprise Suite 6.0. ® Redpaper INTERNATIONAL TECHNICAL SUPPORT ORGANIZATION BUILDING TECHNICAL INFORMATION BASED ON PRACTICAL EXPERIENCE IBM Redbooks are developed by the IBM International Technical Support Organization. Experts from IBM, Customers and Partners from around the world create timely technical information based on realistic scenarios. Specific recommendations are provided to help you implement IT solutions more effectively in your environment. For more information: ibm.com/redbooks