1
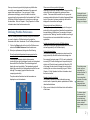
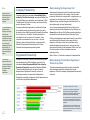
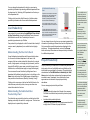
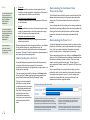
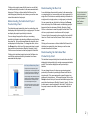
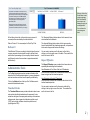
TOP
Copyright © 2004 Replicon, Inc. All rights reserved.
All parts of this manual are the property of Replicon, Inc.
No parts of this manual may be reproduced in any manner
whatsoever including mechanical or electronic media such
as disk or tape. No part of this manual may be transmitted
in any form by any means without the written permission of
Replicon, Inc.
ProMax and Web TimeSheet are registered trademarks of
Replicon, Inc. All other products are registered trademarks
or trademarks of the respective companies.
Contact Information
Replicon, Inc.
830, 910 - 7th Ave. S.W.
Calgary, Canada T2P 3N8
Direct:
1-403-262-6519
Toll Free in North America:*
1-877-737-5420
Toll Free in Europe:*
00-800-7375-4266
Toll Free in Australasia:*
011-800-7375-4266
Fax:
1-403-233-8046
http://www.replicon.com
[email protected]
*The international toll free numbers
may not work in some countries. If you
experience problems, use the direct line
to contact Replicon.
Contents
Chapter 1 - Overview
1
What is ProMax? ............................................................... 1
Using this Manual ............................................................... 1
Accessing ProMax ............................................................. 1
Start Menu ................................................................... 1
Desktop ....................................................................... 1
Web Browser ............................................................... 2
Remote Access ........................................................... 2
Web TimeSheet ........................................................... 2
License and System Information ........................................ 2
Chapter 2 - How to Get Help
3
Introduction ........................................................................ 3
ProMax Help Topics ........................................................... 3
Using the Online Help System ........................................... 3
Related Links ............................................................... 3
Contacting Technical Support ............................................. 3
Chapter 3 - Getting Started
4
Introduction ........................................................................ 4
About the Menus ................................................................ 4
Setting User Productivity Quotas ........................................ 4
Defining ProMax Preferences ............................................ 5
Setting Up ProMax Objects ................................................ 6
Chapter 4 - Daily Operation
Project Productivity ............................................................ 9
Understanding the Client List ..................................... 10
Understanding the Individual Client Productivity Chart 10
Understanding the Project List ................................... 10
Understanding the Individual Project Productivity Chart
11
Understanding the User List ...................................... 11
Understanding the Individual User Productivity Chart 11
Chapter 5 - Additional Features
12
Introduction ...................................................................... 12
Project Status ................................................................... 12
Project by Hour .......................................................... 12
Project by Cost .......................................................... 12
Client Top/Bottom 10 ........................................................ 12
Top 10 ........................................................................ 12
Bottom 10 .................................................................. 13
Administrative Tools ......................................................... 13
Timesheet Status ....................................................... 13
Repeat Offenders ...................................................... 13
User Vacation ............................................................ 14
Time Off By Types ..................................................... 14
Hours Summary ......................................................... 14
7
Introduction ........................................................................ 7
Company Productivity ........................................................ 8
Department Productivity ..................................................... 8
Understanding the Department List ............................. 8
Understanding the Individual Department Productivity
Chart ............................................................................ 8
User Productivity ................................................................ 9
Understanding the User List Charts ............................. 9
Understanding the Individual User Productivity Chart .. 9
i
Chapter 1 - Overview
What is ProMax?
A key requirement for effective management is to have real-time
visibility into the productivity level of individuals, projects,
departments and the overall company. By setting targets and
tracking the progress of individuals towards those targets,
companies can maximize billable hours and compress billing
cycles, optimizing overall corporate productivity.
ProMax is an executive tool that provides quantitative real-time
productivity views and analysis, enabling executives to
maximize bottom line profitability and productivity. ProMax
measures productivity at the individual, project, department, and
company levels and provides feedback to individuals and
management so that every employee knows their expected
contribution level and its impact on the company bottom line.
Individuals can assess their progress daily when they enter time
in their timesheets. Color coded bar charts on the Timesheet
screen in Web TimeSheet provide real-time feedback about the
individual’s productivity, as well as the productivity of their
department and the overall company. The color of the bar in the
chart indicates whether productivity is below target (red), on
target (yellow), or has exceeded the target (green). A flag
indicates where the productivity level should be as of today in
order to meet the final target.
Using this Manual
This manual is an overview of ProMax and is designed to help
you understand the features of the product. The chapters in this
manual are outlined as follows:
Chapter 1 – Overview
Introduction to ProMax and instructions for running the
application.
Chapter 3 – Getting Started
Instructions for setting up the basic features required to
implement ProMax including user productivity targets,
preferences, and ProMax objects.
Chapter 4 – Daily Operation
Information and instructions for using ProMax on a daily basis to
check productivity at the user, department, company, and
project levels.
Chapter 5 – Additional Features and Administrative Tools
Information and instructions for accessing additional information
within ProMax including client top 10 lists, project status, and
timesheet status, among others.
Accessing ProMax
You can access ProMax locally from your Start menu, desktop
or web browser, remotely from any computer with Internet
access, or from within the Web TimeSheet product. You must
have Internet access and Web TimeSheet to run ProMax.
Start Menu
The ProMax shortcut is located in the Web TimeSheet folder
under Programs in your Start menu:
1.
Select Web TimeSheet from the Programs menu.
2.
Click on Launch ProMax.
If you customized your installation and specified a different Start
menu location, refer to that location when accessing ProMax
from the Start menu.
Desktop
To access ProMax from your desktop, simply click on the
Launch ProMax icon.
Chapter 2 – How to Get Help
Instructions for using the online Help system and contacting
Replicon’s support team.
1
Web Browser
To run ProMax from your web browser:
1.
2.
Open your browser application and enter the URL for Web
TimeSheet in the web address field. The URL is in the
format http://127.0.0.1/cgi/rtcgi.exe?nextpage=login&assign
=package,promax.
The ProMax login screen is displayed. Enter your user
name and password and click on the Enter button.
Remote Access
To access ProMax from a remote computer, follow the
procedure for your local web browser. The computer must have
Internet access and TCP/IP network access to your
organizations web server.
If you cannot access ProMax remotely, try again. Heavy traffic
on the Internet may cause a connection time-out. If after
additional attempts you are still unable to connect, make sure
your server name is a fully qualified domain name and that it is
registered with DNS. If your problems persist, contact your
Internet Service Provider.
Web TimeSheet
To access ProMax from Web TimeSheet, click on the ProMax
button at the top of the Web TimeSheet screen.
License and System Information
License and system information are available from within Web
TimeSheet. To view your license and system information:
1. Click on the TimeSheet button at the top of the ProMax
screen.
2. From within Web TimeSheet, click on the Admin button at
the top of the screen, and select About Web TimeSheet
from the side menu.
3. To view license information, click on the License Keys tab
and select the ProMax license.
4. To view seat assignments for the ProMax module, click on
the Seat Assignments tab and select the ProMax module.
2
For information about purchasing a license or adding seats to
an existing license, please contact the Replicon Sales team by
email at [email protected] or by telephone at:
1-403-262-6519 (Replicon main number)
1-877-737-5420 ext. 2 (toll free in North America)
1-800-7375-4266 ext. 2 (toll free outside North America).
Chapter 2 - How to Get Help
Introduction
Using the Online Help System
This chapter explains the online Help system provided with the
ProMax application, including instructions for using the online
Help system. The online Help system is available in an easy-touse format that will allow you to access the help you need
quickly and efficiently.
You can access the online Help system from anywhere in
ProMax by clicking on the Help link at the top of the screen.
ProMax Help Topics
ProMax online Help topics include the following:
Welcome to ProMax
A brief introduction to the ProMax application.
Accessing ProMax
Instructions for accessing ProMax locally and remotely from
a PC with Internet capability.
Setup
Instructions for configuring ProMax to best fit the needs of
your organization, including setting users productivity
quotas, defining the ProMax preferences (look and feel),
enabling ProMax objects, and accessing ProMax version
and license information.
Productivity (Utilization)
A description of the productivity tracking feature, including
an explanation of the data flow and instructions for
accessing information at the user, department, company,
and project levels.
Related Links
Most Help pages contain a section at the bottom for “related
links.” These links access pages that provide similar
information about the same topic or a related topic. Many
pages also contain links throughout the Help text itself, allowing
you to get additional information immediately, without using the
Index or Help Topics.
Note ...
Welcome to ProMax is
the first screen
displayed when you
access the ProMax
online Help system.
To view the list of
Help topics, click on
either the Help Topics
button at the top of the
screen, or the link for
Help topics at the
bottom of the
Welcome to ProMax
screen.
Contacting Technical Support
If you have trouble using ProMax or encounter technical
difficulties, please contact Replicon’s Support Team between
6:00 AM and 5:00 PM, MST:
Replicon main number 1-403-262-6519
In North America, toll free 1-877-737-5420, ext. 3
Outside North America, toll free 1-800-7375-4266, ext. 3
You also may email the Support Team at
[email protected].
Project Status
A description of the project status feature.
Client Top 10
An explanation of the Client Top 10 and Client Bottom 10
lists (by profit and revenue).
Administration
A detailed description of the administrative features
available in ProMax including timesheet status reports and
time off summaries.
3
Chapter 3 - Getting Started
Note ...
Clicking the Cancel
button at the bottom of
the screen will cancel
the process without
saving your changes.
Introduction
Setting User Productivity Quotas
This chapter describes the ProMax menus and provides
instructions for setting up ProMax.
You can set up billable targets (productivity quotas) for each
user in the system for the purpose of tracking productivity
quotients (utilization rates). Users can view their productivity
information both from within ProMax and from the Timesheet
screen in Web TimeSheet (depending on the user’s
permissions and the preferences set up from within ProMax).
Productivity is also tracked in Web TimeSheet reports.
About the Menus
You can use the ProMax menus to navigate the application
based on the type of information you are trying to access. Each
button at the top of the screen accesses a different menu.
Below is a description of the ProMax menus.
Menu
Description
Setup
Configure ProMax for your organization. The
Setup menu includes options for setting user
productivity targets, defining ProMax preferences,
and specifying the frequency of data refresh.
Admin
Review information relevant for efficient timesheet
processing. The Admin menu includes mini reports
that allow you to determine where timesheets are
held up (submission vs. approval), identify repeat
offenders (both timesheet users and approvers),
determine where users are spending their time
(hours summary), and review vacation and other
time off data.
Company
4
Access information pertaining to the company as a
whole, including overall company productivity,
project status, and client top 10 lists by revenue
and profit.
Groups
Review productivity information pertaining to
departments and projects.
Users
Review productivity information at the user level.
Timesheet
Access the Web TimeSheet application.
Logout
Close this session of ProMax.
Help
Access the online Help system.
When you initially set up productivity quotas, you will enter each
user’s billable targets - either the total year’s target or the target
per month. When you enter a total target for the year, the total is
divided evenly across the months (values are rounded to the
nearest whole number). You can then edit individual months to
account for special circumstances such as months where the
user is on vacation and may be unable to meet the standard
target amount. When you enter a billable target for each month,
the total target for the year is calculated as the sum of all the
months.
ProMax collects the billable hours from each user’s approved
timesheets and uses this information to calculate productivity at
the user, department, project, and company levels.
To set user productivity quotas:
1.
Click on the Setup button at the top of the ProMax screen
and select User Productivity from the side menu.
2.
Filter the list of users on the User Productivity screen by
department, employee type, or status, if necessary.
3.
Make sure you have selected the appropriate year (defaults
to the last saved year), then enter each user’s productivity
quota (billable target). You can enter a total for the year or
individual values for each month.
4.
When you are finished, click the Save button at the bottom
of the screen. Always save your changes before moving to
the next page or changing the filtered list.
Once you have set up productivity targets, any billable time
recorded in users’ approved timesheets will be measured
against their target values. If you set up your ProMax
preferences accordingly, users will be able to track their
progress from the barometers within the timesheet itself. Refer
to Defining ProMax Preferences for instructions on setting up
the barometer. Refer to Chapter 4 – Daily Operation for further
information about how the barometer works.
Show users with zero productivity targets
Selecting this option will include all users in the productivity
charts, both those with productivity quotas and those
without. This means that the actual hours for group and
company productivity charts will include all approved billable
hours in the system, and user productivity charts will be
displayed for users without set targets.
Use the ProMax preferences to identify the type of information
you want to display in ProMax charts and to enable the
barometer within users’ timesheets. To set ProMax preferences:
Click on the Setup button at the top of the ProMax screen
and select ProMax Preferences from the side menu.
2.
Select your preferences, taking note of the following:
Clicking the Cancel
button at the bottom of
the screen will cancel
the process without
saving your changes.
Show projects with zero billable hours
Selecting this option will include all projects in the project
productivity charts, regardless of whether the projects have
accumulated any billable hours. For example, an internal
project such as “Meetings” would be included, even though
this project does not accumulate billable hours for your
organization.
Defining ProMax Preferences
1.
Note ...
Include only approved hours for all ProMax objects
Selecting this option will exclude timesheet hours that have
not been approved (for all ProMax objects).
Productivity target range
The productivity target range determines how close to the
target productivity should be before charts change color.
Show the individual/department/company graph on the
users timesheet
These options determine whether the barometer
(productivity bar chart) is displayed in each user’s timesheet
menu within Web TimeSheet. The individual graph will
display the user’s productivity. The department graph will
display the productivity for the department to which the user
belongs. The company graph will show the entire
company’s productivity.
For example, the target range is 10%. A user’s productivity
is currently 20% below the target, and his productivity bar
chart is red. When that user’s productivity falls within 10%
of the target, the bar chart will change from red to yellow,
indicating the user is close to reaching his goal. Refer to
Chapter 4 – Daily Operation for further information about
the bar chart colors.
The picture below illustrates how the barometers are
displayed on user’s timesheets.
Number of months to refresh
The number of months to refresh indicates how many
months’ worth of productivity data is updated when ProMax
refreshes the database.
3.
When you are finished, click the Save button at the bottom
of the screen.
The refresh process
can be very timeconsuming if you
refresh more than 12
months of data.
If you must refresh
more than 12 months,
make sure you
change this value
after the first refresh.
To achieve optimal
performance, it is
recommended that
you schedule any
refresh of data (both
system wide and
object-based) to occur
nightly.
5
Note ...
Clicking the Cancel
button at the bottom of
the screen will cancel
the process without
saving your changes.
Setting Up ProMax Objects
ProMax objects are the individual items (menu items, charts,
etc.) available in the ProMax system. You can enable or disable
objects based on the needs of your organization. You can also
set up a schedule for refreshing the data for individual objects.
Each object can be refreshed daily, weekly, or monthly at a time
of day you specify.
You can also refresh any object manually by clicking the
next to the appropriate object on the ProMax Objects screen.
To customize the setup for ProMax objects:
6
1.
Click on the Setup button at the top of the ProMax screen
and select ProMax Objects from the side menu.
2.
Click the
next to the object you want to customize or,
optionally, click on the underlined object name.
3.
When you are finished setting up the object, click the Save
button at the bottom of the screen.
Chapter 4 - Daily Operation
Introduction
Once you have set up billable targets for each user, any billable
time entered in the user’s timesheets will be measured against
the user’s target. You can then track productivity at the user,
department, or company level.
Each user can view his/her productivity quotient (utilization rate)
from within ProMax and from the Timesheet screen in Web
TimeSheet, depending on the ProMax preferences. Refer to
Chapter 3 – Getting Started for further information about
displaying productivity information in Web TimeSheet.
The picture below illustrates how productivity is measured at
each level of the organization.
Note that each bar chart is color coded, indicating the following:
Red
Productivity is below target (the number of actual
hours is below the targeted amount).
Yellow
Productivity is within target range.
Green
Productivity has exceeded the target.
Each bar chart indicates the actual billable hours recorded in
Web TimeSheet versus billable targets set up in ProMax.
Productivity may be displayed in horizontal bar charts (lists) or
vertical bar charts (individual productivity charts). The pictures
on the following pages explain the values displayed in each
type of chart.
7
Note ...
Quarterly intervals
indicate the number of
quarters for which
information will be
displayed.
Company Productivity
Company productivity is calculated as Actual Billable Time
divided by Total User Productivity, where Actual Billable Time
is the total billable hours recorded in users’ timesheets (in Web
TimeSheet) and Total User Productivity is the total productivity
quota for all users in ProMax.
Understanding the Department List
A department list displays horizontal bars with the productivity
values for all departments in the company. A list can contain
productivity information for a single month, a single quarter, or a
single year (no intervals), and can be sorted (Order By) by
department name, productivity target, actual billable hours, or
status (below target, on target, above target).
You can access the department list either by clicking on the
company productivity chart (drilling down) or by clicking on the
Groups button at the top of the ProMax screen and selecting a
time period from the side menu (Monthly, Quarterly, Yearly).
You can drill down to a
department list by
clicking on a company
chart only if the
company chart contains
information for a single
month, quarter, or year.
Company productivity is displayed in a vertical bar chart (see
picture below) and may include monthly, quarterly, or yearly
productivity values. Monthly productivity information is available
for one, three, six, or 12 months. Quarterly information is
summarized for one, two, three, or four quarters. Yearly
information is summarized for one, two, five, or 10 years.
If you are viewing
company productivity in
larger intervals, you
cannot drill down to the
department using this
method.
Clicking on the bar chart will drill down to a department list.
Refer to the Department Productivity section for further
information about department productivity charts.
Clicking on the department name will drill down to a user list that
contains productivity information for the users within that
department. Clicking on the bar itself will drill down to the
individual department productivity chart, where you can then
view interval information for that department. Refer to the User
Productivity section for further information about user
productivity charts.
Department Productivity
Refer to Picture 4-1 below for an example of a department list.
You can view a
department list only if
you have been granted
permission to do so by
the ProMax or Web
TimeSheet
administrator.
Department productivity is based on the users associated with
specific departments in Web TimeSheet (user profile). It is
calculated as Actual Department Billable Time divided by
Department Productivity, where Actual Department Billable
Time is the total billable hours for all users in a specific
department and Department Productivity is the sum of
productivity quotas for the users within that department.
Understanding the Individual Department
Productivity Chart
The individual department productivity chart is a vertical bar
chart that displays productivity information for a single
department. This chart can display the department’s productivity
in intervals.
Department productivity is displayed in a list (all departments) or
a vertical bar chart (individual department).
4-1: Horizontal Bar Chart (List)
This picture is an example of a department list.
The percentage is the productivity quotient
(utilization rate) calculated by dividing the actual
billable hours worked into the billable target.
The values within each horizontal bar are the actual
vs. target values. Department productivity values
are based on the productivity of all users within the
department.
In this example, clicking on the department name
would drill down to a list of users. Clicking on the
horizontal bar would drill down to a vertical chart for
that department (see 4-2).
8
You can change the department for which you are viewing
productivity information by selecting a different department from
the drop-down list. Selecting <All Departments> will return you
to the department list.
4-2: Individual Productivity
Chart
This picture is an example of an individual
productivity chart. The percentage is the
productivity quotient (utilization rate)
calculated by dividing the actual billable
hours worked into the billable target.
Clicking on the bar chart will drill down to a list that contains
productivity information for all users within that department.
133 is the target for this month. 16 is the
actual number of billable hours achieved so
far.
User Productivity
User productivity is calculated as Actual Billable Time divided
by User Productivity, where Actual Billable Time is the user’s
total billable hours and User Productivity is the user’s
productivity quota as set up in ProMax.
User productivity is displayed in a list of horizontal bar charts (all
users or users by department) or a vertical bar chart (single
user).
Understanding the User List Charts
A user list displays horizontal bars with the productivity values
for all users in a selected department or all users in the
company. A list can contain productivity information for a single
month, a single quarter, or a single year (no intervals), and can
be sorted (Order By) by user name, productivity target, actual
billable hours, or status (below target, on target, above target).
You can access the user list either by drilling down from a
department list/individual productivity chart, or by clicking on the
Users button at the top of the ProMax screen and selecting a
time period from the side menu (Monthly, Quarterly, Yearly).
Clicking on the user name or the bar itself will drill down to the
individual user productivity chart, where you can then view
interval information for that user.
Understanding the Individual User
Productivity Chart
The individual user productivity chart is a vertical bar chart that
displays productivity information for a single user. This chart can
display the user’s productivity in intervals.
The green flag indicates where in the bar
chart the actual productivity should be as of
today. The location of the flag is determined
based on today’s date and the date when
the quota should be achieved.
You can change the user for whom you are viewing productivity
information by selecting a different user from the drop-down list.
Only users within a specific department are displayed in the
drop-down. To change departments, return to the Groups
button at the top of the screen and view productivity information
for a different department.
Project Productivity
Project productivity is measured as the relationship between the
total number of hours (both billable and non-billable) and the
total billable hours recorded for the project. The productivity is
calculated as the Total Billable Hours divided by the Total
Hours, where both values are based on the approved hours
recorded in users’ timesheets. Hours that have not been
approved are not included in the project productivity
calculations.
You can view project productivity as follows.
•
Client list
Display productivity values for all clients in the company.
Drill down to individual client productivity charts or project
list charts.
•
Individual client productivity charts
Display the total productivity for all projects associated with
a single client. Drill down to project list charts.
Note ...
You can drill down to a
user list only from an
individual department
productivity chart that
contains information for
a single month, quarter,
or year.
If you are viewing
departmental
productivity in larger
intervals, you cannot
drill down to the
department information.
You can view a user list
only if you have been
granted permission to
do so by the ProMax or
Web TimeSheet
administrator.
If you have the
necessary permission,
clicking on the Users
button will display a list
of users within your
department.
If you do not have the
necessary permission,
you can view only your
own productivity values.
For list charts displaying
all users, any users who
have moved to different
departments will be
listed more than once
(one chart for each
department).
Project productivity
values are currently
provided only for active
(open) projects.
9
Note ...
You can view a client list
only if you have been
granted permission to do
so by the ProMax or
Web TimeSheet
administrator.
You can view a project
list only if you have been
granted permission to do
so by the ProMax or
Web TimeSheet
administrator.
Project productivity
values are currently
provided only for active
(open) projects.
•
Project list
Display productivity values for all active projects (for all
clients) or all active projects for a single client. Drill down to
project productivity charts or user list charts.
•
Individual project productivity charts
Display the total productivity for a single project. Drill down
to user list charts.
•
User list
Display productivity values for all users working on a single
project or users working on all active projects for a single
client. Drill down to user productivity charts.
•
Individual user productivity charts
Display the total productivity for a single user associated
with a project or client.
Because project productivity is based on billable vs. non-billable
hours (instead of target vs. actual billable hours), the
productivity charts are slightly different from those discussed
previously. Pictures 4-3 and 4-4 explain the values displayed in
each type of project productivity chart.
Understanding the Client List
A client list displays horizontal bar charts with the productivity
values for all clients in the company. A list can contain
productivity information for a single month, a single quarter, or a
single year (no intervals).
You can access the client list by clicking on the Groups button
at the top of the ProMax screen and selecting a project time
period from the side menu (Monthly, Quarterly, Yearly).
Clicking on a client name will
drill down to a project list that
contains productivity information
for all projects associated with
that client. Clicking on the bar
itself will drill down to the
individual client productivity
chart, where you can then view
interval information for that
client.
10
Understanding the Individual Client
Productivity Chart
The individual client productivity chart is a vertical bar chart that
displays the total productivity for all projects associated with a
single client. This chart can display the client’s productivity in
intervals.
You can change the client for which you are viewing productivity
information by selecting a different client from the drop-down list.
Clicking on the bar chart will drill down to a list that contains
productivity information for all projects associated with the
client.
Understanding the Project List
A project list displays the productivity values for either all active
projects (for all clients), or just projects associated with a single
client. A list can contain productivity information for a single
month, a single quarter, or a single year (no intervals).
You can access the project list by clicking on the Groups button
at the top of the ProMax screen and selecting a time period from
the side menu (Monthly, Quarterly, Yearly). Click on a client
name to view the projects for that client. To view a list of all
active projects (all clients), select All Projects for All Clients from
the filter.
You can also drill down to a project list by clicking on a client
productivity chart, but only when the chart contains information
for a single month, quarter, or year. If you are viewing client
productivity in larger intervals, you cannot drill down to the
department information using this method.
4-3: Project Horizontal Bar Chart (List)
This picture is an example of a project list. Notice that, unlike
the horizontal bars in the company, department, and user
productivity charts, the project bars are blue. This is because
project productivity is not determined based on a specific target.
The values within each horizontal bar are the billable hours vs.
total hours. Project productivity values are based on the
approved hours recorded against the project by all users
assigned to the project.
The percentage is the project productivity quotient, calculated by
dividing the total number of approved billable hours by the total
number of approved hours worked on the project.
In this example, clicking on the project name would drill down to
a list of users assigned to the project. Clicking on the horizontal
bar would drill down to a vertical chart for that project (see 4-4).
Clicking on the project name will drill down to a user list that
contains productivity information for all users associated with
that project. Clicking on the bar itself will drill down to the
individual project productivity chart, where you can then view
interval information for that project.
Understanding the Individual Project
Productivity Chart
The individual project productivity chart is a vertical bar chart
that displays the total productivity for a single project. This chart
can display the project’s productivity in intervals.
You can change the project for which you are viewing
productivity information by selecting a different project from the
drop-down list. Only projects associated with a specific client
are displayed in the drop-down. To change the client, click on
the Groups button at the top of the screen and select a project
time period from the side menu (Monthly, Quarterly, Yearly).
Click on a new client name to view the projects for that client.
Clicking on the individual project bar chart will drill down to a
user list that contains productivity information for all users
associated with the project.
4-4: Project Productivity Chart
This picture is an example of a project
productivity chart. Like the project list, this
bar chart is blue and does not identify the
productivity status based on a set target.
The percentage is the productivity quotient
(utilization rate) calculated by dividing the
actual billable hours worked by the total
hours recorded against the project.
284 is the total number of hours worked on
this project. 235 is the number of billable
hours worked so far.
Understanding the User List
A user list displays the productivity values for all users working
on a single project, or users working on all active projects for a
single client. A list chart can contain productivity information for
a single month, a single quarter, or a single year (no intervals).
You can access the user list chart by clicking on the Groups
button at the top of the ProMax screen and selecting a project
time period from the side menu (Monthly, Quarterly, Yearly).
Click on a client name to view the projects for that client. Then
click on a project name to view the users for that project.
Note ...
You can view a user list
only if you have been
granted permission to do
so by the ProMax or
Web TimeSheet
administrator.
To view a list of all users working for a specific client, select All
Users for <Client> from the filter, where <Client> is the client
name.
Clicking on the user name or the bar itself will drill down to the
individual user productivity chart, where you can then view
interval information for that user.
Understanding the Individual User
Productivity Chart
The individual user productivity chart is a vertical bar chart that
displays the total productivity for a single user associated with a
project. This chart can display the user’s productivity in
intervals.
You can change the user for whom you are viewing project
productivity information by selecting a different user from the
drop-down list. Only users assigned to a specific project are
displayed in the drop-down. To change the project, click on the
Groups button at the top of the screen and select a project time
period from the side menu (Monthly, Quarterly, Yearly). Click on
a client name to view the projects for that client. Then click on
the project name to view a list of users associated with that
project.
11
Chapter 5 - Additional Features
Introduction
This chapter explains additional features for executives and
administrative tools available in ProMax:
•
Project Status
•
Client Top/Bottom 10
•
Timesheet Status
•
Repeat Offenders
•
User Vacation
•
Time Off By Types
•
Hours Summary.
Project Status
Project Status allows you to evaluate the status of all active
projects company wide.
To access the Project Status feature, click on the Company
button at the top of the screen and select Project Status from
the side menu.
Project by Hour
The Project by Hour list allows you to review the total billable vs.
total hours (billable and non-billable) worked on a project. You
can display hours for all active projects, or filter the list by
project leader or project name.
When you filter the list by project leader, only projects
associated with a specific project leader are included in the
chart.
When you filter the list by project name, the project is broken
down by task, allowing you to evaluate how much time is being
spent working on each task in the project’s life cycle.
12
Hours are displayed in the format B/T, where B is the number of
billable hours and T is the total number of hours worked on the
project. The bar displays billable hours in blue and non-billable
(remainder of the total hours) in white.
Project by Cost
The Project by Cost table allows you to review the estimated vs.
actual cost of a project. The estimated cost is derived from the
value entered in the project profile (Edit Project – Advanced
screen in Web TimeSheet). You can display cost for all active
projects, or filter the list by project leader or project name.
When you filter the list by project leader, only projects
associated with a specific project leader are included in the
table.
When you filter the list by project name, the project is broken
down by task, allowing you to evaluate the cost of the individual
tasks associated with the project.
The % of Cost is the estimated vs. actual cost for the project,
where the actual cost is divided by the estimated cost.
Client Top/Bottom 10
Client Top/Bottom 10 lists identify the clients who bring in the
most and least revenue and profit for your company.
To access client top/bottom 10 lists, click on the Company
button at the top of the screen and select either Top 10
Revenue or Top 10 Profit from the side menu.
Top 10
Client Top 10 lists are provided in bar charts that display the top
10 clients in descending order from left to right.
At the top of each bar is a percentage that indicates how much
of your company’s revenue/profit comes from this client and the
clients to the left of this client in the chart (based on the actual
hours worked on projects associated with the client).
Note ...
5-1: Client Top 10 by Profit
This picture is an example of a Client Top 10 list by
profit. Note that Advantage Technologies provides
approximately 61% of the company’s profit. Big Game
provides the remaining 39%. The 100% displayed
above Big Game is a cumulative percentage. The
actual percentage of revenue for Big Game is
approximately 39%.
When you click on the
E-mail button to send
a custom message,
Web TimeSheet will
open a new e-mail
message through your
e-mail application.
Displaying the cumulative percentage of revenue/
profit allows you to determine quickly which clients
provide the most valuable business to your company.
You can then write
your message as
usual.
At the bottom of each bar is the actual currency amount of
revenue/profit accumulated by the individual client.
The Timesheet Missing table contains a list of users who have
not submitted their timesheets.
Refer to Picture 5-1 for an example of a Client Top 10 list.
The Approval Missing table contains a list of approvers who
have not submitted all their timesheet approvals, and provides a
total number of approvals that are still missing.
Bottom 10
Client Bottom 10 lists are provided in tables that give the actual
currency amounts of revenue/profit brought in by each client,
and the client’s percentage of your company’s overall revenue/
profit (based on actual hours worked on projects associated
with the client).
Administrative Tools
The ProMax Administration section includes information that
allows the Web TimeSheet administrator to process timesheets
and track vacation and other time off speedily and efficiently.
Click on the Admin button at the top of the ProMax screen to
access the Administration menu.
Timesheet Status
The Timesheet Status screen provides information about users
who are late submitting timesheets and/or approvals. A color
coded bar chart gives a company wide summary of submissions
and approvals, where a green bar indicates a perfect record
(100%) and a red bar indicates a less than perfect record
(anything below 100%).
You can send a custom e-mail to all users in either list by
clicking on in the top right corner of the table. The e-mail will be
sent to all users in the list.
Repeat Offenders
The Repeat Offenders screen contains lists of users who are
repeatedly late submitting their timesheets:
Late Submission of 3 or More of the Last 5 Timesheets
Lists users who submitted their timesheets late three or more
times during the last five timesheet periods.
Late Submission of the last 2 Timesheets
Lists users who submitted their timesheets late for both of the
last two timesheet periods.
You can send a custom e-mail to the users in either list by
clicking in the top right corner of the table. The e-mail will be
sent to all users in the list.
13
Note ...
All information
displayed for User
Vacation and Time Off
By Types is
dependent on the
vacation and time off
setup in Web
TimeSheet.
User Vacation
The User Vacation screen gives the vacation status of all users
in a selected department or across the company. The vacation
status includes the total number of vacation days allowed and
the number of vacation days remaining for each user as of a
specific date.
Click
to display user vacation information in a chart.
Click
to display user vacation information in a table.
Time Off By Types
The Time Off By Types screen contains summarized
information about time off used within a specific department or
company wide. The time off type is determined by the code
defined in Web TimeSheet. Time off information is provided in
both chart and table format. Time off information can be
summarized by month, quarter, or year.
Hours Summary
The Hours Summary screen provides totals of all billable, nonbillable, and time off hours for a specific department or company
wide. The hour totals are displayed in a bar chart and are
summarized by month, quarter, or year.
14
Copyright © 2004 Replicon, Inc. All rights reserved.