1
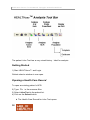
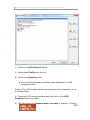
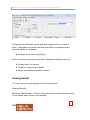
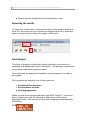
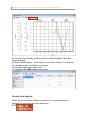
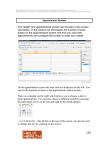
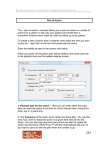
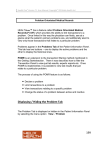
Health One Version 7.1 User Manual. Copyright 2011Helix Health Ltd Analysing Patient Information One of the strengths of HEALTHone™ is its ability to analyse patient information. There are two categories of analyses: Individual Patient and Population. Below are listed the types of analyses available in each category: Individual Patient Analyses Item Analysis o o Active Item in a patient’s file Any Item in a patient’s file HCR Analysis - Multiple items in a patient’s file. Prescription Analysis - Drugs prescribed for a patient. Grid Analysis - Numerical data, table/graphic representation, i.e. audiometry charts, percentile charts etc. Population Analyses Template - Produce a document that can be viewed, printed/saved. Database - Produce results that can be viewed, printed and/or exported. These analyses all use pre-set analysis definitions. It is also possible for you to create your own definitions to add to the existing lists, however; it is beyond the scope of this manual to describe how this is done. In this session we will be using the standard definitions as supplied with the product. The various analyses are selected via the HEALTHone™ Analysis Toolbar. In the case of individual patient analysis the patient’s HCR must be opened before selecting the analysis. Population analysis does not require a patient’s HCR to be open. 97 Health One Version 7.1 User Manual. Copyright 2011Helix Health Ltd The patient John Test has a very mixed history. Ideal for analysis: Getting Started 1) Start HEALTHone™ and Login. Patient selector window is now open. Opening a Health Care Record To open an existing patient’s HCR: 2) Type: Te in the surname filter 3) Select John Test in the patient list. 4) Click on the Select button. 98 The Health Care Record for John Test opens. Health One Version 7.1 User Manual. Copyright 2011Helix Health Ltd Item Analysis Item analysis has two forms, Active Item or Any Item. Each has its own button on the HEALTHone™ Analysis Toolbar. Active Item Analysis button. Technique: click once on any item you would like analysed. Next, click on the button. An analyse window opens and displays the value of each occurrence in the patients HCR.. Any Item Analysis button. Technique: click once on the button and select the item to be analysed from the item list. An analysis window opens and displays the value of each occurrence in the patients HCR.. Active Item Analysis For this we will use the aggregate item Blood Pressure. This is very handy when you would like to see at a glance previous pressures. 1) Select the consultation of the 24/10/1994 by clicking on it once in the transaction overview panel. 2) In the HCR Transaction Detail panel click once on the bold print item: blood pressure 3) Now click on the Active Item Analyse Button. The Active Item analysis window opens and shows all blood pressures recorded in the file 4) Experiment with selecting different options in the display filter. 5) Close the analysis window by clicking once on the cross in its top 99 Health One Version 7.1 User Manual. Copyright 2011Helix Health Ltd right hand corner. Any Item Analysis This analysis does not require the item that is to be analysed to be preselected. 1) Click on the Any Item AnalyseButton 2) Type: wei in the Item find box. Select the item: weight. 3) Click OK Item Analysis: weight’ window opens and displays results. HCR Analysis This is a more complex analysis of the Health Care Record. Clicking on the Analysis button, will cause a list to be displayed. This list contains pre-set analysis definitions. Select the one you require and then click on the Execute button. The result is displayed in an analysis window 100 Health One Version 7.1 User Manual. Copyright 2011Helix Health Ltd 1) Click on the HCR Analysis Button. 2) Select Liver Profile from the list. 3) Click on the Execute button. Liver function analysis is performed and displayed in a HCR Analysis window. Some of the HCR analysis definitions prompt you for a response, i.e. for a start/end date. 4) Close the HCR Analysis window and then click on the HCR Analysis button once again. 5) This time select the Between date x and date y analysis. Click on 101 Health One Version 7.1 User Manual. Copyright 2011Helix Health Ltd the Execute button. The analysis runs and prompts for a start date. 6) Enter 01101997 as a start date. Click on the TICK to incorporate the date into the analysis scenario. The analysis now prompts for an end date. 7) Enter 01101998 and once again click on the TICK. The OK button should now be active. Click on the OK button. Detail of items between the specified dates are displayed. 8) Close the Analysis Window. Prescription Analysis Like the HCR Analysis in the previous example, the Prescription Analysis also uses pre-set analysis definitions. Clicking on the Prescription Analysis button, , will cause the analysis list to be displayed. Select the analysis you require and then click on the Execute button. The result is displayed in an analysis window 1) Click on the Drug Analysis Button. 2) Select Active therapy from the list. 3) Click on the Execute button. Active therapy analysis is performed and displayed in a Prescription Analysis window. 4) Close the Analysis Window. Select File / Close to close John Test’s file. 102 Health One Version 7.1 User Manual. Copyright 2011Helix Health Ltd Population Analysis The population analysis also uses pre-set analysis definitions. There are two different categories: Template and Database. The Template analysis examines every patient’s HCR, and as a consequence may take time to complete dependant upon the size of your practice. The Database analyses are much faster because they use a different method to access the patient data. The population analysis window is displayed by clicking on the population button . Unlike the other analyses, population analysis does not require a patient’s file to be open. Display all the patient data in chronological order This is an extremely useful new function which allows you to view the patient’s file in one « page » that you can scroll through. You can easily search all the data for any text you like. You can access this feature by clicking on the icon « display all data in chronological order » on the toolbar When you click on this icon you are presented with the following screen : 103 Health One Version 7.1 User Manual. Copyright 2011Helix Health Ltd You can now search all the data in the patient record simply by typing some text in the search box : You will see all the instances of the searched for text including the dates involved. This can be extremely useful for finding any information you wish in the patient’s file. Database Analysis (Data Ware House – DWH – Built in Analysis) There are a number of pre-set database analysis all of which display their results on screen and many additionally allow the results to be printed as a report. HEALTHone™ provides an additional tool – called Query Tool which can be used to create your own reports. Example of Database Analysis with a Screen Display Result Only: 1) Click on the Population Analysis Button on the toolbar 2) Double click the Cube Analysis entry in the list. 104 Cube Analysis expands and reveals the ‘Patients Cube analysis. Health One Version 7.1 User Manual. Copyright 2011Helix Health Ltd 3) Click on the PatientsCube (Sex, Age Class, Private/GMS) analysis to select it and then click on the EXECUTE button. Cube analysis activates and displays the results in a window. This particular analysis is purely visual and you are not able to produce in report form. Other types of analysis are displayed and can also be reported and/or exported to other products. We will now close the current analysis and open a new one. 1) Close the current analysis by clicking once on the Red X in the top left hand corner of the window. 2) Double click the Patients seen entry in the list. Patients seen Analysis expands. 3) Click on the Patients with an actual encounter analysis and then click on the EXECUTE button. Patients seen analysis opens. This particular analysis requires additional information before it can be executed. You can select patients by a specific date range or by count of last days: 4) Select the Last Days option and enter a value for the Day count. 5) Now execute the analysis by clicking on the green right facing button on the tool bar. (see illustration). 105 Health One Version 7.1 User Manual. Copyright 2011Helix Health Ltd 6) Experiment with these values and date ranges until you obtain a result. Remember to reselect the execute button to reanalyse each time the values are changed. Analysis produces a results grid Once you have produced a result from a database analysis you can: Simply view it on screen Produce a report of the results Export the results to another product Viewing Results You can control the grid display in the following ways: Viewing Results – Maximise The Window - Click on the centre button of the window control in the top left hand corner of the window. 106 Health One Version 7.1 User Manual. Copyright 2011Helix Health Ltd You can also change the column widths by placing the cursor in the middle of the columns until you get a double arrow icon, then hold down the left mouse button and drag to column to the width you require. Produce a Report Of The Results To produce a report of the analysis result you simply click on the preview button. Some reports have a pre-set format regardless of the settings of the grid; others will reflect any changes made to the grid. Once previewed clicking on the print button in the preview window will print the report. 1. Click on the Preview button at the top of the screen 2) If you wish print the report by clicking on the Print button. 4) Close the preview window. Close the analysis window. Close the Population Analysis Window. 107 Health One Version 7.1 User Manual. Copyright 2011Helix Health Ltd Patient selector window should now be back in view. Exporting the results To export the results click on the export button in the analysis window to Save it to the location of your choice as a delimited text file or press the export to excel button to export the report to MS excel. Grid Analysis This form of analysis is specifically suited (although not exclusive) to analysing and displaying numeric information. The analysis is performed on a patient rather than population basis. Once extracted the analysed information can be displayed in a table or as a graph. Grid analyses are based on one of three sources: Predefined Grid Analyses Any Sequence of Items Any Aggregate Item When you are more experienced with using HEALTHone™ you will be able to create your own Grid Analyses, Sequences of Items and Aggregate Items. For now, we will use those supplied as standard with the product. 108 Health One Version 7.1 User Manual. Copyright 2011Helix Health Ltd In addition there are two predefined analyses: Growth Analysis Audiometric Analysis These each have their own button in the Grid Analysis window (see below) and require no further action other than clicking on them. Technique Open the patient file to be analysed. Activate the grid analysis (by clicking on the Grid Analysis Button on the HCR Analysis Toolbar The Grid Analysis Window opens: Select the source required, Grid, Sequence or Aggregate Item by clicking on the Grid Analysis Source Selection Button. Then press OK to see the analysis 109 Health One Version 7.1 User Manual. Copyright 2011Helix Health Ltd The results are initially displayed in tabular form in the Grid Analysis window. You can now: Filter the results Choose which results are displayed. Choose how to display the results – Grid or Table. John Test’s HCR should still be open. If you have closed it in the meanwhile open it again now. Example: Activating the Grid Analysis 1) Click once on the Grid Analysis Button on the HCR Toolbar. 110 Health One Version 7.1 User Manual. Copyright 2011Helix Health Ltd Grid Analysis Window opens. 2) Click on the Grid Source Selector Button. Grid Selector Window opens. 3) Ensure that Grid is the selected source. 4) Select BLOOD PROFILE as the analysis in the group box. 5) Click on the Select Period box to tick it. 6) Click on OK to begin the analysis. Because the Select Period box was checked you are now prompted to enter a date range. 7) There is no need to type the forward slash marks in the date. Select the from date and type 01 01 1994 Select the to date and type 31 12 1995 Analysis on John Test blood results appears in tabular form in the Grid Analysis Window. Choosing a Table or Graph 111 Health One Version 7.1 User Manual. Copyright 2011Helix Health Ltd 8) Click on either display modem button to switch between Table and Graph displays. 9) Select Graph display – from there you can then choose if it is stacked or overlapping axis via buttons once again: 10) Choose each graph type in turn 11) Reselect the Table display once more. Printing Grid Analysis When the Grid Analysis Window is open you can print whatever is displayed by selecting the menu sequence: 112 Health One Version 7.1 User Manual. Copyright 2011Helix Health Ltd 7) File/Print Closing the Grid Analysis Window This can be done by clicking on the cross it the top right hand corner of the window or by selecting the menu sequence: 8) File/Close Grid Analysis. Summary Guide 1. To analyse a selected item Short Cut = Ctrl + I Open the file of the patient to be analysed. Select the item to be analysed and click once on the ‘Analyse Active Item’ button on the HEALTHone™ Toolbar. 113 Health One Version 7.1 User Manual. Copyright 2011Helix Health Ltd 2. To analyse any item Short Cut = Ctrl + M. Open the file of the patient to be analysed. Click once on the ‘Analyse Any Item’ button on the HEALTHone™ Toolbar. Select the item required to be analysed from the list. 3. To analyse the complete Health Care Record for a patient. Open the file of the patient to be analysed. Click once on the ‘Analyse HCR’ button on the HEALTHone™ Toolbar. Select the analysis required from the list and click the Execute button. 4. To analyse the drugs prescribed to a patient Open the file of the patient to be analysed. Click once on the ‘Analyse Drugs Prescribed’ button on the HEALTHone™ Toolbar. Select the analysis required from the list and click the Execute button. 5. To analyse the entire patient register. Short Cut = Shift + F7. Click once on the Analyse Population’ button on the HEALTHone™ Toolbar. Select the analysis type: Now select the analysis required from the list displayed and click the Execute button 6. To create a grid analysis Open the file of the patient to be analysed. Activate the grid analysis window by clicking on the ‘Display as Grid’ button on the HEALTHone™ Toolbar. Now, decide on the type of grid analysis required and click on the appropriate button in the grid analysis window: Growth Analysis, Audiometric Analysis, Grid Analysis If you select a grid analysis the grid selector window will open. Now select the grid analysis source: Grid Aggregate Sequence Select the analysis required from the list. Click OK. 114 Health One Version 7.1 User Manual. Copyright 2011Helix Health Ltd Own Notes 115