1
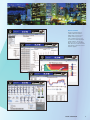
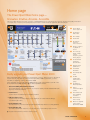
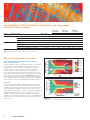
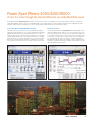
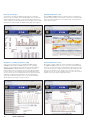
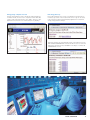
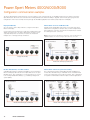
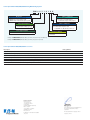
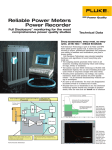
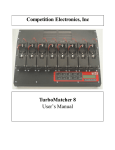
Power Xpert Architecture Power quality and energy meters Power Xpert Meters 4000/6000/8000 2 EATON CORPORATION Power Xpert Meters 4000/6000/8000 Power quality and energy meter You can’t manage what you can’t measure, and you certainly can’t measure something you can’t even see—without a power quality instrument, that is. Invisible and fleeting power disturbances can be silent killers—the electronic equivalent of high blood pressure. Eaton’s Power XpertT Meters 4000/6000/8000 provide comprehensive, world-class power measurement and monitoring that reduce day-today operating costs and help avoid costly business interruptions. EATON CORPORATION 3 Power Xpert Meters 4000/6000/8000 Power quality and energy monitoring and management is now as easy as surfing to it with your Web browser, or you can “Twist-and-Click” on the LCD display! 1Communications LED 1 2Events LED 2 3320 x 240 pixel backlit LCD graphic display 4Ethernet RJ45 configuration port 5Navigation control dial 3 6Back-button 6 Display measurements 5 4 1Control power input display and ModbusT card 3Communication 4 expansion card • 8 digital inputs • 2 solid-state outputs • 3 relay outputs 6Voltage terminal • Modbus TCP • Web server communications • NTP time synchronization • RS-485 Modbus RTU port • RS-232 Modbus ASCII port EATON CORPORATION Depth: 2.00 inches (50.8 mm) • Shipping weight: 2.1 lbs. (0.95 kg) 3 transformer terminal 100F and 10/100Base-T Ethernet E-mail on alarm, periodic data e-mail Width: 7.80 inches (198.1 mm) • 4 5Current • • Height: 9.00 inches (228.6 mm) • 4Digital I/O card 2Configuration, • 2 1 7Auxiliary voltage terminal Meter module measurements • Height: 8.88 inches (225.6 mm) • Width: 9.56 inches (242.8 mm) • Depth: 6.72 inches (with connectors, 170.8 mm) • Shipping weight: 7.1 lbs. (3.22 kg) 6 5 7 Internet enabled The Power Xpert Meter is a Web-enabled (includes a built-in Web server) power quality and energy meter with comprehensive power measurement and integrated quality analysis. The meter allows you to use a standard Web browser to surf the meter and analyze waveforms, trend and ITIC graphs. EATON CORPORATION 5 Power Xpert Meters 4000/6000/8000 Innovative. Intuitive. Accurate. Accessible. The meters combine state-of-the-art technology with ITIC diagnostics, waveform capture, data trending and performance benchmarking, along with a “Twist-and-Click” graphic display: a new paradigm for simplicity and ease of use in the marketplace. The embedded Web server enables users to surf to the meter over the Internet via a standard Web browser. The new platform offers advanced functionality like high-speed impulsive transient capture, 6 MHz sampling rate (100,000 samples per cycle), anti-aliasing, ITIC analysis and automatic trigger setting, field-upgradeable firmware, memory up to 8 GB, and optional digital, relay and solid-state I/O. Applications Identify power quality problems to help • Identify harmonics, sags, swells and transients damaging or disrupting sensitive, mission-critical IT equipment • Boost IT equipment service life to the maximum • Analyze sequence of events up to one millisecond time resolution • Protect motors from damage • Preserve the integrity of processes and batches • Prevent blown capacitor bank fuses • Protect transformers and conductors from overheating Detect and record high-speed transients to help • Avoid equipment damage and disruption • Identify equipment malfunction Features and benefits • Embedded Web server—see and analyze waveforms, trends and harmonics directly in your Web browser or LCD meter graphic display • Automatic power quality analysis and trigger setting with available ITIC performance curve: detect and capture sags, swells, transients, harmonics and flicker • Accurately detect fast transients that previous generation monitors would miss, by assessing circuit activity at very high sampling rates (up to 100,000 samples per cycle) • Comprehensive power, energy and demand measurements for 145 standard data points logged Monitor circuit loading to help • Avoid overloads and nuisance overload trips • Maximize equipment utilization • Manage emergency overloads Manage energy utilization to help • Reduce peak demand charges and power factor penalties • Identify excessive energy consumption 6 EATON CORPORATION • Voltage, current: per phase minimum, maximum, average, trend graph analysis, export, print • Power: power factor, apparent, real, reactive, frequency • Energy, demand: forward, reverse, net, sum, TOU, profile, previous month comparison, graph analysis, export, print • Up to one millisecond time synchronization and event logging capability for sequence of events analysis • Get an at-a-glance view of power quality with patented Power Quality Index gauge, statistically derived trending and red-yellow-green indicators for overall power health • Support continuous, non-disruptive monitoring with a permanently installed meter • Dramatically reduce the cost of monitoring power quality, compared to yesterday’s specialized power quality instruments and consultants • Alarm notifications are also available remotely via e-mail with waveform attached, with expansion communication card • Use industry-standard communication protocols to support a multitude of configurations and third-party software: HTTP, FTP, Modbus RTU, Modbus TCP, SNMP, SMTP, NTP, COMTRADE • Up to 8 GB data storage capability • Supported via Power Xpert Software and Power Xpert Architecture hardware components • ANSI C12.20 accuracy Home page The Power Xpert Meter home page— Innovative. Intuitive. Accurate. Accessible. The Power Xpert Meter home page, viewed in a standard Web browser, summarizes the top-level critical power quality information on a single page. Complex power quality data is presented in useful and simple graphical charts and gauges. 3 1 4 6 5 1 Power Xpert 2 device type icon 2 3D function button bar 3 Time stamp 7 4 Event LED 5 Drop-down 8 L menu for meter selection 6 Picture of device 9 M K 0 or graphic of choice 7 3D “mercury- filled” voltage, current, frequency, power factor gauges 8 3D arrowhead N P O Q pointing to present value 9 Measurement parameters 0 Underlined Easily upgrade your Power Xpert Meter 4000 Eaton understands that our customers’ needs change over time. That’s why we’ve developed meters that can grow with you. Once a Power Xpert Meter 4000 is purchased, you have the ability to upgrade to a Power Xpert Meter 6000. Once upgraded, the Power Xpert Meter 4000 will have all its original features, plus all of the Power Xpert Meter 6000 capabilities.A The added capabilities include: Web links K Demand profile chart L 3D PQ health index thermometer gauge M 3D LEDs for PQ temperature • The Power Quality Index Enhanced Version View a quick display of the “temperature” of your power quality; includes standard index plus sag level, swell level and flicker N Active, • Interharmonics See the effects of loads that are not multiples of 60 Hz O One millisecond • ITIC performance curve See how much (or how little) voltage your IT equipment can sustain without damage, over what length of time • Events Calendar view View the frequency of power events and gain insight that helps detect reoccurring problems unacknowledged events time stamping resolution P Quick links to meter setup Q Button to upgrade to the Power Xpert Meter 6000 • Events Timeline view View and understand the sequence of events that have occurred during a period of time A*The upgraded Power Xpert Meter 4000 will retain its 2 GB memory capacity. EATON CORPORATION 7 Power Xpert Meters 4000/6000/8000 The Power Xpert Meter 6000 Three flavors of power monitoring This meter is geared toward the IT market by providing automatic trigger settings for IT equipment and plots events on an ITIC (Information Technology Industry Council) performance curve so they can be very easily analyzed. In addition, this meter offers a patented Power Quality Index temperature gauge along with flicker calculations and 4 GB of data storage. The Power Xpert Meter 4000 The Power Xpert Meter 8000 This meter provides all the core functions for monitoring power consumption and power quality along with 2 GB of data storage. This unit uses Delta Sigma technology to sample circuits at 4,096 samples per cycle for extremely accurate measurement of power factor and energy consumption. This meter adds the ability to capture very fast transients by sampling at 6 MHz—100,000 samples per cycle. That’s a sample every 166 nanoseconds—six samples every millionth of a second, across three input channels as well as neutral-to-ground. In addition, the meter has a capacity of 8 GB for data storage. Features and benefits of the Power Xpert Meters 4000/6000/8000 Power Xpert Meter Feature 4000 6000 8000 Benefit Embedded Web server n n n Use a standard Web browser to monitor and manage the meter over the network, Internet TOU metering support n n n n n n n n n Time of usage can be set up to support 4 different schedules Voltage, current: per phase minimum, maximum, average, trend graph analysis, export, print n n n Review voltage and current trends, export, print and analyze parameters right on the meter or external software Energy and demand plot comparisons month-to-month, week-to-week n n n Plot two months or two weeks for vivid energy or demand comparison Power: power factor, apparent, real, reactive, frequency n n n Review power usage and power factor and avoid potential PF penalties Energy, demand: forward, reverse, net, sum, TOU, profile, previous month comparison, graph analysis, export, print n n n Keep track of your energy usage, compare time of usage and usage against previous month, identify peaks to conserve energy usage n n n n n n Review statistical trends, identify past and future problem areas Symmetrical components: zero, negative, positive n n n Analyze possibly unbalanced three-phase power systems Low frequency transient detection and capture n n n Capture lower frequency transient waveforms for retrospective analysis or e-mailing Sampling rate, maximum samples/cycle 4096 A 4096 A 100,000 Extremely high sampling rate will effectively capture impulsive transients “Number of nines” uptime data (e.g., 6 nines = 99.9999%) n n n Review uptime availability percent K-factor n n n Review the ratio of eddy current losses, e.g., when driving non-linear and linear loads Crest factor n n n Review the peak-to-average ratio of the waveform n n n Define appropriate security access level per user General Firmware flash upgrade support Self-learning capability (characterizes “normal” per circuit) Enables you to flash the meter with the latest firmware upgrades The meter can automatically adjust to the environment and alarm only when “real” events occur Power, Energy and Demand Power Quality Analysis Statistical analysis (min., max., average) Sag and swell monitoring, management and recording Capture electrical sags and swells and analyze the waveforms Security Secure 5 level user access privileges A Delta Sigma A/D oversampling rate. NOTE: These specifications are subject to change without notice and represent the maximum capabilities of the product with all options installed. This is not a complete feature list. Features and functionality may vary depending on selected options and product model. Please refer to the technical data sheet and User Manual for detailed specifications. 8 EATON CORPORATION Features and benefits of the Power Xpert Meters 4000/6000/8000, continued Power Xpert Meter Feature 4000 6000 8000 Benefit Modbus TCP n n n Easy integration with standard protocol to power management and other software Modbus RTU n n n Integrate meters to existing Modbus networks, daisy chain several (1–16) meters together HTML n n n n n n Communicate to the meter over the Internet via standard Web browser n n n n Send e-mail messages via standard Simple Mail Transfer Protocol FTP (File Transfer Protocol) n n NTP (Network Time Protocol) n n n Network Time Protocol support enables the meter to synchronize time over the network up to the 1 millisecond resolution COMTRADE, open IEEET standard file format for n n n Import waveform captures in standard IEEE (C37.111-1999) COMTRADE file format to waveform capture export Trend measurements CSV file export n n n Easily export trend measurements to third-party applications, e.g., MicrosoftT ExcelT in standard CSV file format I/O (8 digital inputs, 3 relay outputs, 2 solid-state KYZ outputs) n n n The Power Xpert I/O Card is extremely flexible and can be used in a large variety of different applications. Digital inputs and relay outputs can be programmed to interact during various conditions defined by the user. Various third-party devices, such as alarm, pulse meters, trip units and sensors, can be easily integrated into the Power Xpert Meter. Triggers and events can be tied to the meter’s standard functions, such as e-mail, logs and trends NTP time synchronization up to 1 millisecond accuracy n n n Network Time Protocol support enables the meter to synchronize time over the network up to the 1 millisecond resolution GPS time synchronization up to 1 millisecond accuracy nB nB nB Allows the meter to synchronize time over the GPS satellite positioning system up to the 1 millisecond resolution n n n n n n Log trend information for easy statistical analysis Load profile Event logging n n n Log events for retrospective event analysis 2 4 8 Store large amounts of waveform captures and events for historical analysis Communications and I/O SNMP (Simple Network Management Protocol) SMTP (Simple Mail Transfer Protocol) Communicate with the meter via Simple Network Management Protocol; hook to existing Network Management system Access, copy, paste, cut waveform capture files on the meter with an FTP Client Time Synchronization Logs Trend logging Review the load profile graph to get a better understanding of your electrical load versus time Memory and Storage Standard memory, GB B When used with third-party device and I/O option. NOTE: These specifications are subject to change without notice and represent the maximum capabilities of the product with all options installed. This is not a complete feature list. Features and functionality may vary depending on selected options and product model. Please refer to the technical data sheet and User Manual for detailed specifications. EATON CORPORATION 9 Features and benefits of the Power Xpert Meters 4000/6000/8000, continued Power Xpert Meter Feature 4000 6000 8000 Benefit Harmonic levels 127 127 127 Provides extremely fast, high resolution D/A conversion Total Harmonic Distortion (THD) n n n n n n Review the total harmonic distortion level directly on the meter Harmonics over-sampling (4096 samples per cycle) n n n Over-sampling enables the usage of anti-aliasing technology, increasing accuracy Anti-alias filtering n n n Technology to remove out-of-band signal components resulting in more accurate data Individual harmonics n n n n n n Review individual harmonic levels directly on the meter Total Demand Distortion (TDD) Interharmonics — n n Interharmonics allow you to see what is going on between the integer multiples of the fundamental. View every 5 Hz instead of every 60 Hz Sub-cycle disturbance capturing n n n Capture fast voltage changes/low frequency transient (e.g., capacitor switching transient) dV/dt triggers for sub-cycle oscillatory transients n n n Detect and record a large magnitude oscillation transient resulting in equipment damage Absolute threshold and dV/dt triggering n n n n n n Detect and record if a surge suppressor is necessary Power Quality Index—Enhanced (includes Standard Index plus Sag level, Swell level and Flicker) — n n Complex power quality data put into simple graphic format (includes ITIC events and flicker calculations) Flicker calculations — n n Detect and quantify low frequency rms voltage variations causing incandescent lighting flicker Automatic trigger setting — n n Trigger thresholds are automatically set according to ITIC (CBEMA) standard, no need to figure this out by yourself Automatic event severity analysis — n n Automatically analyze the severity of the event with the ITIC (CBEMA) performance curve plot, see where the event actually hit Event severity counters — n n An ITIC (CBEMA) event counter keeps track of the number of all sags, swells and transients ITIC (Information Technology Industry — Council), previously CBEMA performance curve n n ITIC (Information Technology Industry Council), previously CBEMA performance curve for easy power problem evaluation Custom ITIC (CBEMA) plot with individual — event magnitude and duration n n Review custom ITIC (CBEMA) plots of individual events showing you the actual and hit are in a simple graphical representation Events Calendar view — n n The Events Timeline calendar view provides instant insight to the frequency of power events and helps detect reoccurring problems Events Timeline view — n n View and understand the sequence of events that have occurred during a period of time Sequence of events and events plot on waveform — n n Plot color-coded events on a captured waveform to gain insight into the sequence of events cycle per cycle Power Quality Index—Premium (includes Enhanced Index plus counts of impulsive transients) — — n Complex power quality data put into simple graphic format (includes ITIC events and flicker calculations) Harmonics Delta-Sigma D/A conversion technology Provides extremely fast, high resolution D/A conversion Identify harmful harmonics in, e.g., lightly loaded variable-speed drive environments where THD may be high but not relative Highlights Power Quality Index—Standard (includes dV/dt count, %TDDi and %THDv) Complex power quality data put into simple graphic format High-speed transient capture and detection 6 MHz capture of impulsive transients — — n Capture impulsive transients by taking 6 samples every millionth of a second Transient capture duration: ~20 ms/6 MHz ~120 ms/1 MHz — — n Record and analyze transients during a longer time frame Waveform recorded at 100,000 samples per cycle — — n High speed ensures impulsive transients are correctly captured (fast rise time) Three-phase voltage and neutral-to-ground — fast transient capture — n Capture impulsive transients on all four channels NOTE: These specifications are subject to change without notice and represent the maximum capabilities of the product with all options installed. This is not a complete feature list. Features and functionality may vary depending on selected options and product model. Please refer to the technical data sheet and User Manual for detailed specifications. 10 EATON CORPORATION Power Xpert Meters 4000/6000/8000 A world of difference in power quality analysis One millisecond time resolution—most accurate time available Harmonics, voltage fluctuations, transient overvoltage conditions and other power anomalies can wreak havoc on your equipment and processes. It is essential to fully understand the quality of the power that is being delivered throughout the facility. Detailed event information makes it possible to pinpoint the root causes of problems—or prevent them from occurring. With up to one millisecond time stamping accuracy supported via GPS and IRIG-B time references when used with third-party device and I/O option, Power Xpert Meters register the sequence of events in a time synchronized environment. Based on National Institute of Standards and Technology (NIST) atomic time, you can count on the most accurate time available. In the past, basic power monitors were used to identify existing conditions on an electrical distribution system or to evaluate past problems. If you wanted to detect fast voltage transients, you had to bring in expensive, portable power quality monitors that usually required an outside consultant. Built-in graphing—up to six samples every millionth of a second Power Xpert Meters 4000/6000/8000 redefine the art of measuring and monitoring power quality. Thanks to the latest technologies, these metering instruments are able to measure, trend, analyze and capture waveforms while serving Web pages to users over the Internet, along with simultaneous FTP downloading and comma-separated values (CSV) exporting capabilities. No matter whether you are a PhD-level power quality engineer or an IT system Power Quality Index The patented Power Quality Index measures the “temperature” of your power quality. The gauges’ alarm levels are based on current TDD%, voltage THD%, and K and C factors. Flicker and ITIC events measurements are also factored in on the 6000 and 8000 models. administrator, these instruments will provide you with the level of information you need, in an easy-to-understand graphical user interface at astonishing speeds of up to six samples every millionth of a second, if necessary. Easy-to-use interface—demystifies power quality In designing these power quality instruments, Eaton set out to demystify power quality—to take highly specialized data and convert it into useful information that doesn’t require a power guru or consultant to understand. The result is an uncommonly easy-to-use interface and graphical analysis of complex power quality data—delivered via e-mail, over the Web and to third-party applications. With these capabilities, your power team can predict and prevent power quality problems before they lead to equipment malfunction, overheated circuits and system failure. Multiple gigabyte storage capability—store and trend 10–25 years’ worth of data Having enough storage capacity is a critical factor at this level of power quality instrumentation. How long can I store data locally on the power quality meter before the system will have to start overwriting previously captured information? A Power Xpert Meter 4000 provides 2 GB of storage; the 6000, 4 GB; and the 8000, 8 GB. In a typical power quality environment this would provide storage capability for 10–25 years depending on the meter model. One Millisecond Time Resolution Accuracy: By taking readings at sub-cycle levels—like the Power Xpert Meter 8000 model, which can sample at a rate of 166.67 nanoseconds per sample—Power Xpert Meters let you accurately see the detailed performance of each piece of gear they are connected to. Time: To understand the cause and effect of events, you need to be able to analyze the interaction of equipment and the sequence of events. This requires accurate time synchronization across the system. EATON CORPORATION 11 Power Xpert Meters’ 4000/6000/8000 estimated memory and storage capacity with 2/4/8 GB memory capacity Occurrence per Month A Memory Usage (MB) Months of Capacity B Model Memory Event File Size (KB) Typical Severe Typical Severe Typical Severe PXM4000 2 GB Subcycle Disturbance 1260 10 60 12.3 73.8 166 28 PXM6000 4 GB ITIC Event 1260 5 20 6.2 24.6 666 166 Subcycle Disturbance 1260 10 60 12.3 73.8 333 55 ITIC + Subcycle Disturbance Combined PXM8000 8 GB ITIC Event Total g 1260 15 80 18.5 98.4 222 42 5 20 6.2 24.6 1332 333 Subcycle Disturbance 1260 10 60 12.3 73.8 666 111 Transients 2048 3 30 6.0 60.0 1365 137 18 110 24.5 158.4 335 52 ITIC + Subcycle Disturbance + Transients Total g A The typical and severe power quality event occurrences are estimates and may vary depending on the electrical environment. B Memory is not allocated by event category; memory is used first come, first served. Built-in ITIC performance curve analysis 3 Takes the guesswork out of understanding the severity of IT Power Quality events The ITIC (Information Technology Industry Council) curve describes how much (or how little) voltage your IT equipment can sustain without damage, over what length of time (nanoseconds to seconds). When you can plot power events in this broader context—relative to multiple variables—you can identify trouble that could cause damage or may be brewing. Of the few meters that can plot events on an ITIC curve, most require special software to do it. Eaton’s Power Xpert Meters 4000/6000/8000 require no special software. Out of the box, these meters provide crisp graphics on minimum, maximum, average trends, measurement gauges, waveforms both on the local LCD display and the Web interface. ITIC curves The Power Xpert Meter 6000 and 8000 models automatically plot events on the ITIC curve. The user can drill down on any specific event and get information on where exactly the event hit and what was its magnitude and duration. Using a network time server, all events get time stamped at a 1 millisecond synchronized resolution. The ITIC Web page includes counters to track the occurrence of disturbances and a pass/fail summary. In addition, selecting any disturbance counter links to a detailed event view of the disturbances in that ITIC category. Disturbance waveforms can be viewed from the browser. 12 EATON CORPORATION ITIC Curves Sample ITIC curve as displayed by the Power Xpert Meter Power Xpert Meters 4000/6000/8000 Access the meter through the Internet/Ethernet via embedded Web server Power Xpert Meters 4000/6000/8000 offers Eaton customers a new level of accessibility to the critical information required to manage the electrical distribution system. The meter’s embedded Web server includes real-time circuit information in both numeric and graphical visual formats to help monitor circuit parameters, such as current loading, voltage and power levels and power factor. Power Xpert Meters 4000/6000/8000 home page Historical trend plot The Web server also provides the energy and demand readings required to help manage the cost of energy. Readings include KWh, KVARh, delivered and received and KVAh with time of use and separate status input controlled energy accumulation to account for energy during special times, such as rate alert periods or stand-by generator times of operation. The Web server on the Power Xpert Meters also includes critical information regarding power quality, such as harmonic distortion, flicker, crest factor, K-factor and more. The Power Xpert Meters’ 4000/6000/8000 embedded Web server supports graphical trend charts of key circuit measurements, such as current, voltage, power and energy. The trend chart supports a zoom feature that allows the user to view data over a short period of 18 hours or a longer period of 48 months. The trend chart has a horizontal slider bar control to manage scrolling forward and backward through the data. Trend charts of basic readings include minimum, maximum and average readings. Trend charts of energy data also display demand values. EATON CORPORATION 13 Harmonic spectral plot Events Calendar view screen The harmonic spectral plot displays both harmonics and interharmonics up to the 85th order. A detailed table also includes individual magnitudes and angles of current and voltage harmonics as well as a harmonic power calculation at each frequency. Even, Odd, Interharmonic and total THD are displayed for diagnostic purposes. On the 6000 and 8000 models, the Events Timeline calendar view provides instant insight to the frequency of power events and helps detect reoccurring problems. Color-coded events can be filtered to detect specific issues. Disturbance recording sag/swell recording Events Timeline view screen Sixty cycles of waveform are oversampled at 4096 samples (100,000 samples with the 8000 meter) per cycle, including 30 cycles of pre- and post-event data. The Power Xpert Meters’ 4000/6000/8000 embedded Web server supports viewing of triggered waveforms one channel at a time, including the ability to zoom and to scroll horizontally using a slider bar. Waveforms are stored in meter’s non-volatile flash memory using an industry standard Comtrade format. Waveforms can be automatically sent out by e-mail following an event, or can be retrieved from an FTP directory structure in meter’s memory. By clicking on a date within the Events Calendar view (available in the 6000 and 8000 models), the user can view and understand the sequence of events that have occurred during a period of time. Plot color-coded events on a captured waveform to gain insight into the sequence of events from one single cycle to the next one. This provides the user an excellent vantage point to review and compare multiple events at an unprecedented resolution. 14 EATON CORPORATION Energy usage comparison screen FTP energy directory Energy usage patterns can be effortlessly analyzed with the month-to-month, week-to-week comparison chart. Raw data can be easily exported with the “Save Table” option to other applications such as Excel for further analysis or graphing. Power Xpert Meters save energy consumption measurements in monthly logs stored on the meter’s FTP server. Logs can be easily read, copied or imported into third-party applications for detailed energy usage patterns analysis. Waveform captures are automatically stored on the FTP server in the IEEE standard COMTRADE file format. This allows users to view and analyze the waveforms in any standard free-of-charge or commercial COMTRADE file viewer. EATON CORPORATION 15 Power Xpert Meters 4000/6000/8000 Configuration communication examples The Power Xpert Meters fit seamlessly into most any existing or new environments due to standard and open protocol support. The Power Xpert Architecture allows the users to build on their existing infrastructure and the flexibility to upgrade as their needs grow going forward. Configuration of the meters is simple and easy through the Web-based graphical user interface (GUI) and/or the LCD display. Display link (RS-485) Web enabled—browser and Modbus TCP Up to 16 meters can be daisy-chained to a single Power Xpert Meter LCD display. Web browsing and Modbus TCP master connectivity have been added in this configuration example. Only one Power Xpert Meter has an Ethernet connection. All other Power Xpert Meter modules are utilizing this same connection. Conveniently and cost-efficiently, a single Power Xpert Meter LCD display can support up to 16 Power Xpert Meter modules. This is especially handy when several meter modules are installed in multiple rack or switchgear lineup formations. NNote: Certain restrictions pertaining to waveforms, e-mail sending and other capabilities apply to the meters using the same Ethernet connection. Web Browser Modbus RTU Master Modbus TCP Master Modbus Slave Network Display Link (RS-485) Modbus RTU LCD Display Sub-Network Modbus RTU (RS-485)—non-Web enabled Web enabled—advanced system functionality A Modbus RTU Master is supported in addition to the Power Xpert Meter LCD display sub-network. Power Xpert Meters are set up as Modbus slaves. This configuration is a cost-efficient way to connect to an existing Modbus RTU Master, e.g., a building management system (BMS). This configuration provides full Modbus RTU/TCP capabilities as well as direct Web browsing to individual meters. In addition Web services are supported to Power Xpert Software. This configuration is required for full Modbus and Power Xpert Software applications. Modbus RTU Master Modbus RTU Master Power Xpert Software Web Browser Modbus TCP Master Modbus Slave Network Modbus Slave Network Modbus RTU LCD Display Sub-Network 16 EATON CORPORATION Modbus RTU LCD Display Sub-Network Digital I/O card usage examples The Digital I/O card option enables multiple sensor devices to be attached to the meter, including alarm horns, water on the floor, door open or motion detection among others. Solid-state digital outputs support KYZ pulses and the three relay outputs can be easily connected to third-party devices and controlled depending on the digital inputs (Boolean functionality support). Rack Monitoring Open Door/Tamper Switch Flow Meter (Pulse Count) Alarm • Eight digital inputs • Two solid-state digital outputs • Three relay outputs Trip and Sequence of Events To find out more about how Power Xpert Meters can improve power performance for your critical systems, visit our Web site at www.eaton.com/powerxpert or contact us at 1-877-ETN-CARE (1-877-386-2273). EATON CORPORATION 17 Power Xpert Meter 4000/6000/8000 Available accessories Graphic display module AUX voltage input channels The graphic display module provides an at-a-glance view of power quality, with intuitive visual displays, statistically derived trending and indicators of overall power health. In addition it has an RJ-45 Ethernet port built right into the faceplate for easy and safe meter configuration. The optional Voltage Auxiliary (VAUX) option provides three voltage input channels (V6, V7, V8) in addition to the standard four channels already built in. Mounting options Communication expansion card An optional communication expansion card supports remote communications with the onboard Web server application over your LAN/WAN, or the Internet via standard Ethernet 10/100Base-T and fiber-optic connection. Modbus is supported over TCP, RS-485 RTU and RS-232 ASCII ports. I/O card The Power Xpert Meter I/O Card is extremely flexible and can be used in a large variety of different applications. Digital inputs and relay outputs can be programmed to interact during various conditions defined by the user. Various third-party devices, such as alarm, pulse meters, trip units, sensors can be easily integrated to the Power Xpert Meter. Triggers and events can be easily tied into the meter’s standard functions, such as e-mail, logs and trends. 18 EATON CORPORATION • Back-to-back mount • IQ Analyzer retrofit mount • Reduced LCD display mount Power Xpert Meters 4000/6000/8000 Go green. ™ Exceptional tools to help you visualize energy usage and go green Environmental stewardship, innovation and leadership are becoming increasingly important as we take steps to create a sustainable environment for future generations by going green. The Power Xpert Meter includes components that can help a building go green and qualify for Leadership in Energy and Environmental Design (LEEDT) credits through the U.S. Green Building Council (USGBC). The Power Xpert Meter can meter and provide the backbone of load control, measurement and monitoring for on-site power sources. When applying renewable energy, every effort should be made to take advantage of net metering with the local utility. Compare expected energy usage and predict future usage levels Eaton offers the Power Xpert Meter Profiler, which, in conjunction with the Power Xpert Meters, allows you to compare “expected” energy consumption patterns to present usage, and flag areas of concern using deviations from modeled energy patterns. These deviations point to targets as they hunt for energy consumption offenders in their facility. By applying pattern analysis techniques and intelligently using color and shape to convey the results, the Power Xpert Meter Profiler provides the user an easy-to-understand visualization of energy usage. Establish an energy baseline The Power Xpert Meter establishes a baseline of your energy usage. It allows you to easily compare month-to-month energy usage graphs. It will automatically store the energy data for exporting detailed analysis, for example, in Excel. Receive periodic e-mail alerts on energy consumption or triggered by thresholds you have set, to remind you and to help you achieve your savings goals. Power Xpert Meter Profiler’s main screen The tool is also a predictor. It can predict what energy consumption would be expected later in a day by comparing present consumption with historical averages and modifying the look-ahead predictions based on how closely the present consumption matches the predicted values. EATON CORPORATION 19 Power Xpert Meter 4000/6000/8000 Catalog Numbering System PXM 8 0 5 1 A 1 B B Model Series Card Slot 3 Configuration 4 = 4000 (Standard Power Quality), 2 GB 6 = 6000 (Enhanced Power Quality), 4 GB 8 = 8000 (Premium PQ w/Transient Capture), 8 GB A = No Card Option B = I/O Option Card (8 Digital Inputs, 2 Solid State Outputs, 3 Relay Outputs) Voltage Input Configuration Card Slot 2 Configuration 0 = Standard (V1, V2 , V3, V4) 2 = Standard plus auxiliary (V6, V7, V8) A = No Card Option B = Communications Expansion Card w/ 10/100 Base-T, 100F, RS-485, RS-232 Ports Power Supply Configuration 1 = Standard 100–240 Vac or 110–250 Vac Power Supply Card Slot 1 Configuration 1 = Standard Communications Module with RS-485 Example 1: PXM8251A1BB (PXM 8000 Meter, w/ VAUX, Std pwr, Com. Exp. and I/O Cards) Example 2: PXM6251A1BA (PXM 6000 Meter, w/ VAUX, Std pwr, Com. Exp. Card) Power Xpert Meter 4000/6000/8000 Accessories Description Catalog Number Graphic display module PXD-MMG Digital I/O card: 8 digital input, 2 solid-state output, 3 relay output PXMIO-B Communications expansion card: Ethernet 100FX, 10/100T, RS-485, RS-232 PXMCE-B Panel mounting bracket assembly for back-to-back meter to graphic display mounting PX-PMBA Panel mounting bracket assembly for retrofitting a graphic display to an IQ analyzer cutout PX-PMBB Panel mounting bracket assembly required for reduced graphic display rear clearance PX-PMBC Power Xpert Meter 4000 to 6000 license upgrade key PXM-4KUPG Eaton Corporation Electrical Sector 1111 Superior Ave. Cleveland, OH 44114 United States 877-ETN-CARE (877-386-2273) Eaton.com/pxm © 2010 Eaton Corporation All Rights Reserved Printed in USA Publication No. SA02601002E / Z9864 July 2010 Power Xpert and PowerChain Management are registered trademarks of Eaton Corporation. All other trademarks are property of their respective owners.