1
GeneValorization in a Nutshell
Version 3.0
Bryan BRANCOTTE, Anne BITON
and Sarah COHEN-BOULAKIA
October 11, 2010
Contents
1 The
1.1
1.2
1.3
1.4
matrix of GeneValorization
Overview . . . . . . . . . . . . . . . . . . . . .
About Gene names and filters . . . . . . . . . .
Display of the gene names and Disambiguation
Display of a cell . . . . . . . . . . . . . . . . . .
.
.
.
.
.
.
.
.
.
.
.
.
.
.
.
.
.
.
.
.
.
.
.
.
.
.
.
.
.
.
.
.
.
.
.
.
.
.
.
.
.
.
.
.
.
.
.
.
.
.
.
.
.
.
.
.
.
.
.
.
.
.
.
.
.
.
.
.
.
.
.
.
.
.
.
.
3
3
4
4
5
2 Data Import
2.1 Adding, Erasing or Modifying items Manually . . . . . . . .
2.1.1 Making a choice among items in a list . . . . . . . .
2.1.2 Managing the catalog of items . . . . . . . . . . . . .
2.1.3 Erasing all data . . . . . . . . . . . . . . . . . . . . .
2.1.4 Individually delete a filter (column) or a gene (row) .
2.1.5 Individually rename a filter (column) or a gene (row)
2.1.6 Individually authenticate a gene as official or not . .
2.2 Adding elements automatically . . . . . . . . . . . . . . . .
2.2.1 Menu File - Extract from a text file . . . . . . . . . .
2.2.2 Menu File - Open . . . . . . . . . . . . . . . . . . . .
2.2.3 Menu File - Advanced Opening . . . . . . . . . . . .
.
.
.
.
.
.
.
.
.
.
.
.
.
.
.
.
.
.
.
.
.
.
.
.
.
.
.
.
.
.
.
.
.
.
.
.
.
.
.
.
.
.
.
.
.
.
.
.
.
.
.
.
.
.
.
.
.
.
.
.
.
.
.
.
.
.
.
.
.
.
.
.
.
.
.
.
.
.
.
.
.
.
.
.
.
.
.
.
.
.
.
.
.
.
.
.
.
.
.
.
.
.
.
.
.
.
.
.
.
.
.
.
.
.
.
.
.
.
.
.
.
.
.
.
.
.
.
.
.
.
.
.
6
6
7
7
8
8
8
8
9
9
10
10
3 Interacting with the results
3.1 List of publications . . . . . . . . . . . . . . . . . . . .
3.2 Displaying results as charts . . . . . . . . . . . . . . .
3.2.1 Basic view - comparing hits . . . . . . . . . . .
3.2.2 Interacting with several items to compare them
.
.
.
.
.
.
.
.
.
.
.
.
.
.
.
.
.
.
.
.
.
.
.
.
.
.
.
.
.
.
.
.
.
.
.
.
.
.
.
.
.
.
.
.
.
.
.
.
11
11
11
11
12
4 Data Export
4.1 Saving in XML . . . . .
4.2 Export lists and hits . .
4.3 Publications . . . . . . .
4.4 Graph . . . . . . . . . .
4.4.1 Export the graph
4.4.2 Copy the chart .
.
.
.
.
.
.
.
.
.
.
.
.
.
.
.
.
.
.
.
.
.
.
.
.
.
.
.
.
.
.
.
.
.
.
.
.
.
.
.
.
.
.
.
.
.
.
.
.
.
.
.
.
.
.
.
.
.
.
.
.
.
.
.
.
.
.
.
.
.
.
.
.
.
.
.
.
.
.
.
.
.
.
.
.
.
.
.
.
.
.
.
.
.
.
.
.
.
.
.
.
.
.
.
.
.
.
.
.
.
.
.
.
.
.
.
.
.
.
.
.
.
.
.
.
.
.
.
.
.
.
.
.
.
.
.
.
.
.
.
.
.
.
.
.
.
.
.
.
.
.
14
14
14
15
15
15
15
5 Advanced queries
5.1 Data’s Options . . . . . . . . . . . . . . .
5.1.1 Define the species to be considered
5.1.2 Sort publications by . . . . . . . .
5.1.3 Search in various fields . . . . . . .
5.1.4 Wildcard, "*". . . . . . . . . . . . .
5.1.5 Gene names and synonyms . . . .
.
.
.
.
.
.
.
.
.
.
.
.
.
.
.
.
.
.
.
.
.
.
.
.
.
.
.
.
.
.
.
.
.
.
.
.
.
.
.
.
.
.
.
.
.
.
.
.
.
.
.
.
.
.
.
.
.
.
.
.
.
.
.
.
.
.
.
.
.
.
.
.
.
.
.
.
.
.
.
.
.
.
.
.
.
.
.
.
.
.
.
.
.
.
.
.
.
.
.
.
.
.
.
.
.
.
.
.
.
.
.
.
.
.
.
.
.
.
.
.
.
.
.
.
.
.
.
.
.
.
.
.
16
16
16
16
16
16
16
.
.
.
.
.
.
.
.
.
.
.
.
.
.
.
.
.
.
.
.
.
.
.
.
.
.
.
.
.
.
.
.
.
.
.
.
.
.
.
.
.
.
.
.
.
.
.
.
1
.
.
.
.
.
.
5.1.6
Reload the data when starting. . . . . . . . . . . . . . . . . . . . . . . . .
6 Advanced display
6.1 Customizing the results - Display Options . . . . . . . . . . . . . . .
6.1.1 Modifying the font . . . . . . . . . . . . . . . . . . . . . . . .
6.1.2 Change cells size . . . . . . . . . . . . . . . . . . . . . . . . .
6.1.3 Displaying the gene name and the corresponding EntrezGene
is possible . . . . . . . . . . . . . . . . . . . . . . . . . . . . .
6.1.4 Monitor memory usage . . . . . . . . . . . . . . . . . . . . . .
6.1.5 Defining the number of results to be displayed . . . . . . . . .
6.1.6 Defining the maximum length of the publication’s title . . . .
6.1.7 Language . . . . . . . . . . . . . . . . . . . . . . . . . . . . .
6.2 Customizing the curve - Chart’s options . . . . . . . . . . . . . . . .
6.2.1 Using color theme . . . . . . . . . . . . . . . . . . . . . . . .
6.2.2 Modifying plotting aspects . . . . . . . . . . . . . . . . . . . .
6.2.3 Vertical Scale . . . . . . . . . . . . . . . . . . . . . . . . . . .
. . . . . . .
. . . . . . .
. . . . . . .
ID when it
. . . . . . .
. . . . . . .
. . . . . . .
. . . . . . .
. . . . . . .
. . . . . . .
. . . . . . .
. . . . . . .
. . . . . . .
7 Advanced parameters
7.1 Managing Loading . . . . . . . . . . . . .
7.1.1 Stop data loading . . . . . . . . . .
7.1.2 Restart interrupted loading . . . .
7.1.3 Reload all the results . . . . . . . .
7.2 How GeneValorization works (internally)?
7.2.1 Modes . . . . . . . . . . . . . . . .
7.2.2 Dealing with Memory . . . . . . .
7.2.3 The command line . . . . . . . . .
.
.
.
.
.
.
.
.
.
.
.
.
.
.
.
.
.
.
.
.
.
.
.
.
.
.
.
.
.
.
.
.
.
.
.
.
.
.
.
.
.
.
.
.
.
.
.
.
.
.
.
.
.
.
.
.
.
.
.
.
.
.
.
.
.
.
.
.
.
.
.
.
.
.
.
.
.
.
.
.
.
.
.
.
.
.
.
.
.
.
.
.
.
.
.
.
.
.
.
.
.
.
.
.
.
.
.
.
.
.
.
.
.
.
.
.
.
.
.
.
.
.
.
.
.
.
.
.
.
.
.
.
.
.
.
.
.
.
.
.
.
.
.
.
.
.
.
.
.
.
.
.
.
.
.
.
.
.
.
.
.
.
.
.
.
.
.
.
.
.
.
.
.
.
.
.
17
18
18
18
18
18
18
18
18
18
19
19
19
19
20
20
20
20
20
20
20
21
21
8 FAQ
23
8.1 Basic informations . . . . . . . . . . . . . . . . . . . . . . . . . . . . . . . . . . . 23
8.1.1 What do the numbers of the GeneValorization matrix correspond to? . . . 23
8.1.2 What fields of the publications are used for keyword (filters and gene
names) research? . . . . . . . . . . . . . . . . . . . . . . . . . . . . . . . . 23
8.1.3 Does GeneValorization take EntrezGene ID as input? . . . . . . . . . . . . 23
8.1.4 Does GeneValorization take into account the gene name synonyms? . . . . 23
8.1.5 Does GeneValorization use MESH terms when querying? . . . . . . . . . . 23
8.1.6 Can I use rational expressions in genes/filters? . . . . . . . . . . . . . . . 24
8.1.7 What species is taken by default in GeneValorization? . . . . . . . . . . . 24
8.1.8 What are the differences between GeneValorization Entrez-NCBI and GeneValorization SRS-EBI ? . . . . . . . . . . . . . . . . . . . . . . . . . . . . . . 24
8.2 Import / Export, formats . . . . . . . . . . . . . . . . . . . . . . . . . . . . . . . 24
8.2.1 What is the difference between Read and Open / Save and Export? . . . 24
8.2.2 What is the CSV format? . . . . . . . . . . . . . . . . . . . . . . . . . . . 24
8.2.3 CSV outputs of GeneValorization . . . . . . . . . . . . . . . . . . . . . . . 24
8.2.4 CSV and text inputs of GeneValorization . . . . . . . . . . . . . . . . . . 25
8.3 Loading issues . . . . . . . . . . . . . . . . . . . . . . . . . . . . . . . . . . . . . . 25
8.3.1 One cell at <error> . . . . . . . . . . . . . . . . . . . . . . . . . . . . . . 25
8.3.2 Every cell at <error> . . . . . . . . . . . . . . . . . . . . . . . . . . . . . 25
2
Chapter 1
The matrix of GeneValorization
1.1
Overview
GeneValorization allows to access quickly and concisely a large range of publications for a list of
genes in a given context (expressed as keywords).
Basic Information. The basic informations for GeneValorization are the following:
• Gene name(s): They represent the genes of interest (e.g., ERBB2, ESR1 ). Each gene
name should be stated at the start line, to the left. There may be as many gene names as
desired by the user. Alternatively the user may input ids from EntrezGene directly (please
prefix the number with #).
• Main filter: This filter gives the general context of the study (e.g., Cancer ). The main
filter should be stated at the top of the first column. There is at most one main filter (one
or none).
• Secondary Filter(s): They provide details about the context of the study (e.g., Proliferation, Cell Cycle Arrest). They should be specified at the begining of each column (above).
There may be as many secondary filters as desired by the user.
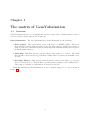
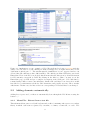
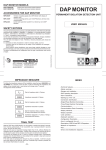
From this information, GeneValorization creates a matrix composed of cells as shown in
Figure 1.1.
3
Figure 1.1: Main GUI of GeneValorization. On the left hand side, the matrix; On the right hand
side, the results; On the top, the list of menus.
Each cell of coordinates (x,y) provides the number of publications (i.e. hits)1 which contain
in their Pubmed entry: the main filter, the gene name specified at line x, and the secondary filter
specified at the column y. For the cells of the first column, gene names and the main filter are
considered while for celles of the second columns and above, secondary filters are additionally
considered.
Clicking on a cell allows the display of a set of outcomes: (i) the list of the most recent
publications concerning the keywords specified and (ii) a graph of comparison (to compare the
relative importance of different genes for a given filter, or different filters for a given gene).
1.2
About Gene names and filters
The areas in which the gene names and filters are to be specified may include more complex
expressions such as the use of * (wildcard) or the keyword OR.
1.3
Display of the gene names and Disambiguation
When a gene name g is provided to GeneValorization, GeneValorization automatically looks for
the associated official gene name(s) by exploiting information from EntrezGene. This mapping
allows GeneValorization to consider aliases of g ; but it also allows to provide assistance in the
process of gene name disambiguation.
GeneValorization uses EntrezGene to check which of the three following cases occurs, and colors
g depending on the situation: (a) g is an official gene name, (b) g is a synonym: g is not an
1
In the EntrezNCBI version of GeneValorization, MESH terms are automatically considered during the queries.
4
official gene name but appears in the list of synonyms of one or several official gene names (within
the same species), (c) none of the above.
In case (a), GeneValorization runs normally, the gene name is green to indicate that it is official.
In case (b), the gene name appears in orange to indicate that it is a synonym and by right-clicking
on the name, the user can access the list of official gene names having g in their aliases. (See
2.1.6).
In case (c), the gene name appears in red to indicate that it is not an existing gene name.
By default, GeneValorization will still perform all searches using the value entered by the user.
In case (b), and if we work with synonyms, GeneValorization will choose to consider synonyms
of the first official gene name provided by EntrezGene.
When network problems are encountered the gene name is colored in violet.
1.4
Display of a cell
The kinds of content that a cell may have and their meanings are given below.
• 42314: the total number of publications returned is 42 314.
• <42311>: the number of publications is currently 42 311 and may grow.
• <loading>: the search for publications has started but it has provided no result so far.
• <waiting>: the search for publications will start as soon as possible.
• <error>: an error has occured, and there is no results (see 8.3 to know the causes)
• <interrupted>: the loading has been stopped by the user using the menu described in
7.1.1, and data can be reloaded using the menu described in 7.1.2.
5
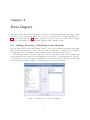
Chapter 2
Data Import
This chapter presents all the possibilities for the user to import information. Choosing to work
on a list of genes or on specific filters can be done by selecting items to be added manually (see
2.1) or by loading files (see 2.2). Both solutions are described here-after. Genes and secondary
filters are each managed in a catalog that includes all the available items.
2.1
Adding, Erasing or Modifying items Manually
The sub-menu "Add" of the menu “Edit” allows to enter directly into the program a new main
filter, new secondary filters, or genes. It is the same for buttons +/- displayed on the matrix.
Selecting this menu or clicking on these buttons opens the window described below.
This window consists in 2 parts. The part on the left (left list) shows a list containing the
items available in the catalog specified during the previous uses of GeneValorization. Items to
be added may be selected or other elements may be added to the catalog. The part on the right
shows what elements will actually be added when the user will click on OK.
Figure 2.1: Adding genes (dedicated window).
6
2.1.1
Making a choice among items in a list
To select an item from the left list and make it displayed in the right list, please double-click on
the item or use the arrow. To erase an item from the right list, double-click on the item or use
the corresponding arrow. To finish your selection please don’t forget to click on OK.
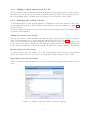
2.1.2
Managing the catalog of items
To add an item that does not appear in the list, or definitively erase some available items, please
use the button Manage the catalog. Clicking on this button opens a new window (see figure 2.2)
described below.
Please note that you can also add one item at a time by directly typing in the area intitled “Write
your own” in the right list.
Adding new items to the catalog
The top area allows to either manually enter the new items separated by a comma, or automatically add them from a txt or csv file using the button Read from a file (see 2.2.1).
Once a set of items have been entered or the items file selected, please click on Add those items
to add them to the catalog. In this case, the items are added to the bottom list, and will appear
in the catalog for future use of GeneValorization. To make these changes effective, click on OK.
Erasing items from the catalog
To remove item(s) from the catalog, select the corresponding item(s) in the bottom list and
please click on the Remove selected items. To make these changes effective, click on OK.
Exporting items from the catalog
The selected items in the bottom list can be exported as xml file using the button Export selected
items.
Figure 2.2: Manage your items catalog (dedicated window).
7
2.1.3
Erasing all data
The sub-menu "Erase" erases the main filter, all genes and secondary filters.
2.1.4
Individually delete a filter (column) or a gene (row)
Click on the header of the line or the column to be deleted, then, either right-click and select
the option "Delete", or click on "Delete" in the popup window on the right hand side.
2.1.5
Individually rename a filter (column) or a gene (row)
Click on the header of the line or the column to be renamed, then, either right-click and select
the option "Rename", or click on "Rename" in the popup window on the right side.
2.1.6
Individually authenticate a gene as official or not
Mapping to official gene name using EntrezGene
GeneValorization is able to perform its search not only using the gene name g provided by the
user but also using all synonyms of g within a given species, by exploiting information from
EntrezGene. By default GeneValorization will consider aliases but it is also possible not to use
them (see 5.1.5).
GeneValorization will still perform all searches using g. Of course, the association of g to an
official ID will be usefull only option the taking into account synonyms of the gene name is
selected (see 5.1.5) ; since in the other case you choose to display publications matching the gene
name entered only.
As described in 1.3, the gene name color shows whether the mapping was successfull or ambiguous (green or orange colors), or impossible (red or violet colors).
When the gene name is indicated as a synonym (in orange), it may correspond to two situations:
either (i) g does not correspond to the official gene name but appears in the list of synonyms of
only one ID, or (ii) g is not official and appears in the list of synonyms of several IDs (within
the same species).
In case (ii), GeneValorization will choose to consider the first official gene name provided by
EntrezGene to associate g with its synonyms. But you can use the procedure described below
to change the used ID, or just access the ID(s) your gene name corresponds to.
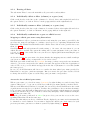
Access the list of official gene names
When a gene name g is colored in orange (synonym), by right-clicking on g and selecting "Synonym of official gene ..." you can access the list of official gene names having g in their aliases.
When several EntrezGene IDs have been found, the one used by GeneValorization for the search
of publications associated to g is checked. You have the possibility to choose another alternative
by by selecting a new ID. Links to EntrezGene web pages describing each alternative are provided
so that you can then choose one of them to remove any ambiguity. This is illustrated in figure
2.3 with the gene name PR.
When the gene name is indicated as official (in green color), you can also access to the corresponding EntrezGene ID in the same way.
Please note that when you choose a different ID, the displayed gene name won’t automatically
be renamed to avoid confusion. If you want to display the official gene name instead of your
previous gene name, you have to rename it yourself by right-clicking (see 2.1.5).
8
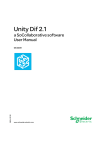
Figure 2.3: Authenticate a gene: example of PR. PR is indicated as being a synonym with the
orange color. In order to see the official gene name PR mapped to, we right-clicked and selected
"Synonym of official gene...". The window intitled “Authenticate a gene” appeared and we can
observe that PR could map to three different ID(s). The official gene name PGR whose associated
EntrezGene ID is 5241 has been checked which means that the hits given by GeneValorization
for PR currently correspond to PGR. By clicking on the link “see online”, we may access the
EntrezGene page of PGR and get a complete description of the PGR gene. PR could thus be
renamed using PGR to remove any ambiguity. Another ID could have been chosen if we would
have liked to get information about the other alternative and possibly associate PR to another
offical name. In that case, the hits of the row corresponding to PR would have been changed.
2.2
Adding elements automatically
Adding list of genes and / or filters is automatically done through the File Menu or using the
button +/-.
2.2.1
Menu File - Extract from a text file
This submenu allows you to read (and load) txt and csv files (containing either genes or secondary
filters) in which each item is separated by a newline, a comma, a semicolon, or a tab. The
9
imported items will directly be added to the interface.
2.2.2
Menu File - Open
This submenu allows you to import all results obtained in a previous use of GeneValorization (in
XML) and and it is proposed to erase the current view.
2.2.3
Menu File - Advanced Opening
This submenu allows you to import files that were previously saved using GeneValorization (in
XML). In the case of ”All those fields and results”, it is proposed to erase what is currently
displayed through the interface to replace it with the content of the file.
10
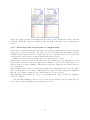
Chapter 3
Interacting with the results
Each cell (cell, column header, row) of the matrix reacts to mouse clicks and displays more
information in the results box.
3.1
List of publications
When you click on a cell, the first n publications are displayed on the right (list) using the sorting
function specified (see 5.1.2 for more informations). Papers can then be accessed online.
3.2
3.2.1
Displaying results as charts
Basic view - comparing hits
The basic operation of the chart is to compare the number of hits on the selected cell with the
hits obtained (i) for a given filter but considering various genes or (ii) for a given gene name but
considering various filters. Each element is associated with a color which will remain the same
during the session.
To enable a clearer display, you can sort the displayed items. To do this, please select the
filter or gene name to consider and use one of these two possibilities : either right-click on the
item and select the option "Sort by ascending value" or "Sort by descending value", or please
click on "Sort" on the area where publications are displayed (and choose between ascending down
arrow, or descending sort up arrow). The figures below illustrate this scenario.
11
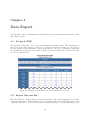
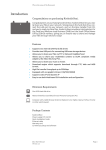
Figure 3.1: Chart generated for the filter Breast Cancer: Gene PCR has the rank 3 out of 16
positions. When the results are ranked by hits, the rank of an item can be visualised more
clearly.
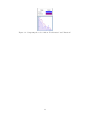
3.2.2
Interacting with several items to compare them
Two cells are comparable if they have the same first coordonate (same gene) or second coordonate
(same filter). Several comparable cells can be selected by holding down the button ctrl, then
clicking on the checkboxes to select. If the boxes are not comparable, the previous selection is
cleared for the benefit of the box which has made the final selection.
Multiple selection allows to compare data via a superposition of curves.
When several cells are selected on the same line (one common gene), we superimpose several
curves where each curve is the set of hits on the column of a selected cell. This allows to see
where is located, in terms of number of hits, the selected gene compared to the others on the set
of selected filters.
When multiple cells are selected on the same column (one common filter), the curves are superimposed on the hits of each cell line. This allows to see where is located, in terms of number of
hits, the selected filter compared to the others on the set of selected genes.
When multiple genes or filters are selected, we superimpose the curves obtained by clicking on
each gene or filter.
Note that when multiple cells are selected, hits are not displayed on the graph.They are
replaced by a caption showing how each element is colored.
12
Figure 3.2: Comparing the roles of filters "Proliferation" and "Invasion".
13
Chapter 4
Data Export
The automatic export of information in GeneValorization is done through the menus File, Edit
and Chart’s options.
4.1
Saving in XML
The submenu "Menu File - Save" saves the information in XML format. This information is
then read by the menu "Open". In the case of "All those fields and results" it is proposed to
save the matrix of GeneValorization. When saving the file, a file gene_valorization_v2.xsl will
be automatically saved in the same folder, it allows a browser to display the content of the saved
file in a user friendly way.
Figure 4.1: Example of an XML file saved and displayed in a browser.
4.2
Export lists and hits
The sub-menu File - Export allows to export information. The item "Everything in a csv file"
of the sub-menu "File - Export" allows you to export the matrix of GeneValorization into a file
compatible with Excel. You can also use the sub-menu Edit-Copy to copy the main filter, genes
14
or secondary filters. When several fields are copied, they are converted into the CSV format.
You can then paste into a document.
4.3
Publications
When you click on a cell or a header of a column, publications appear on the right. This
information can be exported to a html file.
4.4
4.4.1
Graph
Export the graph
GeneValorization proposes to export the graphic into an image file. To do this, please click on
"Export Chart" from the menu "Chart’s Option". The default resolution is 640x480 1 , but is
adjustable. The type of image file created is also adjustable: jpg, png, and bmp.
4.4.2
Copy the chart
Using the menu Edit, you can copy the chart displayed (name of the submenu) by placing it in
the clipboard. The graph can then be pasted into a large number of programs (Word, Excel,
PowerPoint, OpenOffice, Paint, Gimp ,...). To do this, just do Edit> Paste in the software where
you want to paste the chart.
1
640 pixels wide and 480 pixels high
15
Chapter 5
Advanced queries
Advanced queries can be expressed through choice of options in the menu "Data’s Options"
described below.
5.1
5.1.1
Data’s Options
Define the species to be considered
This sub-menu lets you set the default species that will be used. It is fundamental to choose it
correctly because in case synonyms of gene names will be searched, they will be searched within
this species only. Human is the species considered by default.
5.1.2
Sort publications by
This submenu allows you to define how to sort the results. By default, GeneValorization uses
the sorting function provided by the server (NCBI-Entrez or EBI-SRS). Other sorting functions
are also available: descending chronological order or sort by author’s name in the NCBI version
of GeneValorization. The SRS-EBI version of GeneValorization proposes not to sort the results
to improve response time.
5.1.3
Search in various fields
The search for keywords (genes, filters) can be done in different fields of the publication. By
default the search is done in the PubMed entry (abstract, title, keywords, etc..). It can be
specified to search only on the title or abstract.
5.1.4
Wildcard, "*".
GeneValorization automatically adds "*" after each filter and each gene name. "*" Can also be
manually specified for any filter.
5.1.5
Gene names and synonyms
This option allows for the presence of a gene name in a publication as well as the presence of its
synonyms as they are listed in the EntrezGene database withing the species defined by default.
Different options are described below. GeneValorization also provides assistance in the process
of gene name disambiguation (see 1.3).
16
Search with the gene name
The gene name specified is used whether it is the official name or not.
Search with gene synonyms
Synonyms of the gene are used, but the gene name entered is not used. This allows to avoid
to get unrelated publications. As an example, the gene CEL is very famous but we may want
to search for publications about this gene without getting publications about Affymetrix chips
whose extension is .CEL.
Search with the gene and its synonyms
The gene and its synonyms are used.
Warning The behaviour may vary between the NCBI and EBI versions of GeneValorization.
Let’s consider the gene A with 3 aliases namely, B, C et D where D is also synonymous with B.
Asking for the aliases of B at EBI will provide only D while the same query sent to the NCBI
will provide B, C et D.
5.1.6
Reload the data when starting.
This option allows to keep the results obtained between two executions, or force to reload data
at each start (to make sure very fresh data is obtained).
For more informations, please consult 7.2.2.
17
Chapter 6
Advanced display
6.1
6.1.1
Customizing the results - Display Options
Modifying the font
GeneValorization designers had worked to make GUI as similar as possible regardless of the
operating system. It remains however a few differences. With this menu you can adjust the font
size if the default rendering does not suit you, and even use a different font.
6.1.2
Change cells size
You can dynamically change the default cell size.
6.1.3
Displaying the gene name and the corresponding EntrezGene ID when
it is possible
By default, GeneValorization only display the user gene names but this option allows you to
display the EntrezGene ID too if available (i.e if the color of the gene name is green or orange).
6.1.4
Monitor memory usage
The memory used by GeneValorization can be display through a progression bar at the top right
of the window.
6.1.5
Defining the number of results to be displayed
We define here the maximum number of publications to be shown in detail (cf. 3.1).
Min: 3 publications.
By default: 10 publications.
6.1.6
Defining the maximum length of the publication’s title
You can limit the size of the titles of publications.
Minimum length: 10 characters.
Default: 140 characters
6.1.7
Language
You can choose between English and French. The software selects the language according to the
user’s computer. If no appropriate language is found, English is used.
18
6.2
6.2.1
Customizing the curve - Chart’s options
Using color theme
By default this option is active, the graphs are then drawn using the main color theme (NCBI
= blue, EBI = green) for axes and captions. It uses color-specific filter/gene to draw the curve,
and that color is used to fill the area under the curve.
Disabling this option leads to drawing the chart in more sober way (black and white).
6.2.2
Modifying plotting aspects
The graph can be plotted in two ways: it can either display the number of hits ordered or display
this number by the number of hits obtained as a percentage of the main filter.
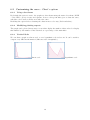
6.2.3
Vertical Scale
We can draw a graph on a linear scale or on a logarithmic scale in base 10. It can be useful to
compare very different information (different order of magnitude).
Linear scale
Logarithmic scale
19
Chapter 7
Advanced parameters
7.1
Managing Loading
The management of loadings (queries sent to PubMed on-the-fly) can be specified using the
menu Loading. You can also individually restart the loading of one entire row, one entire column
or one individual hit by right-clicking on the corresponding case and select the option "reload
online".
7.1.1
Stop data loading
Loading are stopped.
7.1.2
Restart interrupted loading
Interrumpted loading are restrated.
7.1.3
Reload all the results
All loading are restrated.
7.2
7.2.1
How GeneValorization works (internally)?
Modes
Using NCBI
Searches are done on the NCBI server that is, the Entrez portal is directly queried by GeneValorization. This server uses natively and automatically MESH terms to search for primary and
secondary filters. This mode of work is recognizable by its blue theme graphics.
Using EBI
Searches are done on the SRS server of EMBL-EBI, SRS is the server that is queried by GeneValorization. The keyword search is direct (no use of MESH terms). This mode of work is identifiable
by its green theme graphics.
Read only
The read-only mode can work normally, but cannot save anything (Settings, Change in the list
of genes / filters, Reloading results ,...). It is proposed when the application has been launched
several times, it may be imposed by the argument in command line described in 7.2.3.
20
Debug
The debug mode is more verbose in terms of error in the console, for this reason, the console is
displayed by default.
7.2.2
Dealing with Memory
Storing data
GeneValorization stores several data on the hard drive. Consider that your login is Bob, the file
in which all the information is stored is available at:
• Windows XP : C:/Document and Settings/Bob/GeneValorization
• Windows Vista/Seven : C:/Users/Bob/GeneValorization
• Linux : /home/Bob/GeneValorization
Keeping results between two executions
GeneValorization allows to keep the data extracted from one use to another (see 5.1.6). Data
are stored in an XML file which specification is given on the web1 . The file will be stored in the
location described above.
Keeping results during one execution
During execution, every request made to the server is stored in memory. You can still force the
reloading of data (see 7.1.3).
7.2.3
The command line
GeneValorization can be used in command line mode. In this case the various options below are
proposed.
-help
Displays all parameters of command lines proposed by the program.
-debug
Launches the application in debug mode and displays the console.
-debugGUI
Forces the display console.
-noDebugGUI
Does not display the console.
-target
Must be followed by the name of the server (NCBI or EBI).
1
http://bioguide-project.net/gv/gene_valorization.dtd
21
-readOnly
Launches the application in the read-only mode.
-allowReadOnly
When launching a new instance of the application where a first one has already been launched,
you can choose to prohibit the start of the second instance, or run it in the read-only mode (see
7.2.1). Using this parameter allows you to automatically accept the read-only option in this case.
-displayURL
Displays in the console all http addresses that the program will generate internally.
22
Chapter 8
FAQ
This chapter covers issues related to the use of GeneValorization. Answers are brief and more
information is available in the user manual.
8.1
8.1.1
Basic informations
What do the numbers of the GeneValorization matrix correspond to?
Each cell of coordinates (x,y) of the GeneValorization matrix provides the number of publications
which contain (in their Pubmed entry): the main filter, the gene name specified at line x, and
the secondary filter specified at column y (if specified). More information in section 1.1 of this
manual.
8.1.2
What fields of the publications are used for keyword (filters and gene
names) research?
By default, the keyword (genes, filters) search is done in the whole Pubmed entry. The search
can be restricted to only a subset of the Pubmed entry (for example, restricted to the title,
abstract...). The fields the search has to be restricted on can be specified in "Search in field(s)"
of the "Data’s Options" menu.
8.1.3
Does GeneValorization take EntrezGene ID as input?
You can directly enter an EntrezGene ID, just please preceed this ID by a "#".
8.1.4
Does GeneValorization take into account the gene name synonyms?
By default, GeneValorization considers gene names and synonyms recensed by EntrezGene in the
specified species (Human, by default). This can be changed using "Gene name and synonyms"
in menu "Data’s Options".
8.1.5
Does GeneValorization use MESH terms when querying?
In the NCBI-Entrez version of GeneValorization, queries launched by GeneValorization are interpreted by Entrez which automatically considers MESH terms. The SRS-EBI version of GeneValorization makes a simple search of the keywords.
23
8.1.6
Can I use rational expressions in genes/filters?
The areas in which the gene names and filters are to be specified may include rational expressions
such as the use of * (wildcard) or the symbol "|".
8.1.7
What species is taken by default in GeneValorization?
It is the Human. It can be modified in menu "Data’s Options" by selecting item "Define the
species to be considered".
8.1.8
What are the differences between GeneValorization Entrez-NCBI and
GeneValorization SRS-EBI ?
GeneValorization proposes the use of two servers: the Entrez portal of the NCBI or the SRS server
of the EBI. One server or the other is chosen when requests are sent to Pubmed. The differences
are numerous and include: (i) the interpretation of queries on Pubmed (ii) the management of
the genes synonyms, (iii) the ranking functions of publications, (iv) the content of the sources.
Specifically:
• (i) the NCBI-Entrez version automatically uses MESH terms whereas the SRS-EBI version
makes a simple keywords research;
• (ii) Given a gene A having three synonyms B, C and D where D is a synonym of B. EBI
will return only D as a synonym of B, indeed B has no other proper synonym ; NCBI will
consider this gene as being A (its official name) and will return its synonyms, i.e B, C and
D
• (iii) the ranking functions depend on servers, EntrezNCBI natively proposes a ranking by
date by default (or by author if chosen by the user) whereas SRS proposes a ranking by
descending chronological order or no ranking in order to improve response time;
• (iv) the SRS server of EBI is a copy of NCBI and may not contain the latest informations
of PubMed.
8.2
8.2.1
Import / Export, formats
What is the difference between Read and Open / Save and Export?
Read and Save are two functionalities which allow to read (respectively save) informations in
XML format. Open and Export are two functionnalities which allow to open (respectively export)
informations in text or CSV format (data list of tabular type).
8.2.2
What is the CSV format?
CSV stands for Comma-Separated Values. It allows to save in a textual way several elements
separated by commas. Several variants exist, and we can separate values by a comma (","),
semicolon (";") or a tabulation.
8.2.3
CSV outputs of GeneValorization
When you copy elements, or export elements in CSV format, GeneValorization separates elements
by commas.
24
8.2.4
CSV and text inputs of GeneValorization
Reading a file works in two stages. First of all, if the file contains several lines, GeneValorization
will consider that there is one element per line. But if we only find one line, this line will be cut
based on its commas, semicolons, and tabs.
8.3
8.3.1
Loading issues
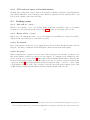
One cell at <error>
When a cell contains <error>, its loading didn’t work well, generally because of a network
problem. Use the menu previously described in 7.1.2 in order to reload the affected cells.
8.3.2
Every cell at <error>
When every cell contains the value <error>, the software doesn’t manage to connect to the Web.
This problem is probably due to a firewall or a proxy.
Cause: the firewall
Indeed, the firewall can block access to applications to the web and generally advertise you if it
happens. You have to authorize GeneValorization connection in the firewall settings.
Cause: the proxy
When a network uses a proxy server you can’t connect directly to the internet, you have to use
this proxy which is a kind of secure door to the outside. To configure proxy settings for java,
please open the Java Control Panel 1 . Then click on the Network Settings button. Java uses the
browser default proxy settings, if it doesn’t work: select the Use Browser Settings checkbox and
copy proxy settings2 , the usual syntax for the proxy settings is: http://<address>:<port> (with
a port similar to 8080 or 3128 ). Once you have correctly entered the proxy settings, please click
on OK button, restart GeneValorization and the loadings should work correctly.
1
On Windows, the Java Control Panel which is in the Control Panel, on Unix it is in menu System>Preferences
2
If you don’t know them, ask to your network administrator. Settings are identical to the ones in your browser.
.
25