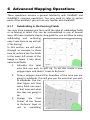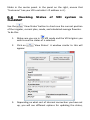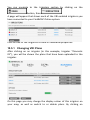
1
Lindsay International (ANZ) Pty Limited 581 Taonui Road RD 5 Feilding 4775 New Zealand Free phone (NZ) 0800 GETMAP (0800 438 627) Phone +64 6 212 0550 Fax +64 6 929 4742 For farm mapping support go to www.wheresmycows.com For irrigation enquiries and support go to www.precisionirrigation.co.nz FieldMAP Version 2.190 © 2013 Lindsay International (ANZ) Pty Limited Manual version 2.2 05 December 2013 Table of Contents 1 How to Use This Booklet 7 2 Installing FieldMAP Software 2.1.1 Installing FieldMAP Registering FieldMAP 2.2.1 Registering FieldMAP Online 2.2.2 Registering FieldMAP Over the Phone 2.2.3 How to get a 30‐day Trial Registration Number 2.2.4 Ordering a Full License Online Opening the Demo Map 8 8 9 9 9 9 10 10 3 Using your Handheld GPS Unit Setting Up your Handheld Garmin GPS Recording Points using your Handheld GPS 3.2.1 Always Start with a Fresh Memory 3.2.2 Recording Fields 3.2.3 Moving Between Fields 3.2.4 Finishing Recording Fields 11 11 11 12 12 12 13 4 14 14 15 15 15 17 20 20 20 21 22 24 25 27 28 28 29 30 30 Drawing a Farm Map Creating a New Farm Map 4.1.1 Opening an Existing Farm Map Drawing a Farm Map from an Aerial Photograph 4.2.1 Importing an Aerial Photograph 4.2.2 Drawing Fields Drawing a Farm Map from GPS Points 4.3.1 Downloading GPS Points 4.3.2 Import GPS points 4.3.3 GPS Layers 4.3.4 Drawing Fields 4.3.5 Recording Additional Features with your GPS Drawing a Farm Map in Google Earth 4.4.1 Saving the Layers 4.4.2 Importing Layers into FieldMAP Importing Maps from Other Programs 4.5.1 Setting Shapefile Attributes Editing and Naming Fields 4.6.1 Naming Fields 4.6.2 4.6.3 4.7.1 4.7.2 4.7.3 4.7.4 4.7.5 4.7.6 4.7.7 4.7.8 Displaying Field Areas Editing Fields Drawing Other Features Drawing Lines and Points Drawing Parallel Lines Drawing Arcs (polygon arcs) Adding Text Rotate text Layer Tree Order Colouring Polygons Adding a Key, Scale, North Arrow and Border 31 32 32 32 33 34 35 35 36 36 38 5 Common Mapping Tasks 41 5.1.1 Zoom 41 5.1.2 Pan 41 5.1.3 Ruler 41 5.1.4 Select Measurement Units 42 5.1.5 Send Shapes between Layers 42 5.1.6 Show Lengths of Lines in a Polygon or Polyline Layer43 5.1.7 Saving your Farm Map 43 5.1.8 Printing your Farm Map 43 5.1.9 Emailing your Farm Map 44 5.1.10 Download the latest version of FieldMAP 45 6 Advanced Mapping Operations 6.1.1 Subdividing or Re‐Fencing Fields 6.1.2 Calculate 3D Surface Area of Fields 6.1.3 Moving an Entire Layer 6.1.4 Merging Layers 6.1.5 Exporting as a Shapefile or DXF (AutoCAD) 6.1.6 View in Google Earth 6.1.7 Export KML File 6.1.8 Import KML File 6.1.9 Custom Point Images 6.1.10 Center‐Pivot Irrigators 46 46 48 49 50 51 51 52 52 53 53 7 55 55 Uploading Features to your GPS Uploading Points or Layers to your Handheld GPS Finding your Uploaded Points Out in the Field 8 56 TracMap Operations Transferring a Map into TracMap Drawing Irrigation Lines 8.2.1 K‐Line 8.2.2 Long‐Laterals Importing TracMaps for Display and Printing 57 57 58 58 58 59 9 Variable Rate Irrigation (VRI) VRI Toolbar 9.1.1 Set the Application Layer and Avoid Layer 9.1.2 Application Types Available 9.1.3 Define Rates 9.1.4 End‐gun Control VRI Simulation Calculating and Uploading Plans 9.3.1 Save to Disk 9.3.2 Uploading to FieldMAP Online 9.3.3 Upload Directly FieldMAP Online Setup in FieldMAP (desktop) 9.4.1 Check that your Unique ID numbers are set 9.4.2 Check that FieldMAP is authorised to access FieldMAP Online Account Wireless Connection Setup Checking Status of VRI system in FieldMAP 60 60 60 63 64 67 70 70 71 71 72 73 73 your 74 76 77 10 FieldMAP Online Logging In Specify date range for reporting Map Navigation Weather Irrigators 10.5.1 Changing VRI Plans Layers Reports Setting Units 79 79 80 81 81 82 83 84 84 85 1 How to Use This Booklet Welcome and thank you for choosing to use FieldMAP. This booklet has been written so that you can follow it from start to end, and end up with a professional looking, accurate map of your farm. If you look through the table of contents, it has been written in detail so that if you are just trying to find out how to do one specific thing, you should be able to find it easily. Along the way you will find handy “Quick Tips” and information about many other tools that are designed to make your job easier. A point to note is that in Section 4: Drawing a Farm Map there are instructions on how to draw a farm map using a handheld GPS, importing an aerial photograph and using Google Earth. You only need to follow the instructions relevant to the method that you are using to draw your farm map, and then you can skip to the next section to continue drawing your map. For further support, please visit www.wheresmycows.com or www.precisionirrigation.co.nz and follow our detailed video tutorials. 2 Installing FieldMAP Software Before you can create your farm map you must install FieldMAP. FieldMAP is the software application you will use to draw, edit and print your farm map. 2.1.1 Installing FieldMAP FieldMAP requires Microsoft Windows XP, Vista or 7 to operate. 1. Place the FieldMAP CD in your CD‐ROM drive. The installation process should automatically begin. If it does not begin to install automatically, go to ‘My Computer’ and browse the CD drive, then double click the ‘setup.exe’ file. 2. The installer may ask you to accept license agreements to install various items that FieldMAP requires to operate correctly – click ‘Accept’ to allow it to install these. Once these other items are installed the FieldMAP setup will launch, guiding you through some simple steps. Click ‘Next’ when prompted and it will install automatically. To start FieldMAP, click ‘Start’ then ‘Programs’. There will be a new menu item called ‘Growsmart’. FieldMAP is under this menu heading. You should also find a link to FieldMAP on your desktop. This tip only applies if you are installing on a Mac: FieldMAP can be installed on a Mac computer as long as it is running Microsoft Windows, either from bootcamp or from a program that boots Windows from OS X such as Parallels or VMware Fusion. If you are running VMware Fusion or Parallels, make sure that all 3D acceleration and effects are enabled; otherwise FieldMAP will give an error until you have enabled them. Registering FieldMAP You will need to register FieldMAP the first time you run the software. Registration can be done either online or by phone. We recommend you register online. 2.2.1 Registering FieldMAP Online When FieldMAP starts up, it will ask you to select how you would like to register. Click ‘Register Online’. Type the serial number as it appears on your CD ROM or email in the box at the top of the registration window. Make sure that your computer is connected to the internet, and then click ‘Register’. Your copy of FieldMAP will register and you may then use the software. 2.2.2 Registering FieldMAP Over the Phone When FieldMAP starts up, it will ask you to select how you would like to register. Click ‘Register Over the phone’. Type your serial number as it appears on your CD ROM in the box at the top of the registration window. Phone us on the number shown, and we will give you the second code needed to register your product. 2.2.3 How to get a 30-day Trial Registration Number If you downloaded FieldMAP as a trial, you will have been emailed a serial number along with a link to download FieldMAP. If you received a CD that did not have a serial number printed on it, you may click ‘Get a free 30 day trial online’ (making sure that you are connected to the internet) and fill in your details on our website. After you have filled in your details, click on ‘Get Serial Number’. The following page will then give you your serial number. Go back to FieldMAP and follow the steps in ‘2.2.1 Registering FieldMAP Online‘. 2.2.4 Ordering a Full License Online After trialling FieldMAP, you may purchase a full license online. To do this, start FieldMAP, while making sure that you are connected to the internet. Then select ‘Click here to purchase a full version online’. Your browser will open to a page where you can select whether you would like to purchase a GPS mapping kit, or simply FieldMAP on its own. Click on the ‘Buy Now’ text next to the item you would like to purchase. You may register FieldMAP only two times before your registration key runs out. You may use these two registrations as you choose, either using one and keeping one spare in case your computer dies and you need to reinstall, or you may install the software on two separate computers. Opening the Demo Map To view and have a play around with the demo map, open the FieldMAP program, click on ‘File’ then from the drop down list click on ‘Open Demo Map’. This will open an example farm showing some of the features that you can use in FieldMAP. Use the demo map to experiment using the different features of the FieldMAP software, such as turning layers on or off by clicking on the checkbox next to each layer. 3 Using your Handheld GPS Unit This section explains what you need to do when setting up and recording points with your Garmin handheld GPS unit to begin mapping your farm. This section only applies to users who wish to interface with a Garmin handheld GPS, this includes DO IT YOURSELF GPS FARM MAPPING KIT users. If you are drawing your map from an aerial photograph or have had your farm mapped professionally and do not need to set up your computer to interface with a GPS, please skip to Section 4: Drawing a Farm Map. If you have purchased the DO IT YOURSELF GPS FARM MAPPING KIT and intend to use a different GPS you will need to configure it similarly, but the steps taken may differ slightly. Your GPS unit may require drivers to be installed on your computer, they allow your PC and GPS to communicate. Refer to your GPS manual for details. Setting Up your Handheld Garmin GPS Please follow the instructions in the GARMIN GPS owner’s manual for instructions on: Warnings and precautions Installing the batteries Learning key functions The main page sequence Please follow the steps in the relevant sub‐section depending on the GPS you are using. Recording Points using your Handheld GPS There are a couple of little tricks to taking points out on your farm that make drawing up your map on your PC easy. The method for easily recording and mapping your farm is outlined below. 3.2.1 Always Start with a Fresh Memory To make downloading and drawing your farm map easy, you’ll only want to download the relevant points that you have taken relating to your farm. The best way to ensure that you only get these points is to delete any existing track logs and waypoints from your GPS before you start, refer to the relevant section depending on the GPS unit you are using. 3.2.2 Recording Fields Before you record anything with your GPS, we recommend that you allow your GPS to ‘warm up’. When you first turn the GPS on it will begin acquiring satellites. Once it locks on to enough satellites, the accuracy is displayed at the top of the screen. Wait until this number gets down to below 10m before you start recording points. The lower the number, the more accurate your mapping will be. To be able to draw your fields on your computer, you will need to record every angle post of every fence line with your GPS. We do this by recording waypoints on the angle posts, and a track log is automatically created which shows the path you have taken. When recording a field, start at one post (usually by the gate is a good start, but it does not matter where you start) and make your way around the field, recording waypoints at all angle posts around the fence line until you get back to where you started. 3.2.3 Moving Between Fields When you reach a new field continue recording waypoints at each angle post as you did in the last field. Note, it is not necessary to re‐ record points or fence‐lines that you already recorded in the previous field. When you move between fields your track log will record where you go. When you download your track log to your PC you will see the path you have taken around the outline of the fields as well as where you have moved between the fields. The track log is used as a guide when drawing the fence lines which makes it much easier to identify fields than just looking at a galaxy of dots on your screen. We recommend that you record all of the angle posts as waypoints and use the track log as a guide to show how they all join together. After drawing the fields in you can then hide the track log so you have nice neatly drawn fence lines. If you are travelling long distances between fields or around a large obstacle, turn off track logging until you reach the place where you wish to start recording again. 3.2.4 Finishing Recording Fields When you have finished recording fields it is not necessary to save your track log. You can simply turn the GPS off and go home. It will be ready to download your points when you return to your PC. 4 Drawing a Farm Map To find and open FieldMAP either click on the FieldMAP icon on your desktop or navigate to: Start menu ‐> Programs ‐> Growsmart ‐> FieldMAP Creating a New Farm Map If you are starting a new map, you will need to create a new farm database. To begin a new farm map: 1. Click on the ‘File’ menu at the top of the screen 2. Click on ‘New Project…’ 3. Fill out your farm details. 4. Select your country from the drop down list. If your country is not shown, select ‘Northern Hemisphere’ or ‘Southern Hemisphere’. You will see there are two country options for New Zealand, unless you are importing files into your map that have been created using NZ Map Grid (NZMG) we recommend you choose NZTM, this is the most current grid used in New Zealand. 5. Click ‘OK’. 6. Now select a place where you would like to save your farm map file. 7. We suggest you browse to ‘My Documents’ and use a folder called ‘Maps’. 8. Double click on the ‘Maps’ folder to open it. 9. Type a name in the ‘File name:’ text box such as “John’s Farm Map”, or leave the farm name it automatically places there for you, then press ‘OK’. Your farm map file is now set up and ready to go. 4.1.1 Opening an Existing Farm Map If you have already created a map file (set it up, specified your country and begun working on your map) and you wish to add to or edit it, click on ‘File’ ‐> ‘Open Farm…’ or on the ‘Open’ button and navigate to where you saved the farm map you wish to edit, then open that file. If you have followed our recommendations on saving your farm map file you will find it in ‘My Documents’‐>’Maps’ Drawing a Farm Photograph Map from an Aerial This section applies to users who wish to draw their farm map from an aerial photograph or import an aerial photograph as a background layer to their map, this includes those who purchased the DO IT YOURSELF AERIAL FARM MAPPING KIT. If you are not drawing your map from an aerial photograph skip this section and move to the drawing method that you are using, either from GPS points (Section 4.3) or Google Earth (Section 4.4). If you are in New Zealand and would like an aerial photograph of your farm please contact Wheresmycows.com; either visit our website at www.wheresmycows.com or call 0800 GET MAP. 4.2.1 Importing an Aerial Photograph If you have an aerial photograph to load into your map, you may load it in to FieldMAP and have it appear as a background layer. Choose the appropriate instructions below depending on whether you are using the DO IT YOURSELF AERIAL FARM MAPPING KIT or have purchased an aerial photograph separately. Note that aerial photographs must be ortho‐corrected images, screen shots of Google Earth or photographs that are not geo‐referenced files will not import into FieldMAP. Importing an aerial photograph with the DIY AERIAL FARM MAPPING KIT: 1. From FieldMAP, open a new or existing farm map then click (‘Import’). 2. Browse to the folder containing the files for your aerial photograph (My Documents ‐> Map), and select your aerial photograph. 3. Press ‘Open’ and your photograph will load. It may take some time to load, but once it has loaded everything should run quickly from then on. Importing an aerial photograph from a CD: 1. Insert the CD containing your aerial photograph into your computer. 2. Open ‘My Computer’ from your start menu or desktop. 3. In ‘My Computer’, double mouse click on your CD drive to open it. 4. Open the ‘Maps’ folder on your CD by double clicking on it. 5. Select every file in the ‘Maps’ folder on the CD by holding the left mouse button down and dragging over all the files. Right mouse click these files and click ‘Copy’. You must copy ALL the files in the ‘Maps’ folder on the disk, not just the image file (the files will have the same name but different file extensions). The supporting files are required to allow the software to correctly position the image within your map. 6. Browse to ‘My Documents’‐> ‘Maps’ 7. Right click in the ‘Maps’ folder window and click ‘Paste’. All the files from the CD should copy into the ‘Maps’ folder. 8. Open FieldMAP, and open a new or existing farm map then click 9. (‘Import’). Browse to the folder containing the files for your aerial photograph (My Documents ‐> Map), and select your aerial photograph. 10. Press ‘Open’ and your photograph will load. It may take some time to load, but once it has loaded everything should run quickly from then on. 4.2.2 Drawing Fields To draw your fields onto your map, you must first create a fields ‘layer’. Each layer can be thought of as an item on the map key. 1. 2. To create a layer, Click on ‘New’ then ‘Polygon Layer (Paddocks/ Enclosed Areas, etc)’. A new polygon layer will appear in the layers tree on the left hand side of your screen. If you do not see the new polygon layer, you may need to expand the tree by clicking the ‘+’ sign next to your farm name at the top of the tree. 3. It is important to name each layer with a name that describes what that layer is. That way you can easily edit and display or hide layers. To name the layer you just created, right‐click on the layer name ‘New Polygon Layer’ then left‐ click on ‘Rename’. You can then change the name. Type ‘Fields’, as this layer is going to be your Fields layer. Press the ‘Enter’ key to secure the name change. 4. Making sure that the ‘Fields’ layer is highlighted (click on the text), ensure the ‘Edit’ icon is selected at the top of the page, then click ‘Add’. This will enable you to draw your fields onto your farm map. 5. To draw a field polygon, click on one of the corners of the field to create a point. Move your mouse to the next angle post along the fence line and click on it. Continue to do this until you have clicked on all corners of the field (polygon). Once you’ve finished, click back on the first point you used to start drawing and the area will fill in a solid colour. Your field (polygon) has been created. 6. To move around on the map while in ‘Edit’ mode, hold down the shift key while clicking and dragging the mouse. You can then reposition the map to where you wish to draw, release the shift key and continue drawing. ZOOM = Shift + left click and drag mouse PAN = Shift + right click and drag mouse ZOOMING IN: Drawing fields is easier when you have zoomed in close to the field/area you wish to draw. To zoom in, hold down the shift key on your keyboard, move your mouse to where you want to zoom in to and then click and drag upwards to zoom in, or click and drag downwards to zoom out. Remember to hold down shift while you zoom or you will start drawing! ABORT: To cancel drawing part way through, press the ‘Esc’ key on your keyboard or click on the cross in the grey box at the top right hand side of the map window (not the small cross that closes the program though!). DELETE POINTS: If you make a mistake while drawing, press backspace on your keyboard to erase the last point you clicked and then click in a new position. DISABLE SNAPPING: To temporarily disable the automatic snapping onto to existing points, hold down the ‘Ctrl’ key and click. This will enable you to click near an existing point without the cursor jumping onto it. FILL COLOUR: If the polygon does not appear to be filled in a solid colour, check that the ‘FillColour’ property is not set to white, transparent, or another difficult to see colour. To change the colour of the polygon fill, click on ‘FillColour’ in the properties box while the polygon layer is selected in the layer tree, then click another colour to change the colour. You may also change other properties including the line colour, text colour, and whether text including field names and areas is displayed. Once you have drawn all your fields skip to Section 4.6: Editing and Naming Fields. Drawing a Farm Map from GPS Points 4.3.1 Downloading GPS Points This section applies to users who wish to draw their farm map from GPS points, this includes those who purchased the DO IT YOURSELF GPS FARM MAPPING KIT. If you are not drawing your map from GPS points skip this section and move to the drawing method that you are using, either from an aerial photograph (Section 4.2) or Google Earth (Section 4.4). This section assumes you are using a Garmin GPS and USB cable as supplied with the DIY GPS FARM MAPPING KIT. Before attempting the following steps ensure you have the USB cable at hand. The newer style handheld Garmin Series are classed as ‘Plug and Play’ units. This means there is no need to install any software drivers on your PC. If you have an older style GPS and the steps below do not work, you may download drivers from the support page on www.wheresmycows.com. If you are using your own GPS, the steps will be similar, but you may need to set up your GPS to interface with your PC, refer to your user manual for instructions. 4.3.2 1. Import GPS points Lift the weather cap on the GPS unit. 2. Insert the smaller connector on the USB cable into the mini‐ B jack. 3. Connect the other end of the cable to the USB port on your computer. Note: Once you have connected your GPS it may take a few moments for your computer to recognise the GPS unit. If it is the first time you have connected your GPS to your computer it may take a few minutes for it to automatically load its software. You are now ready to send data between your GPS and PC. To import GPS points: 1. Connect your GPS to your PC using the USB cable supplied. 2. Power on your GPS. 3. If a window comes up asking you what you want to do (i.e. view files in explorer) close this window by clicking on the cross in the top right corner. 4. If you have created your farm file and still have the file open ready to go, click on ‘Download from GPS’ in the menu at the top of the screen. If you do not have your file open and ready to go, you will need to either open your file (Section 4.1.1: Opening an Existing Farm Map) or create a new file (Section 4.1: Creating a New Farm Map), then click on ‘Download from GPS’ in the menu at the top of the screen. 5. Ensure that the GPS type is set to Garmin and port is set to USB and click ‘Connect to GPS’. 6. Make sure that your GPS is connected and switched on and press ‘OK’ in the warning window that pops up. Your GPS waypoints and tracks will then show up in the window. 7. Be sure to select the waypoint and all tracks by clicking on them to ‘tick’ the checkbox, and then click ‘Insert selected items into map’. 8. Your points and track will now have a heading in your map beneath the name of your farm on the left hand side of the screen (you may need to press the + next to the name of your farm to show the GPS layers you just imported). If you cannot see the downloaded points in the main part of the screen, you may need to right‐click on one of your layers and select ‘Zoom to layer’. 4.3.3 GPS Layers The three common GPS layers created from a download are: GPS Lines: Straight lines between waypoints in the order they were recorded. GPS Points: Waypoints you have recorded, such as fence angles. Track Lines: A track log, showing everywhere you went while recording. You may show or hide each of these layers by clicking on the checkbox next to the layer name in the tree on the left hand side of the screen. They may also be renamed to something more meaningful to you by right clicking on the layer name and selecting ‘Rename’. You may change the characteristics of each layer, such as point size, point type, line width and colour, and whether waypoint names are displayed. To do this, click on the layer name you want to edit. In the box below the layer tree, a properties box comes up in which you may alter the characteristics of that layer. If you end up with many GPS lines, points and track lines layers from importing many different data sets, you may wish to merge the layers together. Refer to Section 6.1.4: Merging Layers for more information about how to do this. 4.3.4 Drawing Fields To draw your fields onto your map, you must first create a fields ‘layer’. Each layer can be thought of as an item on the map key. 1. 2. 3. ‘New’ then ‘Polygon Layer To create a layer; Click on (Paddocks/ Enclosed Areas, etc)’. A new polygon layer will appear in the layers tree on the left hand side of your page. If you do not see the new polygon layer, you may need to expand the tree by clicking the ‘+’ sign next to your farm name at the top of the tree. It is important to name each layer with a name that describes what that layer is. That way you can easily edit and display or hide layers. To name the layer you just created, right‐click on the layer name (New Polygon Layer) then left‐ click on ‘Rename’. You can then change the name. Type ‘Fields’, as this layer is going to be your Fields layer. Press the ‘Enter’ key to secure the name change. 4. Making sure that the ‘Fields’ layer is highlighted (click on the text), ensure the ‘Edit’ icon is selected at the top of the page, then click ‘Add’. This will enable you to draw your fields onto your farm map. 5. Draw your fields by clicking on a waypoint at one corner, then sequentially clicking all waypoints around the field/area. To complete the polygon, click back on the first point. Using your track log and waypoints you should be able to see where you went on your farm, and work out where the fences should be. 6. To move around on the map while in ‘Edit’ mode, hold down the shift key while clicking and dragging the mouse. You can then reposition the map to where you wish to draw, release the shift key and continue drawing. ZOOM = Shift + left click and drag mouse PAN = Shift + right click and drag mouse ZOOMING IN: Drawing fields is easier when you have zoomed in close to the field/area you wish to draw. To zoom in, hold down the shift key on your keyboard, move your mouse to where you want to zoom in to and then click and drag upwards to zoom in, or click and drag downwards to zoom out. Remember to hold down shift while you zoom or you will start drawing! ABORT: To cancel drawing part way through, press the ‘Esc’ key on your keyboard or click on the cross in the grey box at the top right hand side of the map window (not the small cross that closes the program though!). DELETE POINTS: If you make a mistake while drawing, press backspace on your keyboard to erase the last point you clicked and then click in a new position. DISABLE SNAPPING: To temporarily disable the automatic snapping onto to existing points, hold down the ‘Ctrl’ key and click. This will enable you to click near an existing point without the cursor jumping onto it. FILL COLOUR: If the polygon does not appear to be filled in a solid colour, check that the ‘FillColour’ property is not set to white, transparent, or another difficult to see colour. To change the colour of the polygon fill, click on ‘FillColour’ in the properties box while the polygon layer is selected in the layer tree, then click another colour to change the colour. You may also change other properties including the line colour, text colour, and whether text including field names and areas is displayed. 4.3.5 Recording Additional Features with your GPS Clear the memory of your GPS unit (refer to the relevant ‘Clearing the Memory’ section for your GPS unit), then record more waypoints and track logs as previously explained. You can record creeks, waterlines, tree plantations, trough locations, or anything else you wish to display on your map. You may record features such as creeks as a sequence of points, and individual points such as troughs separately. After downloading your GPS points on your PC, you may draw polygons (bounded objects such as fields and buildings), polylines (such as creeks, roads, tracks), and points (such as troughs and power poles). Once you have drawn all your farm features skip to Section 4.6: Editing and Naming Fields. Drawing a Farm Map in Google Earth 1. Open Google Earth. If you do not have Google Earth software installed on your computer it can be downloaded from the Google Earth website (www.earth.google.com). 2. In the Search panel enter your farm address into the ‘Fly to’ box and click on 3. 4. ‘Search’. Google Earth will fly to the address entered. To zoom into your farm scroll in using your mouse. To pan click and hold the left mouse button and drag the screen so that your farm is centred in the screen. Under the ‘Places’ panel, right‐click on My Places ‐> Add ‐> Folder. 5. Name the new folder appropriately for the map you are about to create e.g. ‘My Farm Map’ and click ‘OK’. 6. Right click on the folder you just created in the ‘Places’ panel and click Add ‐> Folder. 7. Name the new folder ‘Fields’ and click OK. 8. You now need to create a polygon for each of your fields within the ‘Fields’ folder. 9. Zoom the map in to the first field you are going to draw so that you can see all extents in the window. 10. Click on the Fields folder so that it is highlighted. 11. Click on ‘Add a polygon’. 12. Enter a name or number for the field you are about to draw. 13. With the ‘New Polygon’ window still open (move it to the side of the screen if necessary), move the mouse to the field you intend to draw. Left click on each corner around the circumference of the field. 14. To delete points, either press ‘Backspace’ or right‐click the mouse 15. To create straight lines click on one waypoint, release and then click on the next waypoint. To create curves and free‐ form shapes click the right button and hold it down whilst you drag the cursor around the shape. 16. Click ‘OK’. 17. To edit the polygons and modify properties (name, colour etc), right‐click on the name of the polygon in the ‘Places’ panel, and then click ‘Properties’. If you want to move the corners simply move the mouse to the corner until the pointer changes from a square target to a hand, then click and drag the corner to its correct position, then click ‘OK’. 18. Repeat from Step 8 to 17 for each field you wish to draw. 19. Create a new polygon (closed area) or path (line) layer for the different features you would like represented on your map (e.g. lanes, drains and buildings). To do this repeat steps 6 to 8, naming each folder after the features you intend to draw e.g. ‘Buildings’, ‘Lanes’. An example of the folder structure for your farm map: 20. Then repeat from Step 8 to 17, for paths (line layers) you will need to click on the ‘Add a Path’ icon instead of ‘Add a Polygon’ in Step 11. 4.4.1 1. Saving the Layers Right click on the ‘Fields’ Folder, Click ‘Save Place As’ 2. Now select a place where you would like to save your farm map. We suggest you browse to ‘My Documents’ and use a folder called ‘Maps’ (you will need to create a new folder if it doesn’t already exist). 3. Double click on the ‘Maps’ folder to open it. 4. Ensure the file name you give it matches the folder (layer) being saved. 5. Change the ‘Save as type’ to a KML file using the drop‐down menu. 6. Save each folder (layer) i.e Fields, Buildings, Lanes, etc. in the same way in your ‘Maps’ folder. 4.4.2 1. Importing Layers into FieldMAP Open FieldMAP. 2. Open a new or existing farm map (refer to Section 4.1: Creating a New Farm Map). 3. Select the ‘Import’ button and browse to your farm map folder that contains your KML files. 4. Select the KML file you wish to import then click ‘Open’ and the KML file will load as a new layer in the layer tree. FieldMAP applies the polygon names that you entered in Google Earth to each field and calculates the areas of the imported polygons. 5. When the layer imports, it will be imported at the bottom of the layer tree by default. You may need to drag it up the layer tree to make it visible. 6. Follow the steps above to import each KML you created into your farm map. 7. You can now use FieldMAP to edit and clean up your map, add features and make any modifications you require. Skip to Section 4.6: Editing and Naming Fields. Importing Maps from Other Programs Many other mapping programs will allow you to export your farm map as SHP (shapefile) or GPX format, which can be then imported into FieldMAP. To import files, it is preferable to have your map and files both set up in the same projection, although this is not necessary (see 4.5.1: Setting Shapefile Attributes for details on how to specify projection if the file you are importing is in a different projection). Click on the ‘Import’ button in the toolbar to browse to your file and click ‘Open’. When the layer imports, it will be imported at the bottom of the layer tree by default. You may need to drag it up the layer tree to make it visible. 4.5.1 Setting Shapefile Attributes If you are importing a shapefile, an extra window will come up asking if you want to use one of the attributes of the shapefile as the label for each shape. If you are using FieldMAP for Variable Rate Irrigation, it will also ask if any of the attributes specify the application depth for VRI. Clicking on ‘Advanced Options’ lets you set up the projection that the file is in so that FieldMAP can automatically convert it to the correct projection to bring into the map. There is also an option to import holes as separate polygons. The ‘Import Holes as Polygons’ checkbox creates a new polygon where a hole may exist inside a polygon. A ‘Hole’ is a polygon that exists within a larger polygon but is not joined to it at any point. If you want to define application depths for irrigation to a ‘Hole’, or count the ‘Hole’ area you need to create a polygon where the ‘Hole’ is and colour that ‘Hole’ polygon differently from the larger area. To define the application depth for the ‘Hole’, set the application depths ensuring you click on the ‘Hole’ area and define the rate separately to the larger area. Editing and Naming Fields 4.6.1 Naming Fields After creating your fields, you may want a text name shown in each field To name fields: 1. Click on the layer (in the layer tree on the left hand side of your screen) you want to show names of (e.g. fields). 2. Make sure that ‘Show Names?’ is set to ‘True’ in the properties window. 3. 4. 5. Click on ‘Edit’ then ‘Select’ in the menu bar at the top of the screen, and then click inside the field you want to name. The properties box then updates to the properties of that particular field. Enter the name for that field in ‘Name’ and press Enter. Refer to Section 4.7.5: Rotate text for instructions on rotating and changing text scale. 4.6.2 Displaying Field Areas FieldMAP automatically calculates the area of fields as they are created. If the areas are not showing, click on the ‘Fields’ layer in the ‘Layer Tree’ then in the properties of that layer change the ‘Show Areas?’ property to ‘True’. This can also be done by double clicking on ‘Show Areas?’. Note the FieldMAP trial will show all field areas as ‘0ha’. When you register with a full license the areas will show correctly. 4.6.3 Editing Fields After you have drawn your fields you may edit them. As you edit the field the size of the field will be automatically be updated. To edit fields: 1. Select the layer you want to edit, in this case, ‘Fields’. 2. Ensure tool. 3. Select a fence line or a corner of two or more fence lines and click and drag to alter the size of the field(s). ‘Edit’ is selected, and then click the ‘Move’ To add angles in a fence line: 1. Select the layer you want to edit, in this case, ‘Fields’. 2. In 3. Click in the position on the fence line you would like to ‘Edit’ mode, click on ‘Insert’ create the angle, and then use the ‘Move’ tool to drag the newly created angle around. You might find it beneficial to zoom in close to the area you are working on so that you can draw accurately. You may edit the features in other layers by clicking on the layer name in the ‘Layer Tree’ and dragging points around in a similar fashion. Drawing Other Features After you have drawn in all of the fields, you may add in any other features you wish. To do this, you can either draw them in by hand, or go and take more points with your GPS and download them in to your map. 4.7.1 Drawing Lines and Points You must create a new layer for each separate item you want to draw before you can draw it on the map. Think of each layer as an item in the key. Bridges should all go in the ‘Bridge’ layer, buildings should all go in the ‘Buildings’ layer, and so forth. Drawing features in new layers: 1. Click ‘New’ at the top left of the screen and create a new layer that corresponds to what you want to draw (polygon, polyline or point layer) 2. Right‐click on the new layer you have created, then click ‘Rename’ to change the name. Type a new name and press ‘Enter’. 3. Click on ‘Edit’ then ‘Add’ to start drawing. You might find it useful to turn off some previous layers to make it easier to see what you are drawing, do this by clicking on the tick next to the layer name to un‐tick it. 4. To finish drawing a polyline click on the tick button in the top right hand corner of your screen. You may click on the cross to cancel it. 5. Polylines and points can be named the same way that you name polygons. 4.7.2 Drawing Parallel Lines This feature is only available in polyline layers. Creating multiple parallel lines: 1. With your polyline layer selected, click on ‘Edit’ then ‘Add’. At the top right of the drawing window choose a parallel line tool: ‘Free form parallel lines’ allows you to place a parallel line at any given distance, or ‘Fixed interval parallel lines’ creates parallel lines based on the fixed interval entered. 2. Click on the original line you wish to replicate, it will then turn pink. Drag the mouse out to where you want the parallel line to be placed and then click to place it. You will notice another pink line with a distance on it telling you how far away you are placing the new line. If you have chosen the fixed interval parallel line tool, it will ask you what interval you would like to specify, then after clicking OK, will snap to that interval from the original line specified. 3. Edit and Move your lines by selecting ‘Move’ button. Rotate Line: Select one end point and drag. Move Perpendicular: Select line centre and drag. Extend line on original axis: While holding ‘Alt’ key, select end point and drag. 4.7.3 Drawing Arcs (polygon arcs) To draw polygons in an arc shape, for example if you want to draw an arc shaped lane under a centre pivot irrigator, you use the arc tool: 1. Click on the polygon layer you want to draw the arc in (e.g. ‘Fields’ layer). 2. Click on 3. Click on the ‘Arc Tool’ button at the top right of the screen. Note; if the button is not there, ensure you have a POLYGON layer selected. 4. Click on the centre point that the arc is to be drawn around. 5. Move the mouse/pointer out to the radius of the inside of the arc to be drawn, then click. It will draw a temporary circle at this radius. 6. Move the mouse/pointer to the outer radius and click again. 7. Move the arrow between the two circles to where you want the arc to start, then click to place the start of the arc. ‘Edit’ then ‘Add’. 8. Move the mouse to extrude the arc about the centre‐point to the desired position, then click to complete the arc. 4.7.4 Adding Text To add text notes to your map, you can create a text layer, then place and move text around on your map. You may make several text layers and give them different names. To create a text layer and add text: 1. Click ‘New’ at the top left of the screen and then click on ‘Text’ to create a new text layer. 2. Right‐click on the new layer you have created, then click ‘Rename’ to change the name. Type a new name (such as ‘Text Notes’) and press Enter. 3. Click on ‘Edit’ then ‘Add’. Be sure that your new text layer is also selected by clicking on it in the layer tree. 4. Click in the position you want to place your text within the map. 5. Enter your text in the box provided, then click ‘OK’ 6. To move your text, click on ‘Move’ then move your mouse to the centre of your text, then downwards until you see the cursor change to a pen with a black dot next to it Click and drag to move your text. . 4.7.5 Rotate text If your text does not fit inside a field you may wish to rotate it. To rotate text: 1. Click on the layer that contains the text you wish to rotate in the layer tree (e.g. ‘Fields’ layer) 2. Click on the 3. Click on the ‘Edit’ button. ‘Select’ tool. 4. Click inside the field, or on the text you wish to rotate. 5. In the properties box (below the layer tree box) is a section labelled ‘Appearance’. Below ‘Appearance’ is ‘Scale’ and ‘Rotation’. 6. The ‘Scale’ property can be set between 0 and 1. 7. The ‘Rotation’ property can be set between ‐360 and 360. 8. To change the scale or rotation properties, simply click on the property and type in a new number, and then press enter. Your text will then update to reflect your changes. Repeat this process until the text looks how you want it. 4.7.6 Layer Tree Order When you create a new layer, it is automatically placed at the top of the layer tree. This tree shows the order layers are drawn on the map. Layers that appear higher on the tree than others will appear on top of them in the map. To change the position of a layer on the layer tree, click and drag a layer to a new position above or below other layers. 4.7.7 Colouring Polygons You can colour an entire layer the same colour or colour individual polygons separately. To change the colour of an entire layer: 1. Click on the layer you wish to colour in the layer tree. 2. In the properties box, under ‘Colour’, click on the ‘Display Type’ and change this to ‘Normal’ if it isn’t set already. 3. In the properties box, under ‘Colour’, click on the ‘Fill Colour’ colour swatch. Open the drop box by clicking on the down arrow and use the menu to select the colour of your choice. To change the colour of individual polygons in a single layer: 1. Click on the polygon layer in the layer tree. 2. In the properties box, under ‘Colour’, click on the ‘Display Type’ and change this to ‘Individual’. 3. Click on ‘Edit’ then ‘Select’ in the menu bar at the top of the screen, and then click on the field you wish to colour. The properties box for that field will appear. 4. Under the ‘Colours’ heading click on the ‘Fill Colour’ colour swatch. Open the drop box by clicking on the down arrow and use the menu to select the colour of your choice. 4.7.8 Adding a Key, Scale, North Arrow and Border If you have many layers of information on your map, you may want a key and border to make your map look more complete. Insert a key: 1. Click on the ‘New’ button, and then click ‘Key’ in the drop down menu. 2. Move your mouse over the map and your key should appear in the middle of the screen. If you don’t see it, try zooming out. 3. Individual layers can be shown or hidden in the key by clicking on the layer you wish to toggle in the layer tree, then selecting ‘True’ or’ False’ in the ‘Show In Key’ property. 4. To move your key, click on the ‘Edit’ button at the top of the window, then be sure to select the ‘Key’ layer in the layer tree. 5. Click on the 6. Place your mouse over the top item in the key layer and then click and drag to move your key around on the screen. Place it somewhere it will print but not obstruct your map. 7. As you show or hide layers on your map you can update the key by clicking twice on the tick to the left of the ‘Key’ layer in the layer tree to hide and then show the key. When the key is redrawn it will include whatever layers are currently being displayed on the map. 8. You may change the key size, text colour, border colour, thickness and corner radius in the key properties box (below the layer tree). 9. To enter extra text at the bottom of the key, use the ‘Extra Text’ property in the key properties. ‘Move’ button at the top of the screen. Insert scale and north arrow: 1. Click on the ‘New’ button, and then click ‘Scale’ in the drop down menu. 2. Move your mouse over the map and your scale and north arrow should appear in the middle of the screen. If you don’t’ see it, try zooming out. 3. To move your scale, click on the ‘Edit’ button at the top of the window, then be sure to select the ‘Scale’ layer in the layer tree. 4. Click on the 5. Place your mouse over the top left hand corner of the ‘Scale’ layer and then click and drag to move your scale around on the screen. Place it somewhere it will print but not obstruct your map. 6. You may change the scale size, text colour, border colour and thickness and corner radius in the key properties box (below the layer tree box). ‘Move’ button at the top of the screen. Insert a border: 1. Click on the ‘New’ button at the top of the screen, then click on ‘Border’. 2. When you move your mouse over the map you will see a border appear in the centre of the screen. 3. Click on the ‘Edit’ button at the top of the screen, then select the ‘Border’ layer in the layer tree by clicking on ‘Border’. Click on the 4. ‘Move’ button. Drag each corner of the border to make the border surround your map and key. To drag a corner, move the mouse near the corner of the border and notice when the curser changes to a pen with a black dot just below it when you move the mouse just inside the corner of the border. When you see the cursor change, click and drag the corner. Do this for all four corners to place your border in the correct position. 5. You can change the border thickness and colour in the properties box. 5 Common Mapping Tasks 5.1.1 Zoom Zooming in and out in all modes is achieved by selecting ‘Zoom’ and holding down the left mouse button on your target and dragging the mouse up or down. Using other tools in ‘Edit’ mode, you may zoom by holding down the shift key on your keyboard and following the same procedure as above. You may zoom to show a complete layer on the screen at once by right clicking on the layer on the layer tree on the left of the screen, then clicking on ‘Zoom to Layer’ (or by double clicking on the layer name). This is often handy if you ‘loose’ your map due to zooming too far in, out or elsewhere and cannot find it. Simply right‐click on the top level of the layer tree, and click on ‘Zoom to Layer’. 5.1.2 Pan Panning around your map in all modes is achieved by selecting ‘Zoom’ and holding down the right mouse button and dragging the map. If using other tools, you may temporarily pan by holding down the shift key on your keyboard and following the same procedure as above. 5.1.3 Ruler The ‘Ruler’ tool enables you to measure distances and areas on your map. Also, when in ruler mode, when you hover over a GPS point, the latitude, longitude and altitude of that point will be displayed at the bottom of the screen. 1. To use the ruler tool click on the ‘Edit’ mode. ‘Ruler’ tool when in 2. You can then click on a point to start your measurement from. A pink line is drawn from this starting point to the current mouse position. Clicking again will continue the line and you can carry on adding segments to your measurement. 3. Once you have finished with your measurement or want to start a new one, you can use the ‘Tick’ or ‘Cross’ button in the top right corner of the display to remove the pink line. Associated with this pink line are several measurements which can be viewed in the properties area: Distance: The total length of pink line (in metres). Distance3D: When measuring between GPS points, this value is the distance between points incorporating change in elevation. Circumference: The total length of the pink line plus the length from the end of the line back to the start position (if you drew 3 sides of a square, it would give you the total circumference of that square). Area: The total area enclosed by the ‘Circumference’. Altitude Change: Measures the change in altitude between the last two GPS points you clicked on. 5.1.4 Select Measurement Units To change measurement units, click on the ‘Edit’ menu, then ‘Options…’ This will bring up a window in which you can change the units for your map. 5.1.5 Send Shapes between Layers Occasionally when you are drawing you may draw a polygon in the wrong layer. Rather than having to delete the shape and then re‐draw it in the correct layer you can send the shape to another layer. Moving a polygon to another layer: 1. Select the layer you wish to move the polygon from in the layer tree. 2. Click on the the screen. 3. Click on the polygon that you want to send from one layer to another. 4. A window will pop up asking you to select which layer you want to move the shape to. Select the layer you want to move it to and then click ‘OK’ 5. You then have the option to delete to original polygon. In most cases you will want to delete the original so click on ‘Yes’. 5.1.6 1. 2. ‘Send to Layer’ button at the top of Show Lengths of Lines in a Polygon or Polyline Layer Click on the polygon or polyline layer in the layer tree on which you wish to show the lengths of individual lines. Change the ‘Show Lengths?’ property in the properties area to ‘True’. 5.1.7 Saving your Farm Map It is a good idea to save your map frequently while working on it, as well as when you have finished before you close it. Saving is simply done by clicking on the ‘Save’ button. 5.1.8 Printing your Farm Map To print your map, simply select (tick) the layers you would like to print from the tree on the left hand side of the screen. You may like to make the ‘Fields’ layer transparent to save ink by changing the ‘Fill Colour’ to transparent in the properties box (You will have to select the ‘Fields’ layer, and then you will see the properties for that layer). To print: 1. Before printing, be sure that you have saved your map. 2. Select the ‘Print’ icon from the menu bar. 3. A blue box representing the boundaries of your page will appear on the screen. If you want to print landscape (page rotated 90°) rather than portrait, click on ‘File’ then ‘Page Setup…’ Select ‘Landscape’ and click ‘OK’. Move your mouse over the map to update the display and show your different page orientation. 4. Pan (right mouse button and drag) and zoom (left mouse button and drag) the map until it is displaying how you want it to print on your page. 5. If you would like to preview what the printed sheet will look like, you can click ‘File’‐>’Print Preview’. This will open up a preview window, and after a few seconds your preview should appear. To close the Preview window click the ‘Close’ button or the ‘X’ in the upper right corner. 6. Click ‘File’ ‐> ‘Print’ and select your desired printer and printing options, then press ‘OK’ to print your map. 5.1.9 1. 2. Emailing your Farm Map Open your email program and create a new message Attach your map file to the email as you would attach any other type of file. You will need to browse to find your map file, if you have been following these instructions it will be found in your ‘Maps’ folder within your ‘Documents’ folder. If your computer is set to show filename extensions it will end in‘.wml’ and will have the FieldMAP logo for its icon. If you are emailing your map to our support email ([email protected]) remember to write your reason for sending your file in the body of the message (i.e. support request, to print maps). If requesting map prints, please state what size maps you would like printed, if you would like them laminated or as a map‐ pad, and the quantity you want. 5.1.10 Download the latest version of FieldMAP The latest version of FieldMAP is available on our website, www.wheresmycows.com. Go to www.wheresmycows.com and click on the ‘Support’ tab, then ‘Software Updates’ to find, download and install the latest version on your PC. 6 Advanced Mapping Operations These operations assume a general familiarity with FieldMAP and FieldMAP’s common operations. You may need to refer to earlier parts of this booklet if you are not very familiar with FieldMAP. 6.1.1 Subdividing or Re-Fencing Fields You may have mapped your farm with the idea of subdividing fields or re‐fencing in mind. This can be accomplished in one of several ways. We have created a step by step guide for you to follow to make subdividing and re‐fencing easy. From here on we will call it ‘Re‐fencing’. In this section, we will work through an example to show how to re‐fence the five fields in the lower left corner of the image in Figure 1 into three equal sized fields. 1. Calculate the total Figure 1 area that you wish to split up. To do this create a new polygon layer and label it ‘Areas to Re‐fence’. 2. Draw a polygon around the boundary of the area you are going to subdivide. This will give you the area that you wish to subdivide. You can then figure out how many fields you want in that area and what size they are going to be. 3. Change the ‘Text Colour’ of the ‘Areas to Re‐fence’ layer to red or something Figure 2 other than the colour of the field text so that you can see the total area that you are going to re‐fence. Change the ‘Area Decimal‐Places’ property to ‘2’ to get a more accurate area figure to divide into how many fields you desire. 4. By this stage you should have something similar to the image in Figure 2. The grey area (12.25ha) is the area that we wish to subdivide. This layer is below the ‘Fields’ layer and we can see the existing fields over the grey area. 5. In this example we are going to divide the 12.25ha into three equally sized fields of about 4.08ha each. 6. In the layer that you wish to create your subdivided polygons in (generally your ‘Fields’ layer), use the ‘Move’ tool or ‘Add’ tool to add new polygons in to draw your subdivided areas. 7. To make it easier to view what you are doing, drag the polygon layer that you are drawing in to the top of the layer tree. This will bring the layer to the top so that you can view it. Make sure that you have the layer ‘Fill Colour’ set to ‘Transparent’ in the properties box. 8. Using the ‘Move’ tool, drag the corners of the polygons around to get your field the desired size. 9. The image in Figure 3 shows the fences moved to give the desired size (4.08ha) fields. 10. It may be necessary to insert points in lines to create new bends moving when polygons around to suit. 11. Turn off the ‘Area to Re‐fence’ layer by Figure 3 deselecting the checkbox next to the layer name. 12. Change the ‘Fill‐Colour’ back to transparent. Figure 4 At the end you should see your re‐fenced fields similar to the image in Figure 4. You can then upload new corner post points to your GPS as explained in Section 7: Uploading Features to your GPS. 6.1.2 Calculate 3D Surface Area of Fields In hilly areas there will actually be more surface area in a field than a standard planar area calculates. Instead of using a 2D planar area you can use your GPS and FieldMAP to calculate the 3D surface area of an entire polygon layer. To do this you need both a polygon layer (usually your field layer) and a set of points containing altitudes for FieldMAP to calculate the surface area from. Creating a 3D surface area: 1. Draw up your fields and map as you would normally. 2. Clear your GPS memory, then go out and mark waypoints in the area that you wish to calculate a 3D surface area for. To do this we recommend taking points at the top and bottom of hills and valleys, and where ever the slope changes. There is no need to label your points. The more points you take, the more accurate the 3D area will be. 3. Download your altitude waypoints into FieldMAP as you would normally. 4. It is a good idea to rename your new points ‘Altitude points’ or something similar so that you do not get mixed up and select the wrong layer for FieldMAP to use in its calculation. 5. Now is a good time to save your work. 6. ‘Right mouse click’ on the layer that you want to create a 3D surface area for (e.g.Fields). 7. Select ‘Calculate 3D areas’. 8. Select your altitude point’s layer to include in the calculation by clicking the checkbox next to the name, then click OK. 9. At this stage FieldMAP may take a while to calculate the 3D surface areas. Don’t worry, this is normal. Just wait for it to finish and you will be able to continue working like normal. 10. If you now click on your polygon layer for which you just created a 3D surface area calculation, you will see in the properties under the Measurements section that there is now a ‘Total Area’ and a ‘Total Area 3D’ property. 11. If you change the ‘Use 3D Areas?’ property to true, the areas displayed in the fields will be the 3D surface area that you just calculated. 12. Save your project to retain these areas. 6.1.3 Moving an Entire Layer Due to the inherent inaccuracy of handheld GPS over time, you may find that if you record some fields one day, then go back and record them again next month, the whole field could have shifted by a few metres. This could also be a problem if you record some fields, then later go back and record more to find that they do not line up. To get around this problem, we have created the ‘Move entire layer’ tool. To use the ‘Move Entire Layer’ tool to line up your fields: 1. When you are recording GPS points, mark a waypoint on a ‘reference point’ e.g. a trough or particular angle post. The next time you go out to record GPS points ensure you mark the ‘reference point’. 2. Download the new GPS points into FieldMAP as you would normally. 3. When the points are downloaded if the ‘reference points’ do not line up you will want to move the latest points layer collected. Right click on the new layer you want to move, and then select ‘Move Entire Layer’. 4. A window will appear where you need to type in the amount by which you want to move your points in each direction (for left or downwards, type a negative sign before the number). 5. Estimate the distance that the layer needs to move to line up the ‘reference points’, then Click ‘OK’ and your entire layer will move by this amount. You may need to have several attempts at moving the layer before you get it exactly where you want it. Before moving the layer, use the Ruler tool to find out how far in each direction you need to move the layer. 6.1.4 Merging Layers Sometimes you might want to merge several layers into one (e.g. if you have taken several sets of GPS points that you wish to combine). To merge layers: 1. Right click on the layer that you want to merge your layers into. 2. Select ‘Merge Layers into this’. 3. Check (click on) the white box next to any layers that you want to merge into the layer that you right clicked. 4. Press ‘OK’ 5. After the layers are merged you will be asked if you wish to remove the layers that you merged into the first layer. Select ‘Yes’ or ‘No’ depending on whether you wish for the layer to stay as a separate layer or not. 6.1.5 Exporting as a Shapefile or DXF (AutoCAD) If you have another farm management program you may want to export your map from FieldMAP and import it directly into your farm management program. Each layer can be exported as a shapefile or dxf which will load directly into most other farm mapping or GIS software programs. To export a shapefile or dxf: 1. Right‐click on the layer you wish to export, click ‘Export’ then in the sub‐menu ‘Export to Shapefile’ or ‘Export to dxf’. 2. You will need to specify if you want to export your points with easting/northing or latitude/longitude coordinates (WGS1984). 3. Select a location to save your file and type a name, then press ‘OK’. 4. Your layer has now been exported as a shapefile or dxf and you may import that file into your farm management program. 6.1.6 View in Google Earth If you do not have the Google Earth software installed on your computer it can be downloaded from the Google Earth website (www.earth.google.com). 1. Right‐click on the layer in the layer tree that you wish to export from FieldMAP. 2. Click ‘View in Google Earth’. 3. Select a location to save your KML file and type a name, then press OK. 4. Your layer has now been exported as a KML file. If you have Google Earth installed on your computer it will automatically start up and display your exported layer. Some graphics cards have issues trying to display Google Earth at the same time as FieldMAP. If you run into trouble, we suggest exporting a KML file using the method below, then closing FieldMAP before you open Google Earth. 6.1.7 Export KML File Exporting to KML files allows you to view all or part of your farm map in Google Earth. 1. Right click on the layer you wish to export. 2. Click on ‘Export’‐> ‘Export to Google Earth (KML)’. 3. Select a location to save your KML file and type a name, then press OK. 4. Your layer has now been exported as a KML file. 6.1.8 1. Import KML File You will need to have saved a KML file in Google Earth to be able to import it into FieldMAP. To save from Google Earth, right click on a layer and select ‘Save As…’. Be sure to select save as file type KML in the save dialog box (Change from the default .KMZ file) 2. From FieldMAP, open a new or existing farm map then click ‘Import’. 3. Browse to the folder containing your KML file, and select your KML file to import. 4. Press ‘Open’ and your file will load. 5. If you do not see your data after it has loaded, expand the layers tree (press the ‘+’ button next to your farm name in the top left window) the right click on your imported layer and click ‘Zoom to Layer’. 6.1.9 Custom Point Images You can create up to 20 custom point types to insert into your maps. Creating a custom point image: 1. To create a custom point you must save an image as a windows bitmap (.bmp) file using a program such as Paint (found under the accessories program in your start menu). 2. Save your images as custom1.bmp, custom2.bmp, etc in ‘C:\Program Files\WMC Technology\WMCMap\textures\texture’ 3. You will then be able to use your .bmp image as a point type by selecting that custom point from within FieldMAP. 6.1.10 Center-Pivot Irrigators FieldMAP allows you to draw full circle and part‐circle centre‐pivot irrigators. 1. Click on the ‘New’ button at the top of the screen, then click on ‘Centre‐Pivot Layer’ 2. You will notice a new layer called ‘New Pivot Layer’ appears at the top of the layer tree. Click on the text that says ‘New Pivot Layer’ to select it (it will turn blue). 3. Click on 4. Click in the position you want to place the centre of your pivot. (You can move it later, so don’t need to place it too accurately to start). 5. A window will appear asking you to enter some information about your irrigator. ‘Add’. Enter a start angle of 0 and end angle of 360 to draw a full circle pivot. Enter wheel track radii (distance from centre) to draw in wheel tracks. Enter radius and then click on ‘Add value’. Repeat this process for each tower. A handy tip is to put a wheel track at 2m (or 7’) so that you can see where the centre‐point of your pivot is. Sprinkler tracks and endgun radius is optional. 4. Click OK to create your irrigator. 5. To move your irrigator, click on ‘Move’ then move your mouse to the centre of your pivot, then downwards until you see the cursor change to a pen with a black dot . Click and drag to move your irrigator. 6. To modify the spec’s of your irrigator, click on ‘Select’ and then click on the centre of the irrigator you wish to edit. You will notice that there are two types of irrigator layers that can be added, a Centre‐Pivot layer or a VRI Irrigation layer. The Centre‐Pivot layer can be used to show your centre‐pivot irrigator and the wheel tracks on your map. This layer can also be helpful when designing irrigation layouts. A VRI Irrigation layer allows you to create plans for a Precision VRI system. The FieldMAP software which is supplied as part of the Precision VRI system will come pre‐loaded with the VRI Irrigation layer. For users who have purchased the stand‐alone software this layer is not relevant. 7 Uploading Features to your GPS Uploading Points Handheld GPS or Layers to your After you have drawn your farm map, you may want to upload points back to your GPS so that you can find them in the field. To upload a point: 1. Click the ‘Edit’ button in the menu bar. 2. Click 3. Click the point on your map that you would like to upload. 4. Give your waypoint a name and optional comment, and then click ‘Upload Waypoint to GPS’. Follow any further instructions on the screen. 5. Your point is now uploaded to the GPS. Repeat this procedure for any other points you wish to find out on your farm. ‘Send To GPS’. Some GPS units will let you upload an entire layer at a time from FieldMAP. To upload a layer: 1. Right‐mouse click on the name of the layer that you wish to send to your GPS unit. 2. Click on ‘Send to GPS’ 3. In the next window that comes up, click on ‘Upload Layer to GPS’. Finding your Uploaded Points Out in the Field Your GPS can be used to find points you have created on your map out on the farm. To do this you must first upload the points you wish to find out on the farm as explained in the previous section. Finding points on a GPS60 (Other GPS units will be similar): 1. Out in the field, power up your GPS and wait for it to initialise and lock on to enough satellites to give you a fix. 2. Press FIND. 3. Press ENTR with the ‘Waypoints’ icon selected. 4. Using the rocker pad, scroll to the waypoint you wish to locate. Press ENTR. 5. ‘Go To’ will be highlighted, press ENTR. 6. The map screen will show up, showing a line that looks like a road between your current position and the point you are navigating towards. Use the IN and OUT buttons to zoom in and out, and the rocker pad to pan around the map. 7. Press PAGE to view the compass screen which has an arrow showing you which direction to walk in, and tells you how far you need to walk to find the point. 8. To find another point, simply repeat this procedure from step 2. If you do not have a GPS60, other units will be similar. If you can’t figure out how to find a waypoint try searching the GPS’s user manual online. 8 TracMap Operations This section applies to TracMap users only. If you own a TracMap GPS unit, there are specific features for interfacing FieldMAP with your TracMap unit. For questions relating to the use of your TracMap unit please contact TracMap directly. Transferring a Map into TracMap Transfer of your field shapes, hydrant points etc. is done by exporting the relevant layer onto a USB memory stick, and then plugging that stick into the TracMap unit using the dongle supplied with the TracMap unit. 1. Highlight the layer you want to export. 2. Right click and highlight ‘Export’ then select ‘Export to TracMap’ (or if that option doesn’t exist select ‘Export to shapefile’ ‐> ‘Latitude/Longitude WGS1984’) 3. This will open a standard windows explorer box for you to select your destination, and the file name. 4. Save your file on your USB stick to take and import on your TracMap unit. Fields must be polygons. Pull lines (for K‐line or pod irrigation) must be polylines. Shift points for long laterals and hydrant points must be point layers. If you have imported your map from another drawing program, they often appear as polylines, not polygons. In this case you will have to redraw your fields in a polygon layer before exporting to TracMap. Drawing Irrigation Lines See Section 4.7.1: Drawing Lines and Points for instructions on drawing points and lines. 8.2.1 K-Line Use polylines to map out your shift lines. Turn ‘Show Lengths’ on to show you line lengths as you draw. Make your ‘Line Width’ the same as your coverage width. This makes it easier to achieve the correct spacing For rectangle fields, make use of the ‘Multiple Parallel Line’ feature to draw identical length lines at the correct spacing. Once you have drawn your lines, name them (see instructions for naming fields in Section 4.6.1: Naming Fields). 8.2.2 Long-Laterals Use ‘Points Layers’ to plot hydrant positions and shifts. 1. Once you have your hydrant positions, create a point’s layer called ‘Shifts’. 2. Change your ‘Point Type’ to ‘SprinklerYellow’ (found by clicking on the Point Type box in the properties box , and then scrolling down the list) 3. Change your ‘Point Size’ to the radius of your sprinkler coverage (in metres e.g. 15 for a 30 metre diameter circle). 4. Use ‘Edit/Add’ to place 6 or 8 shifts around each hydrant, and then use ‘Move’ to place them accurately. 5. Click ‘Select’ and then click on each hydrant to name them. Importing Printing TracMaps for Display and You do not have to have an existing farm map to display or print your track or coverage from the TracMap unit. You can start with a blank map. 1. Plug the USB stick containing the exported job(s) in to your computer 2. Click the ‘Import’ icon in the top menu and a windows box will open. Click on the drive or folder containing the exported jobs. 3. There will be a series of folders named after the job name you used (e.g. Job1, Urea, etc.) 4. Click on the folder, and it will contain two files: 5. The log.shp file contains the track driven when spreading/spraying, and will import as a polyline. The Secondary.shp file is a point file showing the places driven when not spreading. Click on the log.shp file, and it will import as the bottom layer into your map. Once imported, you may have to drag it up the layer order before it will display on screen (depending on your other layer settings). You can now change the line width, colour and other properties just like any other polyline. 9 Variable Rate Irrigation (VRI) For detailed tutorials related to using the VRI functions of FieldMAP and creating VRI irrigation plans please visit www.precisionirrigation.co.nz. VRI Toolbar To bring up the VRI toolbar click on the toolbar. ‘VRI’ button in the ‘Mode’ The VRI toolbar (shown above) is where you can access the VRI features of the software. This toolbar takes FieldMAP out of ‘Edit’ mode and the layer tree will only contain layers directly related to the VRI features of your map such as your VRI Irrigator, application layer and avoid layer. You should see your VRI layer in the layer tree If you expand the layer (Click on the ‘+’ on the left of the layer name), it will show any layers being used by that layer, for example: Each layer must be ‘checked’ (ticked) to be able to see it on the map. 9.1.1 Set the Application Layer and Avoid Layer Before you can define different application depths (or rates) to be applied beneath different parts of the irrigator you must have drawn these areas (or management zones) as polygons in a single layer. Every management zone (polygon) must have an application depth assigned to it, otherwise no water will be applied. Likewise for the avoid layer, you need to have created a separate polygon layer with polygons inside it that you want to avoid irrigating. Note that you can easily draw polygons in arc shapes using the ‘arc drawing tool’. Refer to section 4.7.3 Drawing Arcs (polygon arcs). To create a polygon layer for your irrigation management zones refer to the instructions to create polygon layers and polygons in Section 4, choose the appropriate section depending on what you are using to draw the management zones (i.e. GPS points, an aerial image or Google Earth). Alternatively if you have a file you wish to import such as an EM survey map refer to the 4.5 Importing Maps from Other Programs.. In this example we are going to use a layer called ‘EM Areas’ to define the application rates with. Setting the application layer: 1. In the layer tree click on the VRI Irrigator you wish to set the application layer for. 2. In the irrigator properties, click the application layer and select the layer you wish to use to define your rates in. In our example below you’ll see we set it to ‘EM Areas’. 3. It is possible to have multiple application layers to set irrigation plans for different situations. Create the application layers as individual layers. Switch between the layers when creating different plans by changing the ‘Application Layer’ property in the VRI properties box. You can save the different configurations you create. To copy a field (polygon) layer you can export it to a shapefile and then import it again, however this will not copy across the application data you have defined. Setting the avoid layer: 4. In the layer tree click on the VRI Irrigator you wish to set the avoid layer for. 5. In the irrigator properties, click the avoid layer and select the layer you wish to avoid watering. In our example above you’ll see we set it to ‘Avoid Areas’. The difference between setting an avoid area and simply setting an area to 0 is that on the boundary of an area set at 0 and an area set at some other depth, the sprinkler will pulse at the average percentage of what is being instructed beneath the footprint of the sprinkler. For an avoid area, as soon as any of the footprint reaches the avoid area, the valve will shut off. This is critical for keeping irrigation off sensitive areas. To set up a polygon in an arc‐shape to define an application or avoidance layer, refer to section “4.7.3 Drawing Arcs (polygon arcs)” 9.1.2 Application Types Available There are several application type modes available to choose from when setting up your plan. This is done in the ‘Application Type’ property for the VRI Irrigator. The options are: Full VRI: With this option you set the depth you want to apply in all irrigation management zones and the VRI system controls the speed of the machine and pulsing of valves to achieve the desired depths. In this mode, speed on your irrigator’s panel must be set to 100%, the VRI controller will interrupt the speed signal to control the end tower speed. Full VRI has a uniformity correction function, if the sprinkler chart has sprinklers that are nozzled creating none uniform application Full VRI will pulse the sprinklers to even out the application and gain greater uniformity. In doing this the machine has to slow down to compensate for less water being applied while pulsing Simple On Off: This mode will allow sprinklers to be either switched on or off. They will not pulse. This mode is generally used for irrigators with only part of the machine controlled to turn off sprinklers over sensitive areas, or for machines with big guns along the top where they are not to be pulsed. In this mode speed and depth are controlled on your irrigator’s panel. VRI Ignore Flow Rates: This mode works very similarly to the Full VRI mode, however without the uniformity correction function. For systems where return time needs to be as short as possible ‘VRI Ignore Flow Rates’ may be desirable as uniformity correction pulsing is turned off. In this mode, speed on your irrigator’s panel must be set to 100%, the VRI controller will interrupt the speed signal to control the end tower speed. VRI Percent Based: This mode allows you to set different areas as a percentage of 100% of water to be applied, the application depth is set on the irrigator controller. In this mode, the irrigator speed is controlled by the irrigator’s controller according to the depth you set and the VRI system pulses valves to reduce the amount of water applied in areas you set. The disadvantage of this method is that in some cases it is inefficient in regards to pumping and time. For example, if for one area you set 50% of water to be applied along the entire length of the irrigator, the pivot will continue at the speed set and pulse all valves at 50%. Full VRI would be a more efficient option in this case as it would speed the irrigator up to apply the 50% reduction leaving all the valves open which would reduce the return time. 9.1.3 Define Rates Click on ‘Define Rates’ to set the application rates of individual polygons in your application layer. To define the rates: 1. Put FieldMAP in ‘VRI’ mode and select the VRI irrigator you wish to work with in the layer tree. 2. Ensure the correct layer is selected for ‘Application Layer’ in the properties. 3. Click on the 4. Select an area by clicking on a polygon. Once an area has been selected the following window will be displayed: ‘Define Rates’ button. 5. This window is where you set the application depth. To do this, enter the desired rate into the window then press ‘OK’. 6. The ‘Change for all polygons named ‘xxx’’ checkbox is used when changing an application rate for multiple areas with the same name. In this example, when checked all areas named ‘Zone 2’ will have a 5mm application rate applied. 7. Repeat until all polygons (management zones) under the irrigator have been defined. 8. Refer to Section 9.1.2: Application Types Available for different ways the file can be configured to apply irrigation such as percent based and depth based options. The fields will change colour in relation to the application rates that you apply. White signifies no water and the darkness of the blue indicates the depth of application. Notes on defining application depth: Sprinklers are pulsed at an average of the rates defined inside the footprint of the sprinkler. For example, a sprinkler exactly half way over the boundary of a 0mm and a 10mm area will be applying 5mm. Defining ‐1mm for an area will mean that a sprinkler ignores the rate in that area completely while averaging, until the entire sprinkler footprint is in the ‐1mm area, where it will then be turned completely off. For example, a sprinkler that had 1% of its coverage in a 10mm area and 99% in a ‐1mm area will still be applying 10mm. When 100% of the footprint is in ‐1mm area, it will be turned off completely. Rate Table: An alternative way to define the application rates is to use the Rates Table. The table lists all areas (management zones) by name and the corresponding application values. 1. First you need to ensure all the polygons (management zones) in the application layer are correctly named. Refer to the FieldMAP instruction manual section about polygons for instructions to do this. For ease of programming your VRI system, management zones should be named “fieldX, zoneY”. e.g. “Field1, EM1”, “Field1, EM2”, “Field2, EM2”, Field2, EM3” This is shown in the following image: 2. Put FieldMAP in ‘VRI’ mode and select the VRI irrigator you wish to work with in the layer tree. 3. Click on the 4. A window will appear listing all the areas by name with their application values if any have been set. To change an application value, click on the “New Value” box corresponding to a particular area name and enter the desired value. 5. If you have used the same name for areas which you wish to apply the same rates to, click and the ‘Rate Table’ button. list will be condensed combining all areas by name. When you enter an application value all areas with this name will be set to that value. 6. If you have labelled areas “FieldX, emY” or similar (as shown in step 1) you can combine areas by name group (e.g., in the example by paddock/field or by EM zone) You can combine by name group (in this example by Paddock (field) or by EM value. This can be used if you want to blanket change the application depth over a paddock (e.g., keeping irrigation off a crop ready to harvest) or over a zone, e.g., EM3 might be a naturally wet zone that you wish to apply less water to over the entire farm. 7. Once you have finished click ‘Set Values’ to set the new application values. 9.1.4 End-gun Control If an end gun is being controlled by the VRI main controller then avoidance areas can also be defined in the avoid layer. Note that anything in the avoid layer will stop application by both end guns and sprinklers controller by the VRI equipment. 9.1.4.1 End-gun settings To check the end‐gun settings; in ‘Edit’ mode click on the text of your VRI Irrigator layer in the layer tree, click on ‘Select’ and then click the centre point of your irrigator in the map. In the window that comes up, click on the “End Guns” tab. In this setting, you can have up to two endguns defined on your irrigator (e.g. one gun at each end of a lateral machine). To set up your end gun(s), set the following variables: Arc Angle: The arc through which the sprinkler throws water (eg, 180 degrees) Direction Angle: Direction the centre of the arc of the gun is pointing (e.g, 0 degrees is in line with the span pipe) Flow Rate: Flow rate of the water through the end gun Spray Radius: Average spray radius of the end gun X Offset: Distance from the A position (for a pivot, it is the radius of the irrigator, from the centre point to the end gun). Y Offset: Distance from the centre‐line of the irrigator. 9.1.4.2 Specifying where end-gun operates Endgun control works by shutting off the endgun anywhere it is over an “avoid area”. To set an avoid area, see section “9.1.1 Set the Application Layer and Avoid Layer”. VRI Simulation The FieldMAP software has several VRI simulation features to allow you to simulate your plan before uploading it to the irrigator. Pivot simulation: 1. To begin simulating the pivot moving, enter a value in the ‘Simulation Speed’ which is found under ‘Simulation’ in the bottom left window. We recommend a value between 1 and 10. 2. To see the sprinklers pulsing you may need to zoom in over the irrigator. 3. To move the irrigator to a certain position enter a value in degrees in the ‘Current Angle’ box, 0 is North, which is at the top of the screen. Flow rate: 1. The calculated flow rate can be viewed by setting the ‘Show Total Flow’ drop box, found under ‘Settings’ in the bottom left window, to ‘True’. The ‘Total Flow’ will appear to the top right of the mapping window. Calculating and Uploading Plans Once the rates and avoid areas have been set up, the last step is to upload the data to the irrigator. Plans can be saved either to a hard‐ drive or a USB stick. Alternatively, if you have a wireless connection to the irrigator you can upload the plan directly. You will need to ‘Calculate + Upload’ each plan you wish to use on your irrigator. 1. Make sure you are in VRI mode and the VRI irrigator you wish to make the plan for is selected. 2. Click the ‘Calculate + Upload’ button and the ‘Upload Plan’ dialogue box will appear. 3. Add a plan name into the ‘Enter New Plan Name’ text box. 4. There are three options (in separate tabs) for saving a plan, either saving to disk or uploading to FieldMAP Online or uploading directly to the VRI main controller (for those systems set up with a direct connection). 9.3.1 Save to Disk Using this tab will save the plan onto your computer. The plan file will need to then be transferred onto a USB flash drive so that the plans can be taken out to the VRI Main Controller. For the VRI Main Controller to recognise the plan files to import them they must be in a specific location on the USB Flash drive. When a plan is saved a folder is created with the plan name you entered (e.g Test_Plan). This entire folder needs to be transferred to your USB flash drive. If your plans are saved on your computer you will need to copy these onto a USB Flash drive if you are not using a wireless connection. To do this, create a ‘Plans’ folder on your USB Flash drive and copy your plan file into this folder. Removable Disk → Plans → ‘Test_Plan’ When you plug your USB flash drive into the VRI Main Controller and click ‘Upload Plan’ you should see your plan (e.g Test_Plan) in the list of plans available to import. For further details on uploading, selecting and deleting plans refer to your VRI Main Controller Instruction Manual supplied with your VRI system. 9.3.2 Uploading to FieldMAP Online You can upload your map to FieldMAP Online so that you can control your VRI system from any internet connected device. To upload a plan to FieldMAP Online and your VRI controller, in FieldMAP: 1. Click the “Upload to FieldMAP Online tab”. 2. Your current plan and available plans will be displayed in the corresponding windows. 3. 4. Enter a new plan name and click “Upload to FieldMAP Online” to upload your plan. If you want to set the plan as the current plan on the controller when it finishes uplaoding, click on “Set as Current Plan” prior to clicking “Upload to FieldMAP Online”. There are also options to delete plans and set plans to the current plan from this screen. This can also be done from within FieldMAP Online. 9.3.3 Upload Directly If you have a wireless connection between your VRI Main Controller and your office computer, irrigation plans can be uploaded directly to the VRI Main Controller. Note – we recommend using the FieldMAP Online option rather than the wireless connection option if you have an internet connection. There is more control available using the FieldMAP Online option, and it takes less setting up than the wireless connection option. You will need to ensure that the VRI controller is assigned a static IP address in your router, and that the static IP address is loaded in your FieldMAP file in the VRI system’s settings. 1. Click on the “Upload Directly” tab. 2. Click on the “Show Plans” button. If your system is set up correctly, it will display the current plan and available plans on the controller. 3. To change to one of the other available plans, click on that plan name, then click on the “Change Current Plan” button. The system will change the plan in the VRI controller. Click “Show Plans” again to update the display and show the current plan as the plan you selected. 4. To upload a new plan enter your plan name in the “Enter New Plan Name” box, then click on “Upload Directly”. You will see the Calculation and Upload status bars working. When your plan finishes uploading to the VRI controller, you will see the plan available in the “Available Plans” list. 5. To change the controller to run your plan, select the plan in the list of available plans, then click on “Change Current Plan”. FieldMAP (desktop) Online Setup in FieldMAP For the connection between FieldMAP Online and your desktop FieldMAP version to work, you must set up your FieldMAP file with a “Unique ID” provided by Precision Irrigation. 9.4.1 1. Check that your Unique ID numbers are set Open your FieldMAP File. In ‘Edit’ mode click on the text of your VRI Irrigator layer in the layer tree, click on ‘Select’ and then click the centre point of your irrigator in the map. This will bring up your Irrigator settings window. 2. 3. 4. Click on the “Irrigator” folder in the centre panel. In the panel on the right, ensure that “Unique ID” is not set to “00‐ 00‐00‐00‐00‐00”. If the Unique ID is set to “00‐00‐00‐00‐00‐00”, phone Precision Irrigation and we will tell you what the Unique ID for that system should be. The Unique ID is also available on the “irrigators” page when logged in to FieldMAP Online. 5. After entering the supplied Unique ID, click the “OK” button. 6. Click on the 7. You will need to create new plans and load them into your controller for them to work with and log activity on FieldMAP Online. ‘Save’ button to secure your changes. 9.4.2 Check that FieldMAP is authorised to access your FieldMAP Online Account Before you can start uploading your plans to, and controlling your VRI system from FieldMAP Online, it must be authorised using an API key. To check whether this has been done, in FieldMAP: 1. Make sure you are in VRI mode and the VRI irrigator you wish to view the plans on is selected. 2. Click the ‘Calculate + Upload’ button. The ‘Upload Plan’ dialogue box will appear. 3. Click the “Upload to FieldMAP Online tab”. 4. If you get the message below, you need to link FieldMAP to FieldMAP online. 5. Click on the hyperlink to go to FieldMAP Online. 6. If it does not have the blue message and shows plans on your controller, you are all set up and ready to go. Refer to section “9.3.2 Uploading to FieldMAP Online” for details on how to upload plans. 7. If you clicked on the blue link and you are not logged in to FieldMAP Online, log in using your credentials. 8. Click on “Menu” then go to “Account” 9. You will see this section: 10. If a key (long string of numbers and letters) is shown, click on “Authorise FieldMAP” (otherwise, click on “Regenerate Key” and follow the onscreen steps to create a new key, then click on “Authorise FieldMAP”). 11. If using Internet Explorer, when it asks if you want to allow the website to open a program, click on “Allow” 12. If using Google Chrome, when the “External Protocol Request” warning comes up, click on “Launch Application”. 13. Other web browsers will have something similar. 14. When successfully connected you should see the following message: Wireless Connection Setup If you have a wireless connection between your VRI Main Controller and your office computer, then irrigation plans can be uploaded directly to the VRI Main Controller. Check your settings as shown below. (To view these settings; in ‘Edit’ mode click on the text of your VRI ‘Select’ and then click Irrigator layer in the layer tree, click on the centre point of your irrigator in the map. Click on the “Irrigator” folder in the centre panel. In the panel on the right, ensure that “Hostname” has your VRI controller’s IP address in it.) Checking FieldMAP Status of VRI system in Use the ‘View Status’ button to check see the current position of the irrigator, current plan, mode, and calculated average flowrate. To do this: 1. Make sure you are in VRI mode and the VRI irrigator you wish to see the status of is selected. 2. Click on appear: 3. ‘View Status’. A window similar to this will Depending on what sort of internet connection you have set up, you will see different options for updating the status, either through FieldMAP Online or through Direct Communication. Click on the update button to update details in the status screen. 4. You should then see the current plan loaded on the controller, how many nodes are connected (if it is running), the A and B positions of the machine (centre point and GPS position if a pivot, both GPS positions if a lateral), whether the system is in Running or Initialise State, whether it is in pivot or lateral mode, and what the current calculated flow rate is 5. Click on “Show current position in FieldMAP” to move your irrigator to the current position in the map as reported by the VRI controller. 10 FieldMAP Online This section details the functions and features available on FieldMAP Online at the time of print. (Note: due to the nature of websites, it could have been updated since this instruction manual was printed). Logging In To log in, direct your web browser to www.precisionirrigation.co.nz Click on the ‘Login’ button at the top right of the page. Enter your username and password (If you do not have your username and password, call or email Precision Irrigation to have it set up), then click ‘Log in’. You will then see the overview page for your VRI systems (pictured above). Specify date range for reporting After loading, you will see an overview screen showing your irrigators. By default, the information displayed is for the past 24 hours. You can quickly select the last 7 days or last 30 days by clicking on the text at the top of the page. To specify a date and time range that you would like to report information for, click on the “History” button ( ). You can then set the from and to dates using the dropdown calendars . Your overview page will show a scale at the top right of the map The scale will change, depending on the date range you selected and the amount of irrigation applied over this date range. Note: It is much easier to see the amount of irrigation applied in Map view than Satellite view, as the aerial photograph does not show through the blue overlay, distorting the colour your eyes see. Note: Often when you look at a zoomed in image, sometimes you may see some aliasing. In the picture above, this is the upside‐down parabolic shape on the left hand side. This aliasing is caused by the sheer amount of data that the system is processing and the inability to display it all clearly at much lower resolution on your screen than it applies out in the field. When reading these images, simply take an average by eye. Map Navigation The button allows you to show your map in full screen. To return to normal, click on the button. Clicking the button will remove the photograph in the background. Doing this allows you to more easily read the amount of irrigation applied in the map, as the colours from the aerial photo do not show through the blue overlay. The button will show the aerial photograph in the background again. will zoom in and out of the map one level at a time. The scroll wheel on your mouse (with your mouse positioned above the map) will also do this. To pan, click and drag the map. At the bottom of the page, you will see flowrate, volume and number of irrigators currently running. If you have more than one irrigator, these figures will be the total. You can cycle through individual irrigators by clicking on the arrow buttons. Weather At the bottom right of the opening page, you will see today’s weather forecast for your region. If you click on Today’s weather, it will take you to a page showing your 7 day forecast, including predicted evapotranspiration and precipitation (available with paid subscriptions only). You can also access the forecast information by clicking on , then . Irrigators You can navigate to the Irrigators section by clicking on the button, then . A page will appear that shows each of the VRI enabled irrigators you have connected to your FieldMAP Online system. Click on one of the irrigators to view its individual properties. 10.5.1 Changing VRI Plans After clicking on an irrigator (in this example; Irrigator “Zimmatic 01”), you will be shown the plans that have been uploaded to the irrigator. On this page you may change the display colour of this irrigator on your map, as well as switch to or delete plans. By clicking on , your controller will update to that plan if it is online, otherwise it will change to that plan the next time the controller comes online. Note: If you click switch to, but your controller is not online, it will not switch to that plan until it comes online. If you switch to another plan manually in the meantime, it will still switch to the plan you selected in FieldMAP Online when your controller next communicates with FieldMAP Online. The button will remove a plan from FieldMAP Online, as well as from your controller. For information on how to upload plans to FieldMAP Online using FieldMAP, refer to section “9.3.2 Uploading to FieldMAP Online” Layers You can navigate to the Layers section by clicking on the button, then . In this section you can select whether to show or hide layers that are currently uploaded to your map. Layers may include things such as your fields, avoid areas, irrigation zones, etc. . To upload more layers to FieldMAP Online, click on This will bring up the “Upload Layers” window. Either drag and drop your FieldMAP .wml file into the space OR find and select your .wml file to upload it. Reports and then You can view reports showing total usage overview, flow‐rates for each machine, and application depth by polygon. Clicking on the button, then you to the Reports section. will take Selecting “Last 24 hours”, “Last 7 days”, “Last 30 days”, or selecting a date range from the History option sets the time that the reports cover. For example, the report below shows the depth of irrigation applied in each zone, and how much of the zone in the “AWC” layer received water over the past 24 hours. By giving polygons the same names (e.g. “Zone 1”), this will combine the areas of those polygons for the application report. Setting Units You can select the units that you prefer in the Account section. Click on , then . In see different unit options that you can set. you will