1
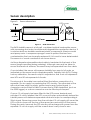
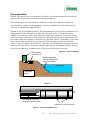
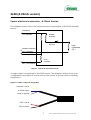
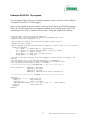
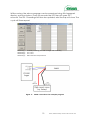
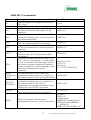
2600 & 2600S
VERSION 2.4
TURBIDITY SENSORS
2600 4-20mA INTERFACE | 2600S SDI-12 INTERFACE
www.esands.com
8 River Street Richmond VIC 3121 Australia | T + 61 3 8420 8999 | F + 61 3 8420 8900 | [email protected]
Table of Contents
Background information......................................................................................1
What is turbidity ? ..............................................................................................1
How is turbidity measured? .............................................................................1
How does the Mindata 2600 turbidity sensor work?..................................1
Figure 1. 2600 Sensor measurement principle..................................2
What is the Lens Protection Device? ............................................................2
Sensor description .................................................................................................3
Figure 2. 2600 dimensions .....................................................................3
Installation...............................................................................................................4
Site Selection ......................................................................................................4
Sensor installation ..............................................................................................5
Figure 3. Sensor orientation ....................................................................5
Sensor clearance ..............................................................................................5
Figure 4 Sensor clearance ....................................................................5
Site preparation .................................................................................................6
Figure 6. Sensor installation tube ...........................................................6
2600 (4-20mA version) ..........................................................................................7
Sensor electrical connection – 4-20mA Version .........................................7
Figure 7. Electrical equivalent circuit ...................................................7
Figure 8. Cable conductor designation ..............................................7
4-20mA 2600 Operation...................................................................................8
2600S (SDI-12 version) ...........................................................................................9
Sensor electrical connection – SDI-12 Version ............................................9
Figure 9. Standard 4-20mA version (top) and SDI-12 version
(bottom) ......................................................................................................9
Figure 10. SDI-12 2600S Cable conductor designation ....................9
SDI-12 2600 Operation....................................................................................10
Example 2600 SDI-12 program......................................................................11
Figure 11. 2600S connections for example program.....................12
2600S SDI-12 commands................................................................................13
Maintenance .......................................................................................................14
General..............................................................................................................14
Lens inspection and maintenance .............................................................14
LPD sponge inspection and maintenance ...............................................14
Calibration check ...........................................................................................14
Specifications.......................................................................................................15
Ordering information..........................................................................................17
Contact Details....................................................................................................17
Mindata’s Quality Assurance Statement
ISO9001 accreditation
ES&S is currently an AS/NZS ISO9001:2008 certified organisation.
This certification is evidence that sound practices are used to get high
quality instrumentation to your organization within a reasonable time
interval. Standard practices are used for all areas of manufacture,
beginning with the efficient procurement of incoming orders, right
through to shipment.
Stringent quality assurance procedures are applied to all aspects of
manufacturing, including the calibration of scientific instruments
against NATA traceable references. Every sensor is accompanied by a
test and calibration certificate that can be used as reference
information as well as evidence of sensor accuracy.
Terms of Warranty
The warranty period for any new instrumentation shipped from ES&S is
12 months from the shipment date. This warranty ensures the
instrumentation will operate and continue to operate for a period of
one year from the purchase date, according to specifications and
expectations.
The warranty covers part or complete replacement, repair or
substitution of new instrumentation that has failed in part or completely
within the warranty period. While every effort has been made to supply
robust and user friendly instrumentation, the warranty does not cover
instruments incorrectly installed, misused or operated in conditions
outside those specified. The warranty does not cover shipment costs for
instrumentation, installation or removal and, under no circumstances
whatsoever, indirect or consequential losses caused by the failed
instrumentation.
ES&S believes the warranty conditions to be fair and just and in
accordance with standard business practices worldwide. ES&S reserves
the right to arbitrate any warranty issues and will ensure that warranty
issues are treated with the highest standards of professional conduct.
At ES&S we believe your investment in our products and services is a
good decision and we will therefore ensure all your requirements are
met at all times, both now and in the future.
Background information
What is turbidity ?
Turbidity is the lack of clarity of a liquid. It is the degree of cloudiness that
prevents objects to be defined at a particular distance, under the liquid
surface and it is very similar to the way fog, mist or pollution affects visibility in
air. For example, consider standing at the edge of a pier, looking straight
down into the water of a lake. If the water is clear, you will be able to see the
bottom and objects lying on it quite sharply. However, during periods of high
inflows from rivers feeding the lake, a substantial amount of eroded soil will
enter the lake and make the water cloudy enough so that objects on the
bottom cannot be defined or the bottom will disappear completely. This is
turbid water.
How is turbidity measured?
The simplest way to measure turbidity is to visually determine the liquid clarity
using a special measuring cylinder with a white cross at the bottom. When the
tube is filled with turbid water, the cross will eventually “disappear” or it will
become impossible to define. At this point the turbidity can be roughly
determined using the calibrated graduations on the side of the tube. This
method to measure water “visibility” is still commonly used by environmental
scientists and educational organisations. It has low accuracy but is quick and
simple and will give a good indication of turbidity.
Turbidity can be measured electronically using opto-electronic devices. Infrared light is reflected off suspended solids and the reflected light is received by
sensors, located close to the source. By comparing the source and received
light intensity, an electronic sensor is able to determine the turbidity
concentration and output the measurement as a calibrated electrical signal.
How does the Mindata 2600 turbidity sensor work?
The 2600 turbidity sensor uses an optical backscatter technique to measure
turbidity in liquids. An infra-red light source (S) transmits a cone of light into the
liquid. Suspended solids in front of the sensor will reflect some of the light back
towards the sensor detectors (D). As turbidity increases, the amount of
reflected light also increases and hence a proportional measurement can be
made by comparing the light intensity transmitted with that received. The
sensor is calibrated to measure a range of turbid solutions and, after signal
processing, converted into an output signal which can be read and
processed by a data logger.
There are two types of 2600 – a 4-20mA output version, and an SDI-12 version
(2600S).
1
2600 / 2600S Turbidity Sensor User Manual V2.4
D
S
D
Figure 1.
2600 Sensor measurement principle
The above diagram shows how the sensor works. IR light coming from the
source (S) is shone into the liquid. Some of this light will be reflected at close to
180° and received by the detectors (D). The received light is shown in red.
Some of the light is scattered at different angles and lost, while some of it is
reflected several times.
What is the Lens Protection Device?
Lens fouling is an issue that plagues all optical measurement devices that are
exposed to harsh environmental conditions. Typically, an electronic turbidity
sensor is required to operate in remote locations and visited after long
periods. During this time the lens may become contaminated with silt, algae
and other substance that will reduce the light source output and detector
sensitivity. Source light will also reflect off the contamination material. As a
result, a contaminated lens will cause erroneous measurements.
ES&S have developed a unique method of ensuring the lens remains free of
contamination for long periods. Rather than cleaning the lens regularly the
Lens Protection Device (LPD) will keep the lens clean in the first place. The LPD
is a cover that protects the lens by covering it with a soft rubber sponge
during idle periods. When a reading is required, the sensor is powered using
switched 12 volts and the LPD will uncover the sensor lens. After 1 second, the
sensor output will be ready for reading by a controller such as a data logger.
When the controller has taken a reading, the power is removed from the
sensor and the LPD will once again protect the lens from contamination. In a
typical hydrographic system where a reading is required at 15 minute intervals
(for example), the lens is exposed to water for only 8 seconds every hour (just
over 0.2% duty cycle).
2
2600 / 2600S Turbidity Sensor User Manual V2.4
Sensor description
Figure 2.
Sensor dimensions
LPD cover
8 mm
20 mm
262 mm
Figure 2.
56 mm
2600 dimensions
The 2600 turbidity sensor is a fully self -contained optical backscatter sensor,
with processing and output module and integrated lens protection device. It
is constructed from durable machined plastic components, titanium metal
and epoxy resins. A neoprene sponge is used to protect the lens from
contamination that can be easily replaced if it is found to have deteriorated.
The sensor is of round construction as shown above.
An 8mm diameter submersible rated cable is hardwired to the back of the
sensor (length specified during ordering). Although care must be taken to
secure the sensor at all times, the sensor may be suspended from the cable.
Once installed, the sensor will measure turbidity from zero to full scale, as
indicated on the sensor body in Nepheleometric Turbidity Units (NTU). During
factory calibration, the sensor output is adjusted so that 4 mA out represents
zero NTU and 20 mA represents full scale.
The dry end of the cable has a splice fitted that allows connection of a
separate 12v dc supply for powering the LPD circuitry. The other side of the
splice has three wires for supply, ground and current output signal. A
connector can be fitted for direct connection to ES&S equipment (such as
the 3500 logger) or custom connectors can be fitted upon request.
Once a 12 volt supply has been fitted to the LPD power terminals and
switched 12 volts is applied, the LPD cover will open automatically before the
turbidity sensor will measure suspended solids and output a corresponding 420mA signal. Removing power from the switched 12 volt supply will cause the
LPD cover to close over the top of the sensor lens and switch off the sensor.
During the next 6 seconds the LPD circuitry will recharge with power from the
separate 12 volt dc supply until the current draw is very close to zero.
3
2600 / 2600S Turbidity Sensor User Manual V2.4
Installation
Site Selection
Before installing a 2600 turbidity sensor it is recommended a suitable site is
selected first. The installation and maintenance complexity as well as the
reliability of the instrument in critical applications depends on the site chosen.
Well chosen sites:
- slow flowing water (no stratification)
- minimal or no accumulation of debris around sensor
- easy and safe access, away from waterway traffic
- sensor lens is always submerged in at least 200mm of water
- sensor lens is at least 400mm from bottom (down looking) or 200 mm
from bottom (across looking).
- sensor cannot be dislodged during high flows
Avoid sites with:
- very high water flows
- where debris can accumulate around sensor
- excessive air bubbles in water
- difficult or unsafe access
- high siltation rates
- where sensor will be exposed in air during low flows
Typically, most sites that are already equipped with hydrographic
instrumentation can be used for installation of the turbidity sensor.
4
2600 / 2600S Turbidity Sensor User Manual V2.4
Sensor installation
The 2600 sensor can either be installed horizontally, vertically or at an angle.
Please see the diagrams below for correct orientation. The flow of water
should be side on to the lens cover.
Figure 3. Sensor orientation
The correct orientation of the sensor reduces the build-up of silt and debris
around the head area. Where algae is a problem, it is recommended the
sensor is mounted vertically down looking or covered with a light shield,
keeping the sensor in the shade. When installing a shield, ensure the shield
does interfere with the light path. It should ideally be placed no less than
200mm from the sensor.
Sensor clearance
Because the turbidity sensor measures light reflected off suspended particles
in liquids, care must be taken to ensure there are no other particles or
structures that would cause incorrect measurement. The sensor IR emitter will
emit a cone of light into the liquid. The diagram below shows the
recommended limits (or clearance) required for the sensor to measure
correctly. If obstructions are present in the measurement area, the sensor
accuracy will be affected.
200 mm
400
mm
Figure 4
Sensor clearance
5
2600 / 2600S Turbidity Sensor User Manual V2.4
Site preparation
Before the sensor can be installed, the site must be prepared to ensure the
sensor will be secured, protected and serviceable.
The following recommendation is based on typical installation methods
practiced by today’s hydrographers. Several variations of this method are
used to suit particular applications.
Please study the diagram below. Site preparation involves the installation of a
larger plastic tube along the waterway bank as shown. The tube should
ideally be continuous but may also be made from sections. One end of the
tube must be installed into the water ensuring the sensor optical path will not
be obstructed according to the previous section Sensor Clearance. The other
end can be terminated in a junction pit that is large enough so that the
sensor can be inserted from the pit. Typically, an underground electrical pit is
used as this also allows a sensor carrier assembly to be inserted easily. The pit
must be installed on a stable part of the bank that cannot erode.
Figure 5. Sensor installation
Site shelter
Junction pit
Sensor tube with
sensor installed at
end. See detail.
waterway
A
waterway
bank
Detail A
Guide tube. Sensor is
strapped to side of tube.
Cable tie or similar devices
Figure 6. Sensor installation tube
6
2600 / 2600S Turbidity Sensor User Manual V2.4
2600 (4-20mA version)
Sensor electrical connection – 4-20mA Version
The diagram below shows the electrical circuit equivalent of the 2600 turbidity
sensor.
Switched
sensor
circuitry
+12 volts dc
mA out
current source
sensor common
load
resistance
(RL )
ext. common
LPD
circuitry
ext. +12 volts dc
Figure 7. Electrical equivalent circuit
A single cable is hardwired to the 2600 sensor. The diagram below shows the
configuration and typical connection of the sensor to power and controlling
equipment.
Figure 8. Cable conductor designation
switched +12Vdc
4-20mA output
common ground
LPD +12Vdc
LPD common
7
2600 / 2600S Turbidity Sensor User Manual V2.4
Conductor
colour, type
Yellow
blue
White
red (large)
black (large)
Conductor
designation
switched +12vdc
input
4-20mA output
or SDI-12
sensor common
+12vdc input, LPD
common, LPD
Requirements
> 80mA
source, max
600! load
ground for sensor
>2A
ground for LPD
Mindata
3 pin plug
A
Mindata
5 pin plug
A
B
B
C
C
D
E
4-20mA 2600 Operation
To obtain a 4-20mA measurement from the sensor:
Install the sensor according to recommendations in Section Installation.
Apply continuous +12 vdc to the LPD supply wires (Figure 8.)
Apply switched 12vdc to the sensor wires (figure 8.)
Read the 4-20mA current output
Remove the switched 12vdc to close the LPD cover and turn off the sensor
A current output signal will be available for measurement after 1 second. You
may read the sensor continuously for up to 30 seconds before it must be
switched off and wait for 15 minutes. Prolonged measurement will otherwise
cause sensor self- heating and, consequently, inaccurate measurements.
You must wait for 6 seconds to allow the LPD time to recharge before taking
another measurement.
The 4-20mA current output will be available for reading 1 second after
switched power is applied.
Once a reading has been taken, removing switched +12vdc will cause the
LPD cover to close and protect the sensor lens from fouling until the next
reading is required. Typically, if a reading is required every 15 minutes, the lens
exposure will only be less than 0.2% of the total installation time.
With proper care and routine maintenance, the sensor can be left operating
unattended for up to 3 months (assuming 1 second reading time). Of course,
as each application will be different, it is recommended that the total time
between services is determined experimentally.
8
2600 / 2600S Turbidity Sensor User Manual V2.4
2600S (SDI-12 version)
Sensor electrical connection – SDI-12 Version
The SDI-12 version of the 2600 (2600S) operates in a similar manner to the 420mA version. The difference is the addition of an SDI-12 interface inside the
body of the sensor, as shown below.
Figure 9. Standard 4-20mA version (top) and SDI-12 version (bottom)
switched +12Vdc (yellow)
SDI-12 (blue)
common ground (white)
LPD +12Vdc (thick red)
LPD common (thick black)
Figure 10. SDI-12 2600S Cable conductor designation
9
2600 / 2600S Turbidity Sensor User Manual V2.4
Conductor colour, type
yellow
blue
white
red (thick)
black (thick)
Conductor designation
switched +12vdc input
SDI-12
sensor common
+12vdc input, LPD
common, LPD
Requirements
> 80mA
SDI-12 V1.3
ground for sensor
>2A
ground for LPD
SDI-12 2600 Operation
To obtain a measurement from the 2600S SDI-12 sensor:
-
Install the sensor according to recommendations in Section Installation.
Apply continuous +12 vdc to the LPD supply wires (Figure 9.).
Apply switched 12vdc to the sensor wires (figure 9.).
Read the SDI-12.
Remove the switched 12vdc to close the LPD cover and turn off the
sensor.
See the next section for an example program showing the reading of the
2600S with a CR1000 logger.
The SDI-12 data will be available for measurement after 1 second. You may
read the sensor continuously for up to 30 seconds before it must be switched
off and wait for 15 minutes. Prolonged measurement will otherwise cause
sensor self- heating and, consequently, inaccurate measurements.
You must wait for 6 seconds to allow the LPD time to recharge before taking
another measurement.
Once a reading has been taken, removing switched +12vdc will cause the
LPD cover to close and protect the sensor lens from fouling until the next
reading is required. Typically, if a reading is required every 15 minutes, the lens
exposure will only be less than 0.2% of the total installation time.
With proper care and routine maintenance, the sensor can be left operating
unattended for up to 3 months (assuming 1 second reading time). Of course,
as each application will be different, it is recommended that the total time
between services is determined experimentally.
10
2600 / 2600S Turbidity Sensor User Manual V2.4
Example 2600 SDI-12 program
The example below shows a sample program which can be used with the
Campbell Scientific Cr1000 logger.
Wire up the 2600S as shown below, and use the following CR1000 program.
Refer to CR1000 manual for program loading and running instructions. The
updating of the SDI-12 values can be seen using the diagnostic display.
'Program name: Cr1000 2600 display demo.CR1
'Date written: 2/11/2009 using the CRBasic programming tool from
'Campbell Scientific LoggerNet 3.4.1
'This program is used to test the 2600 Turbidity sensor using a
'Campbells CR1000 logger.
'Sensor powered from 12V terminal and a G terminal, and with SDI-12 'on C1 erminal.
' Logger connections
'
C1----blue-------Sensor SDI-12 (input/output)
'
12V --yellow-----Sensor on/Flap enable (output to 2600S)
'
G ----white------Sensor Ground
'
Thick Red--------Flap +12V (2A flap current)
'
Thick Black------Flap GND
'Use one of the Data Displays from the loggerNet Connect Screen to display 'the
results.
'Set the table cells to be labelled sdidata(1) to sdidata(4).
'The information from each of the four channels of the SDI-12 2600
'will be displayed and updated every 20 seconds.
'\\\\\\\\\\\\\\\\\\\\\\\\\ DECLARATIONS /////////////////////////
Public sdidata(4)
'sdidata(1)
'sdidata(2)
'sdidata(3)
'sdidata(4)
Turbidity
not used
not used
temperature of SDI12 interface up
'\\\\\\\\\\\\\\\\\\\\\\\\\\\ PROGRAM ////////////////////////////
BeginProg
Scan(20,Sec, 3, 0)
'Scan every 20s
SW12(1)
'Open LPD flap
Delay(0,7,2)
'Delay 7 seconds
SDI12Recorder(sdidata, 1, "0", "M!", 1.000, 0)
SW12(0)
'Close LPD flap
NextScan
EndProg
11
' Take reading
2600 / 2600S Turbidity Sensor User Manual V2.4
While running, the above program can be examined using the Loggernet
display, as shown below. Every 20 seconds the LPD flap will open for 7
seconds. The SDI-12 readings will then be updated, and the flap will close. The
cycle will then repeat.
sdidata(1):
sdidata(2):
sdidata(3):
sdidata(4):
Turbidity reading (This will change with turbidity)
not used
not used
SDI interface temperature
Figure 11. 2600S connections for example program
12
2600 / 2600S Turbidity Sensor User Manual V2.4
2600S SDI-12 commands
Command
?!
0!
0V!
0M!
0MC!
0C!
0CC!
0D0!
0XSET
VAR[m,p]=
VAL!
0XLOAD
VAR[M,N]!
0XGET!
0XER!
Description
Returns address of a single sensor on the
SDI-12 bus
Ping, returns same address
Verify command. Subsequent 0D0!
command will return the version of the
Interface
Begin a measurement. Subsequent 0D0!
command will return the 3 measurements
and the temperature.
Begin a measurement and respond with
CRC on subsequent 0D0! command.
Begin a concurrent measurement. (Same
as 0M! command but no service request
is issued.)
Begin a concurrent measurement and
respond with CRC on subsequent 0D0!
command.
Get data is called after a 0M!, 0MC!, 0C!,
0CC!, and 0V! commands. If called after
the 0V command then the single result is
the version number, otherwise it returns 4
results, namely the 3 sensor voltages, and
the internal temperature of the
interface.
Set and store one of the calibration
coefficients indexed by m,p, where m is
the measurement, and n is the parameter
Retrieve and store the calibration
coefficients indexed by m,p, where m is
the measurement, and n is the
parameter, to a string buffer ready to be
retrieved by the 0XGET command.
Retrieve the string buffer that was filled
from the previous 0XLOAD command
Retrieve a string for the last error
generated by the use of an X command.
13
Typical Response
"0\r\n"
"0\r\n"
"00001\r\n"
"00034\r\n"
"00034\r\n"
"00034\r\n"
"00034\r\n"
Response to 0V!
"0+2.0\r\n" ,
Otherwise:
"0+1.1+2.2+3.3+25.0\r\n"
"0XACK\r\n"
"0XACK\r\n"
"0X +1.1\r\n"
If no error:
"0XOK\r\n"
Possible errors:
"0XER BAD COMMAND\r\n"
"0XER BAD MEASUREMENT
INDEX\r\n"
"0XER BAD COEF INDEX\r\n"
2600 / 2600S Turbidity Sensor User Manual V2.4
Maintenance
The 2600 sensor will require little periodic maintenance to ensure that
measurements remain accurate. It is recommended the sensor is checked
during every visit, or at least every 3 months. You may find the sensor will not
require any maintenance for even longer periods
General
Ensure the sensor and LPD operation is not affected by debris. This may
involve removing the sensor from its installation for a thorough inspection.
Ensure the installation is sound and the sensor is still secure from moving and
there are no obvious signs of erosion or damage.
Lens inspection and maintenance
remove the sensor from its installation and manually open the LPD cover.
check the lens for pitting, scoring and contamination.
if required, clean the lens with a cloth and water with a little detergent added
until all debris has been removed. The lens should be smooth and polished. If
the lens is pitted or scored, check the sensor calibration and determine the
source of mechanical damage to the lens.
If the calibration has been affected and the lens is damaged by abrasion, the
sensor will need to be returned to ES&S for service.
LPD sponge inspection and maintenance
check the LPD cover sponge for deterioration. Replace of necessary.
To replace, remove the old sponge and allow the cover to dry.
The sponges have an adhesive backing on one side. Remove the backing
and place it into the inside area of the LPD cover.
Release the cover and ensure the sponge completely covers the lens.
Calibration check
The sensor output can be checked against a reference instrument if it is
available. Ideally, the measurement should be taken in the same solution as
the sensor while the sensor is installed. If there is a large difference, an
installation problem may be highlighted. All sensor measurements should be
within the specified accuracy.
Please note that the 2600 sensor accuracy is +/- 3% of full scale. For example,
if the sensor has a range of 0 to 1,000 NTU, any readings over the whole range
will be within +/- 30 NTU. If discrepancies are found, also ensure a calibration
check is made on the instrument that reads the sensor output. If the sensor is
not installed and it is possible to use reference solutions, ensure there is at least
the recommended clearance around the sensor head.
14
2600 / 2600S Turbidity Sensor User Manual V2.4
Specifications
Range
Standard choice of 0 to 100, 250, 500, 1000 and 2000 NTU.
Other ranges are available.
Accuracy
Linearity < 3% of full scale
Temperature < 0.05%/ °C of FS over the range 0 to 30 °C.
Temperature
range
storage: -10 to 60 °C
operating: 0 to 30 °C
Zero &
Full Scale Setting +/- 0.1% of full scale setting
Response Time
2 seconds to full accuracy
Type
180° optical backscatter, 880nm
Output
Scaled to maximum range.
2600 Analogue
4-20mA current
2600S SDI-12
4-20
Example for 2000 NTU probe:
2000
1800
1600
turbidity (NTU)
1400
1200
1000
800
600
400
200
0
4
5
6
7
8
9
10 11 12 13 14 15 16 17 18 19 20
4-20mA or SDI-12 value
In general, the transfer function is:
Turbidity = Tm(R-4)/16 NTU, where Tm = Max range, R = reading
So, for Tm = 2000NTU: Turbidity = 125(R-4) NTU
15
2600 / 2600S Turbidity Sensor User Manual V2.4
4-20mA Resolution
infinite
Power Supply
10-15 V unregulated, current capability >500mA
0.3mAh per reading on average (typical)
Surge Protection
Secondary surge protection.
Can absorb 0.6J of energy
Dimensions
262mm long, 56 mm diameter
Weight
Sensor only:
with 10m cable:
16
0.73 kg
1.45 kg
2600 / 2600S Turbidity Sensor User Manual V2.4
Ordering information
Item description
code
Turbidity sensor with integral LPD
2600
Cable, hardwired to sensor, with “V” splice, meters
2610
Connector, 3 pin male plug fitted to 2601 cable
with “V” splice for battery connection
2612
Connector, 5 pin male plug fitted to 2601 cable
2613
Extension cable with 5 pin male plug and 5 pin female jack, meters
2614
Lens Protection Device replacement cover pads, set of 5
2620
Battery, 7Ah SLA, 12 volts
3302
Contact Details
Environmental Systems & Services Pty. Ltd.
Address:
8 River Street
Richmond, Victoria, 3121
Australia
Phone:
Fax:
03 8420 8999
03 8420 8900
Int’l phone:
Int’l fax:
+61 3 8420 8999
+61 3 8420 8900
email:
web:
[email protected]
www.esands.com
Please contact us for sales or technical support.
REV
1.00
2.3
2.4
BY/DATE
29/10/2001
2/11/2009
8/06/2010
DESCRIPTION
release
Add SDI-12, reformatting
Modified sample program, re-formatting
17
AUTHOR
TG
GQ
AP
2600 / 2600S Turbidity Sensor User Manual V2.4
1500 Electrical Conductivity Sensor
The ES&S 1500 Sensor is designed for measuring electrical
conductivity of liquids at remote locations. It is suited to low
power water quality applications where access is limited.
Little maintenance ensures years of accurate data collection
without recalibration and deterioration of metals. The 1500
is NOW AVAILABLE with SDI-12.
LevelPro 6100
The LevelPro 6100 advanced liquid level sensor is used to
measure water level determination 0-70 metres. Applications
include river / irrigation water level, tidal monitoring,
groundwater level & landfill monitoring, dam, tank, reservoir
levels, waste water monitoring, food warning systems,
process industry liquid level.
PumpPro 6150
The PumpPro 6150 combines an integrated air compressor
module and levelpro 6100 advanced liquid level sensor to
form a fully self contained hydrostatic pressure sensor
designed to measure water and liquid levels reliably and
accurately.
Dipmeter
The Water Level Indicators Dipmeters are typically used to
measure the depth of water levels in boreholes, standpipes
or observation wells.
environmental systems & services | 8 River Street Richmond Victoria 3121 AUSTRALIA
T +61 3 8420 8999 | F +61 3 8420 8900 | [email protected] | www.esands.com