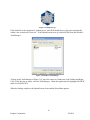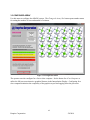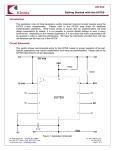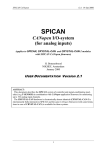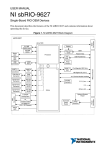
1
Anemometer Data
Acquisition and
Display Suite
Emprise Corporation
Software User’s Manual
!
Version: 6.5.0
Issued on May 8, 2014
3900 Kennesaw 75 Parkway
Suite 125
Kennesaw, GA 30144-6430
(770) 425-1420 (phone)
(770) 425-1425 (fax)
Anemometer Data Acquisition and Display Suite
THIS PAGE LEFT BLANK INTENTIONALLY
Emprise Corporation
Software User’s Manual
Table of Contents
TECHNICAL SUPPORT ...............................................................................................................iii
1. GENERAL..............................................................................................................................................i
2. OVERVIEW OF DESIGN......................................................................................................................i
3. USER INTERFACE SOFTWARE .........................................................................................................i
3.1.SPLASH SCREEN .................................................................................................................................i
3.2.MAIN MENU .......................................................................................................................................iv
3.3.CONFIGURE ARRAY ........................................................................................................................vii
3.3.1.CALIBRATION MENU ....................................................................................................................xi
3.4.INTERPOLATION DISPLAY ...........................................................................................................xiii
3.5.BAR GRAPH DISPLAY .....................................................................................................................xx
3.6.STRIP CHART DISPLAY ..................................................................................................................xxi
3.7.HARD DRIVE STORAGE UTILITY...............................................................................................xxii
3.8.DATALOG PLAYER.........................................................................................................................xxv
3.9.CONFIGURE TCP/IP ADDRESSING..............................................................................................xxx
4. SYSTEM LEVEL SOFTWARE .....................................................................................................xxxiv
4.1.DATALOG AND DATALOGGER .................................................................................................xxxiv
Table of Figures
Figure 3.11 Emprise ADADS Icon ..............................................................................................................1
Figure 3.12 Splash Screen ...........................................................................................................................2
Figure 3.13 Emprise Logo ...........................................................................................................................2
Figure 3.14 Windows Task Manager ...........................................................................................................3
Figure 3.21 IP Configuration Warning ........................................................................................................4
Figure 3.22 Main Menu ...............................................................................................................................5
Figure 3.31 Configuration Menu .................................................................................................................7
Figure 3.32 Select Array Size Menu ............................................................................................................8
Figure 3.33 Computer Speed Selector .........................................................................................................8
Figure 3.34 Loss of Calibration Warning ....................................................................................................8
Figure 3.3.11 Calibrate Anemometer Menu...............................................................................................11
Figure 3.3.12 Slope-Intercept Calibration Equation ..................................................................................11
Figure 3.41 Anemometer Interpolation Display ........................................................................................13
Figure 3.42 Projection Toggle Switches ....................................................................................................16
Figure 3.43 Z-Axis Scale Menu.................................................................................................................17
Figure 3.44 Surface Plot Cursor ................................................................................................................18
Figure 3.45 Surface Plot Cursor ................................................................................................................19
Figure 3.51 Anemometer Bar Graph Display ............................................................................................20
Figure 3.61 Strip Chart Display .................................................................................................................21
Figure 3.71 Free Space Warning ................................................................................................................22
Figure 3.72 Root Path Full Warning ..........................................................................................................22
Figure 3.73 Hard Drive Storage Utility .....................................................................................................23
Figure 3.74 Hard Drive Storage Settings Confirmation Dialog ................................................................24
!i
Emprise Corporation
5/8/2014
Figure 3.81 Datalog File Selection Dialog ................................................................................................24
Figure 3.82 Playback Position Slider.........................................................................................................25
Figure 3.83 Data Log Viewer, Channel View ............................................................................................25
Figure 3.84 Start Position ..........................................................................................................................25
Figure 3.85 Current Position......................................................................................................................26
Figure 3.86 Excellize Spreadsheet Warning ..............................................................................................26
Figure 3.87 Spreadsheet Saved Message ...................................................................................................27
Figure 3.91 Configure TCP/IP Addressing Menu......................................................................................28
Figure 3.92 The Desired IP Settings And The Host Settings Are Incompatible Message .........................31
Figure 3.93 The Host Settings Are Incompatible Message .......................................................................31
Figure 3.94 The Desired IP Settings Are Incompatible Message ..............................................................31
Figure 4.11 Datalog Comment Dialog .......................................................................................................32
!ii
Emprise Corporation
5/8/2014
Please read this entire manual before attempting to install or operate the
Equipment. The customer maintains the responsibility of continued operator
training regarding safe equipment operation. Review operational safety guidelines
and maintenance precautions with new operators and maintenance personnel for
comprehension.
New operators must read this manual before operating the equipment. All maintenance technicians must
read sections relating to safe operation and maintenance before working on the equipment. Read the
manufacturer’s manuals for safe use and operation information about each procured subcomponent.
TECHNICAL SUPPORT
Technical support for all Emprise supplied hardware and software is available via phone or fax,
Monday through Friday between 8:00 AM and 5:00 PM, Eastern Time.
Phone: (770)425-1420
Fax: (770)425-1425
!iii
Emprise Corporation
5/8/2014
THIS PAGE LEFT BLANK INTENTIONALLY
!iv
Emprise Corporation
5/8/2014
1. GENERAL
The sequence of sections in this manual correlates to the order of appearance of the control screens.
Generally, for each control screen, descriptions of individual buttons and displays proceed from the top
down for convenience. There are a few conventions used in this manual:
• Italicized text is the name of an on-screen button.
• The words ON and OFF in all capital letters represent switch or relay conditions.
• The words Left-Click and Double-Click instruct the operator to press the left mouse button when
the cursor is over an onscreen button, or highlight a data entry field.
• The words Right-Click instructs the operator to press the right mouse button when the cursor is
over a particular location, usually to bring up a pop-up menu.
• An exclamation icon followed by bold face type is a warning about possible dangers associated
with the section to follow. Pay especially close attention to all warning messages.
2. OVERVIEW OF DESIGN
The Emprise Corporation equipment consists of a number of anemometers, anemometer wiring
harnesses, analog output wiring harnesses, and a communications nexus that links the anemometers to
the computer. The anemometer wiring harnesses branch into individual numbered Molex connectors for
each anemometer. The operator should configure the array of anemometers such that the connectors
proceed from left to right and top to bottom. Later sections explain this in more detail. The signalconditioning box contains a National Instruments sbRIO-9602. This device contains an integrated 2M
gate FPGA and Real Time operation system that functions with or without a computer connected via
Ethernet. The FPGA component calculates frequency at over 10 kHz. The RT portion communicates
the frequency data back to the computer at a rate of roughly 20 Hz. Anemometer frequencies below 1 Hz
are cutoff to zero.
3. USER INTERFACE SOFTWARE
There are two categories of software in this package, User Interface, and System Level routines. The
User Interface routines display data, and contain menus for the configuration of various parameters. The
System Level routines operate in the background, hidden from the operator. The following sections
describe how to use the User Interface software for control, data acquisition, and display by explaining
the functions in each window.
3.1.SPLASH SCREEN
The Splash Screen is the main start-up routine. To start the Anemometer Data Acquisition and Display
Suite (ADADS) software, move the mouse cursor over the Emprise ADADS Icon on the desktop and
Left-Double-Click.
!
Figure 3.11 Emprise ADADS Icon
!i
Emprise Corporation
5/8/2014
The Splash Screen loads all relevant files into memory and starts the routines that need to run “behind
the scenes.” This process normally takes a few seconds. A progress bar cycles at the bottom until the
load is complete. The progress bar will stutter and pause intermittently, this is normal.
!
Figure 3.12 Splash Screen
A small Emprise logo appears in the lower right-hand corner of the screen and remains there while the
data acquisition software runs. The operator cannot move this logo or interact with it in any way. This
routine prevents the LabVIEW startup screen from appearing every time a menu closes.
!ii
Emprise Corporation
5/8/2014
!
Figure 3.13 Emprise Logo
If the load fails or the equipment is without power, LabVIEW should discover the error automatically
within a few seconds and “error-out.” If the Splash Screen locks up, end LabVIEW from the Windows
Task Manager.
!
Figure 3.14 Windows Task Manager
To bring up the Task Manager in Figure 3.14, move the cursor to a blank area of the Taskbar and RightClick. From the pop-up menu, select the Task Manager. Under the Application tab, highlight LabVIEW
and Left-Click End Task.
When the loading completes, the Splash Screen closes and the Main Menu appears.
!iii
Emprise Corporation
5/8/2014
3.2.MAIN MENU
After the Startup Screen finishes, the Main Menu appears in the center of the screen. When ADADS
first starts, it looks for the MAC address of the signal-conditioning box for up to 10 seconds. Upon
establishing an Ethernet connection, the menu buttons activate and the status will indicate, “…System
Active”. Before running ADADS software for the first time, configure the network card of the host
computer to be on the same subnet as the Anemometer Signal Conditioner. The initial IP settings of the
signal conditioner are:
Anemometer Signal Conditioner
IP Address: 172.16.1.254
Subnet Mask: 255.255.0.0
When connecting for the first time, we recommend setting the host computer to a static IP address and
connecting directly to the Anemometer Signal Conditioner with a crossover cable. Configure the
network card on the host computer to the following settings:
Host Computer
IP Address: 172.16.XXX.YYY
Subnet Mask: 255.255.0.0
Where XXX can be 0-254 and YYY can be 1-254. When configuring the network adapter on the PC, do
not use the same IP address as the Anemometer Signal Conditioner. Always use a crossover cable when
directly connecting the host computer to the Anemometer Signal Conditioner. Use a standard Ethernet
cable when connecting through an Ethernet hub or switch.
If the network adapter settings of the host PC are not correct, the message in Figure 3.21 will appear
after ADADS attempts to find the signal conditioner box.
!iv
Emprise Corporation
5/8/2014
!
Figure 3.21 IP Configuration Warning
!
Figure 3.22 Main Menu
The buttons are as follows:
!v
Emprise Corporation
5/8/2014
Configure Array: This opens the Configuration menu; see Section 3.3. Use this menu to
position and calibrate the anemometer array.
• Interpolation Display: This opens the Anemometer Interpolation Display. This displays the air
speed in three dimensions. The relative location of the anemometer in a rectangular array
combined with the air speed creates an interpolated representation of the air speed profile across
the array; see Section 3.4.
• Bar Graph Display: This starts the Anemometer Bar Graph Display; see Section 3.5. The air
speed measured at each anemometer appears as a bar in numerical order from left to right. There
is also a list of anemometers with the numerical speed value on the left hand side.
• Strip Chart Display: Press this to open the Strip Chart Display; see Section 3.6. The operator
selects up to ten anemometer readings to plot over time.
• Hard Drive Utility: Use this menu to change the Datalog file path, modify the hard drive capacity
alarms, and change the averaging filter on the Datalog writer; see Section 3.7.
• Data Log Player: This display plays Datalog files like video recordings of the Interpolation
Display. This display also exports all or part of the Datalog file to a tab-delineated format
viewable with Microsoft Excel; see Section 3.8.
• Configure TCP/IP: This utility switches the sbRIO between DHCP and Static IP addressing; see
Section 3.9.
• EXIT: This closes the program.
The communications status appears under the buttons. This status also appears in the other displays.
The possible messages include:
• …System Active: Communication between the Host (PC) and the sbRIO has been established
and is operating normally.
• …Network Disconnected: The network cable is not connected.
• …Looking for RT Target MAC Address: The Host is searching the network for the MAC
address of the sbRIO.
• …Waiting for RT Target: The MAC address has been found and the Host is waiting for the data
stream to begin.
• …Normal System Shut Down: The operator has halted communication.
• …Lost Connection with RT Target: An error has occurred. The system will try to re-acquire the
connection.
• …Real Time Target not found: An error has occurred. The system will try to re-acquire the
connection.
A small circular green indicator is located in the upper right hand corner of the anemometer image. This
is the Datalog Recording indicator. When the Datalog is active, it is bright green. When the Datalog is
off, it is dull green.
•
!vi
Emprise Corporation
5/8/2014
3.3.CONFIGURE ARRAY
Use this menu to configure the ADADS system. The Change the Array Size button opens another menu
for setting the number of rows and number of columns.
!
Figure 3.31 Configuration Menu
The operator can also configure for a fast or slow computer. Set the button for a Fast Computer to
utilize the full processor-intensive graphical features in the Interpolation Display. Configuring for a
slow computer minimizes the complexity of the graphics to prevent bogging down the processor.
!vii
Emprise Corporation
5/8/2014
!
Figure 3.32 Select Array Size Menu
!
OR
!
Figure 3.33 Computer Speed Selector
When the operator changes either the number of rows or the number of columns, the computer creates a
new calibration file – necessarily deleting the old calibration file. To prevent accidental deletion, the
warning in Figure 3.34 pops up. Left-Click Yes to proceed or No to return to the Configuration Menu.
!
Figure 3.34 Loss of Calibration Warning
This menu also tracks the calibration dates for the anemometers in the system. As the calibration due
date approaches, the color of the number changes to indicate the time remaining. The colors and their
meanings are as follows:
• Grey – Unconfigured anemometer.
• Green – Calibration is valid.
• Yellow – Calibration is due in a month
• Orange – Calibration is due in two weeks
• Red – Calibration is overdue.
!viii
Emprise Corporation
5/8/2014
The right side of the display shows the anemometer array as specified in the Select Array Size Menu.
The image resizes and changes shape depending on the number of rows and columns. The array in
Figure 3.31 is a four by six array. The number on each anemometer cable corresponds to the numbers
on this display. For the data acquisition routine to function correctly, the calibration data associated with
the anemometers connected to each connector must be configured in this menu. The computer cannot
determine the position of a particular anemometer in the array automatically; the operator must specify
the location of each anemometer using this display.
The polarity of the air velocity changes from positive to negative when the anemometer blades change
rotational direction. The operator can change the convention by pressing the Change Flow Direction
button. We calibrate the anemometers for positive flow when the airflow hits the blades first as opposed
to the struts first. The convention selected by this button applies to all the anemometers simultaneously.
Therefore, when mounting an array, make sure they all have the same orientation; otherwise, the airflow
will be reversed on anemometers facing opposite from each other.
There are two types of “Spike Rejecter” subroutines to ignore high frequency spikes. For signal
conditioner boxes with Analog out channels, the Spike Rejecter needs to be installed in the RT software
running on the sbRIO. This ensures that the signal reported to the analog out channels passes through
the filter as well as the data reported to the PC. When Analog output is not a consideration, the Spike
Rejecter resides in the DAQ routine of the Host software. Since the RT and the Host software operate at
different speeds, there are a few differences between the two rejecters. The Host rejecter compares the
current reported frequency to the last reported frequency every 50 ms; the RT rejecter runs every 10 ms.
When the frequency difference is greater than the spike rejection threshold, the previous value is
reported again. The default value for the Host rejecter has been set to 15 Hz/50 ms, but the operator can
change this value by selecting the number and typing in a new one. The default value for the RT rejecter
has been set to 3 Hz/10 ms. Set the value higher to reject less, or lower to reject more. The Spike
Rejecter subroutine also contains a counter to prevent an overly sensitive threshold from ignoring rapid
frequency changes for more than 10 iterations on the Host rejecter and 50 iterations on the RT rejecter.
Both counters equate to about half a second. If the threshold is too low, or the acceleration of the
anemometer is greater than the threshold, the speed will appear to be stable for about a half second and
then it will change to the actual value in a step function. If this occurs, increase the rejection threshold
value.
The FPGA routine operates at an extremely high speed (10 kHz) and measures the period using a 32-bit
number. This allows ADADS to measure very small frequency differences, but it also reports very small
amplitude noise. The operator can round off the reported air velocity using the Round Velocity selector.
The default setting is No Rounding. The options include:
• No Rounding: Reports the unaltered air velocity at maximum resolution.
• Nearest Integer: Reports the air velocity rounded to the nearest whole number (X).
• Nearest 10th: Reports the air velocity to the nearest tenth of a ft/sec or m/sec (X.X).
• Nearest 100th: Reports the air velocity to the nearest hundredth of a ft/sec or m/sec (X.XX).
• Nearest 1,000th: Reports the air velocity to the nearest thousandth of a ft/sec or m/sec (X.XXX).
!ix
Emprise Corporation
5/8/2014
Demonstration mode or “Demo Mode,” generates random air speed values to simulate data. This feature
allows the operator to test the data logging and the various displays. When receiving actual data, the
software disables this feature.
Once the operator specifies the dimensions of the array, calibration can commence. Select the position
by Left-Clicking the anemometer to bring up the calibration menu.
!x
Emprise Corporation
5/8/2014
3.3.1.CALIBRATION MENU
This menu appears when the operator selects an anemometer position from the Configuration Menu. In
this menu, the operator sets the serial number, slope, intercept, and units for the anemometer in the
selected position.
!
Figure 3.3.11 Calibrate Anemometer Menu
Each anemometer comes with a calibration sheet containing the slope and intercept for the first order
calibration equation; see Figure 3.3.12.
!Y
= mX + b
Figure 3.3.12 Slope-Intercept Calibration Equation
Where “Y” is the air speed in ft/sec, “m” is the slope, “X” is the blade speed in revolutions per second or
frequency divided by the number of blades, and “b” is the intercept. The calibration constants provide
the speed in English units so to convert into Metric units (meters/second), enter the English units from
the calibration sheet, and press the Convert button. The computer automatically converts the calibration
constants into Metric units. The operator must convert each anemometer separately. When it comes to
the units displayed on the plots, the display programs assume that if the first anemometer is Metric, then
all the anemometers are Metric. The units of the data, both logged and displayed, are a function of the
calibration constants for each channel. Converting the units of some, but not all of the anemometer
!xi
Emprise Corporation
5/8/2014
calibration constants will just create confusing results. The operator should convert on an “all-or-none”
basis.
The number of the anemometer and its row-column coordinates appear in the lower-left corner of the
display. There are two columns of values, the Stored Data and the Active Data. The Stored Data comes
from the calibration file. The Active Data is the operator entry fields. The Time and Date are automatic.
The default value for the Date, Time, and Serial Number is “<New Cal>,” this indicates that no data
exists for the channel. The Stored Date indicates the remaining time until calibration is due by changing
colors as the due date approaches. This display uses the same color sequence as the Configuration
Menu. The software uses the Counts/Rev value to convert the frequency into revolutions per second.
This value appears on the calibration sheet as,”# of Blades on Test Anemometer”. Depending on the
anemometer type, it will be either the number of blades or the number of slots in the outer blade ring.
Press Save to store the Active Data to the calibration file. Press Exit Without Saving to keep the Stored
Data.
!xii
Emprise Corporation
5/8/2014
3.4.INTERPOLATION DISPLAY
Each anemometer in the array generates a stream of data points. Think of that air speed data as a level
on the Z-Axis. The row number is the relative position on the Y-Axis.
!
Figure 3.41 Anemometer Interpolation Display
The column number is the relative position on the X-Axis. Combine the air speed with the relative
position of each anemometer on an X-Y plane and you get a surface plot.
The data from each anemometer consists of three numbers, the air speed, distance from the X-Axis, and
Distance from the Y-Axis. The actual physical distance is not important here, just the relative
positioning. The relative position of the anemometers on this display directly correlates to the positions
set in the configuration menu when the plot is oriented with the X-Axis on the bottom and the Y-Axis on
the left side. This display then takes it a step further: by interpolating between known air speeds, to
create approximate values at equidistant points on the X-Y plain. The number of interpolated points
between each real point is one less than The Interpolation Ratio. Set an Interpolation Ratio of one to
show real data only. The points are the result of a two dimensional spline interpolation calculation. The
higher the ratio, the smoother the surface plot will be. The surface plot depicts an approximation of the
flow profile through the anemometer array.
The dial to the right of the Interpolation Ratio is the Averaging Filter. This adjusts the number of
samples over time used in a running-average filter. A setting of one is no averaging, and a setting of
!xiii
Emprise Corporation
5/8/2014
twenty, for example, means that the values currently displayed are the result of averaging the last twenty
samples. The Averaging Filter does not affect data written to disk. Setting the filter to “zero”, provides
an infinite average from the moment it is set.
The Plot Style lists the methods for depicting the surface plot. Some are more processor intensive than
others are. The operator should balance the style choice for optimal processor usage, and optimal
comprehension of the data. Here is a list of the Plot Styles:
!xiv
Emprise Corporation
5/8/2014
cwLine
•
cwHiddenLine
•
!
!
cwPoint
•
cwSurface
•
!
!
cwLinePoint
•
cwSurfaceLine
•
!
!
!xv
Emprise Corporation
5/8/2014
cwSurfaceNormal
•
cwSurfaceContour
•
!
!
cwContourLine
•
!
The Color Map Style is a list of the available shading colors for the surface plot. The surface plot can
combine any Plot Style with any Color Map Style. For expedience, the following list shows the Color
Map Styles applied to the cwSurfaceLine Plot Style:
cwNone
•
cwShaded
•
!
!
!xvi
Emprise Corporation
5/8/2014
cwColorSpectrum
•
cwGrayScale
•
!
!
Under the style selectors is a series of buttons. The first three buttons project the plot onto the axes. The
fourth button toggles the 3D-projection on and off. Figure 3.42 shows all three plane-projections on and
the 3D-projection off.
!
!xvii
Emprise Corporation
5/8/2014
Figure 3.42 Projection Toggle Switches
To change the scale on the Z-Axis, press the Change Scale button. On the Change Scale Menu (see
Figure 3.43), edit the range to Suite the data and press Accept.
!
Figure 3.43 Z-Axis Scale Menu
The Cursor allows the operator to read the airspeed at any point on the surface plot. The Cursor snaps to
real and interpolated points. The Cursor projects a gray plane on the Z-Axis that is parallel with the X-Y
plane. The Cursor also projects a blue dot-dash line for each axis. There are three values in parentheses
next to the Cursor (X,Y,Z). The first two, X and Y are relative numbers based on the total number of
anemometers and the Interpolation ratio. The last value is the air speed. The X-Axis values are like
column numbers and the Y-Axis values are like row number. These values are opposite from the actual
wiring harness designations and become confusing and difficult to relate at higher Interpolation Ratios.
It is best to ignore these values. The only important number is the third one – the air speed.
The following is the explanation of the X-Y values. Skip this paragraph if you are already confused.
The number of columns on the X-Axis is the number of anemometer columns minus one times the
Interpolation ratio. The number of rows on the Y-Axis is the number of anemometers rows minus one
times the Interpolation Ratio. The Anemometer Configuration Menu shows the anemometers listed
from left to right and then top to bottom. This display shows the X-Values from right to left and the YValues from top to bottom where the upper right is 0,0. For example, if the Array is five by five and the
Interpolation Ratio is one, the Cursor values for the anemometer in the upper left corner is (4,0,<Air
Speed>). This is the anemometer designated as one in the configuration menu, and designated as
“Ano1” on the wiring harness. The Cursor values for the anemometer in the lower left corner is
(4,4,<Air Speed>). This is the anemometer designated as 21 in the configuration menu, and designated
at “Ano 21” on the wiring harness. Now take same example with an interpolation ratio of four. The
lower left corner is now (16,16,<Air Speed>).
!xviii
Emprise Corporation
5/8/2014
!
Figure 3.44 Surface Plot Cursor
The next button, Pause/Update Graph, does as the name implies, the plot pauses, but the Datalog is
unaffected. The Cursor is easier to move and place when the graph is paused.
If the anemometer array is in a duct, the flow at the duct walls is, by definition, zero. The Simulate
Ducted Flow button adds a perimeter of zero values to simulate the flow profile in a duct. The Cursor
X-Y values all move over by one because of the extra row and column on each side.
!xix
Emprise Corporation
5/8/2014
!
Figure 3.45 Surface Plot Cursor
The Record Datalog button starts and stops the data log recorder. For more information on the Datalog
and Datalogger, see Section 4.1.
3.5.BAR GRAPH DISPLAY
The data for each anemometer appears as a numbered bar. The Y-Axis is the air speed, and the X-Axis
is the number of the anemometer as designated in the Configuration Menu. The value of each
anemometer also appears in a list next to its serial number and connector number. The Averaging Filter
adjusts the number of samples over time used in a running-average filter. A setting of one is no
averaging, and a setting of twenty, for example, means that the values currently displayed are the result
of averaging the last twenty samples. The Averaging Filter does not affect data written to disk, to
change the Datalog rate, which does apply an averaging filter to the data written to disk, see Section 3.7.
!xx
Emprise Corporation
5/8/2014
To change the scale on the Y-Axis, press the Change Scale button. On the Change Scale Menu, edit the
range to Suite the data and press Accept. The Change Scale Menu is the same for all display screens; see
Figure 3.43.
The next button, Pause/Update Graph, does as the name implies, the plot pauses, but the Datalog is
unaffected.
The Record Datalog button starts and stops the data log recorder. For more information on the Datalog
and Datalogger, see Section 4.1.
!
Figure 3.51 Anemometer Bar Graph Display
3.6.STRIP CHART DISPLAY
This chart displays up to ten plots of data from any channel in the system. In addition, the operator can
select <No Channel>, which will eliminate that plot from the chart. Initially, the scales on the vertical
axis are set to the scale configured in one of the other displays. The operator can assign each plot to
either the left or the right vertical axis.
The operator can turn on the auto-scaling feature by placing a “check” in the Autoscale box under each
vertical axis. After auto-scaling is off, the operator can modify the vertical scale manually by DoubleClicking on the number at the top and bottom of the scale to edit the values.
!xxi
Emprise Corporation
5/8/2014
This routine remembers the channel configuration when closed. Therefore, once the operator assigns a
channel to a plot color, it will retain that configuration the next time the live data chart runs.
!
Figure 3.61 Strip Chart Display
To assign a channel to a plot color, left-click on a colored button to display the channel list. Next, move
the cursor over the list and use the mouse roller or scroll bar to cycle down to the desired channel. To
select the channel, Left-Click on it and the list will close and the button will display the name of the
selected channel
The Record Datalog button starts and stops the data log recorder. For more information on the Datalog
and Datalogger, see Section 4.1.
The Averaging Filter adjusts the number of samples over time used in a running-average filter. A setting
of one is no averaging, and a setting of twenty, for example means that the values currently displayed are
the result of averaging the last twenty samples. The Averaging Filter does not affect data written to disk.
3.7.HARD DRIVE STORAGE UTILITY
This utility allows the operator to choose the location for data log file storage, set the rate of recording,
and set the free space alarm levels. The operator controls are as follows:
!xxii
Emprise Corporation
5/8/2014
•
!
•
!
This routine automatically looks for all hard drives
connected to the system and provides the list in the form of this pull-down menu. Left-Click to
open this menu, then select a drive letter and Left-Click again.
Once the amount of free space drops below the percentage of total space set
here, the Main Menu will warn the operator each time the menu opens.
!
Figure 3.71 Free Space Warning
!
Once the amount of free space drops below the percentage of total space set
here, the Main Menu will warn the operator each time the menu opens and prevent the creation
of new Datalogs. If the amount of free space drops below this level while recording, the
Datalogger will automatically stop recording.
•
!
Figure 3.72 Root Path Full Warning
•
!
The Datalog rate does not change the actual rate of acquisition, but it does
effectively change the rate by grouping samples into average values. Since the fastest the system
!xxiii
Emprise Corporation
5/8/2014
can go is 20 Hz, the operator can select 10 Hz, which would be the average of every two
samples, or the operator could select 5 Hz, which is the average of every 4 samples and so on…
The Datalog rates that the operator can select are as follows:
o 20 Hz
o 10 Hz
o 5 Hz
o 1 Hz
o 0.5 Hz
o 0.25 Hz
o 0.125 Hz
o 0.0625 Hz
o 0.03125 Hz
!
Figure 3.73 Hard Drive Storage Utility
The Volume Information section contains displays for the total amount of hard drive space and the
current amount of free space available on the selected Volume Path. The Free Space Alarm Levels
section contains displays for the warning level and the alarm level. Displays in both sections provide the
units of Gigabytes (Gb) and Megabytes (Mb) for convenience. Indicator lights display the current free
space condition:
Bright means true.
!
!
!xxiv
Emprise Corporation
5/8/2014
Dull means false.
!
!
To save the settings press Save and Exit. To leave the values unchanged press Cancel. A pop-up dialog
will confirm the settings prior to saving; see Figure 3.74. Press Save to accept the changes and return to
the Configuration Menu; or press Cancel to disallow the changes and return the Hard Drive Storage
Utility.
!
Figure 3.74 Hard Drive Storage Settings Confirmation Dialog
3.8.DATALOG PLAYER
The Datalog Player file selection dialog automatically starts in the current Root Path. Select a file and
press load.
!xxv
Emprise Corporation
5/8/2014
!
Figure 3.81 Datalog File Selection Dialog
The majority of the controls are identical to those of the Interpolation Display. See Section 3.4 for
detailed descriptions. The Playback Position slider contains two pointers, a red one, and a green one.
The green one designates the beginning of the playback, and the red one designates the current playback
position in percent of file.
!
Figure 3.82 Playback Position Slider
!xxvi
Emprise Corporation
5/8/2014
!
Figure 3.83 Data Log Viewer, Channel View
Left-Click and hold to drag a pointer to a new position on the slider. Note that moving the red slider
changes the surface plot, a handy feature when visualizing the data.
The Start Position shows the timestamp of the first sample in the playback as designated by the green
pointer. This will be the first sample in the data subset exported by the Excellize Data function.
!
Figure 3.84 Start Position
The Current Position shows the timestamp of the data point designated by the red pointer. The surface
plot shows this data point. This will be the last sample in the data subset exported by Excellize Data
function.
!
Figure 3.85 Current Position
The Datalog Rate is the rate at which the data went to disk. The Playback Rate is user selectable so that
the playback can be faster or slower than the original.
!xxvii
Emprise Corporation
5/8/2014
There are six buttons in the playback control box:
•
!
!
This button skips to the beginning of the data designated by the green pointer.
•
!
!
This button rewinds to the beginning of the data designated by the green
pointer.
•
!
!
This button stops the playback. This is the rest condition for all other tasks.
For example, when the playback completes, the Play button stops and the Stop Button indicates
that the playback has stopped.
•
!
•
!
!
This button fast-forwards through the data to the end of the file.
•
!
!
This button skips to the end of the Datalog file.
!
This button plays the Datalog file at 20 Hz. This could make the playback
appear to be faster than reality if the Datalog file was recorded at a lower rate.
The Excellize Data function creates a file containing only the data contained between the green and red
pointers. There are some limitations to an Excel spreadsheet and accordingly, the Excellize Data
function warns the operator to prevent data loss. An Excel spreadsheet can contain no more than
1,048,576 rows of data total. Any data in excess of that will be truncated and lost. If the operator
selects a Data View of more than 1,048,576 rows for export, the Excellizer will warn and prevent the
operation, see Figure 3.86.
!
Figure 3.86 Excellize Spreadsheet Warning
When the Excellize Data function creates a spreadsheet, the naming convention is as follows:
<Root Path>:\Anemometer Test Data\<MMDDYY>_<HHmm>_<(n)>.xls
Where “MM” is the month, “DD” is the day of the month, “YY” is the Year, “HH” is the hour in 24hour time, and “mm” is minutes. If the operator creates more than one file in less than a minute, a the
software adds a number in parentheses to the end. The first file in a series does not contain a number,
!xxviii
Emprise Corporation
5/8/2014
but subsequent files include (2), (3), etc… The file name uses the current date and time; it is
independent of the date and time of the original data log file. A message will alert the operator after
saving the file, see Figure 3.87.
!
Figure 3.87 Spreadsheet Saved Message
Press EXIT to return to the Main Menu.
!xxix
Emprise Corporation
5/8/2014
3.9.CONFIGURE TCP/IP ADDRESSING
Initially, the default network settings of the sbRIO in the Anemometer Signal Conditioner are:
Anemometer Signal Conditioner
IP Address: 172.16.1.254
Subnet Mask: 255.255.0.0
!
Figure 3.91 Configure TCP/IP Addressing Menu
The host PC must have a static IP address on the same subnet. The subnet mask must be 255.255.0.0.
The host PC’s IP address must be in the following range:
!xxx
Emprise Corporation
5/8/2014
172.16.XXX.YYY
Where “XXX” is between 0-254, and “YYY” is a value between 1- 254. After connecting for the first
time, the operator can change the addressing using this utility.
The Configure TCP/IP Addressing screen contains three sections:
•
Anemometer Conditioner Current Settings: The ADADS software searches for the Anemometer
Signal Conditioner based on its MAC address. If it finds it, it reads the IP settings and displays
them in this section
o Network Settings: This radio button shows whether the Anemometer Signal Conditioner
is using a static IP address or a dynamic address. The Dynamic Host Configuration
Protocol (DHCP) is a network configuration protocol for hosts on Internet Protocol (IP)
networks.
o IP Settings:
▪ IP Address: The current IP address of the Anemometer Signal Conditioner.
▪ DNS Name: Domain Name System (DNS). This is the name of Anemometer
Signal Conditioner. Initially it is set to ADADS-sbRIO-9602.
▪ Subnet Mask: This limits the available IP addresses. The default value is
255.255.0.0.
▪ Gateway: This is a router interface connected to the local network that is used to
send packets out of the local network. Since it is not typical for the Anemometer
Signal Conditioner to communicate with host computers that are not on the same
network, the default value is 0.0.0.0.
▪ DNS Server: This is the IP address of the DNS server used by the Anemometer
Signal Conditioner when configured to use DHCP or dynamic addressing. It is
not needed for static addressing.
Target
Information:
o
▪ MAC Address: Media Access Control address. This is the unique machine
identifier for the sbRIO. This is how the ADADS software identifies and finds
the Anemometer Signal Conditioner on a network.
▪ Serial Number: This is the unique serial number of the sbRIO.
▪ System State: This is the system status of the sbRIO. There are several status
indicators, but only a few apply to this application:
• Running: The system is functioning normally.
• Disconnected: The ADADS software cannot find the Anemometer Signal
Conditioner.
• Rebooting: The Anemometer Signal Conditioner is rebooting.
• Initializing: the Anemometer Signal Conditioner is starting up.
▪ Model Name: This is the model name of the National Instruments RIO board
used in the Anemometer Signal Conditioner.
!xxxi
Emprise Corporation
5/8/2014
•
▪ Model Code: This is the model code of the RIO board used in the Anemometer
Signal Conditioner.
Anemometer Conditioner New Settings: Use these controls to change the IP settings of the
Anemometer Signal Conditioner.
o Desired Network Settings: Use this radio button to change the network addressing
system for the Anemometer Signal Conditioner. The default setting will be the same as
the current setting of the Anemometer Signal Conditioner. Select either a static IP
address or a dynamic address. The Dynamic Host Configuration Protocol (DHCP) is a
network configuration protocol for hosts on Internet Protocol (IP) networks. Selecting
DHCP will disable and gray-out the Desired IP Settings controls, since the DNS server
will automatically assign those values.
o Desired IP Settings:
▪ IP Address: This will be the new IP address of the Anemometer Signal
Conditioner.
▪ DNS Name: Domain Name System (DNS). The default name of the signal
conditioner box is ADADS-sbRIO-9602 and is unalterable. Changes to this value
will be ignored.
▪ Subnet Mask: This will be the new subnet mask for the Anemometer Signal
Conditioner.
▪ Gateway: This will be the new gateway address of the router used to send packets
out of the local network. The operator can either select a Gateway, or leave it as
0.0.0.0. When changing to DHCP, if the operator leaves this value at 0.0.0.0,
ADADS will automatically find the default Gateway for your network.
▪ DNS Server: This will be the new IP address of the DNS server used by the
Anemometer Signal Conditioner when configured to use DHCP or dynamic
addressing. It is not needed for static addressing. The operator can either select a
DNS Server, or leave it as 0.0.0.0. When changing to DHCP, if the operator
leaves this value at 0.0.0.0, ADADS will automatically find the default DNS
Server for your network.
o IP Settings After Restart: The values in this section will remain blank until the operator
presses the Apply Changes button. After a restart, this utility reads the IP settings to
confirm that they were accepted.
▪ IP Address: The new IP address of the Anemometer Signal Conditioner.
▪ DNS Name: The default name of the signal conditioner box is ADADSsbRIO-9602 and is unalterable.
▪ Subnet Mask: The new subnet mask for the Anemometer Signal Conditioner.
▪ Gateway: The new gateway address of the router used to send packets out of the
local network.
▪ DNS Server: The new IP address of the DNS server used by the Anemometer
Signal Conditioner when configured to use DHCP or dynamic addressing. When
DHCP is selected from the Desired Network Settings, this value will be assigned
automatically.
!xxxii
Emprise Corporation
5/8/2014
o Apply Changes: Press this button to apply the new IP settings. This button, the cursor,
and the EXIT button are disabled while the new settings are saved to the Anemometer
Signal Conditioner and it restarts.
o EXIT: Press this button to return to the main menu.
The section on the right contains instructions to the operator and a communications status indicator. For
more detail on the communication status, see Section 3.2.
There are some automatic safeguards built into this utility. They notify the operator when the Desired IP
settings will put the Anemometer Signal Conditioner on a different subnet or disrupt communication.
!
Figure 3.92 The Desired IP Settings And The Host Settings Are Incompatible Message
!
Figure 3.93 The Host Settings Are Incompatible Message
!xxxiii
Emprise Corporation
5/8/2014
!
Figure 3.94 The Desired IP Settings Are Incompatible Message
The communication routines are smart enough to work over a wireless network provided that the signal
conditioner box is connected to a server with a WIFI switch. Once communicaitons are established, a
laptop can wirelessly log data over the WIFI.
4. SYSTEM LEVEL SOFTWARE
Many routines run unseen by the operator. These routines work behind the scenes performing essential
tasks. Not all of these routines are worth mentioning, but a few do merit description. The following
section details the most important of the hidden routines.
4.1.DATALOG AND DATALOGGER
The Record Datalog button on any one of the displays first brings up a comment dialog before starting
the log; see Figure 4.11. The operator can either add comments or not by Left-Clicking Add Comment
or No Thanks. Once the comment box closes, the Datalog begins. The log will run until the button is
pressed again or the operator presses EXIT on the Main Menu. Once started, the data logger
automatically creates a file name based on the date and time. The Data Logger collects data at 20 Hz.
When the write-buffer contains at least 640 samples (32 seconds of data), the Datalogger writes to disk.
The Datalogger limits the file size to 10,485,760 bytes (10 Megabytes). When a data log reaches that
size, the Data Logger closes that file, opens a new one complete with header information, and continues
with the data stream. The data stream buffers during this period so nothing is lost. The operator selects
the Datalog file path in the Hard Drive Storage Utility (See Section 3.7.) The Datalog filename format
is as follows:
<Root Path>:\Anemometer Test Data\<MMDDYY>_<HHmm>.dat
Where the Root Path is the drive letter selected by the operator, “MM” is the month, “DD” is the day of
the month, “YY” is the Year, “HH” is the hour in 24-hour time, and “mm” is minutes.
!xxxiv
Emprise Corporation
5/8/2014
!
Figure 4.11 Datalog Comment Dialog
The Datalogger records the anemometer airspeed data along with a basic file header. The file header
information is as follows:
• Comments: Operator comments made at the start of the Datalog.
• Rows: Number of rows of anemometers in the array
• Columns: Number of columns of anemometers in the array
• Datalog Rate: The data rate to disk
• Anemometer #: This number corresponds to the sequential anemometer number from the
configuration menu.
• Position (Row, Column): This designates the position of each anemometer in the array.
The column header row contains the date, time, and all the serial numbers of the anemometers listed in
the order specified in the Configuration Menu; organized from anemometer 1 to the highest (up to 30),
from left to right. The air speed units are beneath the serial numbers – either ft/s or m/s. The date
adheres to the following format:
mm/dd/YYYY
Where “mm” is the month, “dd” is the day of the month, and “YYYY” is the year including the century.
The timestamp is in the following format:
HH:MM:SS.000
Where “HH” is the hour of the day in 24-hour format, “MM” is the minutes, and “SS.000” is seconds
including milliseconds.
!xxxv
Emprise Corporation
5/8/2014